8110 gatehouse road falls church, va 22042
TRANSCRIPT

8110 Gatehouse Road
Suite 400 West
Falls Church, VA 22042
March 5, 2015
Dear Investor:
Enclosed are Inova Health System’s 2014 Audited Consolidated Financial Statements
and Other Supplementary Information Relating to the IHS Obligated Group.
Management discussion and analysis is also enclosed for the years ended December 31,
2014 and 2013.
We appreciate your interest in Inova Health System. If we can provide any other
information, please let me know.
Sincerely,
Paula Sherman
Director, Financial Reporting
(703) 289-2455
Attachments

1
Inova Health System Management’s Discussion and Analysis of Results of Operations and Financial Position
As of and for the Year Ended December 31, 2014
Introduction
Inova Health System (“IHS”) is a not-for-profit health care system serving Northern Virginia, Washington, D.C. and parts of Maryland, and offers a comprehensive array of services at multiple access points. IHS includes five hospitals with over 1,700 acute care beds to provide inpatient services, and provides other outpatient health services including emergency and urgent care, senior services, home care, mental health and blood donor services. Services range from health promotion and disease prevention to the most advanced treatment services, with specialty distinction in a number of areas, including cardiology, neuroscience, orthopedics, women’s and children’s services and cancer care. IHS also owns and operates INTotal Health, a Medicaid health plan licensed in Virginia with approximately 58,000 members. IHS’ mission is to provide quality care and improve the health of the diverse communities it serves.
The following discussion and analysis provides information that IHS management believes is relevant to an assessment and understanding of IHS’ results of operations and financial position. This analysis should be read in conjunction with IHS’ financial statements for the years ended December 31, 2014 and 2013. The discussion and analysis focuses on IHS as a whole, which management believes provides a fair description and analysis, in all material respects, of the Obligated Group’s results of operations and financial condition, insofar as the Obligated Group accounted for approximately 87.9% of total operating revenues and 98.9% of unrestricted net assets of IHS as of and for the year ended December 31, 2014.
Results of Operations as of and for the Years ended December 31, 2014 and 2013
Operating Revenues. Total operating revenues for IHS for the year ended December 31, 2014 were $2.7 billion, up 6.3% over the comparable period in 2013. Net patient service revenue of $2.4 billion increased 5.8% over the comparable period in 2013 primarily due to a favorable payor mix and increased outpatient surgical volumes. The acute hospitals experienced an 8.9% increase in observation cases over 2013. While the provision for bad debts increased 18.6% compared to prior year, there was a corresponding reduction in charity deductions due in part to classification changes resulting from the EpicCare system conversion in 2013. Collectively, bad debts and charity write-offs changed slightly versus prior year. Other operating revenue includes Medicare EHR incentive payments of approximately $12.3 million and $13.3 million for the years ended December 31, 2014 and 2013, respectively.
Operating Expenses. Total operating expenses for the year ended December 31, 2014 were $2.5 billion, an increase of 3.1% over the comparable period in 2013. Salaries and benefits increased $29.6 million, or 2.6%, primarily due to higher activity levels and an increase in employee benefits related to a $10.2 million non-cash pension settlement loss resulting from the purchase of insurance annuities for certain retirees. Other operating expenses increased by $40.9 million, or 4.4%, primarily due to the outsourced dietary, anesthesia, and dialysis services,
2
ICD-10 readiness costs and IT consulting related to IHS’ first full year on Epic clinical and revenue cycle systems.
Operating Income. Operating income for IHS was $217.7 million or 8.1% of total operating revenues for the year ended December 31, 2014, as compared to $131.8 million, or 5.2% of total operating revenues, for the comparable period in 2013. The operating cash flow margin of IHS was 15.8% for 2014, as compared to 13.0% for the comparable period in 2013.
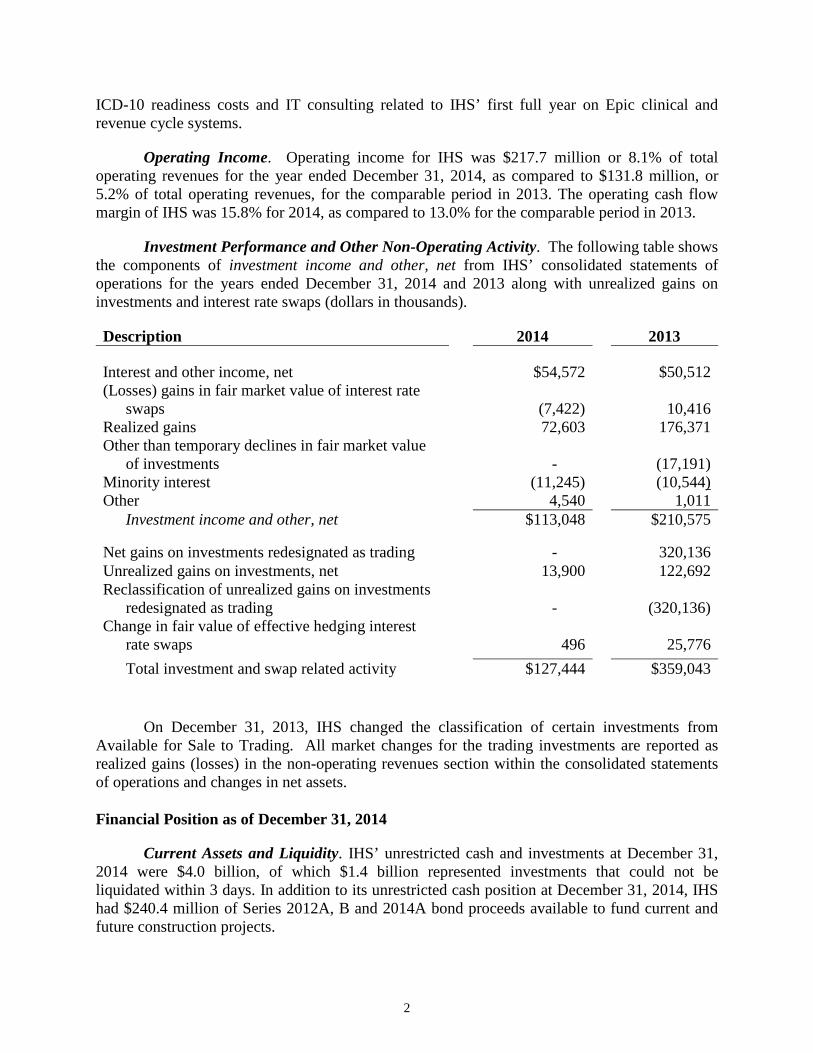
Investment Performance and Other Non-Operating Activity. The following table shows the components of investment income and other, net from IHS’ consolidated statements of operations for the years ended December 31, 2014 and 2013 along with unrealized gains on investments and interest rate swaps (dollars in thousands).
Description 2014 2013 Interest and other income, net $54,572 $50,512 (Losses) gains in fair market value of interest rate
swaps
(7,422)
10,416 Realized gains 72,603 176,371 Other than temporary declines in fair market value
of investments
-
(17,191) Minority interest (11,245) (10,544) Other 4,540 1,011
Investment income and other, net $113,048 $210,575 Net gains on investments redesignated as trading - 320,136 Unrealized gains on investments, net 13,900 122,692 Reclassification of unrealized gains on investments
redesignated as trading
-
(320,136) Change in fair value of effective hedging interest
rate swaps
496
25,776 Total investment and swap related activity $127,444
$359,043
On December 31, 2013, IHS changed the classification of certain investments from Available for Sale to Trading. All market changes for the trading investments are reported as realized gains (losses) in the non-operating revenues section within the consolidated statements of operations and changes in net assets. Financial Position as of December 31, 2014
Current Assets and Liquidity. IHS’ unrestricted cash and investments at December 31, 2014 were $4.0 billion, of which $1.4 billion represented investments that could not be liquidated within 3 days. In addition to its unrestricted cash position at December 31, 2014, IHS had $240.4 million of Series 2012A, B and 2014A bond proceeds available to fund current and future construction projects.
3
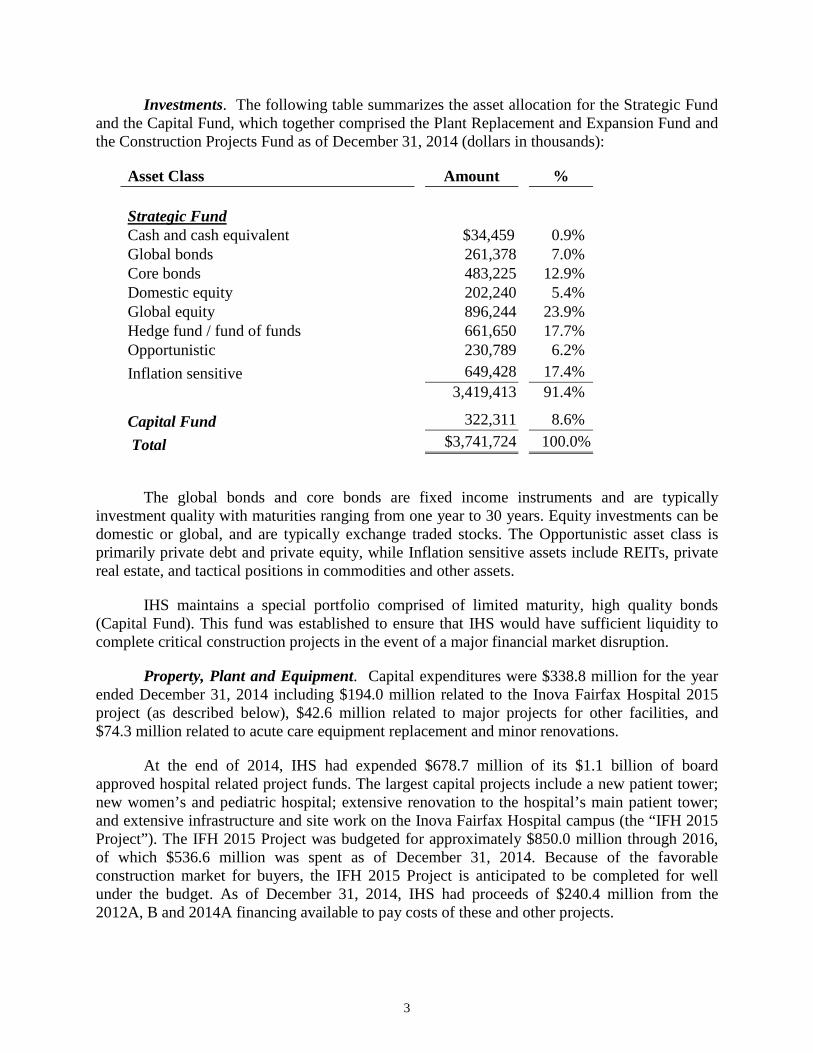
Investments. The following table summarizes the asset allocation for the Strategic Fund and the Capital Fund, which together comprised the Plant Replacement and Expansion Fund and the Construction Projects Fund as of December 31, 2014 (dollars in thousands):
Asset Class Amount % Strategic Fund Cash and cash equivalent $34,459 0.9% Global bonds 261,378 7.0% Core bonds 483,225 12.9% Domestic equity 202,240 5.4% Global equity 896,244 23.9% Hedge fund / fund of funds 661,650 17.7% Opportunistic 230,789 6.2% Inflation sensitive 649,428 17.4% 3,419,413 91.4%
Capital Fund 322,311 8.6% Total $3,741,724 100.0%
The global bonds and core bonds are fixed income instruments and are typically investment quality with maturities ranging from one year to 30 years. Equity investments can be domestic or global, and are typically exchange traded stocks. The Opportunistic asset class is primarily private debt and private equity, while Inflation sensitive assets include REITs, private real estate, and tactical positions in commodities and other assets.
IHS maintains a special portfolio comprised of limited maturity, high quality bonds (Capital Fund). This fund was established to ensure that IHS would have sufficient liquidity to complete critical construction projects in the event of a major financial market disruption.
Property, Plant and Equipment. Capital expenditures were $338.8 million for the year ended December 31, 2014 including $194.0 million related to the Inova Fairfax Hospital 2015 project (as described below), $42.6 million related to major projects for other facilities, and $74.3 million related to acute care equipment replacement and minor renovations.
At the end of 2014, IHS had expended $678.7 million of its $1.1 billion of board approved hospital related project funds. The largest capital projects include a new patient tower; new women’s and pediatric hospital; extensive renovation to the hospital’s main patient tower; and extensive infrastructure and site work on the Inova Fairfax Hospital campus (the “IFH 2015 Project”). The IFH 2015 Project was budgeted for approximately $850.0 million through 2016, of which $536.6 million was spent as of December 31, 2014. Because of the favorable construction market for buyers, the IFH 2015 Project is anticipated to be completed for well under the budget. As of December 31, 2014, IHS had proceeds of $240.4 million from the 2012A, B and 2014A financing available to pay costs of these and other projects.

4
All planned capital expenditures are regularly evaluated based upon business need, economic conditions and IHS’ financial position. IHS management currently anticipates that capital expenditures will be financed with a combination of operating cash flow, existing cash reserves, donations and tax-exempt borrowing. The actual undertaking of any construction project or equipment purchase program contemplated by IHS is dependent upon a number of factors, including receipt of appropriate Certificates of Public Need from the Virginia Department of Health and subject to changes in the methods and requirements pertaining to the delivery of necessary health care services.
Debt Structure and Liability Management. At December 31, 2014, total long-term debt outstanding was $1.6 billion, or 26.5% of capitalization.
Current portion of long-term debt $258,772 Long-term debt, less current portion 1,310,733 Total Long-Term Debt $1,569,505 Total Long-Term Debt $1,569,505 Unrestricted Net Assets 4,358,004 $5,927,509 Debt/Capitalization 26.5%
IHS maintains a taxable commercial paper (“CP”) program under which it is authorized to borrow and have outstanding from time to time up to $100.0 million of short term debt having maturity dates from one to 270 days. IHS maintains a self-liquidity program to fund the purchase of any CP that is not remarketed. As of December 31, 2014, the amount of CP outstanding was $100.0 million, which is included in notes payable and other liabilities in the current liabilities section of the balance sheet.
IHS also maintains unsecured lines of credit with two large commercial banks in a combined available principal amount of $87.5 million. There were no amounts outstanding on these credit lines as of December 31, 2014.
In 2014, IHS modified a fixed payer swap by lowering the fixed payer interest rate. As of December 31, 2014, IHS had $100.0 million notional amount of fixed payer swaps with a fair value of $(29.8) million.
On December 17, 2014, the Industrial Development Authority issued $200.0 million of Series 2014A bonds for the benefit of the IHS Obligated Group to finance approximately $200.0 million of capital projects. These series of bonds were sold at a premium of $9.0 million.
On December 18, 2014, the IHS Obligated Group converted $9.3 million of existing Series 2005C-1 variable rate bonds that were in a daily interest rate mode with a JPMorgan Chase Bank, N.A. Stand-by Bond Purchase Agreement to a weekly interest rate mode with a Letter of Credit with Northern Trust Company.

5
Employee Retirement Plans. Effective January 1, 2015, IHS will “hard freeze” the Cash Balance Plan for all employees. As a result, there will be no new participants in the Cash Balance Plan starting on that date and existing participants will no longer receive the Annual Contribution. IHS will continue to pay interest on each participant’s account balance until such account is redeemed or converted to an annuity. In lieu of making the Annual Contribution, IHS will enhance the matching benefit under its existing 401(k) plan. Effective January 1, 2015, all employees will be eligible to receive an annual matching contribution of up to 5% of eligible pay (previously was up to 3% of pay). This “hard freeze” resulted in a curtailment of the plan causing IHS to recognize all prior service credits totaling $1.5 million.
As part of its continuing efforts to de-risk retirement obligations, on October 6, 2014 IHS purchased insurance annuities totaling $92.2 million for approximately 1,200 retirees who were receiving monthly benefits. Under the terms of the annuity purchase contract effective November 2014, the insurer (Mass Mutual) is responsible for making lifetime benefit payments to the retirees covered under the contract. The economic effect of this transaction was to reduce both IHS’ Projected Benefit Obligation and Fair Value of Plan Assets of its Cash Balance Plan. IHS recognized a $10.2 million non-cash settlement loss as a result of this transaction.
Subsequent Events. On February 5, 2015, IHS entered into a ground lease agreement for 117 acres of land with an approximately 1.2 million square foot office campus across the street from its flagship hospital in Fairfax, Virginia. The 99-year ground lease provides the lessor, a large multinational corporation, with a put option to sell the property to IHS for $180.0 million during the first 5 years of the lease. Prior to the end of the put option period, future minimum payments total $41.5 million. It is IHS’ intent to use part of this site to develop a regional cancer center and to use the remaining space for medical services, research and consolidation of office space. Other Financial Information
The following are selected financial indicators for IHS as of and for the years ended
December 31, 2014 and 2013:
Financial Indicator 2014 2013 Operating Margin1 8.1% 5.2% Operating Cash Flow Margin2 15.8% 13.0% Net Days in Accounts Receivable3 36.6 40.2 Days in Unrestricted Cash4 638.6 598.6 Unrestricted Cash to Debt5 2.4x 2.5x Debt Service Coverage6 8.5x 8.1x
_________________________ 1 Operating income divided by Operating Revenue 2 (Operating income plus interest expense, depreciation and amortization expense) divided by Operating Revenue 3 Net Patient Receivables divided by Three-Month Average Daily Net Patient Revenue 4 (Cash and Short-Term Investments plus Unrestricted cash reserves and Unrestricted LT Investments) divided by (Operating
Expenses less depreciation, amortization expense and loss on extinguishment of debt and termination of swaps) 5 (Cash and Short-Term investments plus Unrestricted cash reserves plus Unrestricted LT Investments) divided by (Debt-
current portion plus Debt-long-term portion) 6 Income Available for Debt Service (annualized) divided by Long-Term Debt Service Requirement

Audited Consolidated
Financial Statements and
Other Supplementary Information
Relating to the IHS Obligated Group
Fiscal Year Ended
December 31, 2014
INOVA HEALTH SYSTEM

Inova Health System
Audited Consolidated Financial Statements
and Other Supplementary Information
Relating to the IHS Obligated Group
December 31, 2014 and 2013
Audited Consolidated Financial Statements
Report of Independent Auditors……………………………………………………………………………………..1
Consolidated Balance Sheets………………………………………………………………………………………..2
Consolidated Statements of Operations and Changes in Net Assets……………………………………………......3
Consolidated Statements of Cash Flows…………………………………………………………………………….4
Notes to Consolidated Financial Statements…………………………………………………………………….5-31
Other Supplementary Information
Report of Independent Auditors on Other Supplementary Information…………………………………………...32
Consolidated Balance Sheets……………………………………………………………………………………....33
Consolidated Statements of Operations…………………………………………………………………………....34
Consolidated Statement of Cash Flows…………………………………………………………………………….35

Report of Independent Auditors
The Board of Trustees Inova Health System
We have audited the accompanying consolidated financial statements of Inova Health System (IHS), which comprise the consolidated balance sheets as of December 31, 2014 and 2013, and the related consolidated statements of operations and changes in net assets, and cash flows for the years then ended, and the related notes to the consolidated financial statements.
Management’s Responsibility for the Financial Statements
Management is responsible for the preparation and fair presentation of these financial statements in conformity with U.S. generally accepted accounting principles; this includes the design, implementation and maintenance of internal control relevant to the preparation and fair presentation of financial statements that are free of material misstatement, whether due to fraud or error.
Auditor’s Responsibility
Our responsibility is to express an opinion on these financial statements based on our audits. We conducted our audits in accordance with auditing standards generally accepted in the United States. Those standards require that we plan and perform the audit to obtain reasonable assurance about whether the financial statements are free of material misstatement.
An audit involves performing procedures to obtain audit evidence about the amounts and disclosures in the financial statements. The procedures selected depend on the auditor’s judgment, including the assessment of the risks of material misstatement of the financial statements, whether due to fraud or error. In making those risk assessments, the auditor considers internal control relevant to the entity’s preparation and fair presentation of the financial statements in order to design audit procedures that are appropriate in the circumstances, but not for the purpose of expressing an opinion on the effectiveness of the entity’s internal control. Accordingly, we express no such opinion. An audit also includes evaluating the appropriateness of accounting policies used and the reasonableness of significant accounting estimates made by management, as well as evaluating the overall presentation of the financial statements.
We believe that the audit evidence we have obtained is sufficient and appropriate to provide a basis for our audit opinion.
Opinion
In our opinion, the financial statements referred to above present fairly, in all material respects, the consolidated financial position of Inova Health System at December 31, 2014 and 2013, and the consolidated results of its operations and changes in net assets, and its cash flows for the years then ended in conformity with U.S. generally accepted accounting principles.
ey March 5, 2015
A member firm of Ernst & Young Global Limited
Ernst & Young LLP 621 East Pratt Street Baltimore, MD 21202
Tel: +1 410 539 7940 Fax: +1 410 783 3832 ey.com

2014 2013
ASSETS
Current Assets
Cash and cash equivalents 282,288$ 252,679$
Assets whose use is limited
By board for plant replacement and expansion 227,550 228,870
Patient accounts receivable (less allowance for doubtful
accounts: 2014 - $99,342 ; 2013 - $102,090) 248,404 250,250
Third-party settlements 11,331 1,946
Other current assets 107,225 92,306
Total Current Assets 876,798 826,051
Property, Equipment and Leasehold Interests, net (Note 5) 1,658,178 1,498,627
Assets Whose Use Is Limited (Notes 6, 7, 13)
Held by bond trustee 249,371 251,602
By board for plant replacement and expansion 3,419,413 3,085,713
By board for construction projects 322,311 317,784
By donor 89,921 87,813
For professional liability 93,281 84,078
For health plan liability 12,071 12,037
4,186,368 3,839,027
Less amounts required to meet current obligations (227,550) (228,870)
Total Assets Whose Use Is Limited 3,958,818 3,610,157
Other Assets
Investments in and receivables from affiliates (Note 8) 48,084 37,493
Goodwill and other intangible assets (Note 9) 75,436 72,844
Prepaid pension asset (Note 12) 30,740 54,534
Other long-term assets 30,181 24,731
Total Other Assets 184,441 189,602
TOTAL ASSETS 6,678,235$ 6,124,437$
LIABILITIES AND NET ASSETS
Current Liabilities
Accounts payable and accrued expenses 204,083$ 194,731$
Accrued salaries, wages and benefits 123,306 105,951
Third-party settlements 55,025 52,528
Notes payable and other liabilities 146,360 142,924
Current portion of long-term debt (Note 10) 258,772 258,359
Total Current Liabilities 787,546 754,493
Non-current Liabilities
Long-term debt, less current portion (Note 10) 1,310,733 1,127,972
Interest rate swap liability (Note 11) 29,767 22,841
Estimated professional and other insurance liabilities (Note 13) 30,567 32,775
Other non-current obligations 54,127 55,232
Total Non-current Liabilities 1,425,194 1,238,820
Net Assets
Unrestricted 4,358,004 4,019,846
Temporarily restricted 68,503 72,029
Permanently restricted 38,988 39,249
Total Net Assets 4,465,495 4,131,124
TOTAL LIABILITIES AND NET ASSETS 6,678,235$ 6,124,437$
See notes to consolidated financial statements.
Inova Health SystemConsolidated Balance SheetsDecember 31, 2014 and 2013
(In thousands)
2

2014 2013
Operating Revenues
Net patient service revenue 2,540,215$ 2,385,675$
Provision for bad debts (140,582) (118,518)
Net Patient Service Revenue less Provision for Bad Debts 2,399,633 2,267,157
Premium revenue 183,236 181,489
Other operating revenue 116,134 90,773
Total Operating Revenues 2,699,003 2,539,419
Operating Expenses
Salaries and benefits 1,169,741 1,140,158
Other operating expenses 964,674 923,749
Medical claims 138,661 138,212
Depreciation and amortization 181,255 170,931
Interest 26,965 27,293
Loss on extinguishment of debt and swap termination - 7,319
Total Operating Expenses 2,481,296 2,407,662
Operating Income 217,707 131,757
Non-Operating Revenues (Expenses)
Investment income and other, net (including other-than-temporary
impairment losses: 2014 - $0 ; 2013 - $17,191) 113,048 210,575
Net gains on investments redesignated as trading - 320,136
Excess of Revenues Over Expenses 330,755 662,468
Unrealized gains on investments, net 13,900 122,692
Reclassification of unrealized gains on investments redesignated as trading - (320,136)
Change in fair value of effective hedging interest rate swaps 496 25,776
Net assets released from restriction for purchase of equipment and land rights 6,311 17
Change in plan assets and benefit obligations of pension (11,284) 25,567
Other (2,020) 1,492
Increase in Unrestricted Net Assets 338,158 517,876
Temporarily Restricted Net Assets
Gifts and bequests 11,088 23,192
Restricted investment income 1,295 961
Unrealized (loss) gain on investments, net (29) 88
Net assets released from restriction (15,741) (7,116)
Other (139) (762)
(Decrease) Increase in Temporarily Restricted Net Assets (3,526) 16,363
Permanently Restricted Net Assets
Gifts and bequests 109 120
Restricted investment (loss) income (497) 2,080
Unrealized (loss) gain on investments, net (24) 1,169
Other 151 656
(Decrease) Increase in Permanently Restricted Net Assets (261) 4,025
Increase in Net Assets 334,371 538,264
Net Assets, Beginning of Year 4,131,124 3,592,860
NET ASSETS, END OF YEAR 4,465,495$ 4,131,124$
See notes to consolidated financial statements.
Inova Health System
Consolidated Statements of Operations and Changes in Net Assets
For the Years Ended December 31, 2014 and 2013(In thousands)
3

2014 2013
Operating Activities
Change in net assets 334,371$ 538,264$
Adjustments to reconcile change in net assets to net cash provided
by operating activities
Depreciation and amortization 181,255 170,931
Change in plan assets and benefit obligations of pension 11,284 (25,567)
Net realized and unrealized (gains) losses on investments (87,776) 16,466
Net (gains) on investments redesignated as trading - (320,136)
Other-than-temporary declines in fair market value of investments - 17,191
Change in fair value of interest rate swaps 11,064 (24,655)
Equity investment losses 3,625 3,994
(Increase) decrease in accounts receivable and third-party settlements, net (7,539) 24,836
(Increase) in other current assets (15,029) (3,184)
Increase in accounts payable and other current liabilities 15,285 24,760
Increase (decrease) in accrued salaries, wages and benefits 17,298 (14,281)
Decrease (increase) in pension asset 12,510 (6,279)
Increase (decrease) in post employment health care benefits 1,346 (1,607)
(Decrease) in estimated professional liability and other deferred
liability items (4,568) (2,743)
Restricted contributions and other (11,995) (26,353)
Other (8,395) (1,870)
Net Cash Provided by Operating Activities 452,736 369,767
Investing Activities
Capital expenditures (338,797) (365,037)
Investments in and advances to joint ventures and affiliates (15,858) (31,122)
Purchases of marketable securities (2,159,862) (2,101,457)
Proceeds from sale of marketable securities 1,900,297 2,180,934
Other 1,696 4,736
Net Cash Used in Investing Activities (612,524) (311,946)
Financing Activities
Principal payments on long-term debt (30,817) (30,340)
Proceeds from issuance of long-term debt 216,703 79,530
Refunding of long-term debt - (79,530)
Debt issuance costs (1,634) -
Swap termination and modification payments (4,138) (14,894)
Restricted contributions and other 11,995 26,353
Other (2,712) (2,933)
Net Cash Provided by (Used in) Financing Activities 189,397 (21,814)
Net Increase in Cash and Cash Equivalents 29,609 36,007
Cash and cash equivalents at beginning of year 252,679 216,672
CASH AND CASH EQUIVALENTS AT END OF YEAR 282,288$ 252,679$
See notes to consolidated financial statements.
4
Inova Health System
Consolidated Statements of Cash Flows
For the Years Ended December 31, 2014 and 2013(In thousands)

Inova Health System
Notes To Consolidated Financial Statements
December 31, 2014 and 2013
5
1. Nature of Operations
Organization: Inova Health System (“IHS”) is an integrated, not-for-profit health care delivery system that owns, operates
and manages clinical, educational, research and hospital facilities located in Northern Virginia, serving Northern Virginia, the
Washington, D.C. metropolitan area and contiguous counties in Virginia and Maryland. The principal line of business for
IHS is the delivery of acute care hospital services at five hospitals located in Northern Virginia. IHS also operates an
integrated network of health services including ambulatory care, home health care, senior services, assisted living and other
health related services. IHS formed a Population Health division in 2013 that operates INTotal Health, a Medicaid health
maintenance organization (“HMO”), a Program of All-Inclusive Care for the Elderly and other related businesses.
2. Summary of Significant Accounting Policies
Basis of Presentation: The financial statements have been prepared in accordance with accounting principles generally
accepted in the United States (“GAAP”). The preparation of financial statements requires management to make estimates and
assumptions that affect the amounts reported in the financial statements and accompanying notes. Actual results could differ
from those estimates.
Principles of Consolidation: The IHS consolidated financial statements include the accounts of the Inova Health System
Foundation (the “Foundation”); Inova Health Care Services (“IHCS”); Loudoun Hospital Center (“LHC”); Inova Holdings,
Inc. (“IHI”); and their majority-owned subsidiaries and controlled affiliates. All material intercompany accounts and
transactions have been eliminated in consolidation.
The Foundation is a tax-exempt, non-stock corporation, which controls its affiliated corporations through its authority to
appoint the governing boards of the tax-exempt, non-stock affiliates or its stock ownership. The Foundation also supports and
maintains the programs, services, and facilities of IHS’ health care delivery system in part through the solicitation, receipt,
administration, and distribution of philanthropic gifts on behalf of its tax-exempt affiliates. INTotal Health, LLC (“INTotal”),
a wholly-owned subsidiary of the Foundation, is a Medicaid HMO licensed and authorized to do business in Virginia.
IHCS is a tax-exempt, non-stock corporation that serves the health care needs of the community by establishing, maintaining
and operating hospital and health care facilities, programs, and other shared and integrated health care delivery arrangements.
IHCS operates the following facilities, among others: Inova Fairfax Hospital (“Fairfax”); Inova Mount Vernon Hospital
(“Mount Vernon”), Inova Fair Oaks Hospital (“Fair Oaks”) and Inova Alexandria Hospital (“Alexandria”). IHCS also
provides and manages the clinical, non-hospital facilities and programs whose services include senior services, assisted living
facilities, addiction treatment services for adults and adolescents, outpatient rehabilitation services, urgent care and other
outpatient health care services.
LHC is a tax-exempt, non-stock corporation that serves the health care needs of Loudoun County, Virginia, and surrounding
areas. In addition to Inova Loudoun Hospital (“Loudoun”), LHC operates Loudoun Nursing and Rehabilitation Center,
Loudoun Healthcare Foundation and other health care and related facilities.
IHI is a wholly owned subsidiary of the Foundation and is the parent holding company for various taxable entities within IHS
including Technical Dynamics Inc., a biomedical equipment maintenance and engineering company. IHI and its subsidiaries
operate facilities providing a variety of health care and support services to patients and to affiliated health care providers.
Cash and Cash Equivalents: Cash equivalents include investments in highly liquid debt instruments with an original
maturity of three months or less. Cash equivalents are valued at cost, which approximates fair value.
Patient Accounts Receivable: Patient accounts receivable include charges for amounts due from all patients less allowances
for the excess of established charges over the payments to be received on behalf of patients covered by Medicare, Medicaid
and other insurers. IHS has a self-insured discount policy whereby uninsured patients receive a discount for services
rendered. The discount percentage is based on amounts generally billed for commercially insured patients for the same
services. Discounts to uninsured patients are classified as a deduction from revenue. The provision for bad debts is
recognized when providing an allowance for uncollectible accounts.
Inova Health System
Notes To Consolidated Financial Statements
December 31, 2014 and 2013
6
2. Summary of Significant Accounting Policies (continued)
All operating entities of IHS treat emergency patients regardless of their ability to pay. Non-emergency medically necessary
care is provided virtually without restriction at all IHS tax-exempt operating entities. A patient is classified as a charity
patient based upon established IHS policies that consider patient income levels and available assets. Since IHS does not
pursue collection of amounts that qualify as charity care, they are deducted from gross revenue. The provision for bad debts
includes unpaid accounts of patients who fail to provide required income and asset documentation to IHS. Guidelines used by
IHS in determining charity care may differ from guidelines used by certain state or federal agencies.
Assets Whose Use Is Limited: Assets whose use is limited include board-designated funds for the acquisition of property and
equipment, funds restricted by donors for charitable purposes, funds to cover self-insurance and medical claim liabilities, and
trustee-held assets for the retirement of long-term liabilities and the funding of certain capital projects.
Investments and Investment Income: Investments in equity securities with readily determinable fair values and all
investments in debt securities held by Northern Trust, IHS’ custodian, are designated as trading securities effective December
31, 2013. Investment income (including realized gains and losses on investments, unrealized gains and losses on trading
securities, interest, and dividends) is included in excess of revenues over expenses unless such earnings are subject to donor-
imposed restrictions. Investment income restricted by donor stipulations is reported as an increase in temporarily restricted
net assets. Unrealized gains and losses on investments classified as other-than-trading are reported as a change in unrestricted
net assets and, in accordance with relevant accounting literature, are excluded from excess of revenues over expenses.
On December 31, 2013, IHS changed the classification of certain investments from available for sale to trading. Accordingly,
cumulative unrealized gains of $320.1 million were reclassified from changes in unrestricted net assets to the non-operating
revenue section within the consolidated statements of operations and changes in net assets. The redesignation to trading had
no impact on the total change in net assets or total assets at December 31, 2013.
Fair Value Measurements: IHS evaluates assets and liabilities subject to fair value measurements on a recurring basis to
determine the appropriate level in which to classify them for each reporting period. See Note 7.
Property, Equipment and Leasehold Interests: Property and equipment acquisitions are recorded at cost. Depreciation is
provided over the estimated useful life of each class of depreciable assets, and is computed using the straight-line method.
The general range of useful lives is three to twenty-five years for land improvements, ten to forty years for buildings, fixed
equipment, and leasehold improvements, and three to twenty years for major movable equipment. Software and other IT
equipment are included in major movable equipment with useful lives of three to five years. Equipment under capital lease
obligations is amortized using the straight-line method over the shorter period of the lease term or the estimated useful life of
the equipment. Such amortization is included in depreciation and amortization in the consolidated statements of operations
and changes in net assets. Interest cost incurred on borrowed funds during the period of construction of capital assets is
capitalized as a component of the cost of acquiring those assets. Repairs and maintenance are expensed as incurred.
Gifts of long-lived assets such as land, buildings, or equipment are reported as unrestricted support unless explicit donor
stipulations specify how the donated assets must be used. Gifts of long-lived assets with explicit restrictions that specify how
the assets are to be used and gifts of cash or other assets that must be used to acquire long-lived assets are reported as
restricted support. Absent explicit donor stipulations about how long those long-lived assets must be maintained, expirations
of donor restrictions are reported when the donated or acquired long-lived assets are placed in service.
Temporarily and Permanently Restricted Net Assets: Temporarily restricted net assets are those whose use by IHS has been
limited by donors to a specific time period or purpose. Permanently restricted net assets have been restricted by donors to be
maintained by IHS in perpetuity.
Donor-restricted Gifts: Unconditional promises to give cash and other assets are reported at fair value at the date the promise
is received. Contributions received are reported as either temporarily or permanently restricted assets if they are received with
donor stipulations that limit the use of the donated assets. When a donor restriction expires, that is, when a stipulated time
restriction ends or purpose restriction is accomplished, temporarily restricted net assets are reclassified as unrestricted net
assets and reported in the accompanying consolidated statements of operations and changes in net assets as net assets released

Inova Health System
Notes To Consolidated Financial Statements
December 31, 2014 and 2013
7
2. Summary of Significant Accounting Policies (continued)
from restriction. Donor-restricted contributions whose restrictions are met within the same year as received and contributions
received where no restrictions were stipulated are reflected as unrestricted contributions reported in the accompanying
consolidated financial statements as other operating revenue.
Investments in and Receivables from Affiliates: IHS makes investments in corporations and other forms of businesses.
Investments where less than 20% of the ownership interest is held by IHS, and IHS does not exert significant influence over
the investee, are accounted for using the cost method. Investments where 20% to 50% of the voting common stock is owned
by IHS as well as certain partnership and limited liability company investments are accounted for using the equity method.
The equity method is also applied to investments in which IHS owns less than 20% of the ownership interest but can exert
significant influence over the investee. See Note 8.
Goodwill and Other Intangible Assets: Financial Accounting Standard Board (“FASB”) guidance requires business
combinations to be accounted for using the acquisition method of accounting and it also specifies the types of acquired
intangible assets that are required to be recognized and reported separately from goodwill. Goodwill represents the excess of
cost of acquisition over the fair value of net assets acquired. Other intangible assets primarily represent the values assigned to
subscriber bases, provider and hospital networks, and trademarks. Goodwill and other intangible assets with indefinite lives
are not amortized but are tested for impairment at least annually. In compliance with FASB ASC Topic 350, “Intangibles –
Goodwill and Other,” IHS performed an annual impairment assessment of its goodwill and other indefinite lived intangible
assets at the reporting level as of October 1, 2014. IHS utilizes the income approach to value the equity of the reporting unit
for determining the fair value of goodwill. IHS utilizes the excess earnings method of the income approach to value its
indefinite lived intangible assets. See Note 9.
Interest Rate Swap Agreements: IHS has entered into interest rate swap agreements to manage the net exposure to interest
rate changes related to its borrowings and to manage its overall borrowing costs. For designated cash flow hedges, the change
in its fair value is recorded as a change in other unrestricted net assets. For interest rate swaps not designated or qualifying as
hedges, changes in fair value are recorded in investment income and other, net. See Note 11.
Premium Revenue: IHS records premium revenues based on premium information from each government agency with
whom they contract to provide services. Premiums are due monthly and are recognized as revenue during the period in which
IHS is obligated to provide service to members. Premium payments from contracts with government agencies are based on
eligibility lists produced by the government agencies.
Medical Claims Liability: IHS incurs medical claims expenses on behalf of its members and establishes an accrual for
amounts billed and not paid and an estimate of costs incurred for unbilled services provided. The estimated liability for
unbilled services is based principally on historical payment patterns using actuarial techniques. Changes in assumptions for
medical costs caused by changes in actual experience could cause these estimates to change in the near term. Such changes
are reflected in current operations. Medical claims liability is recorded in notes payable and other liabilities in the
accompanying consolidated balance sheets.
Meaningful Use of Certified Electronic Health Record (“EHR”) Technology Incentive Payments: The Health Information
Technology for Economic and Clinical Health (“HITECH”) Act established incentive payments under the Medicare and
Medicaid programs for certain healthcare providers that use certified EHR technology. The Medicare and Medicaid EHR
programs provide financial incentives for the “meaningful use” (“MU”) of certified EHR technology to improve patient care.
To receive an EHR incentive payment, providers have to show that they are “meaningfully using” their EHRs by meeting
thresholds for a number of objectives established by the Centers for Medicare & Medicaid Services (“CMS”). Providers must
attest to CMS that applicable meaningful use criteria have been met. Compliance with meaningful use criteria is subject to
audit by the federal government or its designee. Incentive payments are subject to retrospective adjustments in a future period
as the payments are calculated using the Medicare cost report data that is subject to audit. Financial penalties will become
effective in 2015 for failure to meet these objectives.
IHS elected the grant accounting method for recognition of revenue from EHR incentive payments. Grant revenue is
recognized when there is reasonable assurance that the grant will be received and that the organization will comply with the

Inova Health System
Notes To Consolidated Financial Statements
December 31, 2014 and 2013
8
2. Summary of Significant Accounting Policies (continued)
conditions attached to the grant. Once reasonable assurance is obtained the revenue can be recognized ratably across the
compliance period. The IHS hospitals recognized $12.3 million and $13.3 million in Stage One MU revenue for the years
ended December 31, 2014 and 2013 respectively. MU revenue is recorded as other operating revenue in the accompanying
consolidated statements of operations and changes in net assets. At December 31, 2014, Management did not believe
adequate reliable information was available to make a determination of reasonable assurance that the hospitals would be able
to successfully demonstrate compliance with the conditions for Stage Two reporting. Therefore IHS did not record an accrual
as of December 31, 2014 for estimated EHR incentive payments under the Act’s Stage Two reporting period.
Income Taxes: The Foundation, IHCS, and LHC, are not-for-profit corporations and have been determined to be exempt
from Federal income tax under the provisions of section 501(c)(3) of the Internal Revenue Code. IHI and its subsidiaries are
taxable organizations. Deferred income taxes are provided for all significant timing differences between revenues and
expenses reported for financial statement and for tax purposes. Management annually reviews its tax positions and has
determined that there are no material uncertain tax positions that require recognition in the consolidated financial statements.
Effective on the acquisition date, INTotal was converted to a single member LLC and expected to be treated as a disregarded
entity for federal income tax purposes. Therefore, it would take on the exemption of and be reported under the Foundation.
Following the acquisition, it was determined that since INTotal is an insurance entity it is considered a per se corporation and
therefore requires its own exemption and filings. INTotal received its exemption in 2014 retroactive to November 30, 2012.
Risk Factors: IHS’ ability to maintain and/or increase future revenues could be adversely affected by: (i) the growth of
managed care organizations promoting alternative methods for health care delivery or payment of services, such as
discounted fee for service networks and capitated fee arrangements; (ii) increased competition from other hospital facilities
and integrated health care delivery systems in IHS’ service areas, including health maintenance organizations (“HMOs”) and
other entities providing health care services to the population which IHS presently serves; (iii) new statutory, legal or
regulatory requirements, or structural, operational or payment changes to the health care industry, resulting from the
enactment and implementation of the Patient Protection and Affordable Care Act and other similar health care reform
measures; (iv) proposed and/or future changes in the laws, rules, regulations and policies relating to the definition, activities,
and/or taxation of non-profit tax-exempt entities; (v) future legislation, regulation or other actions by federal, state and local
governments and their agencies which may impose requirements or continue the trend toward more restrictive limitations on
reimbursement for health care services; (vi) future legislation or adverse trends affecting the costs related to professional
liability coverage; (vii) the future of Virginia’s Certificate of Need program, where future deregulation could result in the
entrance of new competitors, or future additional regulation may eliminate IHS’ ability to expand new services; (viii) changes
in general and local economic conditions which could influence patients’ ability to pay for services or the adequacy of
patients’ health insurance coverage; (ix) a potential shortage of qualified nurses and other skilled health care professionals in
the local employment market; (x) the future renewal of IHS’ Medicaid HMO contracts that renew annually which drive the
majority of IHS’ premium revenue; and (xi) changes in general and local economic conditions which could cause volatility in
capital and debt markets and may impose limitations to timely access to debt markets.
Reclassification: Certain prior year balances have been reclassified to be consistent with the current year presentation.
Subsequent Events: IHS has evaluated subsequent events for recognition and disclosure through March 5, 2015, the date the
financial statements were available for issuance.
Recent Accounting Pronouncements: In May 2014 the FASB issued ASU 2014-9, “Revenue from Contracts with
Customers”. ASU 2014-9 provides for a single comprehensive principles-based standard for the recognition of revenue
across all industries through the application of a five-step model. The new standard changes the healthcare industry specific
guidance under ASU 2011-7, “Presentation and Disclosure of Patient Service Revenue, Provision for Bad Debts, and the
Allowance for Doubtful Accounts for Certain Health Care Entities”. ASU 2014-9 is effective for annual periods beginning
after December 15, 2016, with early adoption not permitted. Management is currently evaluating the effects the adoption of
ASU 2014-9 will have on IHS’ consolidated financial statements and disclosures.

Inova Health System
Notes To Consolidated Financial Statements
December 31, 2014 and 2013
9
3. Net Patient Service Revenue
Net patient service revenue is reported at estimated net realizable amounts from patients, third-party payers and others for
services rendered. IHS recognizes patient service revenue associated with services provided to patients who have third-party
payer coverage on the basis of contractual rates for the services rendered. For uninsured patients who do not qualify for
charity care, IHS recognizes revenue on the basis of discounted (or negotiated) rates for services rendered as provided by
policy. On the basis of historical experience, a portion of IHS’ uninsured patients will be unable or unwilling to pay for the
services provided. Thus, IHS records a provision for bad debts related to uninsured patients in the period the services are
provided. Patient service revenue, net of contractual allowances and discounts and after the provision for bad debts, is
recognized from these major payer sources for the years ended December 31, 2014 and 2013 (in thousands) as follows:
2014 2013
Gross Patient Revenue $5,104,139 $4,840,431
Deductions:
Medicare and Medicaid allowances (1,247,087) (1,226,952)
Other discounts and allowances (1,120,674) (995,462)
Charity care (196,163) (232,342)
Net Patient Service Revenue 2,540,215 2,385,675
2,366,520 Less: Provision for Bad Debts (140,582) (118,518)
Total $2,399,633 $2,267,157
Significant portions of IHS’ services are provided under agreements with the respective patients’ health insurance carriers.
The following summarizes the sources of gross revenue for acute care hospital services for the years ended December 31,
2014 and 2013:
2014 2013
Managed care and commercial 52.2% 51.0%
Medicare 30.7 30.9
Medicaid 9.1 9.8
8.4 Uninsured 8.0 8.3
Total 100.0% 100.0%
100.0%
IHS agreements with third-party payers provide for payments to IHS at amounts different from its established rates. A
summary of the payment arrangements with major third-party payers follows:
Managed Care and Commercial Payers: Under managed care and commercial insurance plans, IHS is typically
reimbursed for services provided under various contractual arrangements on a discounted fee, per diem or case rate
basis. Patients covered by these types of contractual arrangements are obligated to pay IHS any copayments or
deductible amounts required pursuant to the provisions of their managed care plans.
Medicare: Inpatient acute (operating and capital), non-acute (psych, skilled nursing, rehab, and home health) and
outpatient services provided to Medicare beneficiaries are paid at prospectively determined rates. These rates vary
according to a patient classification system that is based on clinical, diagnostic and other factors. Ultimately,
Medicare reimbursement also takes other factors into consideration such as medical education costs,
disproportionate share payments, transplant costs and bad debts which are reimbursed at tentative rates with final
settlement determined after submission and audit of the annual cost reports. IHS’ classification of patients under the
Medicare program and the appropriateness of their admission may be subject to independent review by a peer
review organization.

Inova Health System
Notes To Consolidated Financial Statements
December 31, 2014 and 2013
10
3. Net Patient Service Revenue (continued)
Medicaid: The Medicaid program is administered by the Department of Medical Assistance Services (“DMAS”) of
the Commonwealth of Virginia, pursuant to federal and state laws and regulations. DMAS receives funding for
program expenditures from both the federal government and the Commonwealth of Virginia. Federal and state laws
or regulations may affect limits on Medicaid payment. For inpatient Medicaid and other state programs, IHCS and
LHC are reimbursed on an all payer-diagnostic related groups based prospective payment system. Outpatient
reimbursement for Medicaid patients is paid on a percentage of allowable costs.
Patient accounts receivable are reduced by an allowance for doubtful accounts. In evaluating the collectability of accounts
receivable, IHS analyzes its past history and identifies trends for each of its major payer sources of revenue to estimate the
appropriate allowance for doubtful accounts and provision for bad debts. Management regularly reviews data about these
major payer sources of revenue in evaluating the sufficiency of the allowance for doubtful accounts. For receivables
associated with services provided to patients who have third-party coverage, IHS analyzes contractually due amounts and
provides an allowance for doubtful accounts and a provision for bad debts, if necessary. For receivables associated with self-
pay patients (which includes both patients without insurance and patients with deductible and copayment balances due for
which third-party coverage exists for part of the bill), IHS records a provision for bad debts in the period of service on the
basis of its past experience. The difference between the standard rates (or discounted rates if negotiated) and the amounts
actually collected after all reasonable collection efforts have been exhausted is charged off against the allowance for doubtful
accounts.
Beginning in late 2012 and over the course of 2013, IHS converted to a new, fully integrated electronic medical record
system known as EpicCare. With the system-wide implementation of EpicCare, all scheduling, registration, billing and
clinical data are in one centralized database available to clinicians and business users at every location of care throughout
IHS.
Net patient service revenue also includes estimated retroactive adjustments resulting from future audits, reviews and
investigations. Retroactive adjustments are considered in recognition of revenue on an estimated basis in the period the
related services are rendered and such amounts are adjusted in future periods as adjustments are made known or as years are
no longer subject to such audits, reviews and investigations. Retroactive adjustments in excess of amounts previously
estimated did not have a material effect on net patient service revenue for 2014, but did have some effect for 2013 as IHS
experienced increased retrospective review activity by both governmental and non-governmental payers. Laws and
regulations governing the Medicare and Medicaid programs are complex and subject to interpretation. As a result, there is a
reasonable possibility that recorded estimates will change by a material amount in the near term.
IHS’ last change to its charity care and uninsured discount policy was effective October 1, 2013 and resulted in an increase to
the self pay discount percentage.
4. Charity Care and Other Community Benefits
IHS provides healthcare services to patients who meet certain criteria under its charity care policy without charge (or at
amounts less than the established rates). Since IHS does not pursue collection of amounts that qualify as charity care, such
amounts are not reported as net patient service revenue. The amounts reported as charity care represent the cost of rendering
such services based on the cost to charge ratio for each hospital. Various government programs provide for the indigent,
including Medicaid recipients. These programs provide a percentage of reimbursement for qualifying patients; however,
payment is typically below the cost of those services.
In addition to charity and uncompensated care, IHS provides benefits to the broader community. These services include
health screenings and other health-related services, training health professionals, education and prevention services, family
support programs, direct donations, costs of performing medical research and costs associated with providing free clinics and
community services.

Inova Health System
Notes To Consolidated Financial Statements
December 31, 2014 and 2013
11
4. Charity Care and Other Community Benefits (continued)
IHS’ estimated costs of providing services to the poor and broader community for the years ended December 31, 2014 and
2013 are as follows (in thousands):
2014 2013
Charity care $88,835 $105,282
Unpaid cost of state programs to financially disadvantaged persons 63,729 70,537
Community health programs 19,101 25,148
Medical education and research 22,465 30,633
Total community benefits, at cost $194,130 $231,600
5. Property, Equipment and Leasehold Interests
The components of property, equipment and leasehold interests, at cost, and the related accumulated depreciation were as
follows at December 31, 2014 and 2013 (in thousands):
2014 2013
Land and land improvements $168,684 $168,049
Buildings, fixed equipment and leasehold improvements 1,796,953 1,688,142
Major movable equipment 1,169,805 1,146,431
3,135,442 3,002,622
Less: Accumulated depreciation and amortization 1,887,948 1,763,351
1,247,494 1,239,271
Construction-in-progress 410,684 259,356
Total $1,658,178 $1,498,627
6. Investments
On December 31, 2013, IHS changed the designation of certain investments to trading from available for sale and those
investments now designated as trading are excluded from the tables below. IHS’ investments consisted of trading securities
totaling $2,147,919 and $2,016,847 (in thousands), alternative investments totaling $1,564,382 and $1,277,435 (in
thousands), and the investments held as available for sale securities totaling $474,067 and $544,745 (in thousands) as of
December 31, 2014 and 2013, respectively. Net open trades related to trading securities were $2.3 million for 2014 and $(1.6)
million for 2013.
Details of investments held as available for sale securities in assets whose use is limited as of December 31, 2014 and 2013
are as follows (in thousands):
2014 2013
Cost Fair Value Cost Fair Value
Cash and cash equivalents $408,283 $408,102 $372,588 $372,803
U.S. government and agency 42,915 40,710 149,523 146,956 securities
Corporate and other bonds 766 680 1,459 1,579
Equity securities - domestic 25 19 19 14
Mutual fund
- Equity 16,517 20,475 13,585 17,061
- Fixed income and other 4,133 4,081 6,289 6,332
Total $472,639 $474,067 $543,463 $544,745

Inova Health System
Notes To Consolidated Financial Statements
December 31, 2014 and 2013
12
6. Investments (continued)
IHS records investment values on a trade-date basis. Amounts for sales and purchases of securities unsettled as of the balance
sheet date are included net in the fair value amounts disclosed above in the appropriate asset class. There were no open trades
as of December 31, 2014. Open sales totaled $0.2 million and open purchases totaled $0.2 million as of December 31, 2013.
Investments are carried at estimated fair value. Realized gains and losses from sales of investments are reflected in income
for the period in which they occur. The average cost of the investment sold is used to determine the realized gain or loss.
Interest and dividend income is reported net of investment-related expenses of $13.2 million in 2014 and $11.6 million in
2013.
Investment returns for the years ended December 31, 2014 and 2013 are summarized as follows (in thousands):
2014 2013
Interest and dividend income $54,135 $50,204
Net realized gains 101,759 179,720
Unrealized losses related to trading securities (27,920) -
Gain on investments redesignated as trading - 320,136
Other-than-temporary declines in fair value of investments - (17,191)
Net unrealized gains (losses) 13,847 (196,187)
Total $141,821 $336,682
Over the past several years, the investment market has experienced significant volatility. Management continually reviews its
investment portfolio and evaluates whether declines in the fair value of securities should be considered other-than-temporary.
All investment holdings managed by third-party investment managers with fair value less than cost were considered other-
than-temporarily impaired. These holdings were among the investments that IHS redesignated as trading securities on
December 31, 2013. IHS has the intent and ability to hold investments in certain alternative investment vehicles whose fair
values may be less than cost, and these securities are evaluated to determine whether declines in the fair value of securities
should be considered other-than-temporary. During the years ended December 31, 2014 and 2013, IHS recognized a loss for
other-than-temporary declines in the fair market value of investments of $0 and approximately $17.2 million, respectively.
7. Fair Value Measurements
Fair value is the price that would be received to sell an asset or paid to transfer a liability, or the exit price, in an orderly
transaction between market participants at the measurement date. ASC Topic 820, “Fair Value Measurement,” establishes a
fair value hierarchy that prioritizes the inputs to valuation techniques used to measure fair value. The hierarchy distinguishes
between market participant assumptions based on independent sources (observable inputs classified within Levels 1 and 2)
2014 2013
Included in investment income and other, net
- Income from investments, net $126,912 $140,862
- Income from equity method investments, net 28,184 68,830
Unrealized losses related to trading securities (27,920) -
Gain on investments redesignated as trading - 320,136
Increase (decrease) in unrestricted net assets 13,900 (197,444)
Increase in temporarily restricted net assets 1,266 1,049
(Decrease) increase in permanently restricted net assets (521) 3,249
Total $141,821 $336,682

Inova Health System
Notes To Consolidated Financial Statements
December 31, 2014 and 2013
13
7. Fair Value Measurements (continued)
and the reporting entity’s own notions about market participant assumptions (unobservable inputs classified within Level 3).
Transfers into and out of all levels of the fair value hierarchy are reflected at end-of-period fair value.
The fair value levels are as follows:
Level 1inputs utilize unadjusted quoted prices in active markets for identical assets or liabilities that IHS has the
ability to access at the measurement date.
Level 2 inputs are other observable inputs for the assets or liabilities, either directly or indirectly. These may include
quoted prices for similar assets and liabilities in active markets, interest rates, foreign exchange rates and yield
curves that are observable at commonly quoted intervals.
Level 3 inputs are unobservable inputs for the assets or liabilities, which are typically based on an entity’s own
assumptions, as there is little, if any, related market activity.
Fair value level assignment for assets and liabilities is based on the lowest level input that is significant to the fair value
measurement in its entirety. IHS’ assessment of the significance of a particular input to the fair value measurement in its
entirety requires judgment, and considers factors specific to the assets and liabilities.
The following tables present IHS’ assets and liabilities measured at fair value on a recurring basis as of December 31, 2014
and 2013, respectively (in thousands). Certain assets such as open purchases and sales do not have fair values classified
within a level in the valuation hierarchy. Alternative investments which are over 3% of the fund’s value and whose
ownership interest is considered to be more than minor are accounted for under the equity method of accounting. As a result,
these are excluded from fair value tables below.
December 31,
2014 Level 1 Level 2 Level 3
Assets: Cash and cash equivalents $499,539 $499,539 $ - $ -
U.S. government and agency securities 243,354 - 243,354 -
-
- Corporate and other bonds
- Asset-backed securities 194,146 - 194,146 -
- - Corporate and other bonds 305,456 - 305,456 -
- - Other government securities 32,959 - 32,959 -
Equity securities
- - Domestic 496,645 496,645 - -
- - International 360,694 360,694 - -
Mutual fund -
- Equity 292,334 292,334 - -
- Fixed Income and other 194,573 194,573 - -
Alternative investments
- Hedge fund 60,797 - 50,702 10,095
- Private equity 22,187 - - 22,187
- Private debt 30,665 - - 30,665
00,000
- - Private real estate 241,240 - 228,312 12,928
Total assets $2,974,589 $1,843,785 $1,054,929 $75,875
Liabilities: Interest rate swap liabilities $(29,767) $ - $(29,767) $ -
Total liabilities $(29,767) $ - $(29,767) $ -
Inova Health System
Notes To Consolidated Financial Statements
December 31, 2014 and 2013
14
7. Fair Value Measurements (continued)
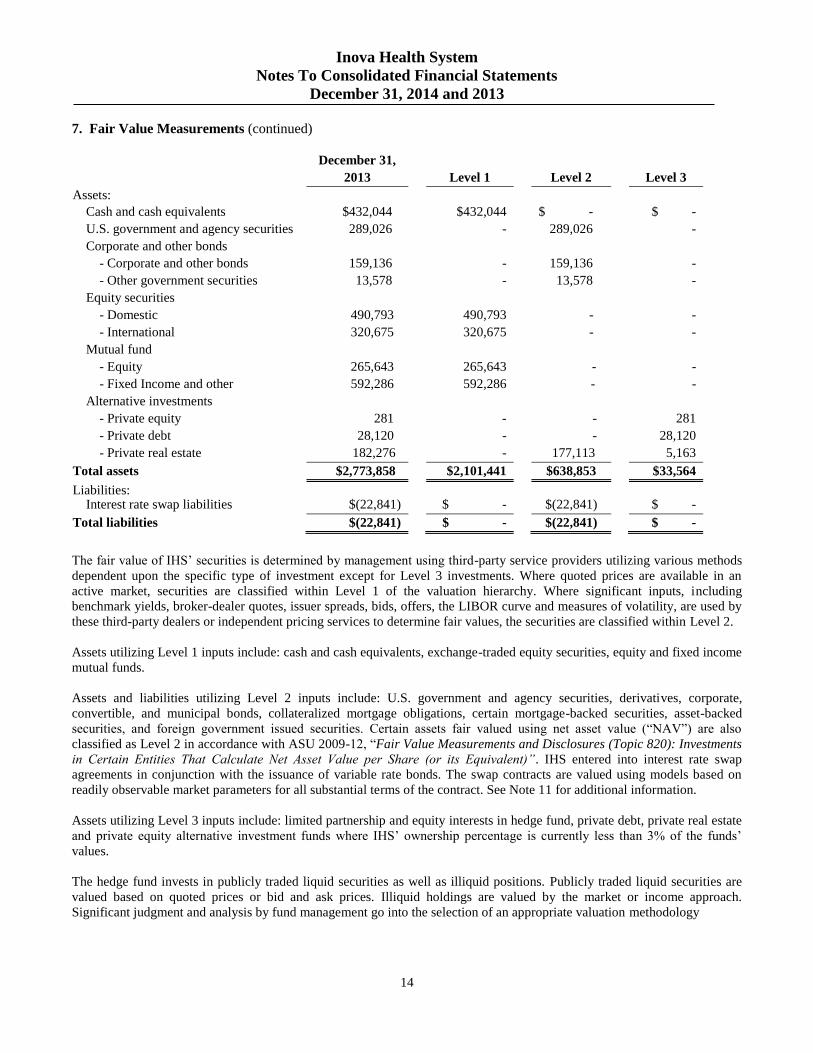
The fair value of IHS’ securities is determined by management using third-party service providers utilizing various methods
dependent upon the specific type of investment except for Level 3 investments. Where quoted prices are available in an
active market, securities are classified within Level 1 of the valuation hierarchy. Where significant inputs, including
benchmark yields, broker-dealer quotes, issuer spreads, bids, offers, the LIBOR curve and measures of volatility, are used by
these third-party dealers or independent pricing services to determine fair values, the securities are classified within Level 2.
Assets utilizing Level 1 inputs include: cash and cash equivalents, exchange-traded equity securities, equity and fixed income
mutual funds.
Assets and liabilities utilizing Level 2 inputs include: U.S. government and agency securities, derivatives, corporate,
convertible, and municipal bonds, collateralized mortgage obligations, certain mortgage-backed securities, asset-backed
securities, and foreign government issued securities. Certain assets fair valued using net asset value (“NAV”) are also
classified as Level 2 in accordance with ASU 2009-12, “Fair Value Measurements and Disclosures (Topic 820): Investments
in Certain Entities That Calculate Net Asset Value per Share (or its Equivalent)”. IHS entered into interest rate swap
agreements in conjunction with the issuance of variable rate bonds. The swap contracts are valued using models based on
readily observable market parameters for all substantial terms of the contract. See Note 11 for additional information.
Assets utilizing Level 3 inputs include: limited partnership and equity interests in hedge fund, private debt, private real estate
and private equity alternative investment funds where IHS’ ownership percentage is currently less than 3% of the funds’
values.
The hedge fund invests in publicly traded liquid securities as well as illiquid positions. Publicly traded liquid securities are
valued based on quoted prices or bid and ask prices. Illiquid holdings are valued by the market or income approach.
Significant judgment and analysis by fund management go into the selection of an appropriate valuation methodology
December 31,
2013 Level 1 Level 2 Level 3
Assets:
Cash and cash equivalents $432,044 $432,044 $ - $ -
U.S. government and agency securities 289,026 - 289,026 -
- Corporate and other bonds
- Corporate and other bonds 159,136 - 159,136 -
- Other government securities 13,578 - 13,578 -
Equity securities
- Domestic 490,793 490,793 - -
- International 320,675 320,675 - -
Mutual fund
- Equity 265,643 265,643 - -
- Fixed Income and other 592,286 592,286 - -
Alternative investments
- Private equity 281 - - 281
- Private debt 28,120 - - 28,120
- Private real estate 182,276 - 177,113 5,163
Total assets $2,773,858 $2,101,441 $638,853 $33,564
Liabilities: Interest rate swap liabilities $(22,841) $ - $(22,841) $ -
Total liabilities $(22,841) $ - $(22,841) $ -

Inova Health System
Notes To Consolidated Financial Statements
December 31, 2014 and 2013
15
7. Fair Value Measurements (continued)
and the assumptions used to generate these models. NAV is used as a practical expedient in determining the fair value of
IHS’ interest in the fund.
Private debt funds invest in distressed debt and other value oriented investments. Valuation of the funds’ exchange-traded
holdings is based on quoted prices while that of the over-the-counter securities is based on last reported bid and ask prices.
Illiquid holdings in the funds are priced by broker quotations, the market approach, discounted cash flow or recent transaction
price.
Private real estate fund invests in real estate, real estate related and other financial instruments through a variety of
investment vehicles domestically and abroad. Valuation of the fund’s exchange-traded holdings is based on quoted prices
while that of over-the-counter securities is based on last reported bid and ask prices. Illiquid holdings in the fund are priced
by one or a combination of the income capitalization and sales comparison approaches.
One of the private equity funds predominantly invests in large U.S. leverage buyouts. Investments are valued at their market
prices if market quotations are readily available. The fund’s management applies consistent valuation methodologies based
on best available information in the absence of observable market prices. The valuation process may incorporate fund
management’s own assumptions and involves a significant degree of judgment. NAV is used as a practical expedient in
determining the fair value of IHS’ interest in the fund.
The other private equity fund aims to achieve a substantial total return by obtaining control or significant influence of
primarily middle-market companies. The fund’s exchange-traded holdings are valued based on quoted prices while its non-
exchange traded debt holdings are valued based on the bid and ask prices. Non-publicly traded debts are valued using
discounted cash flow calculations. Fair values of the fund’s private equity and real estate investments are determined by the
market or income approach. The valuation methodologies used by fund management involve a significant degree of
judgment.
Management uses the fund managers’ valuation reports in assessing the fair values of these investments. Management
validates the assessments based on the funds’ audited financial statements, when they become available.

Inova Health System
Notes To Consolidated Financial Statements
December 31, 2014 and 2013
16
7. Fair Value Measurements (continued)
The following table summarizes certain characteristics of the alternative investments which are valued using NAV as of
December 31, 2014 and 2013 (in thousands):
2014 2013 Investment Liquidity Remaining
Fund Level 2 Level 3 Level 2 Level 3 Strategy Restrictions Commitment
Hedge
fund
$ - $10,095 $ - $ - The fund seeks to generate a return which is as high
as is consistent with a goal of minimizing losses
during adverse financial market periods by investing
in publicly traded liquid securities such as fixed
income securities, structured products (MBS, CMBS,
CDO) equities, real estate securities and derivatives.
The strategy will also invest in illiquid positions.
Open ended fund with
2-year lockup. Semiannual
redemptions thereafter
limited to 25% of capital.
60 days notice required.
$90.0 million
Hedge
fund
50,702 - - - The fund's objective is to provide superior non-
market correlated returns primarily by investing in
emerging market and global equities.
Quarterly liquidity with
60 days notice.
$14.0 million
Private
equity
- 600 - - The fund makes investments primarily in equity,
equity-related and debt obligations of corporations,
partnerships, limited liability companies and other
similar entities that are believed to be undervalued,
offer an opportunity for growth and provide an
attractive risk/return profile.
Closed ended fund with
10 year term; 1-year
renewals with consent of
Investors Committee up to
15 years; additional 1-year
extensions by approval of
2/3 LP consent.
$14.4 million
Private
equity
- 21,587 - 281 Fund seeks to make privately negotiated equity or
equity-related investments, focusing on leveraged
buyout transactions primarily in the U.S.
Closed ended fund with
10 year term; renewal
option up to two 1-year
terms.
$51.2 million
Private
debt
- 2,595 - 352 Funds seeks substantial long-term capital
appreciation, as well as current income, by acquiring,
holding and disposing of, directly or indirectly
through one or more intermediate entities,
investments which are generally being made in
emerging market stressed, distressed and other value-
oriented investments.
Closed ended fund with
10 year term; automatic
renewal up to 15 years;
additional 1-year extensions
by approval of 2/3 consent.
$3.5 million
Private
debt
- 28,070 - 27,768 The fund seeks capital appreciation by investing
mainly in distressed debt and other value oriented
investments.
Eighteen-month investment
period for 50% of the
commitment, and a 3-year
investment period (starting
from closing) for anything
not withdrawn at the end of
the 18 months.
N/A
Private
real
estate
- 12,928 - 5,163 Fund seeks substantial long-term capital appreciation,
as well as current income, by acquiring, holding,
remediating, managing, leasing, operating,
maintaining, improving, developing, redeveloping,
renovating, financing, refinancing, transferring and
disposing of, directly or indirectly through one or
more intermediate entities, real estate, real estate
related and other financial instruments.
Closed ended fund with 10
year term; automatic
renewal up to 15 years;
additional 1-year extensions
by approval of 2/3 consent.
$3.6 million
Private
real
estate
68,450 - 60,967 - Fund invests in core and value added properties. 90 days written notice. N/A
Private
real
estate
159,862 - 116,146 - Fund invests in income producing real property,
seeking high current income and capital preservation
with a low risk, low leverage core approach. The real
estate portfolio consists of multi-family, industrial,
retail and office properties in targeted metropolitan
areas within the continental U.S.
Quarterly with 45 days
notice.
$10.0 million
$279,014 $75,875 $177,113 $33,564

Inova Health System
Notes To Consolidated Financial Statements
December 31, 2014 and 2013
17
7. Fair Value Measurements (continued)
The following table provides a reconciliation of the beginning and ending balances of items measured at fair value that used
significant unobservable inputs (Level 3) (in thousands):
Unrealized gains related to instruments still held at the reporting date are reported in unrealized gain (loss) on investments,
net under unrestricted, temporarily restricted and permanently restricted net assets in the consolidated statements of
operations and changes in net assets. In 2013, the private equity fund decreased below the 3% threshold and was transferred
into Level 3 as the equity method of accounting ceased to apply.
8. Investments in and Receivables from Affiliates
IHS makes strategic investments in corporations and other forms of businesses. IHS accounts for investments with 20% to
50% ownership under the equity method of accounting and includes IHS’ net equity interest in investments in and receivables
from affiliates in the consolidated balance sheets. Investments with less than 20% ownership are accounted for using the cost
method.
IHS invested in a joint venture with Aetna that established Innovation Health plans (“IHealth”), a licensed health plan serving
Northern Virginia. IHealth commenced operations in July 2013. IHealth provides employers and consumers access to more
affordable, coordinated and integrated health care in the region. IHS holds a 50% interest in IHealth.
Other equity investments include Pediatric Specialists of Virginia, LLC (“PSV”), a multi-specialty pediatric physician
organization in Northern Virginia established jointly with Children’s National Medical Center in 2013; Genetics & IVF
Institute (“GIVF”), a fully integrated specialized provider of infertility treatment and genetic services; Potomac Inova
Healthcare Alliance, LLC (“PIHA”), a venture with Sentara Healthcare which provides diagnostic and treatment options for
patients with cancer; and Industrial Health, LLC, a venture with IRS Virginia, LLC to offer specifically designed
rehabilitation services to achieve worker’s compensation case resolution. As of December 31, 2014, IHS holds 50%, 33%,
50%, and 50% ownership in these investments, respectively.
Hedge
Fund
Private
Equity
Private
Real
Estate
Private
Debt
Total
Level 3
Investments
Balance at January 1, 2013 $ -
$ - $ - $24,239 $24,239
Unrealized gains (losses) relating to
instruments still held at the reporting
date
-
(411) 102 3,536 3,227
Purchases
-
692 - 345 1,037
Transfers into Level 3
-
- 5,061 - 5,061
Balance at December 31, 2013
$ - $281
$5,163
$28,120
$33,564
Unrealized gains (losses) relating to
instruments still held at the reporting
date
20 (1,785) 2,365 355 955
Purchases
10,075
23,746 5,400 2,340 41,561
Settlements
-
(55) -
(150) (205)
Balance at December 31, 2014
$10,095
$22,187 $12,928 $30,665 $75,875

Inova Health System
Notes To Consolidated Financial Statements
December 31, 2014 and 2013
18
8. Investments in and Receivables from Affiliates (continued)
IHS’ ownership in significant nonconsolidated entities and the amounts included in IHS’ consolidated financial statements as
of December 31, 2014 and 2013 are as follows (in thousands):
Carrying Value Equity In Earnings
2014 2013 2014 2013
IHealth $33,609 $23,532 $77 $(4,968)
Other investments accounted for under equity method 13,982 11,826 (3,702) 974
Investments accounted for under cost method 493 2,135 - -
Total investments in affiliates $48,084 $37,493 $(3,625) $(3,994)
The summarized financial positions and results of operations for investments accounted for under the equity method as of and
for the years ended December 31, 2014 and 2013 are as follows (in thousands) (unaudited):
2014 2013
Total Assets $165,002 $101,171
Total Liabilities 63,328 25,150
Net Assets 101,674 76,021
Total revenues, net $280,020 $73,643
Excess (Deficit) of revenue over expenses 1,940 (563)
9. Goodwill and Other Intangible Assets
The majority of goodwill and other intangible assets pertain to the December 1, 2012 acquisition of INTotal. A summary of
goodwill and other intangible assets for the years ended December 31, 2014 and 2013 is as follows (in thousands):
2014
2013
Estimated
Useful Life
(Years)
Provider Network $10,500 $10,500 20
Customer Relations 9,900 9,900 10
Medicaid License 21,300 21,300 Indefinite
Other 2,283 2,283 6
43,983 43,983
Accumulated amortization (3,525) (1,967)
Total intangibles, net 40,458 42,016
Goodwill 34,978 30,828
Total intangible assets and goodwill, net $75,436 $72,844
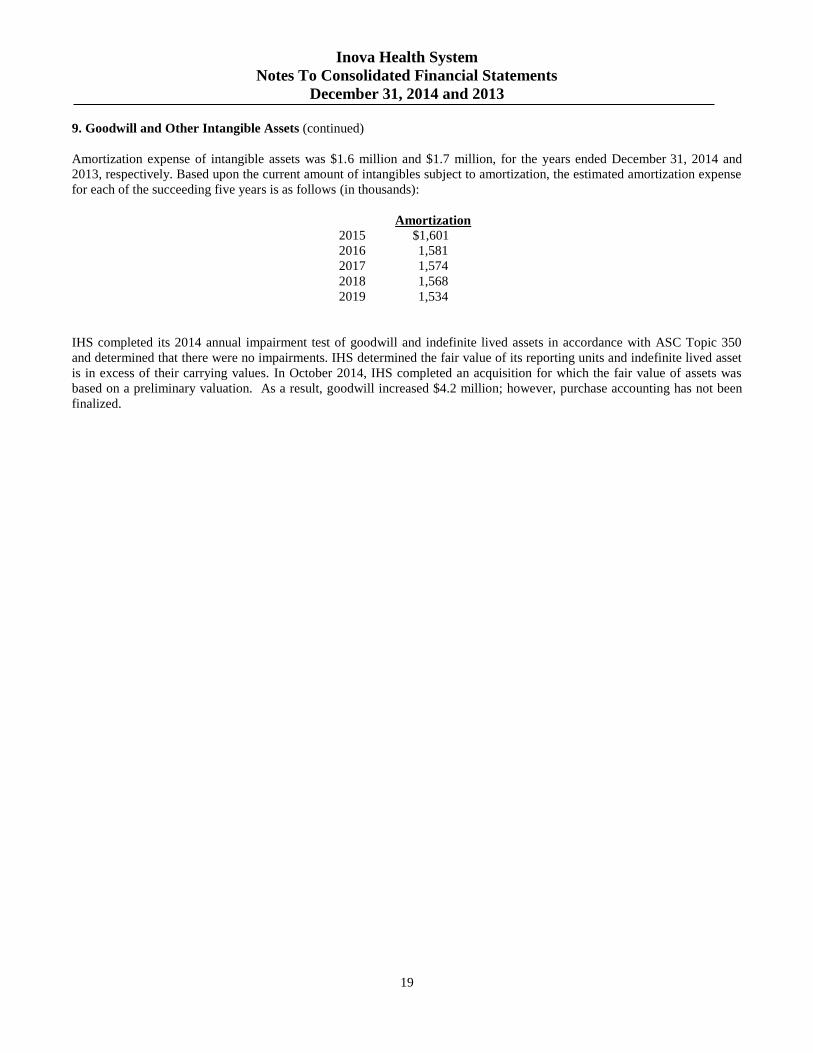
Inova Health System
Notes To Consolidated Financial Statements
December 31, 2014 and 2013
19
9. Goodwill and Other Intangible Assets (continued)
Amortization expense of intangible assets was $1.6 million and $1.7 million, for the years ended December 31, 2014 and
2013, respectively. Based upon the current amount of intangibles subject to amortization, the estimated amortization expense
for each of the succeeding five years is as follows (in thousands):
Amortization
2015 $1,601
2016 1,581
2017 1,574
2018 1,568
2019 1,534
IHS completed its 2014 annual impairment test of goodwill and indefinite lived assets in accordance with ASC Topic 350
and determined that there were no impairments. IHS determined the fair value of its reporting units and indefinite lived asset
is in excess of their carrying values. In October 2014, IHS completed an acquisition for which the fair value of assets was
based on a preliminary valuation. As a result, goodwill increased $4.2 million; however, purchase accounting has not been
finalized.

Inova Health System
Notes To Consolidated Financial Statements
December 31, 2014 and 2013
20
10. Long-Term Debt
The maturities of non-obligated IHS affiliates’ debt range from March 12, 2015 to December 24, 2021 with fixed interest rates ranging
from 2.25% to 6.26%.
2014 2013
Long-term Debt of the IHS Obligated Group:
1988A,B,C,D Variable Rate Demand Obligation Revenue Bonds; maturing 10/1/25; monthly interest at
a variable rate and maximum of 15% $11,700 $11,700
1993A Hospital Revenue Refunding Bonds; maturing 8/15/23; semi-annual interest at a fixed rate
of 2.75% to 5.25% 63,040 68,450
2000 Variable Rate Demand Health Care Revenue Bonds; maturing 1/1/30; monthly interest at a variable
rate and maximum of 12.0% 30,300 30,300
2005A Health Care Revenue Bonds; maturing 5/15/35; monthly interest at a variable rate and
maximum of 12.0% 109,730 109,730
2005C Health Care Revenue Bonds; maturing 5/15/26; monthly interest at a variable rate and
maximum of 12.0% 18,610 18,610
2009A Health Care Revenue Bonds; maturing 5/15/35; semi-annual interest at a fixed rate of 3.0% to 5.5% 260,570 264,805
2009C Health Care Revenue Bonds; maturing 5/15/25; semi-annual interest at a fixed rate of 2.0% to 5.0% 54,385 57,915
2010A-2 Health Care Revenue Bonds; maturing 5/15/39; monthly interest at a variable rate and
maximum of 12.0% 95,000 95,000
2011 Health Care Revenue Bonds; maturing 8/1/2017; monthly interest at a fixed rate of 1.8% 24,218 33,299
2012A Health Care Revenue Bonds; maturing 5/15/42; semi-annual interest at a fixed rate of 2.25% to 5.0% 281,880 285,870
2012B Health Care Revenue Bonds; maturing 5/15/22; semi-annual interest at a fixed rate of 3.0% to 5.0% 60,000 60,000
2012C Health Care Revenue Bonds; maturing 5/15/35; monthly interest at a variable rate and
maximum of 12% 142,385 143,705
2012D Health Care Revenue Bonds; maturing 5/15/29;semi-annual interest at a fixed rate of 3.0% to 5.0% 70,395 70,395
2013 Health Care Revenue Bonds; maturing 12/1/23; monthly interest at a fixed rate of 2.15% 79,530 79,530
2014A Health Care Revenue Bonds; maturing 5/15/44; semi-annual interest at a fixed rate of 2.5% to 5.0% 200,000 -
Total Long-term Debt of the IHS Obligated Group 1,501,743 1,329,309
Less: Current Portion of Long-term Debt (254,531) (255,116)
Net Original Issue Premium 44,685 38,367
Net Long-term Debt of the IHS Obligated Group $1,291,897 $1,112,560
Long-term Debt of Non-Obligated IHS Affiliates:
Total Long-term Debt of Non-Obligated IHS Affiliates 23,077 18,655
Less: Current Portion of Long-term Debt (4,241) (3,243)
Net Long-term Debt of Non-Obligated IHS Affiliates 18,836 15,412
Total Net IHS Long-term Debt $1,310,733 1,127,972$
December 31,

Inova Health System
Notes To Consolidated Financial Statements
December 31, 2014 and 2013
21
10. Long-Term Debt (continued)
The preponderance of IHS’ debt is tax-exempt revenue bonds issued under a Master Trust Indenture, which defines the
obligated subsidiaries and affiliates under the bonds. The Members of the IHS Obligated Group consist of the Foundation,
IHCS and LHC. The financial statements presented for the Obligated Group include only their accounts, which includes their
investment interest in controlled, affiliated entities, but does not include in the revenues, expenses, assets or liabilities of the
Obligated Group the revenues, expenses, assets or liabilities of any of those controlled, affiliated entities.
On December 17, 2014, the Industrial Development Authority issued $200.0 million of Series 2014A bonds for the benefit of
the IHS Obligated Group to finance approximately $200.0 million of capital projects. These series of bonds were sold at a
premium of $9.0 million.
On December 18, 2014, the IHS Obligated Group converted $9.3 million of existing Series 2005C-1 variable rate bonds that
were in a daily interest rate mode with a JPMorgan Chase Bank, N.A. Stand-by Bond Purchase Agreement (“SBPA”) to a
weekly interest rate mode with a Letter of Credit (“LOC”) with Northern Trust Company.
On December 4, 2013, the IHS Obligated Group refunded a portion of its variable rate demand obligations (“VRDOs”) under
Series 1988ABCD, 2000, 2005A and 2005C with mandatory redemptions in years 2018-2023 totaling $79.5 million. These
bonds were refunded to fixed rate serial bonds and directly purchased by TD Bank, N.A.
Losses recognized for early extinguishment of debt relate to the write-off of unamortized costs as well as the excess of
amounts transferred to escrow over the principal amount of debt outstanding (representing interest).
IHS Obligated Group debts are secured by an interest in all funds held by the Bond Trustee for purposes of debt service,
construction and equipment acquisition. Each Member of the IHS Obligated Group covenants that it will not pledge or grant
a security interest in (except as may be otherwise provided in the Master Trust Indenture) any of its property. The Master
Trust Indenture for the IHS Obligated Group requires that certain minimum financial ratios be met. IHS is in compliance with
the financial ratio requirements.
IHS estimates the December 31, 2014 and 2013 fair value of its long-term debt, based on mid-market estimate, a market bid
and/or ask, or any other price or estimate within a market spread, to be approximately $1,635 million and $1,372 million,
respectively, compared with the face value of approximately $1,570 million and $1,386 million, respectively. The fair value
of all financial instruments other than investments and debt is estimated by management to approximate or equal their
reported carrying value.
The interest rate on the variable rate bonds ranged between 0.01% and 0.20% in 2014 and 0.03% and 0.31% in 2013. The
variable rate bonds include an optional tender feature that allows the bond holder to tender the bonds on a weekly interest
payment date. The 2012C bonds, in the seven month window VRDO mode are subject to mandatory tender for purchase 210
days after tender notice. As such, both the variable and seven month window VRDO bonds are classified as current liabilities,
except for those supported by certain liquidity arrangements as described below.
IHS maintains SBPAs and LOCs to support the optional tender features on the VRDO bonds excluding the 2005A-2 bonds.
The liquidity providers are summarized as follows as of December 31, 2014 (in thousands):
Liquidity Provider Bond Series Amount Expiration Date
Branch Bank & Trust Company 2000 $30,300 12/31/2015
TD Bank 2005A-1 54,865 4/30/2016
Northern Trust 1988ABCD, 2005C-1, and 2005C-2 30,310 12/18/2017
Total $115,475
115,475

Inova Health System
Notes To Consolidated Financial Statements
December 31, 2014 and 2013
22
10. Long-Term Debt (continued)
In the event of a failed remarketing, the banks are obligated to extend credit to purchase the tendered bonds. The banks may
subsequently remarket the bonds and if the bonds are not remarketed, they are subject to mandatory redemption in quarterly
installments by IHS. Certain SBPAs and LOCs include a provision which specifies re-payment of advances made by the bank
will begin in the 13th calendar month after the bonds are acquired by the bank. This provision ensures that tendered bonds do
not become an obligation for IHS for at least one year. Accordingly, the underlying debt is not classified as current liabilities
except for principal amounts due within twelve months.
The tender feature of the 2012C Bonds and certain variable rate bonds requires IHS to maintain current assets of $227.6
million and $228.9 million as of December 31, 2014 and 2013, respectively, to provide for redemption of the tendered bonds.
These assets are included in the current portion of assets whose use is limited.
Costs incurred in the issuance or conversion of long-term debt are deferred and amortized over the life of the related debt
using the principal balance outstanding method.
Certain bonds are subject to mandatory sinking fund redemption and to earlier redemption under certain circumstances as
defined in the respective bond indenture agreements. Maturities of long-term debt for the five years succeeding December 31,
2014 are as follows (in thousands):
Interest income from the trustee held funds relating to construction projects qualifying for interest capitalization was offset
against related bond interest expense and capitalized to such projects. Amounts capitalized were approximately $1.9 million
for 2014 and approximately $3.6 million for 2013.
IHS incurred interest expense of $42.6 million and $44.0 million in 2014 and 2013, respectively, which approximates
amounts paid. Interest amounts capitalized were $15.7 million and $16.7 million in 2014 and 2013, respectively.
In 2012, a portion of the 2009A Health Care Revenue Bonds which were callable in 2014 with principal outstanding in the
amount of $75.0 million, were defeased. Proceeds from the 2012D bonds were transferred to an irrevocable escrow account
and invested in State and Local Government Securities, the principal and interest from which is sufficient to retire the bonds
on the call date. On May 15, 2014, $75.0 million was paid. At December 31, 2014, no principal was outstanding on these
defeased bonds.
In 2002, the 1993B AHSC Medical Facility Revenue Refunding Bonds, with principal outstanding in the amount of $5.6
million, were defeased. Cash was transferred to an irrevocable escrow account and invested in State and Local Government
Securities, the principal and interest from which is sufficient to retire the bonds at maturity. On July 1, 2014, $0.6 million was
paid. At December 31, 2014, no principal was outstanding on these defeased bonds.
2015 2016 2017 2018 2019 Thereafter Total
Scheduled Maturities $32,562 $43,116 $28,038 $31,712 $32,788 $1,130,394 $ 1,298,610
Bonds under
remarketing
agreement and subject to
mandatory tender 226,210 - - - - - 226,210
Total $258,772 $43,116 $28,038 $31,712 $32,788 $1,130,394 $1,524,820

Inova Health System
Notes To Consolidated Financial Statements
December 31, 2014 and 2013
23
10. Long-Term Debt (continued)
IHS issued $100.0 million of taxable commercial paper (“CP”) under a program authorized for borrowings up to $100.0
million with maturity dates from one to 270 days. Proceeds from this issuance were used for a variety of working capital
requirements. IHS maintains a self-liquidity program that would be used to repurchase any CP that is not remarketed. All
outstanding CP is included in notes payable and other liabilities in the current liabilities section of the accompanying
consolidated balance sheets. As of December 31, 2014 and 2013, the amount of CP outstanding was $100.0 million,
respectively.
IHS has two unsecured bank lines of credit available in the amount of $37.5 million and $50.0 million with a variable interest
rate of LIBOR plus 0.50%. No amount was outstanding at either December 31, 2014 or 2013. IHS had outstanding bank
letters of credit guaranteeing payment to different beneficiaries amounting to $0.5 million and $0.6 million at December 31,
2014 and 2013, respectively.
11. Derivative Financial Instruments
IHS entered into interest rate swap agreements in order to hedge the variability of cash flows related to changes in market
interest rates on underlying variable rate debt. The swap agreements effectively converted the variable rate debt to a fixed
rate for the remaining life of the outstanding debt. These swap agreements initially qualified and were designated as cash
flow hedges, and the effectiveness of the hedges was periodically evaluated. The effective portion of the change in fair value
of the swap agreements was reported on the accompanying statements as a change in unrestricted net assets, and the
ineffective portion was recorded in investment income and other, net. The effective hedges’ maturity dates ranged from years
2030 to 2035.
Beginning in 2008, previously hedging swaps no longer qualified as cash flow hedges because the underlying debt was
refinanced with debt with fixed interest rates. Beginning as of the date the hedges were discontinued, changes in the fair
value of these swap agreements are recorded in investment income and other, net, and the accumulated losses as of the date
the hedges were discontinued, but not previously recognized in income, will be amortized and recorded as investment income
and other, net, as future interest payments occur. During 2015, $0.5 million is expected to be reclassified into earnings.
In 2014, a swap agreement was recouponed to lower the fixed payor rate. In 2013, three swap agreements were terminated
resulting in a recognition of a loss of $9.1 million related to accumulated losses in fair value of the swaps in the consolidated
statements of operations and changes in net assets.
Each of the swap agreements includes a credit support provision which requires the posting of collateral with the counter-
party for liability positions in excess of specified thresholds. At December 31, 2014 and 2013, no collateral posting was
required.
The following table provides a summary of the notional value and fair value positions of derivative instruments as well as
their reporting location in the consolidated balance sheets at December 31, 2014 and 2013 (in thousands):
2014 2013
Interest rate swap
agreements:
Balance
Sheet
Location Notional Fair Value Notional Fair Value
Not designated as hedges
Non-current
Liabilities $100,000 $(29,767) $100,000 $(22,841)
Total $100,000 $(29,767) $100,000 $(22,841)

Inova Health System
Notes To Consolidated Financial Statements
December 31, 2014 and 2013
24
11. Derivative Financial Instruments (continued)
The following table presents gains and losses in the consolidated statements of operations and changes in net assets for the
years ended December 31, 2014 and 2013 (in thousands):
Interest Rate Swaps Designated as
Cash Flow Hedges
Statements of Operations and Changes
in Net Assets 2014 2013
Unrealized gains - effective
portion
Change in fair value of effective hedging
interest rate swaps
$ - $14,076
Unrealized gains - ineffective portion
Investment income and other, net
-
-
Realized losses - termination Loss on extinguishment of debt and swap
termination
- (7,090)
Interest Rate Swaps Not Designated
as Cash Flow Hedges
Unrealized (losses) gains Investment income and other, net $(6,926) $16,387
Unrealized losses - amortization of
discontinuance of cash flow hedges
Investment income and other, net (496) (534)
Realized losses - termination Investment income and other, net - (1,996)
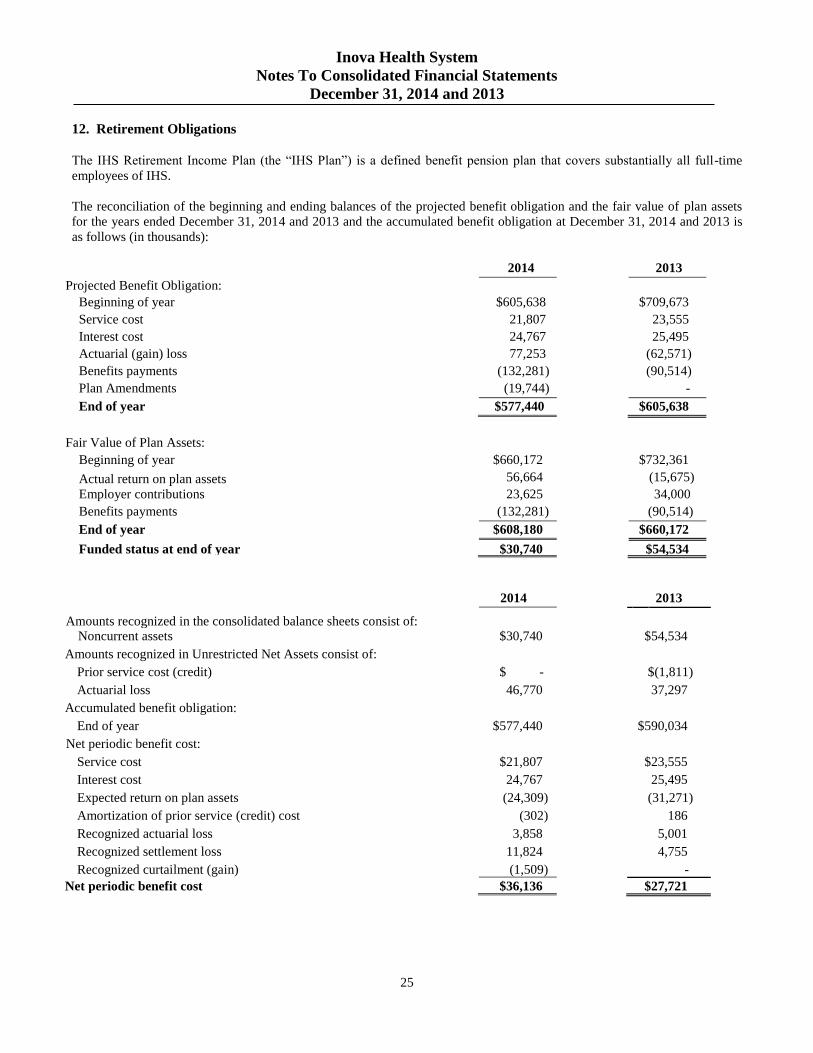
Inova Health System
Notes To Consolidated Financial Statements
December 31, 2014 and 2013
25
12. Retirement Obligations
The IHS Retirement Income Plan (the “IHS Plan”) is a defined benefit pension plan that covers substantially all full-time
employees of IHS.
The reconciliation of the beginning and ending balances of the projected benefit obligation and the fair value of plan assets
for the years ended December 31, 2014 and 2013 and the accumulated benefit obligation at December 31, 2014 and 2013 is
as follows (in thousands):
2014 2013
Projected Benefit Obligation:
Beginning of year $605,638 $709,673
Service cost 21,807 23,555
Interest cost 24,767 25,495
Actuarial (gain) loss 77,253 (62,571)
Benefits payments (132,281) (90,514)
Plan Amendments (19,744) -
End of year $577,440 $605,638
Fair Value of Plan Assets:
Beginning of year $660,172 $732,361
Actual return on plan assets 56,664 (15,675)
Employer contributions 23,625 34,000
Benefits payments (132,281) (90,514)
End of year $608,180 $660,172
Funded status at end of year $30,740
$54,534
$54,534
2014 2013
Amounts recognized in the consolidated balance sheets consist of: Noncurrent assets $30,740 $54,534
Amounts recognized in Unrestricted Net Assets consist of:
Prior service cost (credit) $ -
$(1,811)
Actuarial loss 46,770 37,297
Accumulated benefit obligation:
End of year $577,440 $590,034
Net periodic benefit cost:
Service cost $21,807 $23,555
Interest cost 24,767 25,495
Expected return on plan assets (24,309) (31,271)
Amortization of prior service (credit) cost (302) 186
Recognized actuarial loss 3,858 5,001
Recognized settlement loss 11,824 4,755
Recognized curtailment (gain) (1,509) -
Net periodic benefit cost $36,136 $27,721

Inova Health System
Notes To Consolidated Financial Statements
December 31, 2014 and 2013
26
12. Retirement Obligations (continued)
For the year ended December 31, 2014, IHS recognized a decrease in unrestricted net assets related to the change in plan
assets and benefit obligations of the pension plan of approximately $11.3 million related to the decrease in discount rate and
the adoption of the RP-2014 Generational with Scale MP-2014 mortality tables. For the year ended December 31, 2013, IHS
recognized an increase in unrestricted net assets related to the change in plan assets and benefit obligations of the pension of
approximately $25.6 million. The increase resulted mainly from an increase in the discount rate used to calculate the pension
obligation, offset by investment returns on plan assets.
As part of an overall pension risk management strategy, IHS purchased insurance annuities for all retirees receiving annuities
of less than $1,000 per month and terminated vested participants eligible for benefits based on a grandfathered June 30, 1998
accrued benefit. As a result of these transactions, IHS recognized a settlement loss of $10.2 million included in salaries and
benefits on the consolidated statements of operations and changes in net assets.
Effective January 1, 2015, the IHS Plan was amended to cease all future service benefit accruals (“hard freeze”). This action
resulted in a curtailment gain recognition of $1.5 million in 2014. As a result of the curtailment actions, all previously
unrecognized prior service credit was recognized into earnings.
The actuarial loss included in unrestricted net assets related to the pension plan which is expected to be recognized in net
periodic pension cost during the year ending December 31, 2015 is $4.1 million. No plan assets are expected to be returned to
IHS for the year ending December 31, 2014.
Additional Information 2014 2013
Assumptions:
Weighted-average assumptions used to determine
benefit obligations at December 31:
Discount rate 3.72% 4.61%
Rate of compensation increase 3.50% 3.50%
Weighted-average assumptions used to determine net
periodic benefit costs for years ended December 31:
4.61%
3.66%
Discount rate
Rate of compensation increase 3.50% 3.50%
Expected long-term return on plan assets 4.00% 4.50%
The assumed expected long-term return on plan assets is based on current and expected future asset allocations and long-term
historic and expected future investment returns and is consistent with assumptions used by plans of similar size.
The overall financial objectives for the plans’ assets are (1) to provide funds for the timely payment of the plan’s obligations
and (2) to produce an investment rate of return that improves the overall funding status of the plan consistent with the first
objective. The investment objective of the plan seeks to strike a balance between higher returns and controlling funded status
volatility. To achieve its objectives, the plan’s assets were allocated 99% to cash and fixed income investments and 1% to
alternative investment strategies based on market value as of December 31, 2014. Roughly half of the plan’s fixed income
allocation is structured to match the expected stream of future benefit payments in order to minimize funding volatility risk,
while half attempts to earn a return in excess of the interest crediting rate applied to the plan.
The fair value of IHS’ plan assets is determined by management using third-party service providers utilizing various methods
dependent upon the specific type of investment. Where quoted prices are available in an active market, securities are
classified within Level 1 of the valuation hierarchy. Where significant inputs, including benchmark yields, broker-dealer
quotes, issuer spreads, bids, offers, the LIBOR curve and measures of volatility, are used by these third-party dealers or
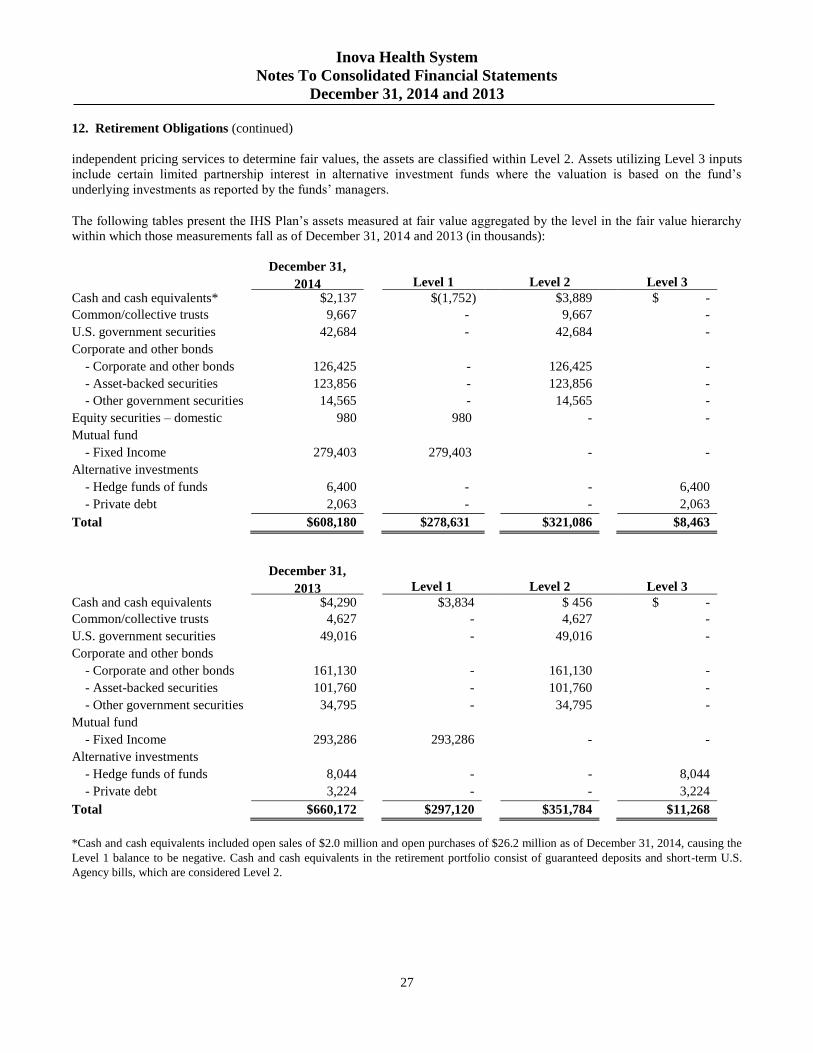
Inova Health System
Notes To Consolidated Financial Statements
December 31, 2014 and 2013
27
12. Retirement Obligations (continued)
independent pricing services to determine fair values, the assets are classified within Level 2. Assets utilizing Level 3 inputs
include certain limited partnership interest in alternative investment funds where the valuation is based on the fund’s
underlying investments as reported by the funds’ managers.
The following tables present the IHS Plan’s assets measured at fair value aggregated by the level in the fair value hierarchy
within which those measurements fall as of December 31, 2014 and 2013 (in thousands):
December 31,
2014
Level 1 Level 2 Level 3
Cash and cash equivalents* $2,137 $(1,752) $3,889 $ -
Common/collective trusts 9,667 - 9,667 -
U.S. government securities 42,684 - 42,684 -
Corporate and other bonds
- Corporate and other bonds 126,425 - 126,425 -
- Asset-backed securities 123,856 - 123,856 -
- Other government securities 14,565 - 14,565 -
Equity securities – domestic 980 980 - -
Mutual fund
- Fixed Income 279,403 279,403 - -
Alternative investments
- Hedge funds of funds 6,400 - - 6,400
- Private debt 2,063 - - 2,063
Total $608,180 $278,631 $321,086 $8,463
December 31,
2013
Level 1 Level 2 Level 3
Cash and cash equivalents $4,290 $3,834 $ 456 $ -
Common/collective trusts 4,627 - 4,627 -
U.S. government securities 49,016 - 49,016 -
Corporate and other bonds
- Corporate and other bonds 161,130 - 161,130 -
- Asset-backed securities 101,760 - 101,760 -
- Other government securities 34,795 - 34,795 -
Mutual fund
- Fixed Income 293,286 293,286 - -
Alternative investments
- Hedge funds of funds 8,044 - - 8,044
- Private debt 3,224 - - 3,224
Total $660,172 $297,120 $351,784 $11,268
*Cash and cash equivalents included open sales of $2.0 million and open purchases of $26.2 million as of December 31, 2014, causing the
Level 1 balance to be negative. Cash and cash equivalents in the retirement portfolio consist of guaranteed deposits and short-term U.S.
Agency bills, which are considered Level 2.

Inova Health System
Notes To Consolidated Financial Statements
December 31, 2014 and 2013
28
12. Retirement Obligations (continued)
The following table summarizes certain characteristics of investments which are valued using NAV (in thousands):
2014 2013
Fund Level 2 Level 3 Level 2 Level 3 Investment Strategy
Liquidity
Restrictions
Hedge fund of
funds
$ - $6,400 $ - $8,044 Hedge fund of funds which
seeks to achieve long term, non-
market directional returns with
low volatility relative to stocks
by utilizing a variety of
defensive hedge fund strategies.
Winding down;
no regular
liquidity (1)
Private debt - 2,063 - 3,224 Mezzanine finance investments.
Seek high current return and
long-term capital appreciation,
emphasizing fundamental credit
analysis with a bias toward risk
control. Focus on middle-market
transactions which are sourced
from the firm’s relationships in
the private equity community.
Winding down;
at least
quarterly
distributions at
general
partner’s
discretion; term
ends in 2015
Common/
collective trust
9,667 - 4,627 - Investment vehicle for cash
reserves. It seeks to offer a
competitive rate of return
through a portfolio of high-
grade, short term, money market
instruments. Principal
preservation is the primary
objective, with liquidity
management also emphasized to
provide for redemption of units
on any business day.
Admissions and withdrawals
may be made daily at a constant
$1.00 net asset value.
N/A
$9,667 $8,463 $4,627 $11,268
(1)This fund has suspended redemption since December 2008 due to a significant decrease in liquidity in the underlying funds in which it is
invested. In September 2009, this fund announced a restructuring plan under which the IHS Plan chose to liquidate its holdings. The fund
will wind down over the next 2-4 years. Redemptions occur periodically as excess cash is accumulated. Since the restructuring began, the
IHS Plan has received fifteen distributions totaling $19.6 million as of March 5, 2015.

Inova Health System
Notes To Consolidated Financial Statements
December 31, 2014 and 2013
29
12. Retirement Obligations (continued)
The following table provides a reconciliation of the beginning and ending balances of items measured at fair value that used
significant unobservable inputs (Level 3) (in thousands):
Hedge Fund of
Funds
Private
Debt
Total
Level 3
Investmen
ts Balance at January 1, 2013 $10,535 $3,739 $14,274
Actual return on plan assets
related to assets still held 709 410 1,119
Settlements (3,200) (925) (4,125)
Balance at December 31, 2013 $8,044 $3,224 $11,268
Actual return on plan assets
related to assets still held 531 (1,161) (630)
Settlements (2,175) - (2,175)
Balance at December 31, 2014 $6,400 $2,063 $8,463
IHS plans to contribute $5.0 million to the IHS Plan in 2015.
IHS’ expected future benefit payments, which reflect expected future service as appropriate, are as follows (in thousands):
IHS also maintains a Retiree Medical Plan (“Retiree Health Plan”) which provides benefits to certain retirees and certain
active employees who met age and length of service requirements as of September 1, 1993. The projected benefit obligation
was $11.3 million and $9.9 million as of December 31, 2014 and 2013, respectively. The current portion of the Retiree
Health Plan liability is recorded in accrued salaries, wages and benefits and the noncurrent portion is recorded in other non-
current obligations in the consolidated balance sheets.
IHS also sponsors the Inova Health System Retirement Savings Plan (“401K Plan”) that covers the same groups covered
under the IHS Plan. Employees may contribute to the 401K Plan and IHS may contribute to this plan in varying amounts.
Defined contribution benefit expense was $22.2 million and $18.7 million in 2014 and 2013, respectively.
13. Professional and Other Insurance Liabilities
IHS maintains coverage for professional and general liability through claims-made policies issued by InovaCap, LLC
(“InovaCap”). InovaCap is a wholly owned captive insurance company domiciled in Vermont. Because InovaCap is a wholly
owned subsidiary of IHS, its assets, liabilities, revenues and expenses are fully consolidated in the accompanying financial
statements.
Fiscal Year Pension
2015 $29,600
2016 29,700
2017 31,400
2018 30,800
2019 33,500
2020 to 2023 165,400
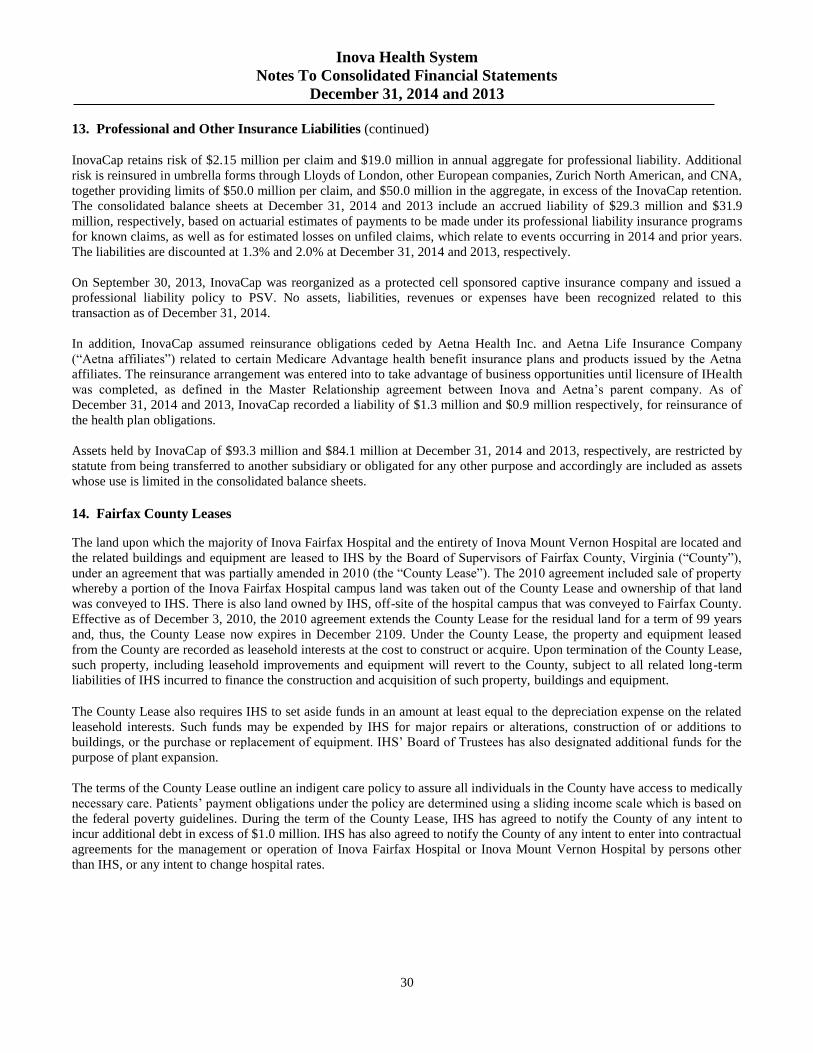
Inova Health System
Notes To Consolidated Financial Statements
December 31, 2014 and 2013
30
13. Professional and Other Insurance Liabilities (continued)
InovaCap retains risk of $2.15 million per claim and $19.0 million in annual aggregate for professional liability. Additional
risk is reinsured in umbrella forms through Lloyds of London, other European companies, Zurich North American, and CNA,
together providing limits of $50.0 million per claim, and $50.0 million in the aggregate, in excess of the InovaCap retention.
The consolidated balance sheets at December 31, 2014 and 2013 include an accrued liability of $29.3 million and $31.9
million, respectively, based on actuarial estimates of payments to be made under its professional liability insurance programs
for known claims, as well as for estimated losses on unfiled claims, which relate to events occurring in 2014 and prior years.
The liabilities are discounted at 1.3% and 2.0% at December 31, 2014 and 2013, respectively.
On September 30, 2013, InovaCap was reorganized as a protected cell sponsored captive insurance company and issued a
professional liability policy to PSV. No assets, liabilities, revenues or expenses have been recognized related to this
transaction as of December 31, 2014.
In addition, InovaCap assumed reinsurance obligations ceded by Aetna Health Inc. and Aetna Life Insurance Company
(“Aetna affiliates”) related to certain Medicare Advantage health benefit insurance plans and products issued by the Aetna
affiliates. The reinsurance arrangement was entered into to take advantage of business opportunities until licensure of IHealth
was completed, as defined in the Master Relationship agreement between Inova and Aetna’s parent company. As of
December 31, 2014 and 2013, InovaCap recorded a liability of $1.3 million and $0.9 million respectively, for reinsurance of
the health plan obligations.
Assets held by InovaCap of $93.3 million and $84.1 million at December 31, 2014 and 2013, respectively, are restricted by
statute from being transferred to another subsidiary or obligated for any other purpose and accordingly are included as assets
whose use is limited in the consolidated balance sheets.
14. Fairfax County Leases
The land upon which the majority of Inova Fairfax Hospital and the entirety of Inova Mount Vernon Hospital are located and
the related buildings and equipment are leased to IHS by the Board of Supervisors of Fairfax County, Virginia (“County”),
under an agreement that was partially amended in 2010 (the “County Lease”). The 2010 agreement included sale of property
whereby a portion of the Inova Fairfax Hospital campus land was taken out of the County Lease and ownership of that land
was conveyed to IHS. There is also land owned by IHS, off-site of the hospital campus that was conveyed to Fairfax County.
Effective as of December 3, 2010, the 2010 agreement extends the County Lease for the residual land for a term of 99 years
and, thus, the County Lease now expires in December 2109. Under the County Lease, the property and equipment leased
from the County are recorded as leasehold interests at the cost to construct or acquire. Upon termination of the County Lease,
such property, including leasehold improvements and equipment will revert to the County, subject to all related long-term
liabilities of IHS incurred to finance the construction and acquisition of such property, buildings and equipment.
The County Lease also requires IHS to set aside funds in an amount at least equal to the depreciation expense on the related
leasehold interests. Such funds may be expended by IHS for major repairs or alterations, construction of or additions to
buildings, or the purchase or replacement of equipment. IHS’ Board of Trustees has also designated additional funds for the
purpose of plant expansion.
The terms of the County Lease outline an indigent care policy to assure all individuals in the County have access to medically
necessary care. Patients’ payment obligations under the policy are determined using a sliding income scale which is based on
the federal poverty guidelines. During the term of the County Lease, IHS has agreed to notify the County of any intent to
incur additional debt in excess of $1.0 million. IHS has also agreed to notify the County of any intent to enter into contractual
agreements for the management or operation of Inova Fairfax Hospital or Inova Mount Vernon Hospital by persons other
than IHS, or any intent to change hospital rates.
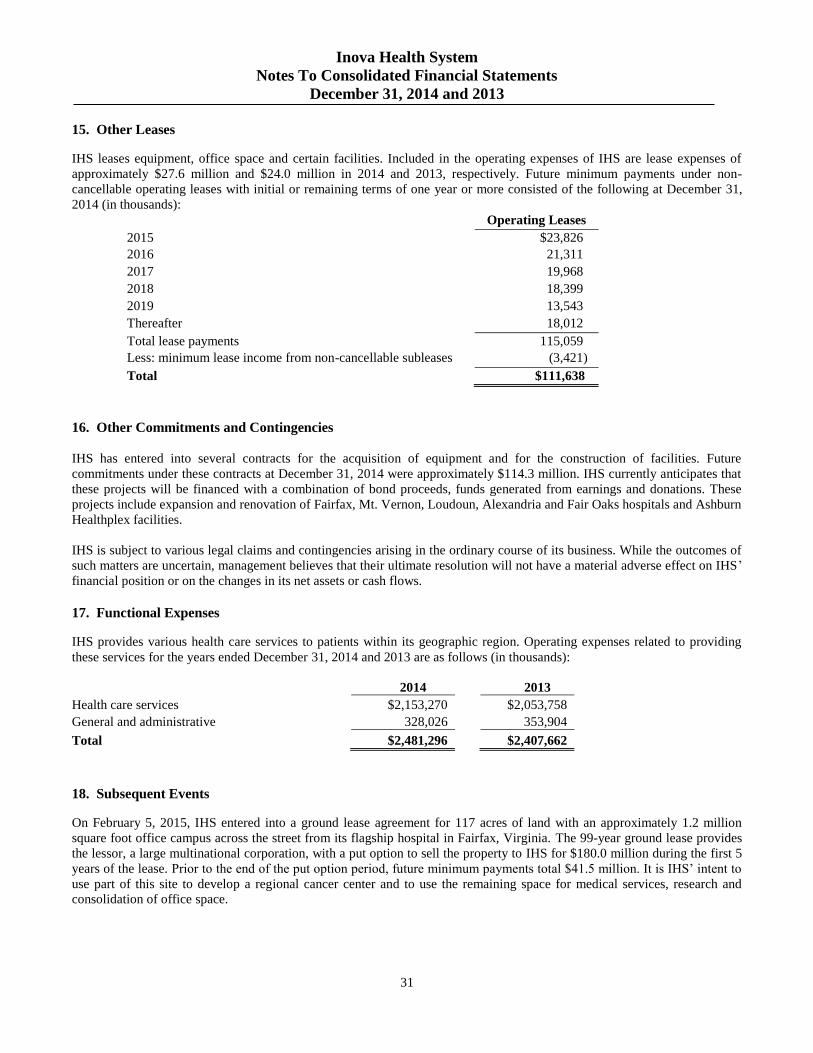
Inova Health System
Notes To Consolidated Financial Statements
December 31, 2014 and 2013
31
15. Other Leases
IHS leases equipment, office space and certain facilities. Included in the operating expenses of IHS are lease expenses of
approximately $27.6 million and $24.0 million in 2014 and 2013, respectively. Future minimum payments under non-
cancellable operating leases with initial or remaining terms of one year or more consisted of the following at December 31,
2014 (in thousands):
Operating Leases
2015 $23,826
2016 21,311
2017 19,968
2018 18,399
2019 13,543
Thereafter 18,012
Total lease payments 115,059
Less: minimum lease income from non-cancellable subleases (3,421)
Total $111,638
16. Other Commitments and Contingencies
IHS has entered into several contracts for the acquisition of equipment and for the construction of facilities. Future
commitments under these contracts at December 31, 2014 were approximately $114.3 million. IHS currently anticipates that
these projects will be financed with a combination of bond proceeds, funds generated from earnings and donations. These
projects include expansion and renovation of Fairfax, Mt. Vernon, Loudoun, Alexandria and Fair Oaks hospitals and Ashburn
Healthplex facilities.
IHS is subject to various legal claims and contingencies arising in the ordinary course of its business. While the outcomes of
such matters are uncertain, management believes that their ultimate resolution will not have a material adverse effect on IHS’
financial position or on the changes in its net assets or cash flows.
17. Functional Expenses
IHS provides various health care services to patients within its geographic region. Operating expenses related to providing
these services for the years ended December 31, 2014 and 2013 are as follows (in thousands):
2014 2013
Health care services $2,153,270 $2,053,758
General and administrative 328,026 353,904
Total $2,481,296 $2,407,662
18. Subsequent Events
On February 5, 2015, IHS entered into a ground lease agreement for 117 acres of land with an approximately 1.2 million
square foot office campus across the street from its flagship hospital in Fairfax, Virginia. The 99-year ground lease provides
the lessor, a large multinational corporation, with a put option to sell the property to IHS for $180.0 million during the first 5
years of the lease. Prior to the end of the put option period, future minimum payments total $41.5 million. It is IHS’ intent to
use part of this site to develop a regional cancer center and to use the remaining space for medical services, research and
consolidation of office space.

1503-1412320
Report of Independent Auditors on Other Supplementary Information
The Board of Trustees Inova Health System
Our audits were conducted for the purpose of forming an opinion on the consolidated financial statements as a whole. The consolidating details appearing in conjunction with the consolidated financial statements are presented for purposes of additional analysis and are not a required part of the financial statements. Such information is the responsibility of management and was derived from and relates directly to the underlying accounting and other records used to prepare the financial statements. The information has been subjected to the auditing procedures applied in the audit of the consolidated financial statements and certain additional procedures, including comparing and reconciling such information directly to the underlying accounting and other records used to prepare the financial statements or to the financial statements themselves, and other additional procedures in accordance with auditing standards generally accepted in the United States. In our opinion, the information is fairly stated, in all material respects, in relation to the financial statements as a whole.
ey March 5, 2015
A member firm of Ernst & Young Global Limited
Ernst & Young LLP 621 East Pratt Street Baltimore, MD 21202
Tel: +1 410 539 7940 Fax: +1 410 783 3832 ey.com

2014 2013
ASSETS
Current Assets
Cash and cash equivalents 243,611$ 208,750$
Assets whose use is limited
By board for plant replacement and expansion 227,550 228,870
Patient accounts receivable less allowance for doubtful accounts 237,431 239,967
Third-party settlements 11,331 1,946
Other current assets 78,066 66,190
Total Current Assets 797,989 745,723
Property, Equipment and Leasehold Interests, net
Land and land improvements 155,748 155,111
Buildings, fixed equipment and leasehold improvements 1,746,276 1,644,885
Major movable equipment 1,138,736 1,118,086
3,040,760 2,918,082
Less allowances for depreciation and amortization (1,842,066) (1,719,725)
1,198,694 1,198,357
Construction-in-progress 409,391 254,342
Total Property, Equipment and Leasehold Interests, net 1,608,085 1,452,699
Assets Whose Use Is Limited
Held by bond trustee 249,371 251,602
By board for plant replacement and expansion 3,418,405 3,085,167
By board for construction projects 322,311 317,784
By donor 73,649 74,925
4,063,736 3,729,478
Less amounts required to meet current obligations (227,550) (228,870)
Total Assets Whose Use Is Limited 3,836,186 3,500,608
Other Assets
Investments in and receivables from affiliates 154,355 149,566
Prepaid pension asset 30,740 54,534
Other long-term assets 83,327 66,526
Total Other Assets 268,422 270,626
TOTAL ASSETS 6,510,682$ 5,969,656$
LIABILITIES AND NET ASSETS
Current Liabilities
Accounts payable and accrued expenses 189,037$ 179,895$
Accrued salaries, wages and benefits 117,009 101,332
Third-party settlements 54,847 52,319
Notes payable and other liabilities 123,379 122,478
Current portion of long-term debt 254,532 255,117
Total Current Liabilities 738,804 711,141
Non-current Liabilities
Long-term debt, less current portion 1,291,896 1,112,559
Interest rate swap liability 29,767 22,841
Estimated professional and other insurance liabilities 15,491 16,556
Other non-current obligations 38,671 40,919
Total Non-current Liabilities 1,375,825 1,192,875
Net Assets
Unrestricted 4,308,040 3,975,832
Temporarily restricted 55,124 56,928
Permanently restricted 32,889 32,880
Total Net Assets 4,396,053 4,065,640
TOTAL LIABILITIES AND NET ASSETS 6,510,682$ 5,969,656$
NOTE: The Obligated Group consists of Inova Health System Foundation, Inova Health Care Services and Loudoun Hospital Center, and the financial
statements presented for the Obligated Group includes only their accounts, which includes their investment interest in controlled, affiliated
entities, but does not include in the revenues, expenses, assets or liabilities of the Obligated Group the revenues, expenses, assets or liabilities
of any of those controlled, affiliated entities.
Inova Health System Obligated Group
Consolidated Balance Sheets
December 31, 2014 and 2013
(In thousands)
33

2014 2013
Operating Revenues
Net patient service revenue 2,413,405$ 2,265,313$
Provision for bad debts (138,601) (116,600)
Net Patient Service Revenue Less Provision for Bad Debts 2,274,804 2,148,713
Other operating revenue 98,467 81,492
Total Operating Revenues 2,373,271 2,230,205
Operating Expenses
Salaries and benefits 1,091,608 1,074,150
Other operating expenses 889,886 854,171
Depreciation and amortization 173,267 162,559
Interest 25,850 26,082
Loss on extinguishment of debt and swap termination - 7,319
Total Operating Expenses 2,180,611 2,124,281
Operating Income 192,660 105,924
Non-operating Revenues (Expenses)
Investment income and other, net 131,665 235,094
Net gains on investments redesignated as trading - 305,554
Excess of Revenues Over Expenses 324,325 646,572
Unrealized gains on investments, net 13,638 117,859
Reclassification of unrealized gains on investments redesignated as trading - (305,554)
Change in fair value of effective hedging interest rate swaps 496 25,776
Change in plan assets and benefit obligations of pension (11,284) 25,567
Net assets released from restriction for purchase of equipment and land rights 4,416 17
Net asset transfer due to merger - 12,794
Other 617 (5,214)
Increase in Unrestricted Net Assets 332,208$ 517,817$
NOTE: The Obligated Group consists of Inova Health System Foundation, Inova Health Care Services and Loudoun Hospital Center, and the financial
statements presented for the Obligated Group includes only their accounts, which includes their investment interest in controlled, affiliated
entities, but does not include in the revenues, expenses, assets or liabilities of the Obligated Group the revenues, expenses, assets, or liabilities
of any of those controlled, affiliated entities.
Inova Health System Obligated Group
Consolidated Statements of Operations and Changes in Unrestricted Net Assets
For the Years Ended December 31, 2014 and 2013
(In thousands)
34
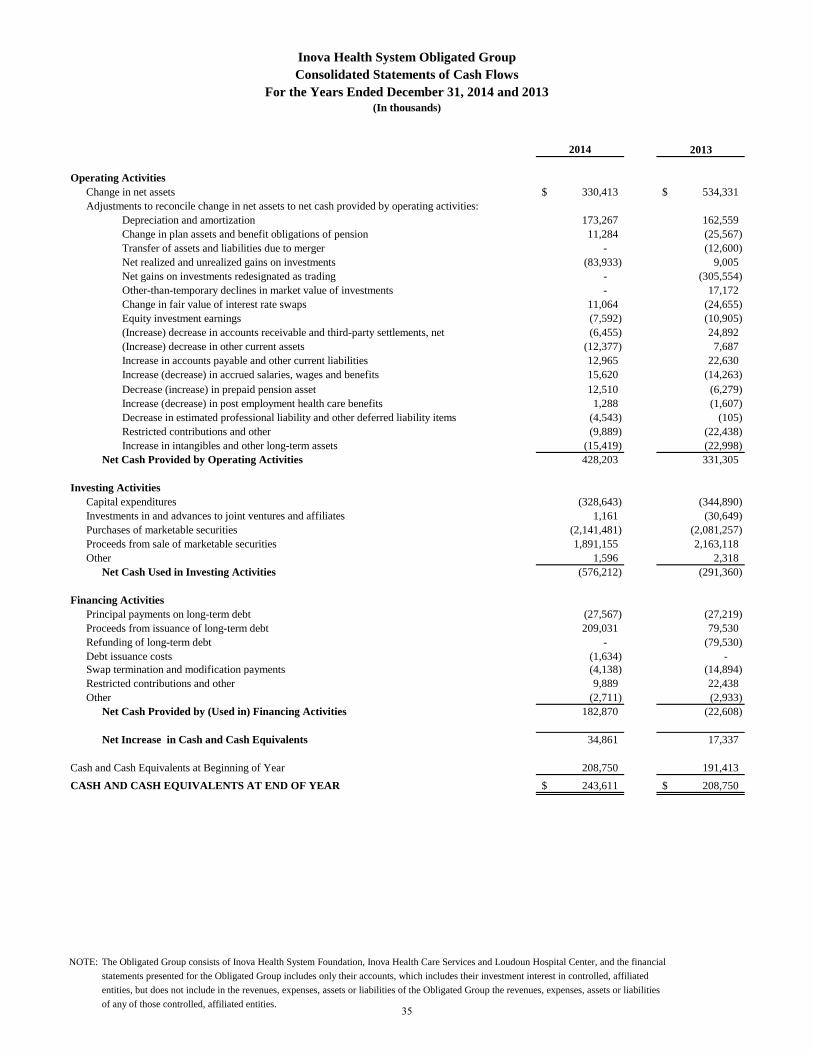
2014 2013
Operating Activities
Change in net assets 330,413$ 534,331$
Adjustments to reconcile change in net assets to net cash provided by operating activities:
Depreciation and amortization 173,267 162,559
Change in plan assets and benefit obligations of pension 11,284 (25,567)
Transfer of assets and liabilities due to merger - (12,600)
Net realized and unrealized gains on investments (83,933) 9,005
Net gains on investments redesignated as trading - (305,554)
Other-than-temporary declines in market value of investments - 17,172
Change in fair value of interest rate swaps 11,064 (24,655)
Equity investment earnings (7,592) (10,905)
(Increase) decrease in accounts receivable and third-party settlements, net (6,455) 24,892
(Increase) decrease in other current assets (12,377) 7,687
Increase in accounts payable and other current liabilities 12,965 22,630
Increase (decrease) in accrued salaries, wages and benefits 15,620 (14,263)
Decrease (increase) in prepaid pension asset 12,510 (6,279)
Increase (decrease) in post employment health care benefits 1,288 (1,607)
Decrease in estimated professional liability and other deferred liability items (4,543) (105)
Restricted contributions and other (9,889) (22,438)
Increase in intangibles and other long-term assets (15,419) (22,998)
Net Cash Provided by Operating Activities 428,203 331,305
Investing Activities
Capital expenditures (328,643) (344,890)
Investments in and advances to joint ventures and affiliates 1,161 (30,649)
Purchases of marketable securities (2,141,481) (2,081,257)
Proceeds from sale of marketable securities 1,891,155 2,163,118
Other 1,596 2,318
Net Cash Used in Investing Activities (576,212) (291,360)
Financing Activities
Principal payments on long-term debt (27,567) (27,219)
Proceeds from issuance of long-term debt 209,031 79,530
Refunding of long-term debt - (79,530)
Debt issuance costs (1,634) -
Swap termination and modification payments (4,138) (14,894)
Restricted contributions and other 9,889 22,438
Other (2,711) (2,933)
Net Cash Provided by (Used in) Financing Activities 182,870 (22,608)
Net Increase in Cash and Cash Equivalents 34,861 17,337
208,750 191,413
CASH AND CASH EQUIVALENTS AT END OF YEAR 243,611$ 208,750$
NOTE: The Obligated Group consists of Inova Health System Foundation, Inova Health Care Services and Loudoun Hospital Center, and the financial
statements presented for the Obligated Group includes only their accounts, which includes their investment interest in controlled, affiliated
entities, but does not include in the revenues, expenses, assets or liabilities of the Obligated Group the revenues, expenses, assets or liabilities
of any of those controlled, affiliated entities.
Cash and Cash Equivalents at Beginning of Year
Inova Health System Obligated Group
Consolidated Statements of Cash Flows
For the Years Ended December 31, 2014 and 2013
(In thousands)
35