808711 benchmarking the jse - deloitte€¦ · various other external risks appears to be a theme...
TRANSCRIPT

Dissecting disclosures:Benchmarking the JSE top 100


Dissecting disclosures: Benchmarking the JSE top 100 1
Introduction 2
Executive summary 3
Overview of the population 5
Principal risks 6
Board composition 10
Annual reports 12
Segmental reporting 14
Strategy and Africa 18
Key contacts 21
How Deloitte can help you 22
Content

On embarking on this research, we wanted to use disclosures in annual reports and integrated reports to understand the profile, concerns and strategic focus areas of the Johannesburg Stock Exchange’s top 100 companies.
Our second edition of “Dissecting Disclosures” analyses the Johannesburg Stock Exchange’s (“JSE”) top 100 companies. On embarking on this research, we wanted to use disclosures in annual reports and integrated reports to understand the profile, concerns and strategic focus areas of these listed companies.
External risks identified talk to the issues plaguing South Africa’s economic expansion and global competitiveness. Significant uncertainty, changes and complexities in our regulation were highlighted by several companies in several different industries. Financial services, resources and healthcare are inundated by a significant amount of change summarized on page 8. The more visible challenges of infrastructure, labour and social stability were also key concerns. The JSE top 100 has very clearly spelt out the challenges faced in operating in South Africa.
Transformation was identified by several companies as a key strategic risk. In terms of race, the JSE top 100 appears to be meeting the minimum requirements of the various transformation charters established, but there are few examples where companies exceed those targets. Boards remain dominated by white males. Gender transformation remains a challenge with only 18% being female. With increasing focus abroad and in South Africa on gender, the JSE top 100 has some way to go in attracting and retaining top female talent.
Africa is high on the agenda of several companies. Nearly half the JSE top 100 identified Africa explicitly as a strategic focus area. However, when measuring its contribution to revenues, only 1% was derived from operations in Africa outside of South Africa. In addition, Africa was only identified by three companies as a strategic risk area. The former Governor of the South African Reserve Bank, Ms Gill Marcus noted last year that South Africa’s growth could be strengthened if South Africa became more closely entwined with Africa’s growth trajectory. This can only be achieved with increased exposure to the rest of our continent and it is comforting to see the focus in strategy, but disappointing to see the actual exposure.
With South Africa’s economic growth forecast at 2% for 2014 (World Bank), the move into Africa in pursuit of higher growth, while challenged at home by regulation and various other external risks appears to be a theme in the JSE. I hope you enjoy our publication and its findings. Key contacts for this publication and its findings can be found on pages 21 to 24.
Geoff PinnockManaging Partner: Audit AfricaDeloitte & Touche
Introduction
2

Dissecting disclosures: Benchmarking the JSE top 100 3
Executive summary
Key Findings1. Principal external risks identified by companies
talk to South Africa’s challenges, including supply of infrastructure, labour and social unrest.
2. Regulatory and policy complexity and uncertainty are key concerns of several industries echoing the result of the WEF’s competitiveness survey.
3. Annual reports are 61% longer than the FTSE 100 – is it time to cut the clutter?
4. Thirty-two percent (32%) of boards are black, and 18% are female. Race and gender transformation remain challenging.
5. Forty-nine percent (49%) of companies identified Africa as a strategic focus area. Thirty-eight percent (38%) of revenues earned are from Europe, while 1% are from Africa. When will the focus on Africa translate into rands?
6. Zambia and Nigeria are the most commonly referred to countries for expansion into the continent.
The JSE top 100 is dominated by a small number of large companies, 20 companies comprise 74% of the total market capitalisation, and the top 10 companies comprise 60% of the market capitalisation. These figures include four large global companies with primary listings abroad.
Is South Africa really open for business?Using the risks that companies have disclosed in line with integrated reporting guidelines, it is clear that the challenges South Africa faces as a country are top of mind for senior executives. Regulatory uncertainty is a significant concern in several industries, including the resources sector, financial services (banking and insurance), healthcare, industrial goods and services, and food and beverages. This correlates with the World Economic Forum’s (WEF) competitiveness survey in which South Africa was ranked 120th out of 144 countries for the perceived heavy burden of legislation. Resources, financial services and healthcare companies face significant threats arising from changing legislation and political policy, and all identify these as significant threats in their top risks. The uncertainty around these changes make South Africa less competitive in a world in which many developed economies are focused on reducing red tape to improve their own competitiveness. Is our government’s commitment to reducing red tape limited to bureaucracy, or could the legislative burden also be addressed?
South Africa’s social and labour stability issues were identified by several companies who highlighted social unrest and labour unrest as key risks. In addition, several companies identified concerns around the security of the supply of electricity and water – again highlighting the structural challenges that the South African government has and the resultant burden on doing business.
Annual reports of the JSE top 100 are 61% longer than their UK counterparts on the FTSE 100. This we attribute to South Africa’s take-up of integrated reporting, ahead of the UK and the fact that several companies combine their integrated reporting with their full annual financial statements. UK regulators published a report entitled “Cutting Clutter” in an effort to provide corporates with guidance on how they can reduce the length of their reports. We believe that South African companies could benefit from similar guidance from regulators. When does an annual report provide more information than is actually useful to users? Striking a balance between meeting the requirements of reporting standards and regulatory guidelines and cutting clutter in an annual report remains a challenge to preparers of accounts.
Thirty-two percent (32%) of the JSE top 100’s directors are black, while 18% are female (13% black female). Most companies appear to be meeting the minimum requirements for senior management in their sector black empowerment charters, but there is little evidence of any going beyond those minimum requirements. Transformation was identified as a risk by only 15 companies. In the gender and race demographics of boards, white women only made up 5% of boards, making them the losers overall. Is this because they were overlooked in the past and are overlooked again now for not contributing sufficiently to BEE scorecards for senior management, or are there other challenges?
Gender demographics on boards are an increasing focus of regulators globally. The European Commission has proposed legislation to boost the presence of women on boards to 40% by 2020. In Norway, a law has been implemented requiring boards to have 40% representation by women. Large corporates in Europe are also required to disclose their female director recruitment plans. Transformation of senior management appears to have some way to go to meet national race and gender demographics.
South Africa’s social and labour stability issues were identified by several companies who highlighted social unrest and labour unrest as key risks.

Using the geographic analysis required for segmental reporting by IFRS, we were able to see where the JSE generated most of its revenue. Outside of South Africa (40% of the total revenues), Europe is the next-most important contributor with 38% of total revenues. This correlates with the South African Reserve Bank’s June 2014 quarterly bulletin, which identifies the Eurozone as South Africa’s main trading partner. Africa came up with only 1% of revenue which, given the focus by corporates and the significant growth in the region at present, was disappointing.
Forty-nine percent (49%) of the JSE top 100 identified Africa explicitly as a strategic focus area. These annual reports indicated in which countries investments for expansion purposes will be made. The usual suspects being our neighbours in Southern Africa were the most commonly identified countries, with Zambia being the most common, identified by 13 companies. Nigeria was also referenced by 13 companies. Both countries were favoured mainly in the retail and food and beverages sectors. A summary is included on page 19.
4
Africa came up with only 1% of revenue which given the focus by corporates and the significant growth in the region at present, was disappointing.

Bubble represents sector average capitalisation
Basic Resources
Personal & Household Goods
Food & Beverage
Banks
Telecommunications
Media
Insurance
Oil & Gas
Retail
Industrial Goods & Services
Real Estate
Healthcare
Other Financial Services
Investment Holding Companies
Construction & Materials
Travel & Leisure
Chemicals
Technology
We identifi ed the JSE top 100 population using market capitalisation at May 2013. We used annual reports for years to December 2013 and updated any references to market capitalisation of those companies at August 2014.The chart below summarises the same companies based on their market capitalisations at 31 August 2014 and sectors according to the JSE:
Dissecting disclosures: Benchmarking the JSE top 100 5
The JSE top 100 is dominated by four sectors – namely resources (20%), personal and household goods (20%), food and beverage (12%) and banks (9%) – which together make up 61% of the market capitalisation.
Overview of the population
JSE top 100 company capitalisation as a percentage of total
60%
16%
10%
14%
> R200bn
R200bn > 100.1bn
R50.1 to R100
R0 to R50bn
The total capitalisation of the JSE is dominated by a few companies. The JSE Top 100 (as of May 2013) includes four large global companies that make up 37% of the market capitalisation as at August 2014. A total of 10 companies make up 60% of the capitalisation.
Twenty companies make up 74%, with the remaining 80 companies making up only 26% of the market capitalisation.
Number of companies in the sector
2 500
2 000
1 500
1 000
500
2 7 12 17 22
Sect
or
tota
l cap
ital
isat
ion Z
AR
bill
ion
JSE Top 100
Less than 100
Security/Crime/Illegal ac@vity
Social/community
SA infrastructure
Economic (incl. macro economic factors)
Financial markets risks
Disasters, environmental
Transforma@on
Supplier/ Supply chain
Health & safety
Customer related
IT risks (including cyber security)
Financial performance
Opera@onal con@nuity
Strategic execu@on, compe@@on
Governance and Reputa@onal
Liquidity, capital & financial sustainability
6
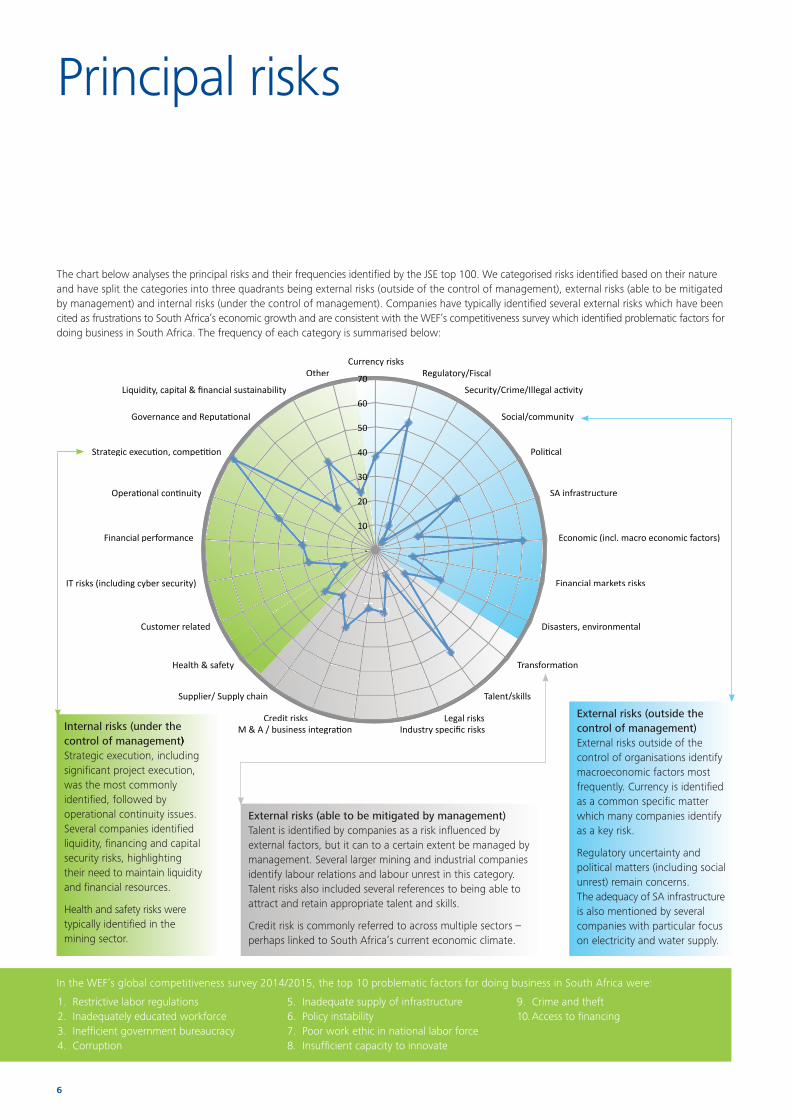
The chart below analyses the principal risks and their frequencies identifi ed by the JSE top 100. We categorised risks identifi ed based on their nature and have split the categories into three quadrants being external risks (outside of the control of management), external risks (able to be mitigated by management) and internal risks (under the control of management). Companies have typically identifi ed several external risks which have been cited as frustrations to South Africa’s economic growth and are consistent with the WEF’s competitiveness survey which identifi ed problematic factors for doing business in South Africa. The frequency of each category is summarised below:
Principal risks
Internal risks (under the control of management)Strategic execution, including signifi cant project execution, was the most commonly identifi ed, followed by operational continuity issues. Several companies identifi ed liquidity, fi nancing and capital security risks, highlighting their need to maintain liquidity and fi nancial resources.
Health and safety risks were typically identifi ed in the mining sector.
External risks (able to be mitigated by management)Talent is identifi ed by companies as a risk infl uenced by external factors, but it can to a certain extent be managed by management. Several larger mining and industrial companies identify labour relations and labour unrest in this category. Talent risks also included several references to being able to attract and retain appropriate talent and skills.
Credit risk is commonly referred to across multiple sectors – perhaps linked to South Africa’s current economic climate.
External risks (outside the control of management)External risks outside of the control of organisations identify macroeconomic factors most frequently. Currency is identifi ed as a common specifi c matter which many companies identify as a key risk.
Regulatory uncertainty and political matters (including social unrest) remain concerns. The adequacy of SA infrastructure is also mentioned by several companies with particular focus on electricity and water supply.
1. Restrictive labor regulations 2. Inadequately educated workforce 3. Ineffi cient government bureaucracy 4. Corruption
5. Inadequate supply of infrastructure 6. Policy instability 7. Poor work ethic in national labor force 8. Insuffi cient capacity to innovate
9. Crime and theft 10. Access to fi nancing
70 Currency risks
Regulatory/Fiscal
Security/Crime/Illegal ac@vity
Social/community
Poli@cal
SA infrastructure
Economic (incl. macro economic factors)
Financial markets risks
Disasters, environmental
Transforma@on
Talent/skills
Legal risks Industry specific risks M & A / business integra@on
Credit risks
Supplier/ Supply chain
Health & safety
Customer related
IT risks (including cyber security)
Financial performance
Opera@onal con@nuity
Strategic execu@on, compe@@on
Governance and Reputa@onal
Liquidity, capital & financial sustainability
Other
control of management)
-‐
10
20
30
40
50
60
70
In the WEF’s global competitiveness survey 2014/2015, the top 10 problematic factors for doing business in South Africa were:

Dissecting disclosures: Benchmarking the JSE top 100 7
The International Integrated Reporting Framework (“the framework”) published by the International Integrated Reporting Council provides guidance for an organisation to demonstrate its ability to create and sustain value over time. The key risks and opportunities in delivering on the strategic objectives need to be determined. The framework requires that the key risks and opportunities be disclosed, as well as the measures in place to manage the risks and opportunities.
This disclosure is also a key requirement for London-listed companies under the Combined Code.
We have analysed key risks disclosed on the JSE Top 100. Three companies did not disclose their key risks. On average, companies identifi ed and explained 10 risks, but there were some variances within industries. The table below summarises the average number of risks in sectors with more than fi ve companies and the most common risks identifi ed:
Top fi ve most common risks (excluding strategic and operational)•
Sector Average No. of risks
1 2 3 4 5
Basic Resources
11 Macro-economic (commodity prices most commonly)
Political Health & safety
Talent Currency
Many referenced uncertainty in government policies in mining
Labour relations and labour unrest were common themes
Other fi nancial Services
11 Talent RegulatoryLiquidity/Capital Reputation
ITCreditMacro-economic
Healthcare 11 RegulatoryTalent
M&A CreditIT
Real Estate 11 Macro-Economic
Liquidity/Capital
RegulatoryPolitical Credit
Many identifi ed municipal service deterioration as affecting their businesses
Banks 10 Credit Liquidity/Capital
Financial markets
RegulatoryCurrencyFinancial performanceReputation
Insurance 10 Financial markets
RegulatoryLiquidity/CapitalIndustry specifi c
CreditReputation Risk
Industrial Goods & Services
9 Regulatory CurrencyMacro-Economic
CreditLiquidity/CapitalTalentPolitical
Retail 9 Economic IT
RegulatoryTalentSupplier
Food & Beverage
8 Regulatory CurrencyTalentSupplier
Macro-economicFinancial performance
On average, companies identifi ed and explained 10 risks, but there were some variances within industries.
* Where risks were mentioned an equal number of times and have equal ranking, they are presented over multiple columns.

8
The top 10 risks identified by JSE-listed companies overall are summarised as follows:
Rank Risk category Number of companies
1 Strategic execution 69
2 Macro-economy 60
3 Regulatory or fiscal 54
4 Operational continuity 42
5 Liquidity and capital 41
6 Political/community stability 39
7 Currency 38
8 Credit 34
9 Financial performance 30
10 IT 28
This demonstrates that many of the risks faced by our biggest corporates are outside their control, with macro-economic conditions, regulatory matters, political matters and currency concern all making it into the top 10. Within regulatory matters, the tone is typically compliance. However, almost all the industries indicated uncertainty and significant change in the regulatory environment, including financial services (both banks and insurance), resources, telecommunications, healthcare, food and beverage, real estate, personal and household goods, construction and materials and travel and leisure.
To summarise the extent of South African regulatory change identified by companies, the following were identified and extracted from annual reports in the sectors that are most affected:
Resources • Amendments to mining, land and water legislation as well as empowerment codes• Uncertainty in political regulatory risk and maintaining social licences• Government bureaucracy
Banks • The Foreign Account Tax Compliance Act• Treating Customers Fairly• Protection of personal information• Banks Amendment Act• Financial Sector Regulation Bill (Twin Peaks and market conduct)• Financial Services Laws General Amendment Act• National Credit Amendment Bill• Basel III
Insurers • Micro insurance legislation• Long-Term Insurance Act• Solvency Assessment Management (SAM)• Consumer Protection Act• Short-Term Insurance Act• Financial Services Laws General Amendment Act
Healthcare • Competition Commission market inquiry in SA• Medical scheme consolidation• Designated Service Providers (DSPs) or preferred networks• National Health Insurance (NHI)• Office for Health Standards Compliance (OHSC)• Pharmaceutical logistics fee capping proposals• Pharmaceutical international benchmark pricing
Industrial goods and services
• Two companies referred to the complexity of the regulatory environment. One mentioned the changing nature thereof.
Food and beverages • South Africa proposing the banning of alcohol advertising

Dissecting disclosures: Benchmarking the JSE top 100 9
In the WEF’s competitiveness survey, South Africa was ranked 120th out of 144 countries for the perception of the burden of legislation (one being the most competitive in this measure). Is this another indicator of the intensity of South Africa’s legislative framework? What is clear is that it is a major focus of listed corporates on the JSE. Globally, governments are focusing on reducing red tape to remain globally competitive. South Africa’s government has committed to reducing red tape for business, but it is difficult to see the effect when so many corporates on the JSE have indicated legislative and regulatory change as a major risk.
Less common but noticeably present were references to the adequacy of various aspects of South Africa’s infrastructure. The most common references were to the security of the electricity and water supply. These risks also articulated increasing costs of these utilities. References were made to the South African rail, road, port and pipeline infrastructure. These references clearly indicate uncertainty in these utility provisions, which have been identified as frustrating economic growth and investment.
South Africa’s other ills also feature highly on companies risk registers. Several companies identified political/community instability with references to social unrest. Credit risk also features significantly – a fall out of poor performance in the SA economy and the strain on SA consumers from rising costs.
Surprisingly, only three companies identified any risk associated with their Africa strategy, indicating the lack of actual exposure of the JSE to the rest of Africa despite the increased focus by corporates in their disclosed strategic objectives (see page 18).
In the WEF’s competitiveness survey, South Africa was ranked 120th out of 144 countries for the perception of the burden of legislation (one being the most competitive in this measure).
Less common but noticeably present were references to the adequacy of various aspects of South Africa’s infrastructure. The most common references were to the security of the electricity and water supply.

10
Transformation remains a challenge for the JSE top 100, with only 32% of boards being black.The King Code recommends a balance of power with the majority non-executive directors, of which the majority should be independent. In addition every board should consider whether its size, diversity and demographics make it effective.
Several charters have been set up for industries on the matter of empowerment. These charters specify the proportion of senior management including boards that should be black. The policy objectives of BEE legislation include a signifi cant increase in the number of black people in executive and senior management of enterprises.
We have analysed the profi le of directors on the JSE by racial demographic and gender.
Substantial advantage can be gained with higher representation in senior management, contributing signifi cantly to the overall BEE scorecard of an enterprise. The scorecard identifi es management representation, including executive management as a core BEE component. Under the new BEE legislation, a “black enterprise” is one that is 50.1% owned by black people and where there is substantial management control. A “black woman-owned enterprise” is one with at least 25.1% representation of black women within the black equity and management portion.
Thirty-two percent (32%) of the JSE top 100 directorate are black. Eighty-two percent (82%) of the top 100 board directors are male, of which 23.6% are black. Females represent 18% of the directorate, of which 73% are black. The lowest proportion is white females, who only make up 5%. Transformation was also identifi ed by several companies as a key risk.
Board composition
White male
Black male
White female
Black female
White females seem to have been the losers. Is this because they have historically been overlooked and are now not contributing suffi ciently to empowerment scorecards or are there other challenges?
White males continue to dominate the JSE top 100 leadership.
With 32% of JSE top 100 boards being black, most companies are meeting the minimum requirements of their respective charters. We were unable to identify evidence of companies going beyond the minimum required senior management levels.
A study by McKinsey (“Women Matter”) of 89 European publicly traded companies with a market capitalisation of over 150 million pounds found that the companies with more female representation in senior management and on the board had, on average, more than 10% higher return on equity than those companies with the lowest percentage of women in leadership.
Thirty-two percent (32%) of the JSE top 100 directorate are black.
Eighty-two percent (82%) of the top 100 board directors are male, 23.6% of which are black.
63%
13%5%
19%

Dissecting disclosures: Benchmarking the JSE top 100 11
On an industry basis:
Male Female Black Male Black Female BlackRelevant
charter target*
Banks 82% 18% 21% 16% 36% 33%
Basic resources 83% 17% 26% 11% 38% 40%
Chemicals 76% 24% 14% 19% 33%
Construction & materials
76% 24% 17% 21% 38% 40%
Other financial services
87% 13% 13% 6% 19% 33%
Food & beverage 79% 21% 21% 16% 38%
Healthcare 85% 15% 19% 10% 29%
Industrial goods & services
82% 18% 21% 15% 36%
Insurance 78% 22% 26% 16% 41% 33%
Media 82% 18% 12% 6% 18% 30%-50%
Oil & gas 86% 14% 29% 14% 43% 40%-50%
Personal & Household Goods
86% 14% 2% 2% 4%
Real estate 91% 9% 14% 6% 20% 40%-50%
Retail 82% 18% 14% 15% 28%
Technology 89% 11% 11% 11% 22% 40%-50%
Telecommunications 80% 20% 36% 16% 52% 40%-50%
Travel & leisure 68% 32% 23% 32% 55% 40%
JSE top 100 82% 18% 19% 13% 32%
The strongest female representation is in travel and leisure with 32%. Real estate is the weakest in gender demographics. With increased focus on gender from regulators both in South Africa and abroad, improving these metrics should be a priority for the JSE top 100.
Market capitalisation
Average board size
Male Female Black Black female
0-15 bn 11 81% 19% 37% 16%
15.01 to 30 bn 12 83% 17% 31% 13%
30.01 to 45 bn 12 85% 15% 38% 12%
45.01 to 60 bn 12 84% 16% 28% 9%
60 to 90 bn 11 81% 19% 35% 15%
> 90.01 bn 15 81% 19% 30% 12%
JSE top 100 12 82% 18% 32% 13%
Board size doesn’t vary significantly except for companies with market capitalisation above R90bn where on average, boards consist of 15 members. In black representation, smaller companies with market capitalisation under R15 billion performed extremely well with 37% representation when compared with their larger peers.
Not all sectors have achieved their BEE management targets. The JSE top 100 has some way to go in terms of transformation.
* Black representation targets set for senior management as quoted in various relevant sector charters published by the South African government, where relevant.
Poor race transformation representation at the board level when compared with the total at less than 20%.
Strong race transformation with over 40% black representation at the board level.
Gender transformation is challenging for all sectors, five of which with less than 15% female representation at the board level.
12
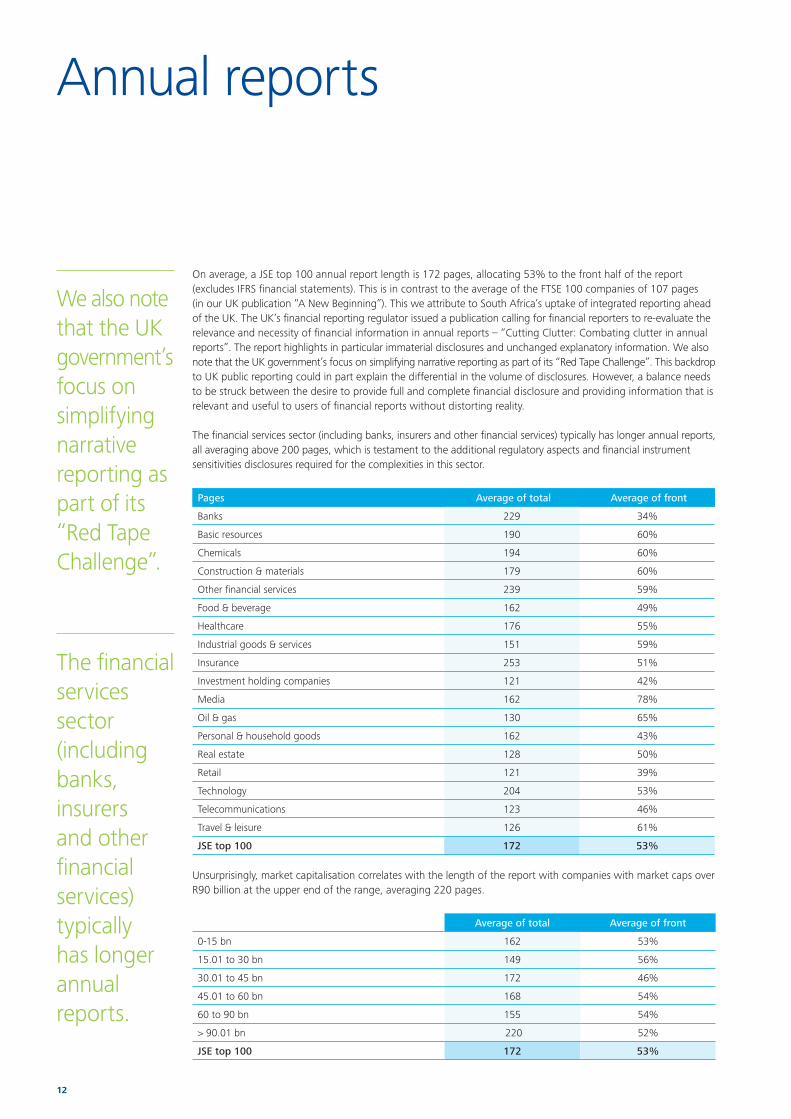
On average, a JSE top 100 annual report length is 172 pages, allocating 53% to the front half of the report (excludes IFRS financial statements). This is in contrast to the average of the FTSE 100 companies of 107 pages (in our UK publication “A New Beginning”). This we attribute to South Africa’s uptake of integrated reporting ahead of the UK. The UK’s financial reporting regulator issued a publication calling for financial reporters to re-evaluate the relevance and necessity of financial information in annual reports – “Cutting Clutter: Combating clutter in annual reports”. The report highlights in particular immaterial disclosures and unchanged explanatory information. We also note that the UK government’s focus on simplifying narrative reporting as part of its “Red Tape Challenge”. This backdrop to UK public reporting could in part explain the differential in the volume of disclosures. However, a balance needs to be struck between the desire to provide full and complete financial disclosure and providing information that is relevant and useful to users of financial reports without distorting reality.
The financial services sector (including banks, insurers and other financial services) typically has longer annual reports, all averaging above 200 pages, which is testament to the additional regulatory aspects and financial instrument sensitivities disclosures required for the complexities in this sector.
Pages Average of total Average of front
Banks 229 34%
Basic resources 190 60%
Chemicals 194 60%
Construction & materials 179 60%
Other financial services 239 59%
Food & beverage 162 49%
Healthcare 176 55%
Industrial goods & services 151 59%
Insurance 253 51%
Investment holding companies 121 42%
Media 162 78%
Oil & gas 130 65%
Personal & household goods 162 43%
Real estate 128 50%
Retail 121 39%
Technology 204 53%
Telecommunications 123 46%
Travel & leisure 126 61%
JSE top 100 172 53%
Unsurprisingly, market capitalisation correlates with the length of the report with companies with market caps over R90 billion at the upper end of the range, averaging 220 pages.
Average of total Average of front
0-15 bn 162 53%
15.01 to 30 bn 149 56%
30.01 to 45 bn 172 46%
45.01 to 60 bn 168 54%
60 to 90 bn 155 54%
> 90.01 bn 220 52%
JSE top 100 172 53%
Annual reports
We also note that the UK government’s focus on simplifying narrative reporting as part of its “Red Tape Challenge”.
The financial services sector (including banks, insurers and other financial services) typically has longer annual reports.

Dissecting disclosures: Benchmarking the JSE top 100 13
Integrated reportingFollowing the incorporation of King III into the Johannesburg Stock Exchange Listing Requirements, listed companies are required to issue an integrated report for financial years starting on or after 1 March 2010, or explain why they are not doing so.
The International Integrated Reporting Council (IIRC) has developed a framework for an integrated report. The framework makes it clear that a principle-based approach should be followed in the preparation of the integrated report. Rather than to provide a list of detailed disclosures, the framework sets the scene and provides the underlying principles and considerations that should guide the approach to integrated reporting and the publication of the integrated report.
In essence, the framework proposes that the company should explain to its stakeholders how it creates and sustains value in the short, medium and long term. The explanation should adhere to the fundamental concepts and guiding principles in describing the business model used to create value. In doing so, the company should discuss and link all content elements. This should all be underpinned by the strategic objectives of the business.
In addition, the framework explains:• The concept of the six capitals (inputs or resources utilised by a company to create and store value)• The need to describe the company’s business model and the manner in which this should be done • The meaning of value created or destroyed by the company
The IIRC framework makes it clear that any communication purporting to be an integrated report should comply with the minimum reporting standards identified in the framework.
14
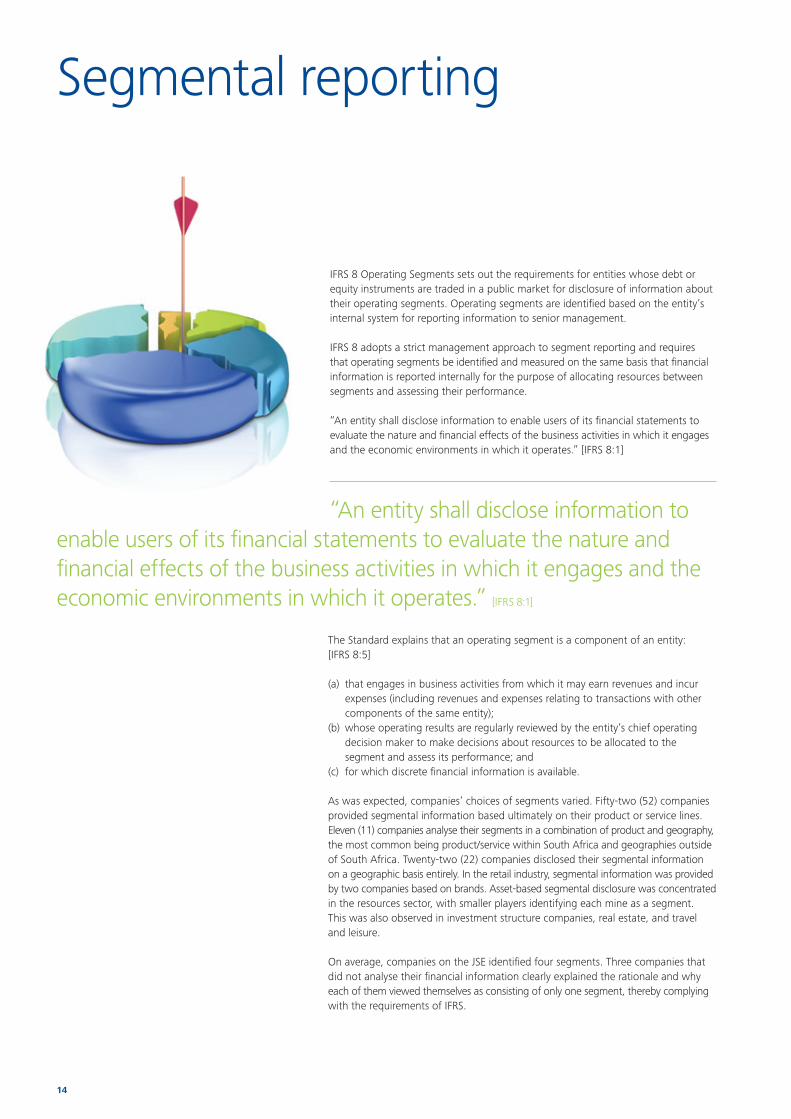
IFRS 8 Operating Segments sets out the requirements for entities whose debt or equity instruments are traded in a public market for disclosure of information about their operating segments. Operating segments are identified based on the entity’s internal system for reporting information to senior management.
IFRS 8 adopts a strict management approach to segment reporting and requires that operating segments be identified and measured on the same basis that financial information is reported internally for the purpose of allocating resources between segments and assessing their performance.
“An entity shall disclose information to enable users of its financial statements to evaluate the nature and financial effects of the business activities in which it engages and the economic environments in which it operates.” [IFRS 8:1]
The Standard explains that an operating segment is a component of an entity: [IFRS 8:5]
(a) that engages in business activities from which it may earn revenues and incur expenses (including revenues and expenses relating to transactions with other components of the same entity);
(b) whose operating results are regularly reviewed by the entity’s chief operating decision maker to make decisions about resources to be allocated to the segment and assess its performance; and
(c) for which discrete financial information is available.
As was expected, companies’ choices of segments varied. Fifty-two (52) companies provided segmental information based ultimately on their product or service lines. Eleven (11) companies analyse their segments in a combination of product and geography, the most common being product/service within South Africa and geographies outside of South Africa. Twenty-two (22) companies disclosed their segmental information on a geographic basis entirely. In the retail industry, segmental information was provided by two companies based on brands. Asset-based segmental disclosure was concentrated in the resources sector, with smaller players identifying each mine as a segment. This was also observed in investment structure companies, real estate, and travel and leisure.
On average, companies on the JSE identified four segments. Three companies that did not analyse their financial information clearly explained the rationale and why each of them viewed themselves as consisting of only one segment, thereby complying with the requirements of IFRS.
Segmental reporting
“An entity shall disclose information to enable users of its financial statements to evaluate the nature and financial effects of the business activities in which it engages and the economic environments in which it operates.” [IFRS 8:1]

Dissecting disclosures: Benchmarking the JSE top 100 15
Row labels Product GeographicAsset based
Mix None Brand Total
Banks 5 1 6
Basic resources 7 5 6 1 1 20
Chemicals 2 2
Construction & materials
2 1 1 4
Financial services 4 1 1 6
Food & beverage 6 1 2 9
Healthcare 1 4 5
Industrial goods & services
4 2 2 8
Insurance 6 6
Investment instruments
1 2 3
Media 1 1
Oil & gas 1 1
Personal & household Goods
1 2 3
Real estate 7 2 1 1 11
Retail 4 2 1 1 2 10
Technology 1 1
Telecommunications 2 2
Travel & leisure 1 1 2
JSE top 100 52 22 10 11 3 2 100
Segmental reporting is typically included in the annual report as a note to the IFRS financial statements. As these disclosures include a great deal of detail and analysis of the company, their divorce from the commentary in the front end of the annual report is likely to result in duplication of disclosures. Despite this, only 10 companies combined the IFRS 8 disclosures with the commentary.
IFRS 8 requires a profit measure to be presented for each reporting segment. Most companies reflected operating profit. Several reflected an adjusted operating profit number. EBITDA was also commonly used as the profit measure. Few companies disclosed headline earnings for each segment; however, similarly adjusted profit measures were included against operating profit. One company in the financial services sector included a return on equity measure.
Segmental reporting is typically included in the annual report as a note to the IFRS financial statements. On average, the JSE top 100 identified four segments.

16
Entities are required to report geographical information for revenue attributable to the entities’ own country of domicile and attributed to foreign countries in total and separately where material. [IFRS 8:33]. Fifty-eight (58) companies disclosed this information, which provided an opportunity for us to analyse the contribution to revenue for those companies from countries outside of South Africa. The chart below summarises the identifi able contribution to total revenue for all the JSE top 100 (excluding companies with primary listings elsewhere):
Geographic analysis (excl. foreign companies)
What is disappointing is the contribution from the rest of Africa – being only 1% (excluding foreign listed companies). Europe is clearly a signifi cant contributor.
Revenue (incl. foreign listed companies)
With the inclusion of foreign listed companies, the proportion of unclear geographies decreases signifi cantly, indicating that these companies are better at disclosing geographic information.
South Africa 38%
Europe 35%
Asia-pacifi c 9%
Americas 1%
Rest of Africa 1%
Middle East <1%
Remainder not clear 16%
Another indicator of Europe’s importance to South Africa is its importance as a trading partner. The SA Reserve Bank’s June quarterly bulletin reported that South Africa’s main trading partner is the Euro area, making up 26.9% of exports. The report also stated that South Africa’s bilateral trade with African countries increased, consistent with the region’s increase in economic growth. A combination of Southern African countries made up 25.4% of exports – West African and East African countries were not reported on.
South Africa 40%
Europe 38%
Asia-pacifi c 13%
Americas 3%
Rest of Africa 3%
Remainder not clear 3%
Dissecting disclosures: Benchmarking the JSE top 100 17
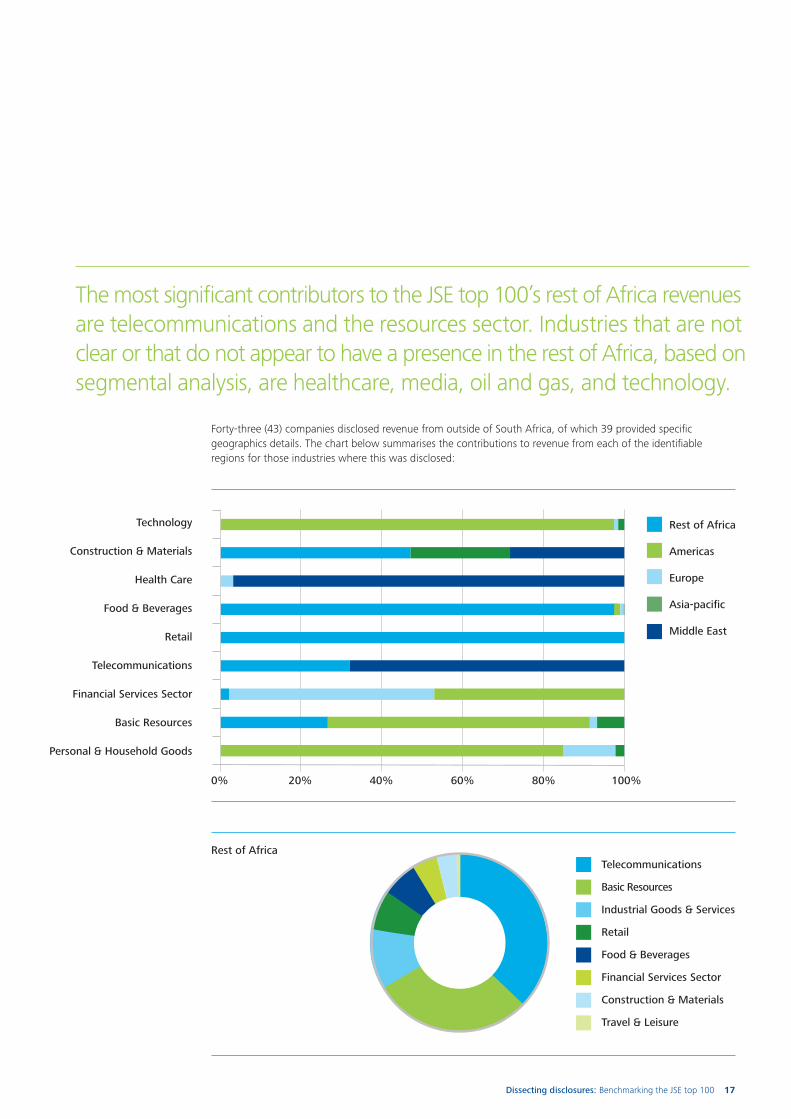
Forty-three (43) companies disclosed revenue from outside of South Africa, of which 39 provided specifi c geographics details. The chart below summarises the contributions to revenue from each of the identifi able regions for those industries where this was disclosed:
Rest of Africa
Technology
Construction & Materials
Health Care
Food & Beverages
Retail
Telecommunications
Financial Services Sector
Basic Resources
Personal & Household Goods
Rest of Africa
Americas
Europe
Asia-pacifi c
Middle East
0% 20% 40% 60% 80% 100%
Telecommunications
Basic Resources
Industrial Goods & Services
Retail
Food & Beverages
Financial Services Sector
Construction & Materials
Travel & Leisure
The most signifi cant contributors to the JSE top 100’s rest of Africa revenues are telecommunications and the resources sector. Industries that are not clear or that do not appear to have a presence in the rest of Africa, based on segmental analysis, are healthcare, media, oil and gas, and technology.

18
Strategy and Africa
The framework published by the IIRC provides guidance that the integrated report should have a strategic focus throughout. The report should explain the various strategies to ensure delivery on the objectives. The framework requires the Integrated Report to adopt a forward-looking approach and to indicate how the continued availability, quality and affordability of material resources and inputs (capitals) contribute to the organisation’s ability to achieve its strategic objectives in the future.
We have used the integrated reports of the JSE top 100 to ascertain the focus on Africa. Companies have typically clearly identified their strategic objectives. Those companies which clearly identified Africa or territories in Africa as part of their strategic focus areas are summarised below, by industry:
Africa identified as a strategic focus area
Companies in the industry
Proportion of industry
Banks 5 6 83%
Basic resources 3 20 15%
Chemicals 1 2 50%
Construction & materials 4 4 100%
Other financial services 0 6 0%
Food & beverage 7 9 78%
Healthcare 3 5 60%
Industrial goods & services 3 8 38%
Insurance 5 6 83%
Investment holding companies 2 3 67%
Media 1 1 100%
Oil & gas 1 1 100%
Personal & household goods 1 3 33%
Real estate 2 11 18%
Retail 9 10 90%
Technology 1 1 100%
Telecommunications 1 2 50%
Travel & leisure 0 2 0%
JSE top 100 49 100 49%
All industries – with the exception of resources, other financial services (includes fund managers), industrial goods and services, real estate, and travel and leisure – reflect significant strategic focus on Africa. This reflects South Africa’s increasing interest in the continent and the pursuit of higher growth as South Africa’s own growth forecast remains lacklustre.
All industries – with the exception of resources, other financial services (includes fund managers), industrial goods and services, real estate, and travel and leisure – reflect significant strategic focus on Africa.

Dissecting disclosures: Benchmarking the JSE top 100 19
Although Africa does not appear high on the strategic risks of companies (page 9), it was identified as a strategic priority for 49 companies. To give a sense of specifically where in Africa the focus is, we analysed commentary and strategic focus areas for companies identifying which countries in Africa came up most frequently. There were no real surprises. The graphic below analyses the number of companies in the JSE top 100 that identified specific countries in the context of expansion:
1
2
1
2
2
2
4
5
5
7
89
10
10
13
1311
Ghana is a strong focus for the food and beverage industry. Three identified it for expansion, as did two construction companies and two retailers. Ghana’s most recent quoted GDP growth forecast for 2014 was 4.8%1. The WEF ranked it 111 out of 144 countries. The top five problematic factors for doing business included:1. Access to financing 2. Foreign currency regulations 3. Tax rates 4. Inflation 5. Corruption
Four retailers identified Nigeria for expansion, as did three food and beverage companies. Nigeria’s most recent GDP growth forecast for 2014 was 7.1%1. The WEF ranked it 127 out of 144 countries. Top five problematic factors for doing business included:1. Inadequate supply of infrastructure2. Corruption3. Access to financing4. Policy instability5. Inefficient government bureaucracy
Four retailers identified Zambia for expansion, as did three food and beverage companies.Zambia’s most recent GDP growth forecast for 2014 was 7.3%1. The WEF ranked it 96 out of 144 countries. The top five problematic factors for doing business included:1. Access to financing 2. Corruption 3. Tax rates 4. Poor work ethic in national
labor force 5. Inadequate supply of
infrastructure
Food and beverage favours Zimbabwe, with three companies identifying it for expansion. Zimbabwe was also identified by healthcare, industrial, insurance, resources, chemicals and construction. Zimbabwe was ranked 124 out of 144 countries in the WEF competitiveness report 2013/2014. The top five problematic factors for doing business were identified as:1. Access to financing2. Policy instability3. Inadequate supply of infrastructure4. Corruption5. Restrictive labour regulations
Three construction companies see Mozambique as expansionary territory.Other industries included chemicals, food and beverage, industrial, oil & gas, retail and travel. Mozambique’s most recent GDP growth forecast for 2014 was 8.3%1. The WEF ranked it 133 out of 144 countries.The top five problematic factors for doing business included:1. Access to financing 2. Corruption 3. Inadequate supply of
infrastructure 4. Inefficient government
bureaucracy 5. Inadequately educated
workforce
4
1 Forecast according to thje IMF “World Economic Outlook April 2014”
7

20

Dissecting disclosures: Benchmarking the JSE top 100 21
Author:John KrugerSenior ManagerAuditMobile: +27 71 361 7278Email: [email protected]
Geoff PinnockManaging partnerAudit AfricaMobile: +27 82 550 7527Email: [email protected]
Penny BinniePartnerInsuranceMobile: +27 83 270 7642Email: [email protected]
Key contacts

22
Finding Deloitte can help Contact
1. Principal external risks identifi ed by companies talk to South Africa’s challenges, including supply of infrastructure, labour and social unrest.
Deloitte can assist you to ensure your organisation is well equipped to identify and manage external risks. We can assist with major enterprise risk management transformations, strategic risk assessments as well as specialist risk management programmes such as reputation risk, fraud risk, supply chain risk, project risk and emerging risk, as well as defi ning a risk appetite framework ensuring that risk is managed within clearly defi ned parameters.
Mark VictorDirectorMobile: +27 82 772 3003Email: [email protected]
2. Regulatory and policy complexity and uncertainty are key concerns of several industries, echoing the result of the WEF’s competitiveness survey
Deloitte can assist you in understanding and navigating your way through regulation and legislation.
We have specialists in each industry who can help you to develop your response to changes in legislation and help you in understanding it to assist you in your compliance responsibilities.
Financial services (including banking and insurance)
Nina le RicheDirectorMobile: +27 82 331 4840Email: [email protected]
Consumer goodsClaire HoyAssociate DirectorMobile: +27 83 410 2139Email: [email protected]
ManufacturingMichelle TownsendDirectorMobile: +27 82 441 7164Email: [email protected]
Pharmaceuticals and healthcareJustine MazoccoDirectorMobile: +27 82 550 7521Email: [email protected]
ResourcesDean ChiversDirectorMobile: +27 82 415 8253Email: [email protected]
How Deloitte can help you

Dissecting disclosures: Benchmarking the JSE top 100 23
Finding Deloitte can help Contact
3. Thirty-two percent (32%) of boards are black, 18% female. Race and gender transformation remain challenging.
Deloitte can assist in developing programmes to attract, develop and retain women within your organisation. Through this process, we can assist in making your organisation more amenable to women, succeeding and enabling them to act more boldly on behalf of their career advancement, resulting in gender equality in your c-suite and boardroom. Key interventions we support include establishment of Women in Leadership governance, creating effective engagement and mentoring programmes, communication and networking initiatives and work–life integration/fl exible work arrangements policies and practices.
In addition, Deloitte provides verifi cation services and a tailored training programme specifi cally designed for female directors and senior executives sitting on boards, and those aspiring to be future board members.
Gillian HofmeyrDirector Mobile: +27 82 374 9968Email: [email protected]
Carla ClampAssociate DirectorMobile: +27 82 570 0379Email: [email protected]
4. Thirty-two percent (32%) of boards are black, 18% female. Race and gender transformation remain challenging.
Deloitte can assist with talent strategy formulation, workforce segmentation and strategic workforce planning, including supply and demand analysis.
Jack Sellschop DirectorBusiness TransitionMobile: +27 83 680 0539Email: [email protected]
• Annual reports are 61% longer than the FTSE 100 – is it time to cut the clutter?
Deloitte provides a range of services related to the preparation of the Integrated Report – this includes the analysis of existing reports based on the IIRC Framework, guidance to ensure effective alignment with the Framework, the development of stakeholder engagement policies and practices, and sustainability assurance.
Please visit our centre for corporate governance atwww.corpgov.deloitte.co.za.
Dr Johan ErasmusDirector Mobile: +27 82 573 2536Email: [email protected]

24
Finding Deloitte can help Contact
5. Forty-nine percent (49%) of companies identifi ed Africa as a strategic focus area. Thirty-eight percent (38%) of revenues earned are from Europe, 1% from Africa. When will the focus on Africa translate into rands?
6. Zambia and Nigeria are the most commonly referred to countries for expansion into the continent.
The Deloitte Africa team in South Africa is the centre of excellence which acts as a single point of contact to coordinate efforts across Africa. With 34 offi ces serving 51 countries, Deloitte has expertise in multiple disciplines that can help you in your expansion across Africa. Those disciplines include:• Monitor Deloitte – including strategy,
opportunity identifi cation and supply chain management
• Corporate Finance – including deal sourcing, due diligence, fund-raising assistance, deal structuring, deal tax optimisation and valuation services
• Human Capital & Legal – including securing and managing talent, understanding labour law and other statutory requirements, managing payrolls
• Tax – including establishing and registering of new entities, tax compliance, customs and excise, mobility management and assistance in determining optimal locations based on available government incentives
• Risk Advisory – includes implementation of business continuity programmes
• Accounting and Financial Advisory - includes assistance in the establishment of fi nancial functions across Africa, accounting technical advice and temporary secondments of qualifi ed accounting staff
Delia NdlovuDirector Tel: +27 11 806 6185Email: [email protected]
Trish WilsonPartnerMobile: +27 82 570 1904Email: [email protected]

Dissecting disclosures: Benchmarking the JSE 100 23

Deloitte refers to one or more of Deloitte Touche Tohmatsu Limited (DTTL), a UK private company limited by guarantee, and its network of member firms, each of which is a legally separate and independent entity. Please see www.deloitte.com/about for a detailed description of the legal structure of Deloitte Touche Tohmatsu Limited and its member firms. Deloitte provides audit, tax, consulting and financial advisory services to public and private clients spanning multiple industries. With a globally connected network of member firms in more than 150 countries, Deloitte brings world-class capabilities and high-quality service to clients, delivering the insights they need to address their most complex business challenges. Deloitte has in the region of 200 000 professionals, all committed to becoming the standard of excellence. This communication contains general information only, and none of Deloitte Touche Tohmatsu Limited, its member firms, or their related entities (collectively, the “Deloitte Network”) is, by means of this publication, rendering professional advice or services. Before making any decision or taking any action that may affect your finances or your business, you should consult a qualified professional adviser. No entity in the Deloitte Network shall be responsible for any loss whatsoever sustained by any person who relies on this communication. © 2014 Deloitte & Touche. All rights reserved. Member of Deloitte Touche Tohmatsu Limited
Designed and produced by Creative Services at Deloitte, Johannesburg. (808711/jomaris)