8035 paper 1 question paper sams set 3 v1.0...question 0 3 question 0 4 question 0 5 correct method...
TRANSCRIPT

8035/1/v1.0 8035/1
GCSE
GEOGRAPHY
Paper 1: Living with the physical environment
Additional specimen Morning Time allowed: 1 hour 30 minutes
Materials For this paper you must have: a pencil a ruler a calculator.
Instructions Use black ink or black ball-point pen. Fill in the boxes at the bottom of this page. Answer all questions in Section A and Section B. Answer two questions in Section C. You must answer the questions in the spaces provided. Do not write outside the box around each
page or on blank pages. Do all rough work in this book. Cross through any work you do not want to be marked.
Information The marks for questions are shown in brackets. The total number of marks available for this paper is 88. Spelling, punctuation, grammar and specialist terminology will be assessed in Question 01.10.
Advice For the multiple-choice questions, completely fill in the circle alongside the appropriate answer(s).
If you want to change your answer you must cross out your original answer as shown.
If you wish to return to an answer previously crossed out, ring the answer you now wish to select as shown.
Please write clearly, in block capitals.
Centre number Candidate number
Surname
Forename(s)
Candidate signature
SPECIMEN ASSESSMENT
MATERIAL: SET 3
CORRECT METHOD WRONG METHODS

2
8035/1/v1.0
Do not write outside the
box
Section A The challenge of natural hazards
Answer all questions.
0 1
The challenge of natural hazards Study Figure 1, a map showing tectonic hazards in New Zealand. Figure 1

3
Turn over ►
8035/1/v1.0
Do not write outside the
box
0 1
. 1
Using Figure 1, name the type of plate margin at Y. [1 mark]
0 1
. 2
Using Figure 1, which one of the following statements is true? Shade one circle only.
[1 mark]
A All earthquakes are found along a plate margin.
B Earthquakes and volcanoes are evenly spread across New Zealand.
C Volcanoes and earthquakes only take place on land.
D The majority of volcanoes occur in a line through the central part of North Island.
0 1
. 3
Using Figure 1, how much movement will there be along plate margin Z in 100 years? Shade one circle only.
[1 mark]
A 47 millimetres
B 47 centimetres
C 4.7 metres
D 47 metres
Question 1 continues on the next page

4
8035/1/v1.0
Do not write outside the
box
Study Figure 2, a block diagram showing a cross section between A and B on
Figure 1. Figure 2
0 1
. 4
Using Figures 1 and 2, suggest why both volcanoes and earthquakes occur in New Zealand.
[6 marks]

5
Turn over ►
8035/1/v1.0
Do not write outside the
box
Study Figure 3, a graph showing the area of Arctic sea ice each September between 1979 and 2016. Figure 3
0 1
. 5
Using Figure 3, describe how the area of Arctic sea ice has changed. [2 marks]
0 1
. 6
Give two ways that human activity may have contributed to the changes shown in Figure 3.
[2 marks]
1
2

6
8035/1/v1.0
Do not write outside the
box
0 1
. 7
Explain how volcanic activity and orbital changes may cause long-term climate change. [4 marks]
Study Figure 4, a satellite image of Hurricane Matthew shortly before it crossed Haiti in October 2016. Figure 4

7
Turn over ►
8035/1/v1.0
Do not write outside the
box
0 1
. 8
Using Figure 4 and your own understanding, complete the following sentences. [2 marks]
Figure 4 shows that the pattern of winds moving around the hurricane centre was anticlockwise because At X, the eye of the hurricane, the weather conditions were likely to be
Question 1 continues on the next page

8
8035/1/v1.0
Do not write outside the
box
Study Figure 5, a photograph showing the effects of Hurricane Matthew in south
western Haiti. Figure 5
0 1
. 9
Using Figure 5, state two primary effects of Hurricane Matthew. [2 marks]
1
2
9
Turn over ►
8035/1/v1.0
Do not write outside the
box
0 1
. 10
Using a named example, evaluate the immediate and long-term responses to tropical storms.
[9 marks][+ 3 SPaG marks]
End of Section A
Turn over for Section B
10
8035/1/v1.0
Do not write outside the
box
Section B The living world
Answer all questions.
0 2
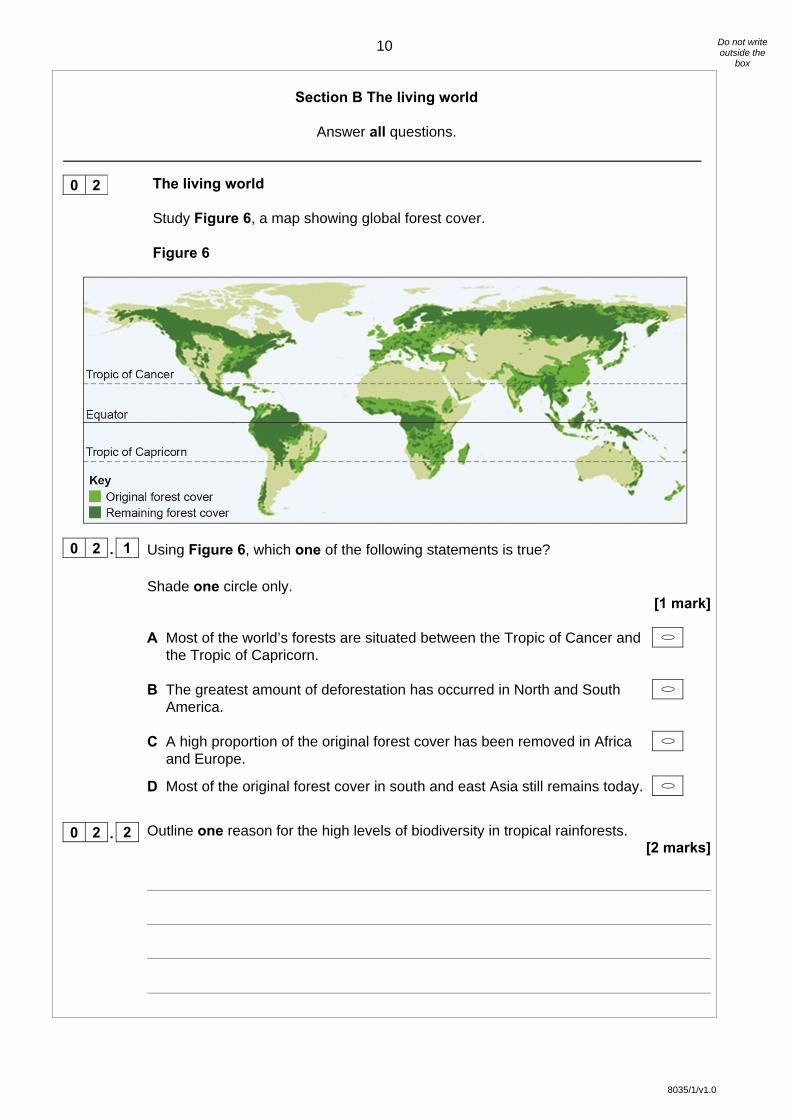
The living world Study Figure 6, a map showing global forest cover. Figure 6
0 2
. 1
Using Figure 6, which one of the following statements is true? Shade one circle only.
[1 mark]
A Most of the world’s forests are situated between the Tropic of Cancer and the Tropic of Capricorn.
B The greatest amount of deforestation has occurred in North and South America.
C A high proportion of the original forest cover has been removed in Africa and Europe.
D Most of the original forest cover in south and east Asia still remains today.
0 2
. 2
Outline one reason for the high levels of biodiversity in tropical rainforests. [2 marks]

11
Turn over ►
8035/1/v1.0
Do not write outside the
box
Study Figure 7, a graph showing annual deforestation and land protected in the Amazon rainforest of Brazil between 1994 and 2013. Figure 7
0 2
. 3
Using Figure 6, which one of the following statements is true? Shade one circle only.
[1 mark]
A Annual deforestation was over 15000 sq km in every year between 1994 and 2005.
B The highest level of deforestation was in 1995 and the lowest level was in 2012.
C The percentage of land protected increased by approximately 20% between 1994 and 2013.
D Annual deforestation decreased every year between 2004 and 2013.

12
8035/1/v1.0
Do not write outside the
box
0 2
. 4
Using Figure 7, suggest two reasons for the changes in annual deforestation in Brazil between 2004 and 2013.
[2 marks]
1
2
Study Figure 8, information about Carajás mine in Brazil, South America. Figure 8
Factfile Carajás Mine Largest iron ore mine in the world. Area is estimated to contain over 6.5 billion tonnes of iron ore. Over 100 million tonnes iron ore mined each year, with much exported to Asia. Gold, manganese, copper, bauxite and nickel mined in smaller mines. Powered by Tucuruí hydro-electric power station. 900 km railway link built to the coast. Recent development of a new iron-ore mine to the south. Local Indians now unable to carry on their traditional farming. Many local Indians have died because of imported diseases such as measles. Some drinking water polluted by mercury, affecting the health of the local farmers.

13
Turn over ►
8035/1/v1.0
Do not write outside the
box
0 2
. 5
Using Figure 8 and your own understanding, explain how deforestation can have economic impacts.
[6 marks]

14
8035/1/v1.0
Do not write outside the
box
Study Figure 9, a diagram showing energy flows in an ecosystem in the UK. Figure 9
0 2
. 6
Describe the role of producers in an ecosystem.
[1 mark]
0 2
. 7
Give one reason why energy is lost at each level in a food chain.
[1 mark]

15
Turn over ►
8035/1/v1.0
Do not write outside the
box
0 2
. 8
Using Figure 9 and your own understanding, complete the following sentences. [2 marks]
If a disease reduced the number of primary consumers, one effect on the food chain would be that
Decomposers help to return nutrients to the soil by
Question 2 continues on the next page
16
8035/1/v1.0
Do not write outside the
box
0 2
. 9
Choose one of the following environments:
Environments on the fringe of hot deserts
Cold environments
Tick the box indicating the environment chosen.
To what extent is your chosen environment at risk from human activity?
[9 marks]
End of Section B

17
Turn over ►
8035/1/v1.0
Do not write outside the
box
Section C Physical landscapes in the UK
Answer two questions from the following:
Question 3 (Coasts), Question 4 (Rivers), Question 5 (Glacial).
Shade the circle below to indicate which two optional questions you will answer.
Question 0 3 Question 0 4 Question 0 5
0 3
Coastal landscapes in the UK Study Figure 10, a 1:50 000 Ordnance Survey map of the Barmouth area. Figure 10
WRONG METHODS CORRECT METHOD
X
Y

18
8035/1/v1.0
Do not write outside the
box
0 3
. 1
Using Figure 10, give the 6 figure grid reference for a shingle beach. Shade one circle only.
[1 mark]
A 616138
B 609138
C 596106
D 614147
0 3
. 2
Using Figure 10, which of the following statements best describes the features of grid square 6016? Shade one circle only.
[1 mark]
A An area of flat land, a small stream and a saltmarsh in the north.
B A steep cliff, a road and railway, no buildings and narrow beach.
C A long narrow piece of land, car park, railway and wide beach.
D A beach with groynes, a small coastal settlement and an A road.
0 3
. 3
Using Figure 10, how long is the coastline between X (611120) and Y (617150)? Shade one circle only.
[1 mark]
A 2.3 km
B 2.7 km
C 3.0 km
D 3.4 km

19
Turn over ►
8035/1/v1.0
Do not write outside the
box
Study Figure 11 a photograph of part of the coastline shown in Figure 10. Figure 11
0 3
. 4
Using Figures 10 and 11, in which direction was the photographer facing when the picture was taken? Shade one circle only.
[1 mark]
A north east
B north west
C south west
D south east

20
8035/1/v1.0
Do not write outside the
box
0 3
. 5
Using Figures 10 and 11, suggest one reason why the area in grid squares 6014 and 6015 shows evidence of deposition.
[1 mark]
0 3
. 6
Feature Z labelled on Figure 11 is a spit. Explain the formation of a spit.
[4 marks]

21
Turn over ►
8035/1/v1.0
Do not write outside the
box
0 3
. 7
‘Hard engineering strategies are effective in protecting the coastline.’ Do you agree with this statement? Explain your answer.
[6 marks]
Turn over for the next question
22
8035/1/v1.0
Do not write outside the
box
0 4
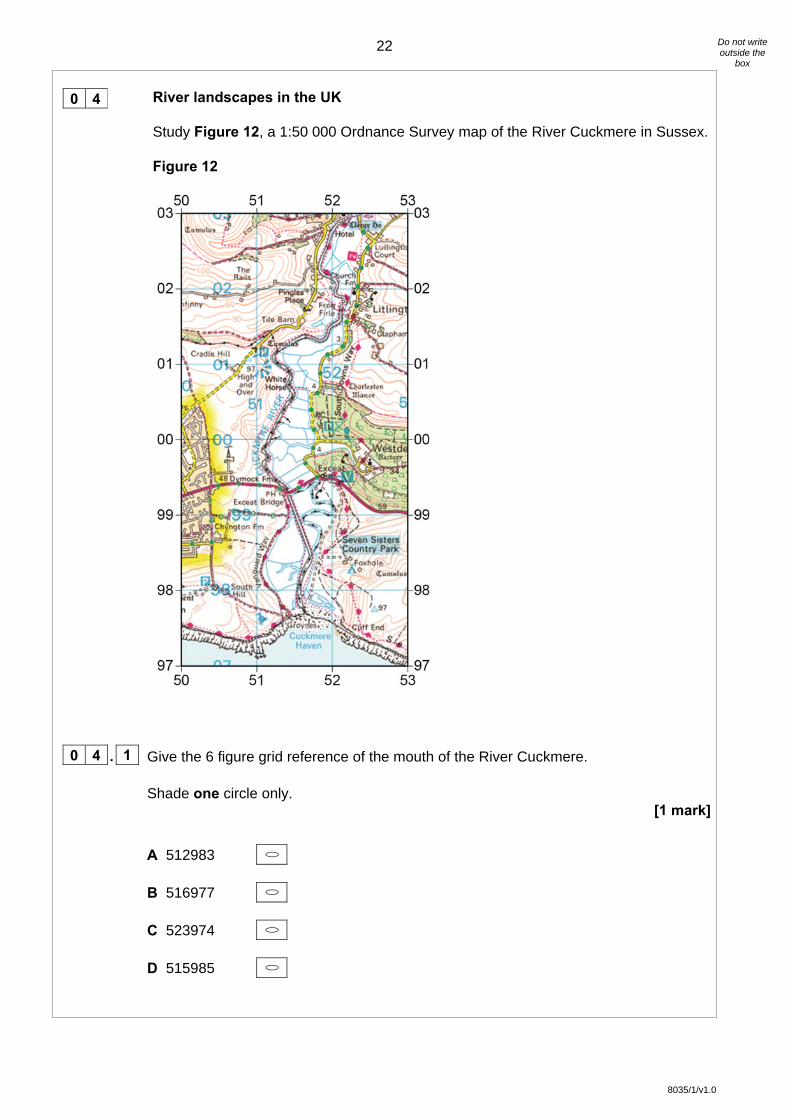
River landscapes in the UK Study Figure 12, a 1:50 000 Ordnance Survey map of the River Cuckmere in Sussex. Figure 12
0 4
. 1
Give the 6 figure grid reference of the mouth of the River Cuckmere. Shade one circle only.
[1 mark]
A 512983
B 516977
C 523974
D 515985

23
Turn over ►
8035/1/v1.0
Do not write outside the
box
0 4
. 2
Using Figure 12, which grid square matches the following description? ‘There is a meandering river. Land is flat in the south, but it rises to 70 metres in the north west. Two secondary roads pass through the area.’ Shade one circle only.
[1 mark]
A 5297
B 5202
C 5101
D 5002
Study Figure 13, a photograph of the River Cuckmere and its valley. Figure 13
Question 4 continues on the next page

24
8035/1/v1.0
Do not write outside the
box
0 4
. 3
Using Figures 12 and 13, give the grid reference of point X on Figure 13. Shade one circle only.
[1 mark]
A 517985
B 513993
C 516989
D 520991
0 4
. 4
Using Figure 13, describe one feature of the River Cuckmere where it reaches the sea at point Y.
[1 mark]
0 4
. 5
Using Figures 12 and 13, suggest why there is a straightened channel next to the natural river meander.
[1 mark]

25
Turn over ►
8035/1/v1.0
Do not write outside the
box
0 4
. 6
Feature Z labelled on Figure 13 is a floodplain. Explain the formation of a floodplain.
[4 marks]
0 4
. 7
‘The causes of river flooding are usually the result of human factors.’ Do you agree with this statement? Explain your answer.
[6 marks]

26
8035/1/v1.0
Do not write outside the
box
0 5
Glacial landscapes in the UK Study Figure 14, a 1:50000 Ordnance Survey map of part of the Lake District. Figure 14
0 5
. 1
Using Figure 14, which landform is located in grid square 1519? Shade one circle only.
[1 mark]
A corrie
B drumlin
C hanging valley
D ribbon lake
W
V

27
Turn over ►
8035/1/v1.0
Do not write outside the
box
0 5
. 2
Using Figure 14, what is the difference in height between Grasmoor (labelled V at 176203), and the edge of Crummock Water (labelled W at 162183)? Shade one circle only.
[1 mark]
A 653 metres
B 751 metres
C 791 metres
D 953 metres
0 5
. 3
Using Figure 14, suggest in which direction valley glaciers moved across this area during the last ice age. Shade one circle only.
[1 mark]
A north to south
B north east to south west
C west to east
D south east to north west

28
8035/1/v1.0
Do not write outside the
box
Study Figure 15, a photograph of part of the area shown in Figure 14. Lake Buttermere is in the foreground. Figure 15
0 5
. 4
Using Figures 14 and 15, name hill X. Shade one circle only.
[1 mark]
A Mellbreak (1419)
B Dodd (1615)
C Whiteless Pike (1718)
D Grasmoor (1720)
0 5
. 5
Using Figures 14 and 15, suggest a reason why there is an area of flat land separating Lake Buttermere and Crummock Water, shown as Y on Figure 15.
[1 mark]

29
Turn over ►
8035/1/v1.0
Do not write outside the
box
0 5
. 6
Feature Z shown on Figure 15 is a glacial trough. Explain the formation of a glacial trough.
[4 marks]
0 5
. 7
‘Economic activity can cause conflict between different land uses in glaciated upland areas.’ Do you agree with this statement? Explain your answer.
[6 marks]
END OF QUESTIONS

30
8035/1/v1.0
Do not write outside the
box
There are no questions printed on this page
DO NOT WRITE ON THIS PAGE ANSWER IN THE SPACES PROVIDED

31
Turn over ►
8035/1/v1.0
Do not write outside the
box
There are no questions printed on this page
DO NOT WRITE ON THIS PAGE ANSWER IN THE SPACES PROVIDED

32
8035/1/v1.0
Do not write outside the
box
There are no questions printed on this page
DO NOT WRITE ON THIS PAGE ANSWER IN THE SPACES PROVIDED
Acknowledgement of copyright holders and publishers Permission to reproduce all copyright material has been applied for. In some cases, efforts to contact copyright holders have been unsuccessful and AQA will be happy to rectify any omissions of acknowledgements in future papers if notified. Figure 2: © Mick Finn, GNS Science Figure 3: © NSIDC, NASA Figure 4: © Getty images Figure 5: © Getty images Figure 6: © Grid-Arendal Figure 7: © The Economist Group Limited, London, 2015, INPE, PRODES Figure 8: © Getty images Figure 11: © Roger Davies Figure 13: © Alamy Figure 15: © Alamy Copyright © 2017 AQA and its licensors. All rights reserved.