80 years of dow jones industrial (3)
TRANSCRIPT

80 years of Dow Jones Industrial BY: FAITH ADEFARAKAN


regular Exponential
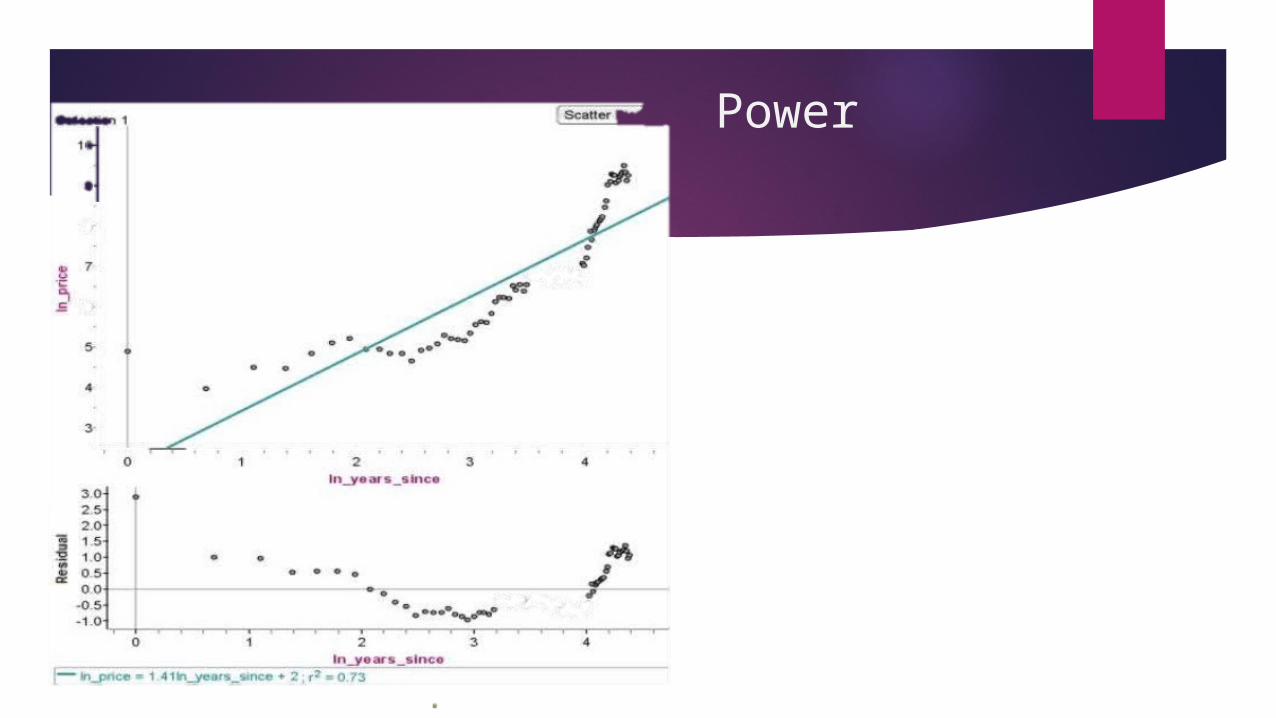
Power

1. Describe the association between “DJIA price” and “Years Since 1930” 1. Describe the association between “DJIA price” and “Years Since 1930”. 1. Describe the association between “DJIA price” and “Years Since 1930”.
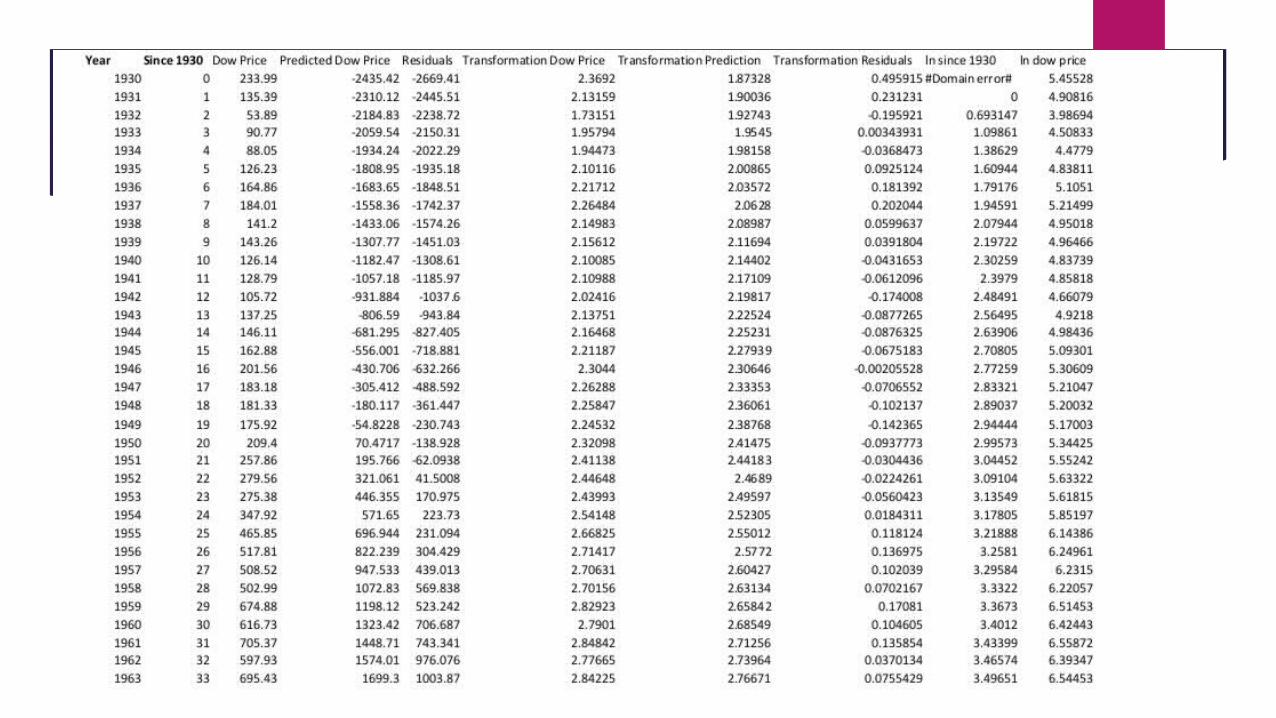
There association is a positive exponential relationship between the years since and thedow price. 2. What is the equation for your linear model? (Use descriptive variables)Dow Price = 125.3(years)-2.4425x10^05 3. Interpret the slope of the line in context.As the years increase the price goes up by 125 per year. The slope is steep 4. Does the y-intercept of your model have a meaningful interpretation or is it justa hypothetical base value? Explain.The y intercept DOES NOT have a meaningful interpretation because the R^2 is63% which means that the y intercept has little to no association to the yearssince.

5. Look at the residuals plot for your linear model. Do you have any concernsabout predictions made by your model? Explain.Yes. I’m concerned that the data being used isn’t descriptive enough .6. What is the equation of your new model? (Use descriptive variables)Y hat=.06234(year)-116
7. Interpret the slope of the line in context.As the year increases the price goes up .06234.8. The y-intercept of your model have a meaningfulinterpretation? Explain.The y-intercept has a meaningful interpretation because there is a strongcorrelation and association ,because of R^2.9. The residuals plot for your transformed model still doesn’t look perfect, but hasit improved? How do you feel about the appropriateness of your new model?The residual plot has improved from the original graph because there is aclearer correlation.10. What is the correlation for your transformed data? What does this indicateabout the association?The correlation is roughly linear but also positive. This indicates that theexponential graph has the best "line of best fit".11. What is R2 for your transformed data? Interpret this value in context.R squared is 0.94 which is also 94%. This means that the natural log of the dowprice and the years since have a strong correlation and association.12. Use your model to make a prediction about the Dow price in July of 2012.

Y hat= .06234(2012)-116=9.42808E^9.42808=12432.6331513. You will most likely retire sometime between 2040 and 2050. What does your model predict for the Dow price in 2045? Comment on the appropriateness of this prediction. Y hat= .06234(2045)-116= 11.4853E^11.4853=97275.2628514. What is the equation of the exponential model that Microsoft Excel fit to the original data?Y hat=.06234(year)-11615. Use the exponential model to make a prediction about the Dow price in 2012. Compare it to the prediction made by your model. Are they close? Y hat= .06234(2012)-116=9.42808 E^9.42808=12432.633116. Calculate the y-intercept of your model and the y-intercept of the exponential model. Are they close? Are these predictions lower or higher than the actual Dow price on 2012? Y- intercept for model a is -2.44eY-intercept for model b is -116.The prediction for model B is lower than the predictions for model A.
