8. soil mechanics - working on the · pdf file8. soil mechanics james k. mitchell, at...
TRANSCRIPT

8. Soil MechanicsJames K. Mitchell, at 14'.David Cartier, IfI, b Nicholas C. Costes, eWilliam N. Houston, a Ronald F. Scott, d and H. John Hovland e
The objectives of the soil mechanics experiment soil behavior is similar to that of terrestrial soils ofwere to determine the physical characteristics and comparable gradation (silty fine sand). Particle-sizemechanical properties of the lunar soil at the surface distribution, particle shape, and relative density (ref.and subsurface and the variations in lateral directions 8-2) control behavior.and to relate this knowledge to the interpretation of Soil porosity, density, and strength vary locallylunar history and processes. Data obtained on the and with depth. Absolute densities may range fromlunar surface in conjunction with observations of approximately 1.0 to 2.0 g/cm a, and values > 1.5returned samples of lunar soil are used to determine g/cm a are probable at depths > 10 to 20 cm. Thein-place density and porosity profdes and to determine relative density of the soil near the surface isstrength characteristics on local and regional scales, extremely variable but is generally quite high (> 80The soil mechanics experiment on the Apollo 17 percent) below a depth of 10 to 20 cm. Although
mission to the Taurus-Littrow area of the Moon was local (meter scale) variations in density and porositypassive and involved no apparatus or crew time exist, Houston et al. (ref. 8-3) and Mitchell et al. (ref.unique to the experiment. The preliminary analyses 8-4) have shown that the mean porosity at each ofand interpretations presented in this report have been the Apollo sites from footprint analysis is approxi-deduced from studies of extravehicular activity mately the same for the upper few centimeters of(EVA) transcripts and kinescopes, mission photo- soil. Analysis by Costes (ref. 8-5) of vehicle tracks atgraphs, data on the lunar roving vehicle (LRV) £he same Apollo sites and at the Mare Imbrium site ofperformance, debriefings, and limited exaJNnation of the Soviet Luna 17 yields higher average porosityreturned lunar samples by the Lunar Sample Prelimi- values at crater rims and other soft spots than fornary Examination Team (LSPET). firm soiI located in intercrater areas. The soil on
crater rims and on slopes appears to be more variableSUMMARY OF PREVIOUS RESULTS and, on the average,less denseand weaker than does
soil in intercrater plains areas.The mechanical properties of lunar soil as deduced Relative density (or porosity) is probably the most
through the Apollo 15 mission were summarized by important single variable controlling strength, withMitchell et al. (ref. 8-1). The Apollo 16 results agreed most probable values of cohesion in the range of 0.1generally with those of earlier missions and also to 1.0 kN/m 2 and friction angle in the range of 30°provided more specific quantitative information on to 50° . The higher values are associated with higherdensity and strength and their variability than was relative densities.available previously. Even though lunar and terrestrialsoils differ greatly in mineralogical composition, lunar
DATA SOURCES
Soil mechanics data were derived from crewaUniversity of Californiaat Berkeley. commentary and debriefings, television, lunar surfacebNASALyndon B. Johnson SpaceCenter.CNASAMarshallSpace Flight Center. photographs, performance data and observations ofdCalifornia Institute of Technology. interactions between soil and the LRV, drive-tubeepacificGasand Electric Company. and deep drill samples, and sample characteristics as#Principal Investigator. determined by the LSPET.
8-1

8-2 APOLLO 17 PRELIMINARY SCIENCE REPORT
Information from these data sources has been usedin a manner similar to that from previous Apollomissions to deduce qualitative and semiquantitativeinformation about soil properties. A statistical studyof footprint and LRV track depths has been used as abasis for quantitative analysis of near-surface soilporosity. ]?remission orbital photographs and surfacephotographs have indicated a number of bouldertracks on the steep slopes of the North Massif andSouth Massif. These tracks have been analyzed byusing the method of Hovland and Mitchell (ref. 8-6).Additional quantitative estimates have been based onLRV track depths and other specific observations asnoted later in this section.
RESULTS AND INTERPRETATIONS
General Soil Characteristics at themaurus-Littrow Site FIGURE 8-1.-Variable soil conditions in the vicinity of the
surface electrical properties (SEP) experiment as evi-Soil cover is present at all points visited in the denced by variabte depths of LRV tracks and footprints
Taurus-Littrow landing area. The surface is a similar (AS17-141-21517).color (gray and gray-brown) to that at the otherApollo sites, although lighter soil layers were encoun-tered at shallow depths in some areas and orange-colored soil was exposed in a limited zone on the rimof Shorty Crater (station 4). Surface textures rangefrom smooth areas almost free of rock fragmentsthrough patterned ground to areas heavily concen-trated with larger rocks and fragments. Variability insoil properties is evident locally. Qualitative indica-tions of this variability on a meter scale are providedin figures 8-1 to 8-3.Soil behavior during landing, walking, driving, and
sampling was comparable to that observed duringprevious missions. Dust was readily kicked up underfoot and by the LRV, tended to adhere to anysurface with which it came in contact, and inhibitednormal operations on several occasions.As readily apparent from the study of lunar
surface photographs and from crew commentary,disturbed areas on the lunar surface appear darker FIGURE 8-2.-Variable soil conditions in the lightmantle atthan undisturbed areas, as has been the case at the station 3 as evidenced by color differences (AS17-138-previous landing sites. Subsequent crew observations 21148).of the landing sites from lunar orbit indicated thatthe disturbed areas were lighter than the undisturbed from different positions and at different Sun anglesareas. This difference in appearance could indicate rather than from real color changes as a result of thethat the apparent changes in surface color caused by exposure of new material. Alternatively, the differentdisturbance result from texture-related changes in appearance might result from differences in scalealbedo that influence the appearance when viewed between viewing from the surface and from orbit.

SOIL MECttANICS 8-3
,_ Apollo17 timebeforetouchdown,seco Apollo15 'timebeforetouchdown, seco Apollo14 time beforetouchdown, sec
60 I o7050 t_6g ,x .First dust _Apollo151
066 ........ "A--.............. 2"'°_ "'O40 -o6_ oo60 _" o o/ ,n A o o,^ ,Loss0fvisibili_y
1_ 30 C_52 20 oO_O_--O50 au /' (Apollo15)_'_20 bS0 Io_ ._40 /
40Dj=_A _0 Firstdust(Apollo17)/ Groundeleva'tion< 10 ,Z__(Apo,o1410-10 - Gr°lundelevation._w,.,,__ "',Groundelevation
IApollo17)"" _ (Apollo15)-20 I I t _ t I _ I I I I-10 0 i0 20 30 40 50 60 70 80 90 100
Horizontaldistancewith respecttotouchdown,m
FIGURE 8--4.-Descent trajectories for the Apollo 14, 15,and 17 missions.
FIGURE 8-3.-Variable soil conditions inside Shorty Crater(station 4) as evidenced by different surface textures andslopes (AS17-137-21001).
footpad probably hit the lunar surface first and thatthe primary shock absorber may have stroked
Soil Observations During Lunar Module slightly. Photographs (e.g., AS17-134-20388) showDescent and Landing some crumpling of the Mylar insulation on the lowerportion of the leg, indicating a possible stroking of 1
Both the postmission descent trajectory data and or 2 cm. This crumpling did not happen on any of thethe crew comments indicate that the Apollo 17 previous missions. From the photographs, no crushingdescent was fairly rapid with vertical velocities of of or damage to the footpad can be observed.approximately 1 to 1.5 m/sec at altitudes of 60 to 70 As in the other landings, the descent enginem above the lunar surface, slowing to somewhat less exhaust swept the lunar surface in the vicinity of thethan 1 m/sec at an altitude of approximately 15 to 20 landing site. Compared to adjacent areas, there werem. The descent was accompanied by a fairly constant relatively fewer small rock fragments and soil clumpsforward velocity of approximately 0.7 m/sec in the beneath the LM, although rocks 10 cm in diameterfinal 20 m of descent. Thus, the lunar module (LM) and larger remained. The crew observed that therecame in on an oblique trajectory similar to that of v/ere clear indications of the interaction of theApollo 14 (fig. 8-4). Previous analyses and mission descent propulsion system exhaust gas with the lunarresults have shown that this kind of trajectory causes surface to a distance of approximately 50 m from theleast disturbance of the lunar surface material during LM.landing. In contrast, vertical descents, such as that of From the crew's comments during sampling, thethe Apollo 15 LM, generate substantial amounts of lack of blowing dust during the final stages of theerosion. Blowing dust was first observed at a height of descent does not appear to be caused by soilapproximately 20 m above the lunar surface but properties different from those experienced in priorcaused no visibility difficulties during the final landings. As noted in the subsequent sections, thedescent; in fact, the surface remained clearly visible grain-size distribution, cohesion, and density of theall the way to contact, soil around the LM are similar to those previouslyThe descent engine was shut down approximately established for lunar soil. This similarity tends to
1 sec after contact was indicated, and the LM confirm previous conclusions that the amount ofdropped to the lunar surface while maintaining some blowing dust during a landing is directly related toforward velocity. The crew noted that the rear (-Z) the descent trajectory and descent rate.

8-4 APOLLO 17 PRELIMINARY SCIENCE REPORT
Grain-Size Distribution and samplenumbersSoil Composition 70160 7650070180 78420
At the time this report was prepared, the LSPET , 71500 7850073260 79220had determined the complete grain-size distribution ,..; 75060 79260of 15 samples and the distribution of a small aliquot /_",,_; zs0s0of the black soil taken from the bottom of the double ..74220(orangesoil)core-tube sample taken at station 4. The results are toO "/""/ .. ,blacks0,,reinshown in figure 8-5. These gradations are generally _/_ bottomofsimilar to those observed at previous landing sites. _ 80c],_._ _A/A_'_ doublecoreatThe band of 11 samples in figure 8-5 is slightly _" 71_0"_,_._ _'_15y_,,,,._ stati°n4)coarser in the coarse fractions than the composite _ 60 -x_...__distribution band for Apollo 1 1, 12, 14, and 15 (ref. __ 74240Igrayso
8-7), primarily because of the excess particles in the 4)fraction that is > 10 ram. This observation was also 0noted for some of the Apollo 16 soils (ref. 8-4) and g- 2was attributed to the recent addition of coarse
I Ifragments that had not yet been worked into the soil 0 _ .1 .01matrix from the South Ray Crater event. Sample 10 Particlesize,mm71060 was taken at station 1 from beneath a slightoverhang of a rock, and the crew observed that there FIGURE 8-5.-Groin-size distribution curves for severalwere chips in the soil. The distribution for sample Apollo 17samples.74240, the gray soil found next to the orange soil,was changed considerably when the total sample was increases with depth, an observation consistent withincluded, findings at the Apollo 15 and 16 sites (fig. 8-7).Despite the similarity of the grain-size distribu- However, the Apollo 17 core-tube densities (with the
tions of the samples from various stations, the LSPET exception of the double core at station 4) are muchhas found that the composition of the soil is highly more uniform with depth than were the Apollo 15variable in terms of proportions of basalt, breccia, and 16 core-tube samples. The Apollo 17 core-tubemineral fragments, glass, and agglutinates. The softs densities tend to be higher near the surface andfrom the massif stations appear to be derived from slightly lower below a depth of 20 to 30 cm than dobreccias, whereas much of the dark mantle on the the average densities for the Apollo 15 and 16plains was probably derived from basalts. The orange drive-tube samples.soil at station 4 is unique and is composed almost The high core recovery percentages at stations 4entirely of orange glass, and 6 and at the LM are comparable to those of theA knowledge of particle composition is important Apollo 15 and 16 samples for which the same type of
for the interpretation of data from many lunar core tube was used. The lower core recovery percent-experiments because, at the same relative density, ages at stations 3 and 9 indicate that the returnedsoils consisting of coherent particles are stronger and bulk densities will have to be corrected for sampleconduct heat and seismic signals better than soils compression.composed of friable particles. Densities in the double core from the rim of
Shorty Crater at station 4 (2.03 to 2.29 g/cm 3) areCore Samples distinctly higher than heretofore observed for any
Drive Tubes.-Data on the drive-tube samples are lunar samples. The upper tube contains orange-redsummarized in table 8-I, and the sampling at station soil with fine-grained black soil in the lower part.6 is shown in figure 8-6. The bulk densities of the Black soil is exposed at the top and bottom ends ofsamples in the drive tubes as a function of depth in the lower tube. The orange soil, which is composedthe lunar surface are presented in figure 8-7. In all almost entirely of glass particles, is unusually corn-instances, the density of the soil in the lower tube is pact and exhibits a high cohesion. A trench excavatedgreater than that in the upper tube; that is, density into the material illustrates the high cohesion in the

SOIL MECHANICS 8-5
TABLE 8-1.-Preliminary Data on Apollo 1 7 Drive-Tube Samples
Sample Sample Bul,'¢ Tube depth Total depth No. of CoreStation Serial no. Sample no. weight, length, a density, (pushed), (pushed and hammer recovery,
g cm g/cr_ a cm driven), cm blows percent
3 t 2031 73002 b429 21.8 Cl.60 _+0.10 t 9d2046 73001 b809 e34.9 1.73 _ . 70.6 -+5 >> 9 82 -+2%
-_ 2035 74002 b910 33.3 2.0,l f 'ff f'g71 >>28 96 -+34
2044 74001 1071.4 34.9 2.29 " -% p
6 2048 76001 711.6 34.5 Cl.5'7 16.2 +-0.5 37.1 + 0.5 h5 or 6 93 -+21 2037 79002 409.4 19.4 Cl.6'79
2050 79001 743.3 i31.9 il.74 9. g71 + 2 < 19 76 -+2%
LM 2052 70012 J434.8 J18.4 1.77 h28 ± 3 h28 ± 3 0 97 -+10
aDetermined from X-radiographs, except as noted.bSample weights are +-4 g; better accuracy will be possible when _ubes are removed from stretch cans.CCorrected for voids.dCore sample vacuum container.eAssumed length.tCamera failure; photographs were blank.gEstimated from kinescopes.hCrew estimate.
iEither 41 cm3 of sample fell out of the top of the tube or the keeper compressed the top of the sample. The former is con-sidered the more likely explanation; thus, density has been calculated accordingly.
JApproximately 114 cm3 fell out of tile bottom of the tube after it was placed in the sample collection bag because of aloose cap.
tbrm of a tendency of the material to break into Unfortunately, the top of the soil column in thechunks (fig. 8-8). top three drill-stem sections, which were returned as a
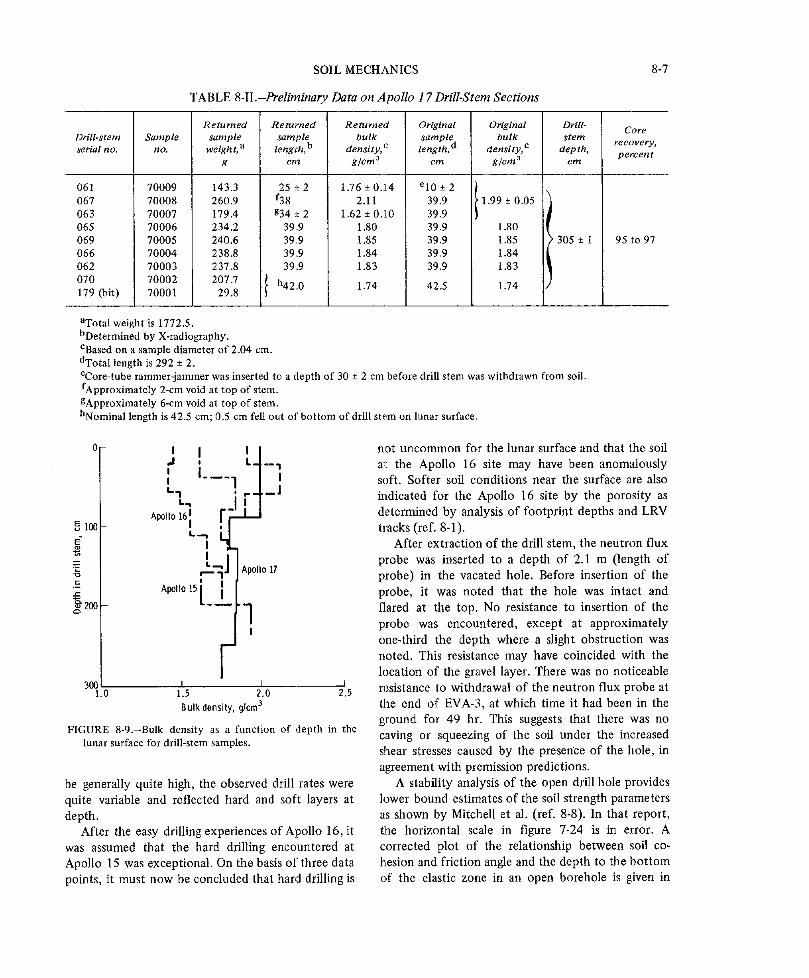
The number of hammer blows (table 8-I), as unit, moved approximately 15 cm, causing someindicated by the kinescopes, required to drive the loosening and disturbance. However, because thecore tube at station 4 was not exceptionally high initial sample length is known, it is possible tocompared to the driving resistance encountered on estimate the initial average density for the top threeearlier missions, indicating that tire porosily was not drill-stem sections to be 1.99 -+0.05 g/cm 3, as shownsignificantly less (or the relative density higher) at in table 8-II.this location than had been previously encountered. The bulk density as a function of depth in theThus, the much higher bulk density is most likely lunar surface for the drill-stem samples is shown incaused by a higher specific gravity of the individual figure 8-9. Values for the Apollo 15 and 16 deepparticles. Whereas the maximum reported value of dIill-stem samples are shown for comparison. Becausespecific gravity is 3.2 for an Apollo 15 sample (ref. the core recovery was nearly 100 percent, the8-2), the soil in the lower half of the double core may measured bulk densities should be quite close to thehave a value as high as 4. The black soil in the double in situ values.core is composed primarily of crystalline droplets, All the bulk densities are high; that of the secondolivine phenocrysts, a trace of glass, and 25-percent drill stem (2.11 g/cm 3) is remarkably so. Theilmenite that has a specific gravity of 4.7. The LSPET X..radiographs indicated this section to be quitehas found that the black material is the first lunar soil gravelly, and dissection by the LSPET has confirmedstudied thus far that contains no agglutinates, this. This zone may be related to the hard layer
Drill Stems.-The deep core was drilled to a depth encountered in the LM area at the end of EVA-3of 3.05 ± 0.01 m at a point approximately 40 m where a single core-tube sample was obtained. Thenorth of the Apollo lunar surface experiment package fourth through the seventh drill stems all have(ALSEP) central station. Core recovery was 95 to 97 essentially the same density; the X-radiographs showpercent, and preliminary data on the eight drill-stem uniformity as well.sections are given in table 8-II. The absolute densities at the Apollo 17 drill site

8-6 APOLLO 17 PRELIMINARY SCIENCE REPORT
0 ,....... [II LM
10 Station 6--!-
Ii :'|....... "_ >-Station9 (?)
E 20 ;tation3(?)!" .... ........._'-- Station4t_,_ ' l
_4o£
50Apollo15and161
II
60 I r -JL ,j
70 I I I1.0 1.5 2.0 2.5
Bulk density,glcm3
FIGURE 8-7.-Bulk density as a function of depth in thelunar surface for drive-tube samples.
FIGURE 8-6.-Single drive tube at station 6. The drive tubehas just been pushed to a depth of approximately 16 era.A special orientation mark is visible above and to the rightof the numeral 8 on the tube. This is the only drive tubefrom Apollo 17 that has been positively oriented in thelunar surface. After this photograph was taken, the drive FIGURE 8°8.-Trench excavated into orange soil on rim oftube was hammered to a final depth of 37 cm (AS17- Shorty Crater at station 4. The chunky texture reflects146-22291). the high cohesion of this soil (AS17-137-20989).
are generally higher than those measured at the 16 and 17 had been available, the predicted drillrateApollo 15 and 16 drill sites, and the distribution of at the Apollo 15 site would have been the same ordensities as a function of depth suggests a deposi- slightly less than that measured at the Apollo 17 site,tional history entirely different from either of the indicating that although the absolute densities in theprevious two sites. The average drill rate of the first Apollo 15 drill stem were less than those of ApolloApollo 17 heat flow borestem was approximately 70 17, the relative densities were generally the same orcm/min, indicating that the relative density at the higher. This indication implies a significantly dif-the Apollo 17 site is considerably higher than that at ferent soil composition. Even though the relativeApollo 16 site. If the later borestem design of Apollo densities at the Apollo 17 drill sites were indicated to
SOIL MECHANICS 8-7
TABLE 8-II.-Preliminar J Data on Apollo 1 7 Drill-Stem Sections
Returned Returned Returned Original Original Drill- Coreill-stem Sample sample sample bulk sample bulk stem recovery,rial no. no. weight,a length, b density, e length, d density, c depth, percent
g cm g/cm 3 cm g/cm a em
_1 70009 143.3 25 :-_2 1.76 -+0.14 elO -+2i7 70008 260.9 f38 2.11 39.9 1.99 -+0.05i3 70007 179.4 g34 :t 2 1.62 -+0.10 39.9i5 70006 234.2 39.9 1.80 39.9 1.80i9 70005 240.6 39.9 1.85 39.9 1.85 ' 305 +-1 95 to 97i6 70004 238.8 39.9 1.84 39.9 1.84
i2 70003 237.8 39.9 1.83 39.9 1.83 ]_0 70002 207.7 f h42.0 1.74 42.5 1.74_9 (bit) 70001 29.8 )
aTotal weight is 1772.5.bDetermined by X-radiography.CBased on a sample diameter of 2.04 cm.dTotal length is 292 ± 2.eCore-tube rammer-jammer was inserted to a depth of 30 +-2 cm before drill stem was withdrawn from soil.fApproximately 2-cm void at top of stem.gApproximately 6-cm void at top of stem.hNominal length is 42.5 cm; 0.5 cm fell out of bottom of drill stem on lunar surface.
0 I I I I not uncommon for the lunar surface and that the soil
,.I , l__t __ at the Apollo 16 site may have been anomalously
i I.... 1 II soft. Softer soil conditions near the surface are also
t._., _l indicated for the Apollo 16 site by the porosity asApollo16! determined by analysis of footprint depths and LRV
100 i tracks (ref. 8-1).E" t...., I After extraction of the drill stem, the neutron flux
I probe was inserted to a depth of 2.1 m (length oft_ Apollo17
_' "--" probe) in the vacated hole. Before insertion of the
=_ Apollol5/ probe, it was noted that the hole was intact and_2oo .... "7 flared at the top. No resistance to insertion of the
l! probe was encountered, except at approximately
one-third the depth where a slight obstruction wasnoted. This resistance may have coincided with thelocation of the gravel layer. There was no noticeable
t I i resistance to withdrawal of the neutron flux probe at3°_.0 1.5 2.0 2.5gulkdensity, g/cm3 the end of EVA-3, at which time it had been in the
ground for 49 hr. This suggests that there was noFIGURE 8-9.-Bulk density as a function of depth in the caving or squeezing of the soil under the increasedlunar surface for drill-stem samples.
shear stresses caused by the presence of the hole, inagreement with premission predictions.
be generally quite high, the observed drill rates were A stability analysis of the open drill hole providesquite variable and reflected hard and soft layers at lower bound estimates of the soil strength parametersdepth, as shown by Mitchell et al. (ref. 8-8). In that report,
After the easy drilling experiences of Apollo 16, it the horizontal scale in figure 7-24 is in error. Awas assumed that the hard drilling encountered at corrected plot of the relationship between soil co-Apollo 15 was exceptional. On the basis of three data hesion and friction angle and the depth to the bottompoints, it must now be concluded that hard drilling is of the elastic zone in an open borehole is given in

8-8 APOLLO 17 PRELIMINARY SCIENCE REPORT
figure 8-10. Below the depth corresponding to any Although the open holes remaining after extrac-given combination of friction angle and cohesion, a tion of the drill stem suggest quite high strengths forplastic zone should develop, and there should be soil depths of approximately 2 m at both the Apollo 16yielding that would lead to closure of the hole by and 17 sites, strengths of this magnitude are notinward squeezing of the soft. commonly encountered at shallow depths as indi-If no yielding of the soil developed to a depth cated by the values determined by penetrometer
corresponding to the length of the neutron flux probe testing at the Apollo 16 site (ref. 8-1).(and little could have occurred because the probediameter is only slightly less than the hole diameter), Boulder Tracksthen the required strength parameters are as indicatedby the vertical line in figure 8-10 at a depth of 2.1 m. More than 300 tracks made by boulders rolling,Even for high friction angles (> 50°), a soil cohesion bouncing, and skidding down lunar slopes wereexceeding 1.0 kN/m 2 is required. Strength parameters identified by Grolier et al. (ref. 8-9) in the Lunarof this magnitude are likely only for conditions of Orbiter photographs. The Apollo 17 mission providedhigh relative density and would be consistent with the the first opportunity for a close study of thesehard drilling discussed previously. High strength is not interesting features because many tracks can be seenrequired for the full depth of the hole. Stability can on the Taurus-Littrow hills. Unfortunately, prints ofbe maintained for conditions of strength increasing the 500-mm lunar surface photographs, which permitwith depth to satisfy figure 8-10 at any depth, the most detailed study of the tracks, were not
available to the soil mechanics team during thepreparation of this report. Hence, the analyses, based
2.5 mainly on 60-mm and premission orbital photo-Frictionangle=30* graphs, are tentative, and the results are subject to
o subsequent refinement. In a qualitative sense, boulder2.0 I 40° tracks serve as exploratory trenches and can provide
L5o information about regolith thickness and history, and
1.5 50° the relative sharpness of track features provides some. indication of soil movement after track formation.o= Quantitative analysis of boulder tracks, from1.0 which information can be derived relating to soil
pio_etr0n strength and density, is possible. Studies of this type
.5 f .... ]iui have been reported by Filice (ref. 8-10), Eggleston etal. (ref. 8-11), Moore (ref. 8-12), Moore et al. (ref.
_" i I I I I I i 8-13), and Hovland and Mitchell (ref. 8-6) for boulder0 .5 1.0 1.5 2.0 2.5 3.o tracks found in Lunar Orbiter photographs. The
Depth0tb0reh01e,ra method in reference 8-6 is used here. An obliqueFIGURE 8-10. Depth to bottom of the elastic zone in an closeup view of a larger boulder and its associatedopen borehole as a function of soil strength parameters, track visited at station 6 on the south slope of the
FIGURE 8-11.-Partial panorama at station 6 showing a laxgeboulder and the track down which itrolled (AS17-141-21582,21584, 21586, 21590, and 21594).

SOIL MECHANICS 8-9
North Massif during EVA-3 is shown in figure 8-11. Sculptured Hills; their locations are indicated inSeveral tracks were located on the premission figure 8-12. Several tracks on the South Massif are
orbital photographs of the East Massif and the identified in figure 8-13. Additional tracks on the
L.__..J530 m ..... Boulder tracks
FIGURE 8-12. Locations of boulder tracks on the East Massif and on the Sculptured Hills. For tracksidentified by a letter, a definite causative bouhler could be located; for tracks identified by anumber, only the most probable causative boulder could be located.
8-12 APOLLO 17 PRELIMINARY SCIENCE REPORT
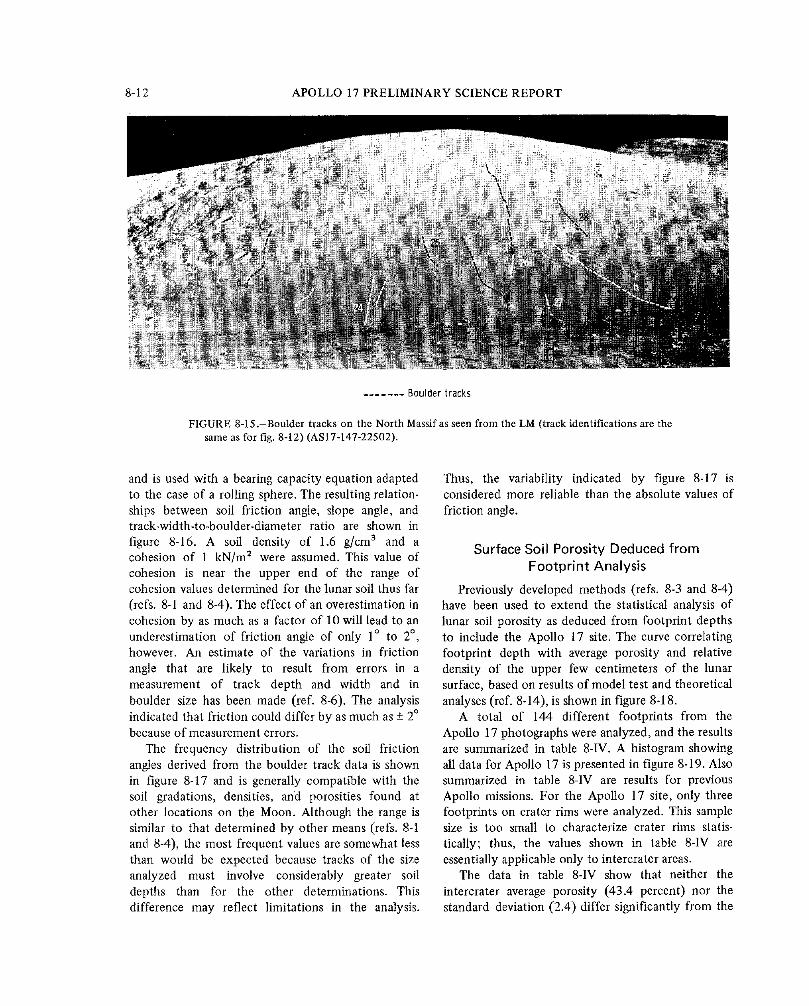
....... Bouldertracks
FIGURE 8-15.-Boulder tracks on the North Massifas seen from the LM (track identifications are thesameas for fig. 8-12) (AS17-147-22502).
and is used with a bearing capacity equationadapted Thus, the variability indicated by figure 8-17 isto the case of a rolling sphere. The resulting relation- considered more reliable than the absolute values ofships between soil friction angle, slope angle, and friction angle.track-width-to-boulder-diameter ratio are shown infigure 8-16. A soft density of 1.6 g/cm 3 and a Surface Soil Porosity Deduced fromcohesion of 1 kN/m 2 were assumed. This value ofcohesion is near the upper end of the range of Footprint Analysiscohesion values determined for the lunar soil thus far Previously developed methods (refs. 8-3 and 8-4)(refs. 8-1 and 8-4). The effect of an overestimation in have been used to extend the statistical analysis ofcohesion by as much as a factor of 10 will lead to an lunar soil porosity as deduced from footprint depthsunderestimation of friction angle of only 1° to 2 °, to include the Apollo 17 site. The curve correlatinghowever. An estimate of the variations in friction footprint depth with average porosity and relativeangle that are likely to result from errors in a density of the upper few centimeters of the lunarmeasurement of track depth and width and in surface, based on results of model test and theoreticalboulder size has been made (ref. 8-6). The analysis analyses (ref. 8-14), is shown in figure 8-18.indicated that friction could differ by as much as-+ 2° A total of 144 different footprints from thebecause of measurement errors. Apollo 17 photographs were analyzed, and the resultsThe frequency distribution of the soil friction are summarized in table 8-IV. A histogram showing
angles derived from the boulder track data is shown all data for Apollo 17 is presented in figure 8-19. Alsoin figure 8-17 and is generally compatible with the summarized in table 8-1V are results for previoussoil gradations, densities, and porosities found at Apollo missions. For the Apollo 17 site, only threeother locations on the Moon. Although the range is footprints on crater rims were analyzed. This samplesimilar to that determined by other means (refs. 8-1 size is too small to characterize crater rims statis-and 8-4), the most frequent values are somewhat less tically; thus, the values shown in table 8-IV arethan would be expected because tracks of the size essentially applicable only to intercrater areas.analyzed must involve considerably greater soil The data in table 8-IV show that neither thedepths than for the other determinations. This intercrater average porosity (43.4 percent) nor thedifference may reflect limitations in the analysis, standard deviation (2.4) differ significantly from the

SOIL MECHANICS 8-13
TABLE 8-III.-Apollo 1 7 BouMer Tracks
Track Slope Track Tracl_ Boulder w Track Friction- depth, angle,no. * angle, length, width, diameter, D
deg km w, m D, m m deg
l 23 1,3 13 17 0.76 3.0 402 26 .6 10 10 1.00 5.0 303 26 .6 8 15 .53 1.1 494 26 .5 5 6 .83 1.3 355 26 .9 12 12 1.00 6.0 306 26 .7 10 16 .62 1.7 46a 26 1.3 9 11 .82 2.4 37b 26 1.7 8 10 .80 2.0 37
7? 25 1.3 262 ....8? 25 1.4 26? - - -
9 27 0.9 10 13 0.77 2.4 3910 27 .9 11 16 .69 2.2 4311 27 2.5 10 13 .77 2.2 3912 27 .5 8 11 .73 1.8 4113 25 .4 l 1 15 .73 2.4 4214 25 .6 14 14 1.00 7.0 3015 25 1.4 12 12 1.00 6.0 30c 25 .8 16 20 .80 4.0 3916 25 _ .1 1.5 - - -17 25 _- .2 3.0? 3.0 1.00 1.5 -18 25 _ .05 1.8 2.l .86 0.5 2719 25 _ .3 5.0 -20 25 _ .1 3.0? 3.0 1.00 1.5 -21 25 _ .3 4.5 ....22 25 _ .3 6.0 ....23 25 _ .2 3.0 2.0? - --
24 26 _ .5 7 - - -25 26 _ .5 8 8 1.00 4.0 2926 26 _ 1.8 10 182 - -27 24 _ .1 3.6 4.5 .80 0.9 3528 24 _ .7 6 8 .75 1.4 39d 24 _ .9 8 10 .80 2.0 38e 24 _ .4 7 9 .78 1.7 38f 26 _ .4 6 6 1.00 3.0 28g 24 _ 1.0 7 8 .88 2.1 33h 23 _ 2.0 8.5 12 .71 1.7 41
letter, a definite causative boulder could be located; for tracks identified by a number, only thecould be located.
Apollo sites. The Apollo one site. Conversely, the weighted average porosityslightly higher. The (44.0 percent) is weighted heavily in favor of Apollo
Apollo 17 also compare ]6 where an unusually large number of footprintaverage values for all observations was possible. Thus, the unweighted
and 2.75) and the un- values (43.5 percent and 2.55) probably represent aand 2.55). The un- better estimate for a randomly selected location on
by computing a simple the lunar surface.averages for each site No distinguishable difference in porosity wasof observations at any found between the Apollo 17 traverse stations and

8-14 APOLLO 17 PRELIMINARY SCIENCE REPORT
606O
40 40 m-o
_30 Ili_ _30,,'- ,.r.
2(] 20 w=1m/
10 10
i i 6| 8 I I I I I J.2 .4 . . 1.0 0 .2 .4 .6 .8 1.0w/D w/D
(a) Slope angle = 0° . (c) Slope angle = 20° .
60 6(
.m \ "k%
_30g __,10 5m o=_30 w=lm/"_. .,=20 20
w=im//_
i0 10
I I I I O_ I I _ I I.2 .4 .6 ,8 1. .2 .4 . .8 1.0wID wlD
(b) Slope angle = 10°. (d) Slope angle = 30°.
FIGURE 8-16.-The relationship between friction angle ¢ and track width to boulder diameter ratiow/D for lunar soil, where soil density ps is 1.6 g/era 3 ; cohesion c is 1kN/m2; and rock density/soildensity #tiPs is 2.

SOIL MECHANICS 8-15
Mean friction ant.lie- 37.3° 70iO Standarddeviation= 5.6*
Numberofobservations- 25
O- 60c
30- _ /_=#. 40 - _- 50_ 50-__= 60
5 _ _70"_ 80 - _ 40
z 90-_ /
3O
20 I I Ii t 0.01 .1 1 10
020 30 40 50 60 Footprint depth, cmFriction angle, deg
]?IGURE 8-18.-Predicted variation of footprint depth withFIGURE 8-17.-Frequency distribution of friction angle average porosity and relative density in the top 10 cm of
values deduced from boulder tracks in the Taurus-Littrow the lunar surface. Average porosity is based on aarea. 58.3-percent maximum and a 31-percent minimum. Foot-
print depth assumes a contact stress of 7 kN/m _ .
TABLE 8-IV. Results of Statistical Analysis of Porosities
Deduced from Foot ;rint Depths
MeanMean
No. of Standard relativeLocation porosity, aobservations deviation density,percent
percent
Apollo 17 siteAll data 144 43.4 2.4 67LM and ALSEP area 80 43.2 2.65 67All traverse stations 64 43.65 1.95 66
Intercrater areasApollo 11 30 43.3 1.8 67Apollo 12 88 42.8 3.1 68Apollo 14 38 43.3 2.2 67Apollo 15 117 43.4 2.9 67Apollo 16 273 45.0 2.8 61.5Apollo 17 141 43.4 2.4 67Apollo 11, 12, 14, and 15 273 b43,2 b2.8 67
All Apollo sitesCrater rims 89 b46.5 b4.3 55.5Intercrater areas 687 b44.0 b2.75 65Intercrater areas 687 c43.5 c2.55 66
a
Based on assumption that nma x = 58.3 percent and nmi n = 31 percent.bWeighted average.CEach Apollo site given equal weight regardless of number of observations.

8-18 APOLLO 17 PRELIMINARY SCIENCE REPORT
LRVA-hr integratorread-0uts: S0ilmodelB From these parameters, pull as a function of slipzx Battery1 (h =35° and torque as a function of slip relationships wereo Battery2 c o0.17kNlm2
Predictedfromsoil k =0.81NIcm3 calculated using analytical expressions developed bymodelB _c@ 0.35Nlcm Bekker (ref. 8-21). These expressions were then used
n : 1.0 as computer input data, together with other informa-K =1.0cmtion relating to the mission, terrain, and vehicle
EVA-I EVA-2 EVA-3 characteristics, to calculate the LRV energy consump-
40iApollol5¢_1' ' I' ' I' "1 tion at each site (ref. 8-19).Apollo 15 Because of the small amount of wheel sinkage, the
- 20F z_._..-----"_ '_'-- LRV wheel/soil interaction with the lunar surface
involved predominantly surface shear. Accordingly, ah---"'q- i I I I0 I
value of q_= 35 ° is consistent with average friction
i EVA-1 EVA-2 EVA-3 angle values deduced from the analysis of LRV tracks
40]' '1" '1' ._ (table 8-V) on the basis of in-place plate shear testsFApollo16 _ performed on a lunar soil simulant (refs. 8-15 and
20_ "'""_'__'-"t I 8-16). The values of coefficients kc and k4_ areconsistent with the average G values deduced from
t I t i LRV tracks (table 8-V). Finally, based on other lunarEVA-I EVA-2 EVA-3 soil mechanics observations and measurements (e.g.,
_ f_ soil erosion during LM descent), an average cohesion
40I, .l, '1' o c_
_> value of 0.17 kN/m 2 for the top surficial material was20 adopted.
I t t I I _ _ In general, the soil/LRV interaction data support0 5 10 15 20 25 30 35 the conclusion that the surficial lunar soil is less
Distancetraversed,km compact, more deformable and compressible, and hasFIGURE8-21.-Measured energy consumption of the LRVin lower strength than does the subsurface material.relation to the predicted values based on the soilproperties indicated.
core-tube samples. As shown in figure 8-21, the same Downslope Movements Caused bysoil model, which had been based on Surveyor data Meteoroid Impactsfor soil near the surface (ref. 8-20), yields results that Houston et al. (ref. 8-22) have assessed the relativeclosely agree with the measured LRV energy con- importance of vibrations induced by meteoroid im-sumption at both the Apollo 16 and 17 sites, pact as a mechanism for mass movement of lunar soilIn figure 8-21, the symbols q_ and c designate, downslope. The seismic energy generated by impacts
respectively, the soil friction angle and cohesion;K is of various-size meteoroids was estimated, and thea normalizing constant conditioning the amount of associated incremental movement was computed forshear strength and the thrust mobilized by the soil at each impact. Movements were summed over the rangea given wheel slip; and ks, kc, and n describe the in meteoroid sizes producing significant movement,pressure-sinkage characteristics of the soil under both with respect to distance from point of impactwheel loads(ref. 8-21). and with respect to time, using meteor flux rates
derived by Gault (ref. 8-23) with an adjustment basedk on more recent estimates of the age of the Moon.
p = ¢ + k@zn (8-2) The results indicated that the flattest slope onwhich significant cumulative downslope soil move-
in which p is the wheel contact pressure in N/cm 2, b ment of approximately 1 m is likely to have occurredis the wheel footprint width in centimeters, and z is because of impact-produced ground accelerations iswheel sinkage in centimeters. If for a given wheel the approximately 25 °. The flattest slope on whichpressure-sinkage relationship is linear (n = 1), the cumulative downslope movement of several hundredcoefficients k c and k4, are analogous to the penetra- to a few thousand meters is likely to have occurred istion resistance gradient of the soil G. approximately 48 °. Because of the great length of

SOIL MECIIANICS 8-19
most of the highland lunar slopes, it is estimated that South Massif. A study of stereographic photographsdownslope movements of a few thousand meters obtained from orbit during the Apollo 17 missionwould be required to cause flattening of the slopes by using the panoramic camera gives some indication ofas much as 1° or 2 °. Thus, it appears that only on a scarp on the South Massif that could define thevery steep lunar slopes could there have been signifi- boundary of a slide mass. Furthermore, according tocant downslope soil movements caused by shaking the LSPET, the light mantle material on the plainsfrom meteoroid impacts alone, and that large-scale appears to be compositionally similar to that fromslope degradation must have developed primarily by the South Massif. Thus, reasonable evidence existsother mechanisms. However, this conclusion does not that a slide or avalanche did occur. If a slide didmean that soil movement, once triggered by meteor- occur, then an important question to be resolved isoid impact, could not continue as a result of changes the mechanism by which the material spread out ontoin strength properties of the soft mass or fiuidization, the valley floor and came to rest with a nearty level
surface.As the slope of the South Massif is only approxi-Origin of the Light Mantle
mately 25° to 30°, meteoroid impact is unlikely toIt has been hypothesized (ref. 8-24) that the light have been able to do much more than just initiate
mantle that extends outward over the plains area movement. Incremental movements accumulatingnorth of the base of the South Massif (fig. 8-22) from impacts alone could not account for theoriginated as an avalanche from the slopes of the magnitude of movements indicated. However, once a
FIGURE 8-22.-Orbital view of the Apollo 17 landing: area. The light mantle to the north of the SouthMassif may have been an avalanche produced by the mechanisms proposed in text. A possible slidescarp can be seen located as indicated on high-resolution panoramic camera photographs (Apollo17 panoramic camera frame AS17-2314).

8-20 APOLLO 17 PRELIMINARY SCIENCE REPORT
slide was triggered, if the soil strength were to those of the soils at the previous Apollo sites.decrease significantly or if the mass became fluidized Although no crew tasks or lunar surface measure-because of the generation or liberation of significant ments were done specifically for the purpose ofquantities of gas, then continued movement might be obtaining quantitative soil mechanics data, a numberpossible, of preliminary analyses and interpretations have been
In the analysis of downslope movements referred made using EVA transcripts and kinescopes, photo-to previously, no change in soil strength was assumed graphs, data on soil/LRV interactions, debriefings,once failure occurred. The nature of lunar soil and limited examination of returned lunar samples.particles, particularly the agglutinates and breccias, is The following specific conclusions have been de-such that particle breakdown during shear is likely, veloped.The results of strength and compression tests on lunar 1. Soil cover is present at all points visited in thesoil samples by Carrier et al. (ref. 8-25) suggest that Taurus-Littrow landing area. Surface textures andparticle breakdown does indeed occur. Mitchell and colors are similar to those at the other Apollo sites.Houston (ref. 8-26) found that decreasing tire particle 2. There is considerable local (meter scale) vari-size of a basalt lunar soil simulant resulted in a ability in soil properties.significant decrease in the angle of internal friction. It 3. Particle-size distributions of samples from dif-is not likely, however, that particle comminution ferent traverse stations are generally similar to eachcould lead to a decrease in friction angle to a value other and to those observed at previous landing sites,less than 25 °, which would be required to result in even though soil compositions are highly variableany slope flattening on the South Massif. A loss in among the stations in terms of proportions of basalt,strength caused by a friction-angle decrease sufficient breccia, mineral fragments, glass, and agglutinates.to allow spreading of the material over the level plains 4. The drive-tube samples indicate some increasedoes not seem possible, in density with depth but more uniformity withThe plausibility of fluidization as a mechanism depth than the Apollo 15 and 16 samples. Soil
hinges on the generation or liberation of sufficient gas density in the double drive tube taken on the rim ofduring the initial stages of movement to provide a Shorty Crater (station 4) is higher than heretoforesufficient uplift pressure on the overlying soil to observed for any lunar sample. The presence of highreduce or eliminate frictional resistance to downslope specific gravity particles, such as ilmenite, is a moremovement. Gas of solar wind origin was liberated in probable cause than is very low porosity.the compression and strength tests described in 5. Absolute densities at the Apollo 17 drill site arereference 8-24; however, the amount was too small generally higher than those measured at the Apolloby orders of magnitude to cause fluidization. Con- 15 and 16 drill sites, and the distribution of densitiesversely, other investigators have generated gas by a with depth suggests a different depositional historycombination of grinding and heating, from that at the previous two sites.Clanton et al. (ref. 8-27) and Bogard et al. (ref. 6. Stability analysis of the open drill-stem hole,
8-28) have confirmed that agglutinates are enriched in into which the neutron flux probe was placed andsolar wind and thus could serve as a source of gas removed without soil resistance, indicates that therewhen broken down. The Apollo 17 soil composition was little or no squeezing or caving of the soil duringanalyses indicate that the samples from the massifs a 49-hr period and that soil strength at a depth of 2 mcontain greater proportions of breccias, approxi- must have been considerably greater than the averagemately the same proportion of agglutinates, and less strength near the surface.basalt than does the dark mantle material on the 7. Tracks caused by the rolling and bouncing ofplains. Thus, a fluidization mechanism may be ten- boulders are common on the slopes of the massifs andable to account for the origin of the light mantle, the Sculptured Hills. A frequency distribution of soilwhereas flnidization would be very unlikely if the friction angles was deduced from rolling bouldermassifs were composed only of ground-up basalt, track data that is consistent with the soil gradations,
densities, and porosities found at other locations onthe Moon, although the absolute values of frictionCONCLUSIONSangle were computed to be somewhat lower than was
The physical and mechanical properties of the soil anticipated.at the Apollo 17 landing site are generally similar to 8. Near-surface soil porosities deduced from foot-

SOIL MECHANICS 8-21
print depths indicate that neither the intercrater Science Conference (Houston, Tex.),Mar. 5-8, 1973), pp.average porosity nor the standard deviation differ 118-120.significantly from the average values for previous 8-3. Houston, W. N.; Hovland, H. 1.; and Mitchell, 1. K.:Lunar Soil Porosity and Its Variation as Estimated fromApollo sites. The average relative density for all Footprints and Boulder Tracks. Proceedings of the ThirdApollo landing sites, as deduced from 687 observa- Lunar Science Conference, vol, 3, MIT Press (Cambridge,tions of footprint depth, is approximately 66 percent. Mass.), 1972, pp. 3255-3263.Large local (meter scale) variations exist in porosity 8-4. Mitchell, J. K.; Carrier, W. D., 1II; Houston, W. N.;and relative density. Scott, R. F.; et at.: Soil Mechanics. Sec. 8 of the Apollo16 Preliminary Science Report. NASA SP-315, 1972.
9. The LRV performance, including slope- 8-5. Costes, N. C.: Regional Variations in Physical andclimbing capability and power consumption, was Mechanical Properties of Lunar Surface Regolith. Lunarwithin the predicted limits. Analysis of track depth, Science IV (Abs. of papers presented at the Fourth Lunarshape, and texture indicated no discernible variations Science Conference (Houston, Tex.), Mar. 5-8, 1973), pp.159-161.in the average consistency of the surface soil through- 8-6. Hovland, H, J.; and Mitchell, J. K.: Mechanics of Rollingout the Taurus-Littrow region or relative to the Sphere-Soil Slope Interaction. Final Rept. (NASA Con-Apollo 14 through 17 and Luna 17 landing sites, tract NAS 8-21432), Vol. lI, Space Sci. Lab., Univ. ofalthough variations about the average existed on a California at Berkeley, July 1971.small scale at all sites. 8-7. Carrier, W. D., lII: Lunar Soil Grain Size Distribution.
o The Moon, vol. 8, 1973.10. Only on very steep lunar slopes ('> 25 ) could 8-8. Mitchell, J. K.; Bromwell, L. G.; Carrier, W. D., Ill;
there have been significant downslope soil movements Costes, N. C.; et al.: Soil-Mechanics Experiment, Sec. 7 ofcaused by shaking from meteoroid impacts alone, and the Apollo 15 Preliminary Science Report_ NASA SP-289,large-scale slope degradation must have developed 1972.primarily by other mechanisms. 8-9. Grolier, M. L; Moore, H. J.; and Martin, G. L.: Lunar
Block Tracks. A Preliminary Geologic Evaluation of Areas11. There is evidence to support an avalanche asPhotographed by Lunar-Orbiter V Including an Apollo
tile origin of the light mantle covering the plains Landing Analysis of One of the Areas. NASA Langleynorth of the South Massif. Fluidization of the soil Research Center, Rept. LWP-506, 1968, pp. 143-154.mass by gas pressures generated during the initial 8-10. Filice, A. L.: Lunar Surface Strength Estimate fromphases of soil movement would be required to Orbiter II Photographs. Science, vol. 156, no. 3781,Juneaccount for the large-scale movements observed. 16, 1967, pp. 1486-1487.
Finally, soil mechanics data from all the Apollo 8-11. Eggleston, J. M.; Patterson, A. W.; Throop, 1. E.;Arant, W. H.; and Spooner, D. L.: Lunar Rolling Stones.missions support the general conclusion that proc- Pbotogrammetric Eng., vol. 34, no. 3, Mar. 1968, pp.esses affecting the entire lunar surface, such as 246-255.meteoroid impact and the solar wind, control the 8-12. Moore, H. J.: Estimates of the Mechanical Properties
of Lunar Surface Using Tracks and Secondary hnpactaverage properties such as grain-size distribution and Craters Produced by Blocks and Boulders. U.S. Geol.relative density, which are nearly the same at all sites. Survey Interagency Rept.: Astrogeology 22, July 1970.On the average, the soil on slopes is less dense than 8-13. Moore, H. J.; Vischer, W. A.; and Martin, G. L.:the soil on level areas because of the effects of Boulder Tracks on the Moon and Earth. U.S. Geol. Survey
Prof. Paper 800-B, 1972, pp. B165-B174.downslope movement. Local geology and topography 8-14. Houston, W. N.; and Namiq, L. I.: Penetration Resis-on a small scale and specific cratering events appear tance of Lunar Soils. J. Terramechanics, vol. 8, no. 1,to control the variations about the aw_rage to the 1971, pp. 59-69.extent that the standard deviation can be relatively 8-15. Green, A. J.; and Melzer, K. J.: Performance of thelarge. Boeing LRV Wheels in a Lunar Soil Simulant: Effect of
Wheel Design and Soil. Tech, Rept. M-71-10, Rept. 1,USAE WES, Vicksburg, Miss., 1971.
F1I::F E R E N GI:S 8-16. Melzer, K. J.: Performance of the Boeing LRV Wheelsin a Lunar Soil Simulant: Effect of Speed, Wheel Load,
8-1. Mitchell, J. K.; Houston, W. N.; Scott, R.F.;Costes, N. and Soft. Tech. Rept. M-71-10, Rept. 2, USAE WES,C.; et al.: Mechanical Properties of Lunar Soil: Density, Vicksburg, Miss., 1971.Porosity, Cohesion, and Angle of Internal Friction. 8-17. Vinogradov, A. P., ed.: Lunokhod-1, Mobile LunarProceedings of the Third Lunar Science Conference, vol. Laboratory. Nanka Publishers (Moscow), 1971. (Available3, MIT Press (Cambridge, Mass.), 1972, pp. 3235-3253. from National Technical Information Service, Springfield,
8-2. Carrier, W. D., III; Mitchell, J. K.; and Mahmood, Virginia.)Arshud: The Relative Density of Lunar Soil. Lunar 8-18. Mitchell, J. K.; Bromwell, L. G.; Carrier, W. D., 1II;Science IV (Abs. of papers presented at the Fourth Lunar Costes, N. C.; and Scott, R. F.: Soil Mechanical Properties
8-22 APOLLO 17 PRELIMINARY SCIENCE REPORT
at the Apollo 14 Site. J. Geophys. Res., vol. 77, no. 29, 8-24. Howard, K. A.: Ltmar Avalanches. Lunar Science IVOct. 10, 1972, pp. 5641-5664. (Abs. of papers presented at the Fourth Lunar Science
8-19. Costes, N. C.; Farmer, J. E.; and George, E.B.: Conference (Houston, Tex.), Mar. 5-8, 1973), pp.Mobility Performance of the Lunar Roving Vehicle. 386-388.Terrestrial Studies: Apollo 15 Results. NASA TR R-401, 8-25. Carrier, W. D., III; Bromwell, L. G.; and Martin, R. T.:1972. Behavior of Returned Lunar Soil in Vacuum. J. Soil
8-20. Scott, R. F.; and Roberson, F. I.: Soil Mechanics Mechanics Foundations Div., ASCE, Nov. 1973.Surface Sampler. Part II: Surveyor Ploject Final Report, 8-26. Mitchell, J. K.; and Houston, W. N.: Lunar SurfaceCalif. Inst. Tech. JPL-TR-32-1265, 1968, pp. 195-207. Engineering Properties Experiment Definition. Final
8-21. Bekker, M. G.: Introduction to Terrain-Vehicle Sys- Rept., Vol. 1 (NASA CR-102963), Space Sci. Lab., Univ.of California at Berkeley, 1970.tems. The University of Michigan Press (Ann Arbor, 8-27. Clanton, U. S.; McKay, D. S.; Taylor, R. M.; andMich.), 1969. Heiken, G. H.: Relationship of Exposure Age to Size
8-22. Houston, W. N.; Moriwaki, Y.; and Chang, C.S.: Distribution and Particle Types in the Apollo 15 DrillDownslope Movement of Lunar Soil and Rock Caused by Core, The Apollo 15 Lunar Samples, Lunar ScienceMeteor Impact. Lunar Science IV (Abs. of papers pre- Institute (Houston, Tex.), 1972, pp. 54-56.sented at the Fourth Lunar Science Conference (Houston, 8-28. Bogard, D. D.; Nyquist, L. E.; Hirsch, W. C.; andTex.), Mar. 5-8, 1973), pp. 384-385. Moore, D. R.: Trapped Noble Gas Abundances in Surface
8-23. Gault, D. E.: Satttration and Equilibrium Conditions and Sub-Surface Fines From Apollo 15 and 16. Lunarfor Impact Cratering on the Lunar Surface: Criteria and Science IV (Abs. of papers presented at the Fourth LunarImplications. Radio Sci., vol. 5, no. 2, Feb. 1970, pp. Science Conference (Houston, Tex.), Mar. 5-8, 1973), pp.273-291. 79-81.