8. petrology and geochemistry of basalts from hole … · petrology and geochemistry of basalts...
TRANSCRIPT

8. PETROLOGY AND GEOCHEMISTRY OF BASALTS FROM HOLE 396B, LEG 46
M.F.J. Flower, 1,2 W. Ohnmacht,1 H.-U. Schmincke, l ,3I.L. Gibson, 4,5 P.T. Robinson,6 and R. Parker7
ABSTRACT
Basalts from the upper 255 meters of the oceanic crust at Site 396Bshow moderately large variations in petrography, mineralogy, andchemistry. The upper part of the section comprises aphyric basalt withrare, rounded plagioclase phenocrysts and lesser amounts of olivine. Thecentral part of the section is olivine and plagioclase phyric with modalabundances ranging from about 10 to 30 per cent. The lowest part of thesequence is moderately phyric with widely varying abundances of olivineand plagioclase phenocrysts. Clinopyroxene phenocrysts occur in onlyone rock. Co-existing olivine and plagioclase phenocrysts exhibit bothnormal and reverse zoning which suggests mixing of different magmabatches prior to eruption.
Major and trace element compositions of glass and whole rock basaltsamples from Hole 396B suggest the following:
a) The two major basaltic magma types are a Ti-poor, Ca-rich ("X")type and Ti-rich, Ca-poor ("Y") type.
b) Different magma batches may represent separate fractions of thesame differentiating parent liquid, or may reflect fractionation "events"acting upon similar or distinct liquid compositions. In either case,eruptive products of any one batch show a characteristic chemistry andlithology.
c) Different magma batches appear to have been erupted in acontiguous time sequence except for minor amounts of extremedifferentiates interlayered with lavas from unrelated batches. However,eruption of different batches deriving from a single liquid type may beseparated by relatively large time intervals.
d) "X"-type and "Y"-type liquids are characterized by different lowpressure crystal-liquid phase equilibria. Plagioclase apparentlyprecipitated at higher temperatures compared to olivine andclinopyroxene, for equivalent MgO content in "X"-type than in"Y"-type liquids.
e) Leg 46 basalts generally have higher Na, Ti, and large ionlithophile (LIL) element abundances for equivalent MgO content thanbasaltic magmas from other parts of the Mid-Atlantic Ridge (e.g.,FAMOUS). We tentatively suggest that these differences reflect lowerdegrees of partial melting at 22°N and are a reflection of ambientgeothermal conditions.
INTRODUCTION
Leg 46 of the Deep Sea Drilling Project drilled basalticbasement to a depth of 255 meters at Site 396, located at
'Inst. für Mineralogic der Ruhr-Universitàt, 463 Bochum, W. Germany.2Also at Imperial College, London, SW7 2BP, U.K.3On leave at Department of Geological Sciences, University of
California, Santa Barbara, California U.S.A."Department of Geology, Bedford College, London, NWI, U.K.5On leave at Department of Geology, Dalhousie University, Halifax,
Nova Scotia, Canada."Department of Earth Sciences, University of California, Riverside,
California U.S.A.department of Geology/Imperial College, London, SW7 2BP, U.K.
22°59.14'N and 43°30.90'W about 150 km east of the axialpart of the Mid-Atlantic Ridge (Figure 1). Shipboard studiesof the drilled rocks showed significant variations Inpetrography, mineralogy, and chemical composition;several distinct lithological, chemical, and magnetic unitswere defined.
We have undertaken a petrographic, mineralogical, andchemical study of selected rocks from the entirestratigraphic section in order to: (1) study the modal andchemical composition of phenocryst phases; (2) identify andcharacterize compositional groups from glass and wholerock chemical compositions; (3) determine the relationshipbetween whole rock and glass chemistry and the nature andextent of chemical differentiation; (4) study the relation intime of cogenetic (or unrelated) magmas with physical
179

M. F. J. FLOWER ET AL.
TABLE 1Key to Bochum (lab) Numbers and Methods of Analysis
for Samples From Hole 396B
Figure 1. Location map showing Sites 395 and 396 on theMid-Atlantic Ridge at 22°N, in comparison with Leg 37,Site 332.
characteristics such as magnetic polarity in order to developconstraints on the eruptive, tectonic, and geothermalprocesses operating at the rift.
Throughout this report, we refer to the analyzedspecimens by their Bochum computer file numbers. TheseBochum sample numbers are cross-referenced to respectiveDSDP numbers and approximate sub-bottom depths inTable 1. Thirty microprobe analyses of glassy cooling rindsof pillows, sideromelane breccias, and hyaloclastites aregiven in Table 2; about 40 analyses for major and traceelements are given in Tables 3 and 4. Sixteen specimenswere analyzed for rare earth elements (REE), Th, Ta, andHf (Table 5). About 40 mineral compositions weredetermined for phenocryst and groundmass phases (Tables 6through 8), and modal analyses were made for 14 selectedspecimens (Table 9).
ANALYTICAL TECHNIQUES
Mineral Analyses
Analyses were performed with an automatic ARLelectron microprobe SEMQ with 6 channels (ETH, Zurich).Acceleration voltage was 15 kv, sample current 20 na. Kaiphalines were taken for all elements (Si, Al, Fe, Mg, Ca, Na,K, Ti, Mn, and Cr). Standards used were naturalclinopyroxene (for Si, Mg, and Ca), garnet (Al and Fe),labradorite (Na), orthoclase (K), sphene (Ti), chromite(Cr), and a synthetic glass of Mn-garnet composition (Mn).Data reduction was achieved with the aid of programEMMA (ETH, Zurich) which corrects raw microprobe data
BochumSample
No.
10205060708590
110120
140150180210230240260290320
400420450470500515520530590600610
620630690700710730
750/760780
810840
860/870880890910930940970980
100010201030106010701080109011001110114011651170118011901200
124012501280129013001350
13601370
Sample(Interval in cm)
(Piece No. in parentheses)
4-1,72-77(6)4-1, 80-87 (7A)5-2, 87-93 (9)6-1,87-89(11)7-1, 25-30 (4)7-1,50-57(7)7-1,60-62(8)7-2,107-113(10)7-2, 127-130(12)
8-1, 128-135 (14B)8-2,3-7(1)9-1,75-80(10)9-2, 125-128 (16)
10-1, 66-68 (10)10-1,70-76(11)11-2, 27-33 (3A)13-1,13-18(2)13-2,28-33(4)
14-1, 121-127 (9)14-2, 31-38 (4A)14-3, 27-33 (2)15-1, 116-120(121)15-2, 111-115 (2A)15-2, 120-133(2015-2, 141-147 (21)15-3, 7-15 (2A)15-4, 132-141 (8A)15-5, 102-105(13)15-5, 108-111 (14)
16-1, 97-102 (10F)16-2, 107-113(9)16-4,63-68(8)16-5, 34-36 (4B)17-1,4-7 (1)17-2, 43-49 (3)17-3,108-112(9)18-1,22-27 (2)
20-1, 13-18(1)20-1, 35-42 (4A)20-1, 70-80 (4E)20-1, 131-132(5)20-1, 139-141(6)20-2, 58-67 (5B)20-3, 3-10 (1)20-3, 21-27 (3)20-4, 6-7 (1)20-4, 33-39 (5)20-4, 112-121 (12F)20-5, 60-68 (8)20-6,13-20(2)21-1,3-10(1)21-1, 102-110 (12A)21-2,43-44(4)22-1,30-38(5)22-1,125-134(14)22-2,8-12(1)22-2,122-144(71)22-3, 28-38 (2A)22-3, 49-56 (3A)22-3, 92-98 (7A)22-4, 4-9 (1A)22-4, 23-26 (3)
24-1,15-16(3)24-1,19-23 (4)24-1, 88-90 (14)25-1,3-5(1)28-1,4-5(1)30-1, 84-86 (1)
32-1, 11-13(2)32-1,59-62(9)
Sub-basementDepth (m)
1.992.20
10.9921.7424.2824.5025.2630.9931.56
38.2939.2644.6250.1254.3354.8763.6865.5370.61
77.9179.1282.8286.0787.9987.2788.4188.6492.2993.8593.93
97.08102.09110.02113.75117.05118.99121.18122.87
136.18136.45136.88137.54137.65138.50139.61139.82141.38141.73142.68143.83145.04145.78150.53154.67155.61157.32157.88160.00160.75161.34162.11163.21163.37
175.42175.99182.45186.67209.87231.23
237.09241.43
Analysis
GR,GR, M
GRRRRR
RG,M
RGGG
R, MGG
R, G, MR
R, GRMRRRR
MoM
R, MR
MoR
R.MoR
R, G, MR, G
GR, Mo
G, M, MoG
G, MoR, G, M
MR, Mo
GG, MoG, Mo
R, M, MoR, MoR, Mo
RG
R, MoR, G, MR, Mo
MoRR
R, MoRM
GG
G.MGG
G, M
R,MoR, M, Mo
ShipboardChem. Unit
A-l
A-2
A-3
ü 1
D-i
B-2
p
D
Note: R = whole rock chemical composition, G = glass microprobe composition,M = mineral microprobe composition, Mo = modal analysis.
180

PETROLOGY AND GEOCHEMISTRY
for absorption, fluorescence by characteristic andcontinuous radiation, backscatter losses, andionization-penetration losses. Results are believed to beaccurate to about 1 to 2 relative per cent for major elements.
Glass Analyses
Glass analyses were performed on an automated MACmodel 5-SA3 electron microprobe, Division of Geologicaland Planetary Sciences, California Institute of Technology,Pasadena. Standards and data reduction are based on aprogram by A.A. Chodos. Sample current for all analyseswas 0.01 µa and the spot diameter was 30 to 40 µm.Wherever possible, two or more spots were analyzed foreach specimen and the results averaged (Table 2).
Major Element Whole Rock Analyses
Major elements were determined by X-ray fractionation(XRF) methods using a Phillips PW 1410 under thefollowing conditions:
SiO2, A12O3, P 2 O 5 Fe 2 O 3 ,K 2 O CaO, TiO2
Tube CrGenerator 50kv, 30ma 50kv, 30ma 45kv, 18maDetector Flow Counter (1.7kv)Path Vacuum (<0.3 Torr)Collimator Coarse Fine FineCrystal PE LiF (200) LiF (200)Line kαSample holder Electrolyte-Cu
Glass discs were prepared of international standards, Leg46 standards, and Leg 46 rock powders using the followingproportions: 5.15 grams LiBO2 (dried at 550°C, 1 hr.); 0.70grams La2U3 (dried at 900°C, 1 hr.); 1.20 grams rockpowder (dried at 1000°C, 2 hr.); and 0.05 grams LiNOs. Alldiscs were ground and polished before being analyzed. Theraw data were corrected for background and drift.Least-squares calibration curves for each oxide werecomputed using the data of Abbey (1973), multiplied byloss-on-ignition (LOI) factors. LOI was determined onpowders dried at 110°C for 24 hours. No corrections weremade for Ca-P spectral interferences; however, the error forP is thought to be negligible because unknowns andstandards are similar in composition.
Determinations of FeO, Na2O, MnO, CO2, and H2Owere done potentiometrically, by AAS, coulorimetrictitration (CTA-5 analyzer), and coulorimetricKarl-Fischer-titration (AQUATEST-analyzer). Theanalytical results for three Leg 46 interlab comparisonsamples are included in Table 3 as Bochum sample numbers85, 515, and 1165 (DSDP Samples 396B-7-1, 50-57 cm;15-2, 120-133 cm; and 22-3, 28-38 cm; respectively) alongwith the other major element data.
Trace Element Whole Rock Analyses (XRF)
The XRF trace element determinations were done onwhole rock pressed powder pellets using a Philips 1212automatic X-ray fluorescence spectrometer. Sr, Rb, and Ywere analyzed using a Mo X-ray tube, a LiF22o diffractioncrystal, and a fine collimator. The remaining trace elementswere analyzed using the same diffraction crystal andcollimator, and a W X-ray tube. The scintillation and flowproportional counters were used for all elements. The raw
data were processed using a modified form of a computerprogram supplied by B. Gunn. Corrections were made inthis program for dead time, matrix effects (using whole rockmajor element oxide data), line interference, and X-ray tubespectral contamination.
Three standards (W-I, AGV, and BCR) were analyzedwith the samples and the values obtained for these standardsare listed in Table 4. This table also lists the valuesrecommended by Flanagan (1973), Abbey (1973), andWillis et al. (1972).
Instrumental Neutron Activation Analyses
The trace elements (Ta, Hf, and Th) and the rare earthelements (Ce, Nd, Eu, Tb, Yb, and Lu) were determined byinstrumental neutron activation analysis (Gordon et al.,1968). Accurately weighed powdered rock samples (—0.5g) were irradiated for 40 hours at a flux of 1 × 10¹²n cm ~2
sec ~1 at the University of London Reactor Center, SilwoodPark, Ascot. After a one-week delay to allow for the decayof interfering short-lived activities, the samples werecounted using a planar Ge(Li) 1-cm3 low energy photondetector with a resolution of 640ev at 122kev. The gammaspectra were recorded on a 1028 channel multi-channelanalyzer. Data reduction was by means of the photopeakmethod of Routi and Prussin (1969).
U.S. Geological Survey Standards G2, AGV, BCR,W-l, and GSP-1 were used for primary calibration and theAlisa Craig granite, supplied by the Open University, wasused as a radiation standard. Results for two determinationsof NIM-G (Table 5) give an indication of the accuracy andprecision of the method.
LITHOLOGY AND PETROGRAPHYHole 396B penetrated 255 meters into acoustic basement.
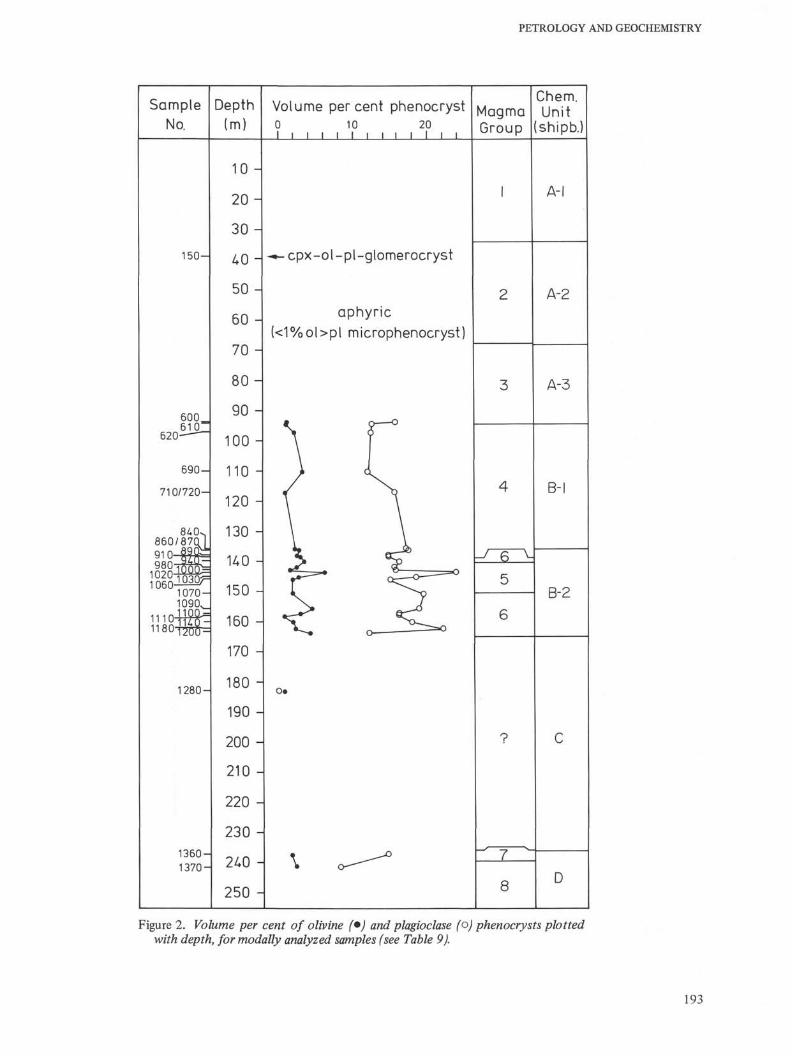
Recovery averaged about 23 per cent but was much higher inthe upper pillowed sequence than in the lower clastic units.Eight lithologic units were defined by the Shipboard Partyaccording to type and abundance of phenocrysts andstructural character. Units 1 and 2 are pillow basalts and Unit3 is a thick flow of very sparsely (<2 modal %) olivine andplagioclase phyric basalt. Unit 4 is highlyplagioclase-olivine-spinel phyric basalt and Unit 5 is sparselyplagioclase-olivine phyric pillow basalt. Units 6 and 8 arecomposed mostly of uncemented clastic deposits("hyaloclastite") with a thin interlayered pillow zone (Unit7). These rocks vary from sparsely to moderately olivine andplagioclase phyric. (The "hyaloclasfite" is discussed indetail by Schmincke et al., this volume.) Modal analyses ofrepresentative samples are given in Table 9 and plotted inFigure 2.
Phenocrysts in shipboard chemical Units B-l, B-2, and Cmake up 15 to 20 volume per cent with a maximum of about25 per cent, plagioclase being about 5 to 10 times as abundantas olivine. Sparse spinel occurs as inclusions and singlephenocrysts in a few samples and clinopyroxene phenocrystsoccur in glomerophyric clusters with plagioclase and olivinein one sample only. Groundmass phases are plagioclase,olivine, and clinopyroxene with glass and oxides. Alterationproducts are common but generally subordinate andcomprise smectite, carbonate, and zeolites. Phenocrysts aregenerally fresh, although olivine is completely altered in
181

M. F. J. FLOWER ET AL.
TABLE 2Microprobe Analyses (%) of Basalt Glass, Leg 46, Hole 396B (sample current 0.01 µa, spot diameter 30-40 µm)
Bochum No.
Sample(Interval in cm)
ShipboardChem. Unit
Glass Group
SiO2
TiO2
A12O3
FeO*
MnO
MgO
CaO
Na2O
K2Op 2 θ 5
Cr2O3
NiO
BaO
so3
Total
No. ofAnalyses
10
4-1,72-77
A-l
X-l
50.85
1.45
15.01
8.96
0.24
8.65
11.66
2.73
0.16
0.08
-
-
-
0.13
99.92
1
20
4-1,80-87
A-l
X-l
50.58
1.42
14.95
9.33
0.16
8.23
11.59
2.79
0.12
0.1 3
0.04
0.04
0.13
99.51
2
60
6-1,87-89
A-l
X-l
50.44
1.44
15.15
9.18
0.17
8.33
11.45
2.60
0.10
0.09
0.04
-
-
0.10
99.09
2
150
8-2,3-7
A-2
Y-l
50.99
1.57
14.99
9.29
0.15
7.94
11.25
2.90
0.11
0.15
0.04
-
-
0.09
99.37
2
210
9-2,125-128
A-2
Y-l
50.48
1.56
15.47
9.31
0.18
8.28
11.38
3.00
0.13
0.25
0.07
-
_
0.17
100.28
1
230
10-1,66-68
A-2
Y-l
51.14
1.54
14.93
9.43
0.16
7.53
11.34
2.85
0.11
0.19
0.04
-
0.08
. 0.11
99.45
2
240
10-1,70-76
A-2
Y-l
50.92
1.49
14.78
9.51
0.21
7.98
11.04
2,92
0.11
0.17
0.08
-
0.25
0.14
99.60
2
290
13-1,13-18
A-2
Y-l
51.09
1.50
15.79
9.03
0.20
7.83
10.87
2.80
0.13
0.18
-
-
0.25
0.08
99.75
1
320
13-2,28-33
A-3
Y-l
51.05
1.54
15.25
9.59
0.18
8.04
11.24
2.98
0.13
0.17
0.11
0.06-
0.10
100.44
2
400
14-1,121-127
A-3
Y-l
50.35
1.55
14.98
9.33
0.14
8.20
11.29
2.88
0.13
0.15
_
0.04
-
0.14
99.18
1
450
14-3,27-33,
A-3
Y-2
50.18
1.71
15.24
10.03
0.16
7.58
10.90
3.24
0.09
0.21
-
-
_
0.14
99.48
2
750
17-3,108-112
B-l
X-2
50.61
1.44
1-5.28
9.51
0.13
7.93
11.58
2.95
0.10
0.16
0.06
0.07
-
0.09
99.91
1
780
18-1,22-27
B-l
X-2
50.62
1.45
14.82
9.40
0.16
7.60
11.73
2.76
0.08
0.16
-
-
0.18
0.13
99.09
3
810
20-1,13-18
B-2
X-2
49.81
1.42
14.81
9.34
0.20
7.83
11.75
2.82
0.11
0.09
-
-
-
0.11
98.29
3
870
20-1,70-80
B-2
X-2
49.83
1.43
14.95
9.35
0.16
7.70
11.90
2.89
0.15
0.08
0.05
-
0.10
0.14
98.73
2
880
20-1,131-132
B-2
X-2
50.04
1.39
15.65
9.24
0.18
7.72
11.61
2.78
0.15
0.16
0.04
-
-
0.17
99.13
2
890
20-1,139-141
B-2
X-2
49.52
1.38
16.31
9.17
0.19
7.93
11.61
2.80
0.09
0.13
-
-
-
0.12
99.25
1
some samples, particularly in the lower part of shipboardchemical Unit B-2 and the upper part of shipboard chemicalUnit C (see also Honnorez et al. this volume). Phenocrysts inmany rocks exhibit disequilibrium textural features (Plates 1through 5). For example, plagioclase phenocrysts in rocks ofshipboard chemical Unit A are generally rounded; in morephyric units, both euhedral and highly resorbed plagioclaseand olivine phenocrysts co-exist. Vesicles make up as muchas 2 per cent of some rocks and, generally, the most phyricrocks also contain the most vesicles. Fresh glass as pillowrinds or clastic shards is common throughout the section.
MINERAL CHEMISTRY
Olivine
About 65 analyses of olivine phenocrysts and a fewgroundmass crystals were made from 17 samplesrepresenting all lithologic units. Phenocryst compositionsvary from Fθ89.β to Foss.o. Compositions of groundmassolivine range from Fose (Bochum Sample 620; DSDPSample 396B-16-1, 97-102 cm) to Fo7β (Bochum Sample500; DSDP Sample 396B-15-2, 111-115 cm). Traces of Ca,Mn, Cr, and Ti are present in the structural formulas, butnever exceed 0.5 mole per cent (Table 6). Figure 3 shows aplot of Fo content in olivines versus depth. Both normal andreverse zoning occur in some cases within the same rock.Olivines from shipboard chemical Unit B generally havehigher Fo contents and a greater compositional range thanthose from shipboard chemical Units A and C.
Plagioclase
About 110 analyses of plagioclase phenocrysts andgroundmass crystals were made for 17 samples from alllithologic units. Compositional zoning is normal, reverse, oroscillatory (sometimes within the same specimen).Phenocryst compositions range from Ansβ to Am 5 andgroundmass compositions are between Anβs and Anso, if An,Ab, K feldspar -I- Ca(Mg,Fe)Si3θs components = 1 0 0 per
cent. Ca was not computed entirely as anorthite component.Figure 4 shows that the Ca(Mg,Fe)Si3θs component is lowerfor phenocrysts than for groundmass crystals. Within eachgroup, no strong correlation exists: Ca(Mg,Fe)Si3θ8 isapproximately constant for varying An content.
In Figure 3, the ranges for An and Ca(Mg,Fe)Si3θβcontents of phenocrysts are plotted versus depth. The meanvalues for both components yield a perfectly symmetricaldistribution (i.e., the higher the An-content, the lower theCa(Mg,Fe)Si3θβ content), a feature also characteristic of thegroundmass crystals. The K-feldspar content never exceeds0.84 mole per cent for either phenocrysts or groundmasscrystals.
Clinopyroxene
In Bochum Sample 150 (DSDP Sample 396B-8-2, 3-7cm), a coarse glomerophyric clot of olivine, plagioclase, andclinopyroxene occurs. From core to rim of a clinopyroxenephenocryst, the following compositions (expressed asstructural formulae based on 8 oxygens) were found:
Na C Mg
0.022 0.796 0.1850.026 0.801 0.1850.024 0.796 0.174
Mg l e Mn Al Cr
0.756 0.129 0.003 0.075 0.0370.751 0.127 0.005 0.079 0.0380.769 0.127 0.004 0.069 0.031
0.090 1.894 0.0140.091 1.891 0.0120.076 1.916 0.011
Two groundmass clinopyroxene crystals in Bochum Sample 500 (D.S.D.P. Sample 396B-15 -2,111-115 cm) gave the following:
0.032 0.766 0.2500.028 0.755 0.260
0.530 0.376 0.011 0.081 0.0020.554 0.362 0.010 0.071 0.002
0.051 1.880 0.0450.045 1.890 0.043
Analyzed crystals are shown in Plates 1 through 5.
MAJOR ELEMENT CHEMISTRY
Glass
Fresh glasses representing glassy cooling rinds of pillows,sideromelane breccias, and hyaloclastites were sampled fromas many shipboard-defined chemical units as possible (A-1,A-2, A-3, B-l, B-2, and C). Analyses of 30glass samples aregiven in Table 2 and plotted with depth in Figure 5. For any
182

PETROLOGY AND GEOCHEMISTRY
TABLE 2 - Continued
910
20-2,58-67
B-2
X-2
970
20-4,6-7
B-2
X-3
980
20-4,33-39
B-2
X-3
1000
20-4,112-121
B-2
X-3
1080
21-2,43-44
B-2
X-3
1100
22-1,125-134
B-2
X-3
1240
24-1,15-16
C
Y-3
1250
24-1,19-23
C
Y-3
1280
24-1,88-90
C
Y-3
1290
25-1,3-5
C
Y-3
1300
28-1,4-5
C
Y-3
1350a
C
Z 1
1350b
30-1,84-86
C
Z 2
50.08
1.37
14.86
9.30
0.17
7.95
11.83
2.89
0.10
0.06
0.10
0.17
0.17
99.05
50.12
1.27
15.21
8.97
0.16
8.32
11.90
2.96
0.10
0.14
0.05
0.12
99.36
50.17
1.26
15.99
8.33
0.13
8.04
11.93
2.67
0.13
0.17
0.22
0.13
99.17
50.98
1.30
15.25
8.88
0.16
8.05
11.85
2.78
0.13
0.17
0.14
99.69
49.80
1.29
15.12
9.01
0.15
8.24
12.01
2.66
0.14
0.16
0.17
98.75
49.86
1.24
15.19
8.99
0.17
8.22
12.07
2.73
0.08
0.11
0.10
0.05
0.13
0.15
99.09
49.81
1.52
15.50
9.13
0.15
8.08
11.05
3.12
0.21
0.12
50.55
1.56
15.59
8.96
0.17
7.5 3
11.31
2.97
0.16
0.19
0.07
49.94
1.59
15.87
8.92
0.21
7.74
11.46
3.05
0.22
0.20
49.95
1.57
15.51
9.10
0.16
7.75
11.30
3.01
0.21
0.21
50.43
1.53
15.39
9.25
0.16
8.01
11.10
2.84
0.22
0.19
0.09
0.07
49.39 ±.37 49.63
1.52 ±.01 1.43
16.15 ±.19 16.38
9.18 ±.08 8.90
0.15 ±.04
8.04 ±.04
11.17 ±.02 11.38
3.08 ±.02
0.18 ±.02
0.21 ±.08 0.20
0.06 ±.02 0.07 ±.03
0.14
8.27
2.98
0.16
0.15 0.13 0.14
98.84 99.19 99.34
0.10 0.14 0.13 ±.03 0.12 +.03
98.87 99.42 99.26 99.66
given MgO content, most variation is shown by TiCh; there isstrong positive and negative covariance, respectively, withFeO and CaO (Figures 6[a] and 6[b]). Based on Tiθ2contents and stratigraphic occurrences, two major glasscompositional groupings can be recognized ("X" and "Y"types). These are divided into X-1, X-2, X-3, Y-1, Y-2 (oneanalysis only), and Y-3 subgroups (Figures 6 and 7). A thirdmajor glass group ( " Z " type) is recognized in thehyaloclastic unit (Table 2 and Figure 6).
Most oxide contents of Leg 46 glasses range within thespread of data for other regions of the Mid-Atlantic Ridge(e.g., FAMOUS, 36-37°N; Flower et al., 1977a,b) with theexception that Tiθ2 and Na2θ are distinctly higher, and CaOis in some cases below the lowest FAMOUS and Leg 37values for equivalent MgO content. Normative character(CIPW) of the glasses is typical of MORB compositions of"low-K tholeiite" type, and the parameter An/Di, used byFlower et al. (1977, in press) to distinguish magma variantsat Leg 37 drill sites, ranges between about 1.1 and 1.6, whichspans the range of Leg 37 and FAMOUS glasses.
Although shipboard-defined chemical "uni ts" wereestablished to represent contiguous stratigraphic intervals,there is clearly the possibility that chemically distinct magmatypes may be interlayered in places. Moreover, differentchemical "units" may relate to the same parent liquid andsimply reflect varying degrees of fractionation oraccumulation prior to eruption.
The glass analyses in Table 2 are annotated according toglass compositional groups and are related to shipboardchemical units as follows:
LiquidType
X-1X-2
X-3Y-1
Bochum Sample Nos.(Glass)
10, 20, 60750,780810, 870,880,890,910870,980, 1000, 1080,1100150, 210, 230, 240, 290, 320400
Shipboard"Unit!'
A-lB-lB-2B-2A-2A-3?
Y-2 450 A-3
Y-3 1240,1250, 1280, 1290, 1300 CZ-1,2 1350 C
The stratigraphic distribution of glass (liquid) types (X,Y,Z)confirms the difference between A-l and A-2 shipboardunits, although no samples close to the boundary wereanalyzed (Figure 5). Shipboard Unit A-2 and the upper partof A-3 correspond to our Y-2 glass group, with a singlesample (Bochum Sample 450, DSDP Sample 396B-14-3,27-33 cm) from shipboard Unit A-3 corresponding to the FeOand Tiθ2-rich Y-2 glass type. No glass samples from the toppart of shipboard Unit B-1 were studied, but glasses from thelower part are chemically similar to the top part of shipboardUnit B-2, indicating a compositional hiatus within Core396B-20.
Glass group Y-3 corresponds to shipboard group C.Glasses from the hyaloclastite in Core 396B-30 (BrochumSample 1350) appear to represent two chemical groups (Z-1,Z-2) somewhat similar to C, but with higher AI2O3 and MgO,and lower K2O and Tiθ2. More data are being obtained toprecisely define chemical glass groups in this interval.
Whole Rock Samples
To interpret the whole rock chemical data in terms oforiginal magmatic variation, it is necessary to excludecompositions affected by processes of low temperaturealteration evidenced by growth of smectite and high contentsof H2O + . The presence of fine carbonate veining in manysamples also indicates (approximate) stoichiometric additionof CaCOβ for which correction can be made by subtractingthe assumed Cθ2-related CaO from the analysis, andnormalizing to a H2O -free basis.
The main chemical effects of low temperature interactionof basalt with seawater appear to be leaching of Ca+2,oxidation of Fe+ 2, and addition of Siθ2, with other effects(such as Mg+2—leaching and Fe and Al-enrichment) beingassociated with more extreme H2θ+-related alteration
183

M. F. J. FLOWER ET AL.
TABLE 3Major Element Analyses (%) for Basalts From Hole 396B
Bochum No.
Sample(Interval in cm)
ShipboardChem. Unit
Mngma Batch
SiO2
TiO2
A12O3
Fe 2O 3
FeO
MnO
MgO
CaO
Na2O
K 2 Op2°5co2H 2 O +
Total
H2°~L.O.I.
20
4-1,80-87
A-l
1
49.90
1.3915.64
2.31
7.00
0.16
7.77
11.61
2.50
0.18
0.20
0.19
1.10
99.95
0.38
-0.06
50
5-2,87-93
A-l
1
49.85
1.4015.57
2.83
6.70
0.16
7.91
11.60
2.60
0.26
0.20
0.07
0.90
100.05
0.64
-0.20
70
7-1,25-30
A-l
1
49.47
1.39
15.86
3.35
6.200.17
7.59
11.81
2.50
0.23
0.21
0.261.54
100.58
0.71
-0.39
85
7-1,50-57
A-l
1
49.95
1.42
15.77
2.85
6.76
0.17
8.10
12.03
2.41
0.22
0.14
0.06
0.63
100.51
0.60
-0.29
90
7-1,60-62
A-l
1
49.931.37
15.363.34
5.60
0.15
8.05
11.60
2.70
0.27
0.17
0.260.84
99.64
1.25
-0.73
110
7-2,107-113
A-l
1
49.57
1.38
15.53
2.69
6.70
0.17
7.83
11.60
2.50
0.22
0.19
0.20
1.02
99.60
0.60
-0.87
120
7-2,127-130
A-l
1
49.991.36
15.67
2.80
6.30
0.16
8.36
11.53
2.600.25
0.16
0.19
1.00
100.37
0.46
-0.27
140
8-1,128-135
A-2
2
49.97
1.52
15.63
3.34
6.70
0.18
6.93
11.59
2.60
0.20
0.18
0.251.21
100.30
0.52
-0.28
180
9-1,75-80
A-2
2
49.861.54
15.683.41
6.70
0.18
7.08
11.55
2.70
0.20
0.180.24
1.22
100.54
0.55
-0.30
210
9-2,125-128
A-2
2
49.301.57
15.80
3.81
6.400.18
7.05
11.82
2.80
0.16
0.160.21
1.10
100.36
0.58
-0.50
260
11-2,27-33
A-2
2
49.991.48
15.28
5.694.00
0.16
7.57
11.25
2.80
0.30
0.20
0.13
1.70
100.55
1.10
-0.71
400
14-1,121-127
A-3
3
49.61
1.62
15.43
4.04
5.90
0.16
7.61
11.06
2.90
0.32
0.16
0.09
1.50
100.40
1.12
-0.49
840
20-1,35-42
B-2
4
49.17
1.17
17.93
3.31
5.40
0.15
6.6712.52
2.40
0.180.19
0.101.26
100.45
0.59
-0.33
reactions (Robinson et al., 1977). We have adopted anempirical value of 1.25 weight per cent H2θ+ below whichelement mobility is taken to be negligible, and accordinglyhave treated (carbonate-corrected) whole rock analyses byinitially projecting their oxide versus MgO variation in termsof the shipboard chemical units, as for the glass data (Figures8[a], 8[c], 9). This approach is validated by the overallcoherence of whole rock major and trace element chemistry.Despite gross compatibility of TiCh, FeO, and Zrabundances with those of the shipboard chemical units,interpretations in terms of plausible petrologic processes aremore complex. Chemical groups with common lithologiccharacter are provisionally interpreted as magma batches,with discrete temporal and spatial identities (cf., Leg 37,Flower et al., 1977, in press). Sampling for chemicalanalysis from shipboard "units" is summarized as follows:
Shipboard"Unit" No.
A-lA-2A-3B-1B-2D
Bochum Sample Nos.(whole rocks)
20 to 120140 to 260420 to 590620 to 780840 to 11901360,1370
DSDP Sections
4-1 to 7-28-1 to 11-2
14-2 to 15-416-1 to 18-120-1 to 22-4
32-1
We distinguish whole rock compositional groups based onstatistical and graphic examination of the major elementoxide data in Figure 8. In the following section, we brieflycompare these groups to shipboard chemical units in order tounderstand the eruptive relations of magma batches.
Shipboard Chemical Groups A-l to A-3: Lithologic UnitsI, II, and III: Cores 4-1 to 15-4:
Aphyric and sparsely olivine + plagioclase phyric pillowbasalts from shipboard chemical Units A-l, A-2, and A-3
broadly conform to the chemical characteristics defined onshipboard. We equate them with magma Batches 1,2, and 3,respectively (Table 3), distinguished largely by differencesin Tiθ2. The range of Tiθ2 content for equivalent Mg/(Mg +F e + 2 ) values of the analyzed whole rock samples aresummarized as follows:
BatchNo.
1
23
Chemical Range
TiO2 1.36-1.42%
TiO2 1.48-1.57%TiO9 1.60-1.65%
Bochum Sample No.(whole rocks)
20, 50, 70+,85,90, 110, 120140, 180,210,260+400+, 420+,450, 470+
515,520,530+,590
EquivalentShipboard
"Unit"
A-l
A-2A-3
+ = "altered" sample (> 1.25% H 2 O + ) .There is no marked compositional gap for CaO between
batches, but this element shows marked overall decreasefrom Batch 1 to Batch 3 with increasing Tiθ2 (Figure 10; cf.,Y-X liquids in Figure 6[b]). The most significant distinctionappears to be that of associated glass type, Batch 1 lavas arerelated to X-l liquids, whereas Batches 2 and 3 lavas areprobably related to Y-l and Y-2 liquids, respectively (seeFigures 8 and 8[b]).
Shipboard Chemical Groups B-1 and B-2: LithologicUnit IV: Cores 16-1 to 22-4:
Eruptive units in this interval are much more phyric(plagioclase > > olivine) than those discussed above (Figure2). Examination of oxide versus MgO variation for rocksfrom shipboard Units " B - 1 " and "B-2" confirmed severalfeatures noted by the shipboard party: (1) Strong AI2O3 andCaO enrichment with decreasing MgO, suggestingplagioclase accumulation which is also compatible with thelithology; (2) B-2 rocks generally have higher AI2O3 and
184

PETROLOGY AND GEOCHEMISTRY
TABLE 3 - Continued
1370
32-1,59-62
D
8
420
14-2,31-38
A-3
3
450
14-3,27-33
A-3
3
470
15-1,116-120
A-3
3
515
15-2,120-133
A-3
3
520
15-2,141-147
A-3
3
530
15-3,7-15
A-3
3
590
15-4,132-141
A-3
3
620
16-1,97-102
B-l
4
630
16-2,107-113
B-l
4
700
16-5,34-36
B-l
4
710
17-1,4-7
B-l
4
730
17-2,43-49
B-l
4
750
17-3,108-112
B-l
4
49.771.65
16.21
3.81
5.20
0.16
6.7011.85
2.70
0.35
0.24
0.46
1.50
100.60
1.09
-0.81
49.651.62
15.22
4.67
5.50
0.16
7.3910.90
2.90
0.33
0.23
0.09
1.40
100.06
1.19
-0.48
49.201.65
15.85
3.68
6.70
0.17
7.06
11.06
2.90
0.27
0.21
0.14
1.10
99.99
0.74
-0.26
49.651.60
15.204.84
5.30
0.16
7.38
10.81
3.00
0.29
0.21
0.10
1.40
99.94
1.21
-0.79
49.691.62
15.26
3.32
6.92
0.16
8.02
10.95
2.690.14
0.15
0.02
0.79
99.73
1.15
-0.38
49.891.61
15.16
2.82
7.20
0.16
7.75
10.81
2.90
0.17
0.22
0.18
1.20
100.07
0.85
-0.53
49.98
1.61
15.19
3.15
6.50
0.16
7.65
10.84
2.80
0.17
0.21
0.22
1.30
99.78
1.06
-0.63
49.931.62
15.54
3.09
6.70
0.17
7.65
11.05
2.90
0.19
0.17
0.29
1.20
100.05
0.82
-0.60
48.751.16
17.28
2.82
5.60
0.15
7.60
12.16
2.50
0.22
0.17
0.32
1.16
99.89
0.65
-0.49
49.421.17
16.40
3.66
4.60
0.13
7.4811.84
2.60
0.21
0.17
0.21
1.68
99.57
1.10
-0.97
49.771.17
17.06
3.34
4.80
0.14
7.18
12.02
2.50
0.24
0.15
0.12
1.53
100.02
1.16
-0.62
49.091.20
17.27
4.30
4.70
0.15
6.70
12.40
2.60
0.21
0.13
0.22
0.79
99.76
1.09
-0.83
49.161.17
17.34
2.89
5.70
0.15
7.05
12.33
2.50
0.25
0.17
0.30
1.01
100.02
0.62
-0.53
49.081.20
17.69
3.12
5.60
0.15
6.83
12.47
2.60
0.13
0.10
0.51
1.15
100.63
0.44
-0.47
CaO and lower Tiθ2, FeO, and Na2θ for equivalent MgOcontents than B-l rocks. However, these gross chemicaltrends are accompanied by additional features that argueagainst the implicit postulate of two parallel and analogoustrends of plagioclase ( ± olivine ± clinopyroxene)accumulation, as was demonstrated for Leg 37 rocks (Floweret al., 1977, in press):
1) AI2O3 and CaO enrichment trends are accompanied byincreases in Tiθ2, FeO, and P2O5, which are incompatiblewith the cumulate hypothesis in its simplest form;
2) Within each shipboard unit (B-l and B-2) distinctmagma batches are recognized, separated by small butsignificant MgO gaps. Also, some B-l and B-2 analysesoverlap for all oxides at a given MgO or Mg/(Mg + Fe+2)value.Hence, we postulate separate magma batches, as for theupper sparsely phyric sequence. These are compatible withtrace element data and associated glass compositions andthey apparently cross-cut the shipboard B-l/B-2 division, asshown below:
LiquidBatch (glass)
No. Type Chemical Range
EquivalentBo chum Sample No. Shipboard
(whole rocks) "Unit"
X-2 TiO2 1.61 to 1.20% 620, 630+, 700+,710,730,750840+,910
X-l TiO2 1.02 to 1.05% 1020+, 1030+, 1060+
? TiO2 .92 to 1.03% 1070,1090+, 1100+,1110+,1165,1180+, 1190
B-l
B-2B-2B-2
Oxide variation (Figures 8[a] and 8[c])of these groupssuggests that Batches 4 and 5 are related through simpleaccumulation of plagioclase ± olivine, as indicated byincreases in AI2O3 content accompanied by increase in
Mg/(Mg + Fe + 2 ) ratios and decreases in Tiθ2 andincompatible trace elements (see below). Batch 6, in view ofits average AI2O3 content being lower than that of Batches 4and 5, could be tentatively attributed to more extensiveaccumulation of olivine. However, this is not supported bymodal data, and it appears that the significantly higherMg/(Mg + Fe+2) ratio of Batch 6 magmas reflects a moreprimitive character. Batch 6 does not appear to be related tothe X liquid type (the nearest in composition) but probably toa more primitive type for which no glass compositions areknown.
Chemical mass balance modeling for the phyric magmabatches of whole rock, glass and phenocryst phasecompositions, indicates that differentiation of magmabatches from any one liquid type is not the result of fractionalremoval of simple phenocryst phase assemblages, butprobably involves interplay of plagioclase accumulation,with accumulation and/or removal of mafic phases andpossibly "groundmass" Fe-Ti oxides.
Shipboard Chemical group D: Lithologic Unit VII: Cores32-1 to 33-1:
Two samples (Bochum Samples 1360 and 1370; DSDPSamples 396B-32-1, 11-13 cm and 59-62 cm) from thelowermost occurrence of shipboard chemical Group D (i.e.,from below the clastic sequence) contrast strongly with eachother. Bochum Sample 1360 is of the coarsely (plagioclase> > olivine) phyric shipboard chemical Group B rocks withhigh AI2O3 and low Tiθ2 (1.28%), but it does not conformexactly in its major or trace element chemistry to any of thebatches (4, 5, or 6) that are related to X-type or similarliquids, and so must be provisionally regarded as from adistinct batch (7). Bochum Sample 1370, however, is a highTiθ2 (1.68%) sparsely (olivine + plagioclase) phyric basaltsimilar to Batch 3 lavas except for higher AI2O3 content
185

M. F. J. FLOWER ET AL.
TABLE 3 - Continued
Bochum No.
Sample(Interval in cm)
ShipboardChem. Unit
Magma Batch
SiO2
TiO2A 1 2°3F e 2 O 3
FeO
MnO
MgO
CaO
Na2O
K2OP 2 θ 5
co2H 2 O +
Total
H2°~L.O.I.
910
20-2,58-67
B-2
4
48.63
1.1617.85
3.28
5.40
0.15
7.16
12.57
2.50
0.15
0.12
0.14
0.86
99.97
0.32
-0.51
940
20-3,21-27
B-2
6
49.52
1.0117.48
2.86
4.60
0.13
7.42
12.34
2.50
0.20
0.14
0.16
1.56
99.92
0.94
-0.76
1020
20-5,60-68
B-2
5
48.361.02
18.84
3.83
4.10
0.14
5.8612.47
2.60
0.15
0.17
0.26
2.53
100.33
1.52
-1.70
1030
20-6,13-20
B-2
5
47.96
1.05
18.86
4.41
4.20
0.16
6.26
12.39
2.50
0.20
0.12
0.22
2.30
100.63
1.62
-1.77
1060
21-1,3-10
B-2
5
48.42
1.04
18.33
4.17
4.10
0.15
6.33
12.26
2.600.17
0.19
0.20
2.66
100.62
1.65
-1.54
1070
21-1,102-110
B-2
6
49.76
0.99
17.27
2.52
5.200.14
8.24
12.15
2.300.17
0.12
0.111.24
100.21
0.75
-0.57
1090
22-1,30-38
B-2
6
48.54
0.97
18.24
3.25
4.500.14
7.28
12.31
2.40
0.15
0.19
0.12
2.21
100.30
1.14
-1.21
1100
22-1,125-134
B-2
6
48.95
0.96
17.67
2.75
4.70
0.13
7.79
12.40
2.40
0.22
0.16
0.25
1.91
100.29
0.94
-1.14
1110
22-2,8-12
B-2
6
48.57
0.92
17.76
2.39
4.90
0.138.44
12.04
2.400.17
0.11
0.11
1.66
99.60
0.79
-1.21
1165
22-3,28-38
B-2
6
49.06
0.96
17.79
3.18
4.73
0.138.04
12.34
2.28
0.17
0.09
0.03
0.80
99.60
1.10
-0.77
1170
22-3,49-56
B-2
6
48.76
0.95
17.39
2.56
5.10
0.13
8.52
12.10
2.30
0.19
0.130.14
1.60
99.87
0.72
-1.02
1180
22-3,92-98
B-2
6
48.901.00
18.00
2.89
5.20
0.137.84
12.36
2.40
0.10
0.09
0.09
1.59
100.59
1.00
-0.94
1190
22-4,4-9
B-2
6
49.55
0.96
17.41
1.41
6.10
0.13
8.13
12.15
2.50
0.12
0.15
0.18
1.15
99.94
0.45
-0.44
1360
32-111-13
D
7
48.76
1.25
17.63
3.42
5.000.14
6.41
12.20
2.80
0.27
0.19
0.32
1.05
99.44
0.49
-0.59
(16.47%). Based on the high AI2O3 content (Figure 8[c]),we suggest it may represent yet another separate batch (9).
TRACE ELEMENT CHEMISTRY
Magma batches may also be defined in terms of stable("alteration-resistant ) trace element ratios such as Ti/Zr,Zr/Y, and Ce/Yb. Variation of "mobile" elements (such asRb and Ba), which are known to be "incompatible" duringlow pressure fractional crystallization or crystalaccumulation processes, may also be used to monitor theextent of low temperature alteration and interaction withseawater. All trace element data obtained by XRF are givenin Table 4, whereas REE, Th, Ta, and Hf (determined byINAA) are given in Table 5.
Zr, Y, Sr, and V
Plots of Ti, Y, Sr, and V versus Zr (Figure 11) confirm thechemically distinct magma batches derived from majorelement data. These elements are plotted in Figure 11 alongwith average values for chondrite interelement ratios takenfrom Wánke et al. (1974). It seems likely that the departurefrom chondrite values of at least some LIL element ratios inboth modern and archaean basaltic melt compositions isclosely related to residual phase assemblages thatcharacterize progressive degrees of partial melting,especially in view of the close approach to chondrite ratiosshown by advanced (about 60 to 70%) komatiitic melts(Nesbit and Sun, 1976), which probably equilibrated withharzburgite or dunite residues.
Ti Versus Zr (Figure ll[a])
The non-cumulate (aphyric) Batch 1 and cumulate Batches4, 5, and 6 related to X-type liquids, have chondritic Ti-Sr
ratios (—103), whereas Batch 3 (Y-type liquid) has amarginally lower ratio of about 92.
Y Versus Zr (Figure ll[b])
Y vs. Zr variation suggests X-liquid-derived Batches 5 and6 have an approximately chondritic Y-Zr ratio (—42),whereas a progressive decrease in Y/Zr occurs from X-l,X-4, X-5, and Y-derived batches.
Sr Versus Zr (Figure ll[c])
Aphyric Batch 1 (X-1 liquid) has a Sr/Zr ratio lower thanchondrite, whereas the coarsely (plagioclase-olivine) phyricBatches 4, 5, and 6 Sr/Zr ratios approximately equal to(Batch 4), or much greater than (Batches 5 and 6), thechondritic value of about 1.8. A progressive decrease in theSr/Zr ratio is observed from Batch 1 to the sparsely phyricBatches 2 and 3, with increasing Zr content.
V Versus Zr (Figure ll[d])
Divergence of V/Zr ratios in all lavas from chondriticvalues (—13) is far greater than that of other LIL elementratios, although again, we observe a progressive decrease inmagma batches from X-3 (—4.2) through to Y (—2.6).
The solid-liquid partition coefficient KD for Zr in basalticsystems is evidently very low as is that for Ti where oxidephases are not precipitated. The departure from constantelement/Zr ratio with increasing Zr content for Y, Sr, and Vtherefore reflects variable KD values for these elements withrespect to solid phases with which liquids were in contact. Itis clear that clinopyroxene is not a major component of lowpressure fractionation (evidence from petrography andfractionation calculations), suggesting that clinopyroxeneremained in the residue during partial melting, with effective
186

PETROLOGY AND GEOCHEMISTRY
TABLE 4Trace Element Data for Leg 46 Rocks and
Standards W-1, AGV, and BCR
Comparative
Analyses
W-1 Det.aU
Flan.b
Abbeyc
Willisd
A G V Det.Flan.
Abbey
BCR Det.
RanAbbeyWillis
BochumSampleNumber
2030507090120140150160180210240250260290320400420450470500520530590610620630700710730750780810840860910930940970102010301060107010901100111011701180119012001250128013601370
Cr
118114120
131212
161816
Cr
323328312302306327286288321268310285268261279293264265278268239267239251262322299294298292313294314296321312356319354334327355317334339313315321319349327292297259
Ni
787678
211917
111613
Ni
139140145147150186144131116136114112146141136135172162150160136139143154117143163137140129126151156130139140137167125135154152167164159180183156171164129157145143
Cu
110110110
606064
191819
Cu
6965
7369707766696965
70726 76469706264624066646972736671706572697475668074487173657467767573
698061676665
Zn
84868695
888585
121120120
Zn
8483
8678809094989090
8782959289
9184849585869270657078747978827579747365847474776867646365
66768)857286
Elements (ppm)
Zr
9510510521
2352 25220
188191186192
Rb
222121192
676868
47474647
Sr
19219019020
675657660
340330330334
Elements (ppm)
Zr
78H8
8886849698959496
88941019310411 1110110108610112110847273767372777476677271676060545 7655654565049
565410310088108
Rb
1<l113214
<l1
<l1231
<l5411
<l21
<l2
<l1223
<l33
<l2
<l23
<l<)<l<l<l1222
<l<l1124
Sr
119124119121127119129137142128134138125131132127144144143145139140137139150124138131135128133136141133135130132134127172123119122119123116119122119128168165159134
Y
202525160
212126
33374633
Y
29323031312933343335343533323432353436353535353628262626
28292727262726272324242625222422222323232436332735
Ba V
154 244160 265160 240
1191 1251208 1251200 125
Ba
7
91710
24
155
18
19
8
71
152
10
5201
7
5
726 403S75 400380 410
V
281226275261263306320288303345348291277312299290282299277269274265276265242228226246'23626226327125024523526520525 122722722739
20320019320421419823734229623 3311
Co
474750
181417
373837
Co
42
44
42
133
38
37
65
125
5 0
Notes: aDet. = determined in this workbFlan. = Flanagan (1973)cAbbey = Abbey (1973)dWillis = Willis et al. (1972)
control on both Y (.5 < KD cpxl < 1) and V (KD
cpxl=4;Bougault and Hekinian, 1974), at least for those melts thatgave rise to X-2, Y-1, and Y-2 liquids. This is probably not acomplete explanation, as Y-l liquid-derived batches have
approximately chondritic Y-Zr ratios but substantially lessthan chondritic V/Zr ratios.
Similar arguments might be applied to the less thanchondritic Sr/Zr ratios of aphyric (Batch 1) and sparselyphyric (Batches 2 and 3) lavas in postulating residualplagioclase (KDPI/I ± 1) during generation of parentalprimary liquids. However this is harder to evaluate as theextent of plagioclase removal from these liquids is clearlyvery variable.
Cr, Ni, and Co
The "compatible" trace elements (Kc4D s/1 > 1) showcomplex patterns of variation versus MgO (e.g., Figure 12showing Cr versus MgO). Any specific magma batch appearsto have a characteristic range of Cr for a given range of MgO,with Cr/Mg showing a rough correlation with Mg/(Mg +Fe+ 2) ratios. The most probable, and simplest, explanationfor the variable Cr/Mg character of different magma batchesis the variable extent of plagioclase ± olivine accumulationimposed on the spectrum of parent liquid composition.
Rare Earth Elements (REE), Th, Ta, and Hf
Sixteen samples representing all shipboard chemical unitsexcept C were analyzed for these elements. The analyses,with chondrite-normalized Ce/Yb ratios, identifiedaccording to magma batch, are given in Table 5. Thechondrite-normalized distribution patterns for Ce, Nd, Eu,Tb, Yb, and Lu are shown in Figure 13 for each magmabatch. The REE configurations for each batch are virtuallyindistinguishable, except for slight positive Eu anomalies inplagioclase-phyric Batches 5,6, and 7. All patterns are lightREE depleted compared to "typical" mid-ocean ridgebasalts.
Magma batches are characterized by the sum of REEabundance X Ce, Nd, Tb, Yb, and Lu (see Table 5), coarselyphyric lavas having lowest abundances (Figure 13[h]).However, REE abundances in aphyric and sparsely-phyricBatches 1,2, and 3 show an overall inverse correlation withphenocryst abundance (as for Ti and other LIL elements),suggesting higher abundances in Y than in X-type liquids.The uniformity of (Ce/Yb) N for all magma types is in strikingcontrast to the variable patterns of Leg 37 basalts, whichcorrelate with other trace element parameters (e.g., Zr/Y)and with magma types defined from a major elementchemistry.
WHOLE ROCK-GLASS RELATIONS
Certain provisional interpretations of whole rock-glassrelations are briefly summarized below:
a) Glass (liquid) compositions are always more MgO-richand have higher Mg/(Mg + Fe+2) ratios than the bulkcompositions of cooling units with which they are associated.This suggests the likelihood that mafic cumulates (essentiallyolivine) exist which either were not erupted or simply werenot encountered during drilling. Liquid compositions are allevolved compared to likely primary melt compositions.However, the plagioclase-cumulate batch magmas haveprimitive Mg/(Mg + Fe+2) ratios in the range of 0.68 to 0.72.These basalts have no glass equivalents.
187

M. F. J. FLOWER ET AL.
TABLE 5Rare Earth Elements and Th, Ta, and Hf Concentrations (ppm) of Samples From Hole 396B, and of Standards
Bochum No.
Sample(Interval in cm)
ShipboardChem. Unit
Magma Batch
CeNdEuTbYbLuThTaHf
WbJN
70
7-1,25-30
A-l
1
9.719.461.310.823.380.550.160.162.54
0.73
110
7-2,107-113
A-l
1
9.059.211.26
3.240.540.140.152.42
0.71
120
7-2,127-130
A-l
1
9.118.581.170.742.990.51n.d.1.232.10
0.77
140
8-1,128-135
A-2
2
10.6110.51
1.420.933.760.600.230.212.75
0.72
250
11-1,104-108
A-2
2
10.3110.44
1.390.903.520.580.210.182.72
0.74
420
14-2,31-38
A-3
3
12.4811.89
1.540.963.650.57n.d.0.703.20
0.87
450
14-3,27-33
A-3
3
13.0811.08
1.980.883.250.59n.d.1.531.16
1.0
500
15-2,111-115
A-3
3
11.5212.03
1.500.953.820.650.160.212.90
0.77
530
15-3,7-15
A-3
3
12.8110.88
1.470.913.650.59n.d.0.883.14
0.89
560
15-4,13-20
A-3
3
12.1611.67
1.520.963.80.600.250.202.94
0.81
630
16-2,107-113
B-l
4
8.07.441.150.702.570.46n.d.1.04n.d.
0.80
690
16-4,63-68
B-l
4
7.758.371.180.782.890.480.180.152.11
0.68
840
20-1,35-42
ß-2
4
7.377.331.100.632.580.410.160.131.97
0.73
103020-6,13-20
B-2
6
7.06.941.000.612.4 30.39n.d.
0.631.57
0.73
107021-1,
102-110
B-2
5
6.516.651.000.592.280.3/0.140.131.66
0.72
137032-1,59-62
D
8
11.6610.87
1.470.963.770.590.220.232.92
0.79
Standards NIM-G
208.6977.21
0.362.87
15.132.14
56.454.49
12.72
NIM-G
212.9683.41
0.332.92
15.341.76
58.364.97
13.11
-
b) Mass balance solutions for glass-whole rockfractionation, in terms of analyzed phenocrysts (± Fe-Tioxides), can in no case be satisfactorily achieved by simpleremoval or addition of a phase assemblage. Only bypostulating the addition of plagioclase and removal of olivine(± clinopyroxene ± Ti-magnetite) can "daughter"whole-rocks be derived from associated "parent" glasscompositions. This suggests that either the fractionationprocesses in the magma storage region are complex or thatother processes, such as magma mixing, have affectedmagma chemistry.
c) As noted previously, glasses associated with sparselyphyric basalts of Batch 1 (X-2 type) are indistinguishablefrom those associated with the phyric basalts (up to about30% phenocrysts) of Batches 4 and 5 magmas. Intraunitglass-whole rock fractionation in the latter groups isconsiderably more extensive and distinctive. This mustindicate efficient separation of liquid and crystals for any oneliquid type so that the liquid fraction in non-cumulate regionsof the storage reservoir remains essentially in equilibriumwith that in adjacent cumulate regions.
d) There is an important difference in the nature ofglass-whole rock fractionation, between X-type and Y-typeliquids. Although both X and Y-type liquids precipitatedmafic phases which separated out; X-type liquids gave rise torocks with higher AI2O3 and lower TiC>2 contents than theparent glass. Y-type liquids resulted in lavas, considerablyless phyric, showing a similar but less extensive enrichmentof A12O3, but higher TiCh contents than those in the glass. Asa preliminary conclusion, we suggest this reflects criticaldifferences in the phase equilibria of X and Y-type liquidsthat are responsible for diversification of lithology andchemical fractionation patterns in Leg 46 basalts, and mayalso reflect differential movement of "groundmass"Ti-magnetite.
SUMMARYAt least four and probably five magma types were
available for eruption during crustal formation at Site 396,each apparently resulting from a specific fractionation event.However, any one eruptive batch of liquid or liquid + crystalmix does not necessarily derive from a single fractionationevent. We envisage that magma batches deriving from anyone liquid type reflect one or more of several possibilities: (a)
Sampling specific fractions of a magma body differentiatingunder temporarily closed system conditions, (b) Spatiallyand/or temporally distinct fractionation events, eachcharacterized by a specific duration, cooling history, andextraction efficiency during an eruptive pulse, (c) Anopen-ended magmatic system wherein successive magmapulses intrude into and mix with solid and liquid fractionationproducts of each other. Despite the a priori likelihood of thisprocess, the apparent clustering of both glass and whole rockchemistry and preliminary quantitative inteΦretations of thevariance indicates this could be only a contributing factor.
At this stage of our inteΦretation, we prefer the firstpossibility as the dominant influence. Providing thatseparation of crystal and liquid phases is efficient (i.e., nointra-cumulus "fraction" develops), this represents thesimplest explanation of the relation between chemicallydistinct magma batches and remarkably homogeneous glasscompositions. The complex zoning of phenocrysts could berelated to a variety of factors and must be reconciled with anyfinal petrogenetic model.
ACKNOWLEDGMENTS
Our work was supported by grants (Schm 250116) from theDeutsche Forschungsgemeinschaft. We thank V. Trommsdorff forpermission to use the microprobe at the Institute fürKristallographie, ETH Zurich, and M. Sammerauer for help inoperating the instrument. We also thank A. Albee for permission touse the California Institute of Technology microprobe and A.A.Chodos for his assistance. The manuscript was written while H.U.Schmincke was supported by a stipend from the VW Foundation.
REFERENCES
Abbey, S., 1973. Studies in "Standard Samples" of silicate rocksand minerals, Geol. Surv. Canada, Paper 73-76.
Bougault, H. and Hekinian, R., 1974. Rift valley in the AtlanticOcean near 36°51'N: petrology and geochemistry of basalticrocks, Earth Planet. Sci. Lett., v. 27, p.
Flanagan, F.J. 1973. 1972 values for international geochemicalreference samples, Geochim. Cosmochim. Ada., v. 37, p.1189-1200.
Flower, M.F.J., Robinson, P.T., Schmincke, H.-U., andOhnmacht, W., 1977. Petrology and geochemistry of igneousrocks. In Aumento, F., Melson, W.G., et al., Initial Reports ofthe Deep Sea Drilling Project, v. 37: Washington (U.S.Government Printing Office), p. 658-680.
188

PETROLOGY AND GEOCHEMISTRY
TABLE 6Structural Formulas (%) of Leg 46 Olivines on the Basis of 4 Oxygens
BochumNo.
50
150
260
400
500
610
620
750/760
810
860/870
910
930
1020
1100
1200
1280
1370
Point
119120121122
243
12
16171819202125
194195196
130132
140141
161728293032
64656673
3839
4849505152535455
206207210
159160167168169170171172
211
187188189190191
282940
606162
4143
Na
0.00.00.00.0
0.0010.00.00.0
0.00.00.00.00.00.0010.0
0.00.00.0
0.00.0
0.0010.0
0.00.00.00.00.00.0
0.00.00.00.0
0.00.0
0.00.00.00.00.00.00.00.0
0.0080.00.0
0.00.00.0060.00.0020.00.00.0
0.0
0.0010.0010.0020.00.0
0.00.00.0
0.00.00.0
0.00.001
K
tr.0.00.00.0
0.00.00.00.0
0.00.00.00.00.00.00.0
0.00.00.0
0.00.0
0.00.0
0.00.00.00.00.00.0
0.00.00.00.0
0.00.0
0.00.00.00.00.00.00.00.0
0.00.00.0
0.00.00.0010.00.00.00.00.0
0.0
0.00.00.00.00.0
0.00.00.0
0.00.00.0
0.00.0
Ca
0.0070.0080.0070.008
0.0070.0080.0080.008
0.0080.0080.0080.0070.0080.0080.008
0.0080.0080.008
0.0090.008
0.0080.008
0.0080.0080.0080.0080.0080.008
0.0080.0080.0080.008
0.0080.008
0.0080.0080.0080.0080.0080.0080.0080.008
0.0080.0080.008
0.0080.0080.0070.0070.0080.0070.0080.007
0.008
0.0080.0080.0070.0070.008
0.0080.0080.009
0.0070.0080.008
0.0090.008
Mg
1.7411.7451.7471.745
1.7121.7001.7101.729
1.6941.7191.6921.6941.7061.7161.725
1.7101.7081.720
1.6231.510
1.7121.719
1.7731.7761.7651.7721.7801.733
1.7491.7551.7571.759
1.7971.744
1.7701.7701.7371.7621.7411.7441.7891.776
1.7511.7691.771
1.7921.8011.7861.7941.7961.7621.7611.782
1.768
1.7771.7701.7831.7661.767
1.7811.7691.751
1.7401.7501.748
1.7181.726
Fe2+
0.2730.2730.2690.262
0.2830.2810.2860.269
0.3000.2980.2970.2940.2870.2820.289
0.2990.2940.296
0.3860.484
0.2860.286
0.2490.2530.2430.2420.2470.275
0.2610.2690.2520.247
0.2110.268
0.2470.2490.2690.2480.2480.2650.2270.241
0.2450.2450.238
0.2230.2290.2080.2110.2220.2610.2580.232
0.233
0.2410.2400.2190.2400.238
0.2250.2320.246
0.2670.2620.263
0.2990.283
Mn
0.0040.0040.0050.004
0.0050.0050.0050.004
0.0050.0050.0040.0050.0050.0040.005
0.0050.0050.004
0.0060.009
0.0050.005
0.0040.0040.0040.0040.0050.004
0.0040.0040.0040.005
0.0030.004
0.0030.0030.0040.0040.0030.0040.0030.003
0.0040.0040.004
0.0050.0040.0050.0030.0040.0040.0040.004
0.004
0.0040.0040.0040.0040.004
0.0040.0050.004
0.0050.0040.004
0.0040.004
Cr
0.0010.00.00.0
0.00.0020.00.0
0.00.00.00.00.00.00.0
0.0010.00.0
0.00.0
0.0030.0
0.0010.0020.00.00.00.002
0.00.00.00.002
0.0010.002
0.00.00.00.00.00.00.00.0
0.0090.0010.0
0.00.00.0080.0010.0020.00.00.0
0.002
0.0020.0010.0010.00.0
0.0010.00.0
0.00.0010.002
0.00.003
Al
0.0010.00.0010.0
0.00.0050.00.0
0.00.00.00.00.00.00.0
0.00.00.0
0.00.0
0.0020.0
0.00.00.00.00.00.001
0.00.0010.0010.0
0.00.0
0.0010.00.00.00.0020.0010.0030.0
0.0100.00.0
0.00.0010.0100.0010.0030.00.0010.0
0.003
0.0020.00.00.0020.0
0.0010.00.001
0.0010.00.002
0.00.003
Ti
0.00.00.00.0
0.00.00.00.0
0.00.00.00.00.00.0010.0
0.00.0010.0
0.00.007
0.0020.0
0.00.00.00.00.00.0
0.00.0010.00.0
0.00.0
0.00.00.00.00.00.00.00.0
0.00.00.0
0.00.00.00.0010.00.00.00.0
0.002
0.0010.00.00.00.0
0.00.00.0
0.00.00.0010.0020.001
Si
0.9850.9850.9850.990
0.9960.9980.9950.995
0.9960.9851.0001.0000.9970.9940.987
0.9880.9920.986
0.9880.987
0.9880.991
0.9820.9780.9900.9870.9800.987
0.9880.9800.9890.989
0.9890.987
0.9840.9850.9910.9890.9980.9890.9840.986
0.9800.9860.990
0.9860.9870.9820.9900.9810.9830.9830.987
0.987
0.9810.9880.9920.9900.992
0.9890.9930.994
0.9900.9870.984
0.9830.984
Fo 86.4Fo 86.5Fo 86.7Fo 86.9
Fo 85.8Fo 85.8Fo 85.7Fo 86.5
Fo 85.0Fo 85.2Fo 85.1Fo 85.2Fo 85.6Fo 85.9Fo 85.7
Fo85.1Fo 85.3Fo85.3
Fo 80.8Fo75.7
Fo 85.7Fo 85.7
Fo 87.7Fo87.5Fo87.9Fo 88.0Fo 87.8Fo 86.3
Fo 87.0Fo 86.7Fo 87.5Fo87.7
Fo 89.5Fo86.7
Fo 87.8Fo87.7Fo 86.6Fo 87.7Fo 87.5Fo 86.8Fo 88.7Fo 88.1
Fo 87.7Fo 87.8Fo 88.2
Fo 88.9Fo 88.7Fo 89.6Fo 89.5Fo 89.0Fo 87.1Fo 87.2Fo 88.5
Fo 88.4
Fo 88.1F088.IFo89.1Fo 88.0Fo 88.1
Fo 88.8Fo 88.4Fo 87.7
Fo86.7Fo 87.0Fo 86.9
Fo 85.2Fo 85.9
Remarks
CoreRim
RimRimCore
Core
RimCoreRim
CoreCoreCore
GroundmassGroundmass
CoreRimCore
RimGroundmass
Close to coreRim
Core
Rim
Close to coreRimCoreRim
RimCore
CoreRimCore
RimCoreRimCore
Inclusion plag
Small phenoSmall phenoSmall phenoCoreRim
CoreRim
CoreRim
189

M. F. J. FLOWER ET AL.
Flower, M.F.J., Robinson, P.T., Schmincke, H.-U., Ohnmacht,W., in press. Magma fractionation systems beneath theMid-Atlantic Ridge at 36-37°N, Contrib. Mineral., Petrol.
Gordon, G.E., Randle, K., Goles, G.G., Corliss, J.B., Beeson,M.H., and Oxley, S.S., 1968. Instrumental activation analysisof standard rocks with high resolution X-ray detectors,Geochim. Cosmochim. Ada, v. 32, p. 369-396.
Nesbit, R.W. and Sun, Sh.-S., 1976. Geochemistry of Archaeanspinifex-textured peridotites and magnesian and low-magnesiantholeiites, Earth Planet. Sci. Lett., v. 31, p. 433.
Robinson, P.T., Flower, M.F.J., Schmincke, H.-U., andOhnmacht, W., 1977. Low temperature alteration of oceanicbasalts, DSDP Leg. In Aumento, F., Melson, W.G., et al.,
Initial Reports of the Deep Sea Drilling Project, v. 37:Washington (U.S. Government Printing Office), p. 775-794.
Routti, J.T. and Prussin, S.G., 1969. Photopeak method for thecomputer analysis of y-ray spectra from semiconductordetectors, Nucl. Instrum. Methods, v. 72, p. 125-142.
Wánke, H., Baddenhausen, H., Palms, M., and Spettel, B., 1974.On the chemistry of the Allende inclusions and their origin ashigh temperature condensates, Earth Planet. Sci. Lett., v. 23,p. 1.
Willis, J.P., Erlank, A.J., Gurney, J.J., Theil, R.H., and Ahrens,L.H., 1972. Major, minor and trace element data from someApollo 11, 12, 14 and 15 samples, Third Lunar Sci. Conf. Proc.Geochim. Cosmochim. Ada, Suppl. 3, v. 2, p. 1269-1273.
TABLE 7Structural Formulas (%) of Leg 46 Clinopyroxenes on Basis of 6 Oxygens
BochumNo.
150
500
Point
131415
129131
Na
0.0220.0260.0240.0320.028
Ca
0.7960.8010.7960.7660.755
Mg
0.9410.9360.9430.7800.814
Fe2+
0.1290.1270.1270.3760.362
Mn
0.0030.0050.004
0.0110.010
Al
0.1660.1700.1450.1320.117
Cr
0.0370.0380.0310.0020.002
Ti
0.0140.0120.0110.0450.043
Si
1.8941.8911.916
1.8801.890
Remarks
Core
Rim
Groundmass cryst.Groundmass cryst.
TABLE 8Structural Formulas (%) of Leg 46 Plagioclases Based on 8 Oxygens
BochumNo.
50
150
260
400
500
610
Point
115116117118123124
56789
222324.124.2
191192193197
125126127128
133134135
136137138139142143
K
0.0020.0020.0020.0020.0020.002
0.0010.0010.0010.0020.002
0.0080.0040.0020.002
0.0010.0010.0010.003
0.0020.0020.0030.0020.00.00.001
0.0010.0010.0010.0010.0010.001
Na
0.2660.2710.2750.2870.3320.357
0.2720.3140.3210.3110.319
0.2890.3790.3510.352
0.2150.2250.1920.384
0.4620.3700.4540.424
0.2270.2480.265
0.2500.2560.2700.2570.3060.300
Ca
0.7390.7550.7290.7340.6750.642
0.7430.6870.6960.7100.689
0.7010.6160.6660.666
0.7980.7920.8310.609
0.5550.6500.5480.6020.7840.7460.759
0.7530.7520.7560.7530.7020.712
Mg
0.0120.0150.0160.0150.0310.026
0.0140.0190.0170.0160.0160.0220.0280.0270.028
0.0120.0120.0130.030
0.0100.0200.0110.016
0.0170.0180.019
0.0170.0170.0190.0170.0240.019
Fe2+
0.0130.0140.0140.0150.0360.031
0.0160.0130.0150.0140.014
0.0460.0390.0380.038
0.0140.0140.0160.045
0.0320.0350.0350.0260.0150.0140.017
0.0170.0150.0190.0150.0210.021
Mn
0.00.00.00.00.00.0
0.00.00.00.00.0
0.00.00.00.0
0.00.00.00.0
0.0020.0010.00.0
0.00.00.0
0.00.00.00.00.00.0
Ti
0.00.00.00.00.00.0
0.00.0020.0020.00.0020.00.0140.0040.004
0.00.00.00.002
0.0030.0060.0030.0030.00.0030.005
0.0010.0030.0120.0020.0180.001
Cr
0.00.00.00.00.00.0
0.00.00.00.00.0
0.00.00.00.0
0.00.00.00.0
0.00.00.0020.0020.00.00.0
0.00.00.00.00.00.00
Al
1.6221.6361.6141.6221.5311.5321.6211.5741.5851.6141.5751.5461.4891.5071.512
1.6911.6851.7291.4711.4411.5091.4321.4811.6751.6411.624
1.6521.6191.6281.6321.5771.584
Si
2.3342.3132.3412.3302.3982.4122.3302.3792.3652.3412.3772.3812.4322 A122.407
2.2652.2702.2252.4552.5012.4162.5112.4562.2792.3152.313
2.3032.3272.3032.3172.3492.359
Remarks
Core
RimGroundmassGroundmassRim
CoreLaterGroundmass
same point,differentcorrections
Core
RimGrd. M. (±Matrix)?GroundmassGroundmassGroundmassGroundmassCore
same point,different
RimSmall phenoSmall pheno
190

PETROLOGY AND GEOCHEMISTRY
TABLE 8 - Continued
BochumNo.
620
750/760
810
860/870
910
930
1020
1100
Point
144145148
1819202122232425262731
6768697071727475
333435363740
4243444246475657
5859
198199200202203204205209
161162163164165166173
? 174175176
212
178179180181182183184185186
K
0.0010.0020.001
0.0010.0010.0010.0010.0010.0010.00.0010.0010.00.001
0.0010.0010.0010.0010.0010.0020.0010.002
0.00.00.00.00.00.001
0.00.00.00.00.00.0010.00.0
0.0010.001
0.0010.0010.0010.0010.0010.0010.00.0010.0020.0010.0010.00.00.0010.001
0.0010.0020.0
0.0010.0010.00.0010.0010.0010.0010.0010.001
Na
0.2470.2440.249
0.2540.2270.2020.2480.2220.2630.2400.2130.1920.1630.266
0.1950.1640.2600.2520.2630.2320.2390.300
0.2480.2410.2300.2230.1890.251
0.1510.1600.2310.1780.2340.2280.1870.194
0.1700.258
0.1870.1520.1560.2550.2550.2260.1950.190
0.1870.1750.1960.1830.1710.1730.199
0.2320.3210.168
0.2570.2630.1890.2010.1720.1850.1570.2250.231
Ca
0.7660.7870.756
0.7330.7750.7980.7610.7950.7290.7680.7950.8140.8400.739
0.8030.8440.7510.7610.7430.7750.7600.694
0.7560.7720.7730.7750.8030.760
0.8640.8480.7790.8280.7840.7850.8240.813
0.8270.738
0.8360.8820.8700.7520.7520.7880.8250.822
0.8100.8280.8000.8150.8130.8240.795
0.7560.6760.843
0.7250.7340.8010.7910.8210.8240.8260.7640.762
Mg
0.0170.0140.018
0.0190.0170.0160.0190.0150.0170.0150.0180.0160.0160.019
0.0150.0120.0150.0170.0150.0140.0170.022
0.0160.0150.0150.0910.0170.019
0.0140.0150.0170.0120.0140.0160.0160.016
0.0150.020
0.0160.0120.0120.0170.0160.0170.0150.016
0.0190.0180.0250.0250.0170.0170.010
0.0100.039
0.017
0.0170.0200.0160.0200.0150.0170.0140.0170.019
Fe2+
0.0100.0100.014
0.0180.0130.0110.0150.0140.0150.0160.0130.0130.0140.022
0.0140.0150.0190.0140.0130.0160.0170.028
0.0120.0140.0150.0110.0130.022
0.0180.0150.0150.0140.0150.0170.0130.013
0.0190.017
0.0150.0130.0150.0140.0160.0160.0130.014
0.0150.0120.0150.0140.0120.0140.010
0.0110.046
0.013
0.0150.0160.0150.0180.0130.0140.0140.0120.017
Mn
0.00.0040.0
0.00.0010.0010.0010.0020.00.00.00.00.00.0
0.00.00.00.00.00.0020.00.0
0.00.00.00.00.00.0
0.00.00.00.00.00.00.00.0
0.00.0
0.00.00.00.0010.0030.00.00.0
0.00.00.00.00.00.0
0.0
0.00.002
0.0
0.0020.00.00.00.00.00.00.00.0
Ti
0.00.00.0
0.0020.00.00.00.00.00.00.00.00.00.0
0.0020.0030.0030.00.00.00.0020.003
0.00.00.00.00.00.003
0.00.0020.00.0020.00.00.00.0
0.00.0
0.00.0020.00.00.00.00.00.0
0.00.00.0100.0090.00.00.0
0.00.016
0.006
0.00.00.00.0040.00.00.00.00.0
Cr
0.00.0130.0
0.00.00.00.00.00.00.00.00.00.00.0
0.00.00.00.00.00.0130.00.0
0.00.00.00.00.00.0
0.00.00.00.00.00.0110.00.0
0.0020.0
0.00.0
0.00.0030.0180.00.0020.0
0.00.00.00.00.00.00.0
0.00.002
0.0
0.00.00.00.00.00.00.00.00.0
Al
1.6451.6461.6431.6271.6851.7091.6731.6981.6351.6461.7071.7441.7571.6181.7091.7461.6411.6501.6411.6891.6671.5731.6361.6661.6881.6821.7171.6401.7761.7591.6731.7321.6821.6911.7201.730
1.7601.6521.7501.7611.7561.6381.6351.7041.7161.7001.7141.7341.7131.7191.7421.7491.720
1.6871.5101.748
1.6471.6221.7481.7191.7381.7351.7531.6861.678
Si
2.3072.2862.3122.3302.2772.2542.2842.2572.3282.3062.2532.2222.2072.3302.2522.2102.3102.3042.3782.2612.2902.3702.3192.2912.2752.2802.2482.3042.1822.2002.2822.2272.2742.2572.2372.233
2.2062.3092.2072.1852.1952.3132.3032.2552.2362.2522.2452.2272.2372.2292.2302.2182.253
2.2882.3882.204
2.3222.3322.2252.2422.2292.2242.2192.2832.285
Remarks
CoreRimSmall phenoRimCoreCoreRimCore
RimCore
RimGroundmassCore
RimCore
Outermost RimPhenoGroundmassCore
RimCoreRimMinute laterRim
CoreCore
close todark incl.
Outermost rimSmall cry st.Core
RimCoreRimSmallSmallPhenoRim
CoreCoreCoreRimCore
RimGroundmassPheno
Core
Outermost rimCore
RimCoreRim
191

M. F. J. FLOWER ET AL.
TABLE 8 - Continued
BochumNo.
1200
1280
1370
Point
2627303133343536373839
63
42444546
K
0.0010.0010.0010.00.00.00.00.00.00.0010.0010.002
0.0010.0020.0010.0
Na
0.2040.1530.1930.1890.1960.1770.1870.1870.2100.2710.1830.304
0.2720.2760.2210.151
Ca
0.8160.8730.8350.8320.8310.8340.8350.8340.8230.7850.843
0.695
0.7340.7240.8040.877
Mg
0.0160.0140.0140.0150.0160.0230.0160.0150.0170.0170.015
0.023
0.0150.0180.0210.016
Fe2 +
0.0120.0110.0120.0130.0150.0130.0110.0130.0130.0160.016
0.030
0.0190.0180.0130.015
Mn
0.00.00.0020.00.00.0020.00.00.00.00.0
0.0
0.00.00.00.0
Ti
0.0050.00.00.00.00.0130.00.00.00.00.0
0.004
0.00.0020.00.0
Cr
0.00.00.00.00.00.0020.00.00.00.00.0
0.0
0.00.00.00.0
Al
1.6861.7681.7201.7341.7001.7241.7151.7191.7001.6411.7331.573
1.6191.6101.6741.762
Si
2.2582.1862.2302.2222.2452.2122.2362.2332.2462.2922.2172.366
2.3332.3412.2702.187
Remarks
CoreRimCore
RimRim, phenoPheno
Groundmass cryst.
PhenoPhenoCoreRim
TABLE 9Modal Analyses (%) of Selected Samples From Hole 396B
BochumSample
No.
600980111011401180
860/8709401000102010301060109013601370
Plag.
15.615.515.617.721.917.316.115.723.718.214.918.714.58.1
Ol.
1.32.40.92.02.32.93.41.66.22.82.04.41.72.2
Glasses
83.082.183.480.375.879.580.481.268.379.082.277.083.889.4
Voids
0.1< 0.1
-0.3
< 0.11.61.9
< 0.011.0
< 0.1< 0.1< 1.0
Plag/ol.
12.06.5
17.38.99.56.04.79.83.86.57.54.38.53.7
Total (%)
100100.199.9
100100100100100.199.9
100.01100.1100.2100.1100.7
PountsCounted
28533615195719553687205919202301227323692152
10,94819892374
192
PETROLOGY AND GEOCHEMISTRY
Sample
No.
1 5 0 -
6006 1 0 "
620-
6 9 0 -
710/720-
860/ 87cf]DQΛ\•
y / Q ™
1090^.
1 1 1 *1 1 8 0 ^ ^ =
1280-
1360-
1370-
Depth
Im)
10
20
30
40
50
60
70
80
90
100
110
120
130
140
150
160
170
180
190
200
210
220
230
240
250
Volume percent phenocryst0 10 201 I l I l I i I I I i i
cp×-ol-pl-glomerocryst
aphyric(<1%ol>pl microphenocryst)
o
MagmaGroup
8
Chem.Unitshipb.)
A-1
A-2
A-3
B-l
B-2
C
D
Figure 2. Volume per cent of olivine (*) and plagioclase (o) phenocrysts plottedwith depth, for modally analyzed samples (see Table 9).
193

M. F. J. FLOWER ET AL.
Sample
No.
Depth
(m)
An-content in plagioclase
50 55 60 65 70 75 80 85' I I i i l I i i I I 1 I i i i I i i i i I i i i i I i i i i I i i i i I
Fo-content in olivine
75 80 85 90I i i I i I i i i i I I I I I L_
MagmaGroup
Chem.Unit
(shipb.)
5 0 -
150-
260-
Λ O O -
500-
610-620-
750/760-
810s860/870^9 1 0 ^ :9 3 0 ^1020^
11 0 0 -
1200-
1280-
1370-
10-
20-
30-
ΛO
50-
60-
70-
80-
90-
100-
110-
120-
130-
140-
150-
160-
170-
180-
190-
200-
210-
220-
230-
240-
250-
groundmasscrystals
phenocrysts
groundmass phenocrystscrystals
A-1
A-2
A-3
B-2
Figure 3. Ranges of plagioclase and olivine compositions for phenocrysts and groundmass crystals plotted with depth; datafrom electron microprobe analyses (see Tables 6 and 8).
194

cQ)CooI
12η
1 0 -
8 -
•T 'r-n 6 —
± 2-αo
50
groundmasscrystals
PETROLOGY AND GEOCHEMISTRY
phenocrysts
55I
60 65 70I
75 80 85
An-content in plagioclaseFigure 4. Molecular CafMg, Fe)Si^Og content in groundmass and phenocryst plagioclase plotted against anorthite; from elec-
tron microprobe data in Table 8.
Sample
No.Depth
(m)
MgO
8-5I
CaO
11.5i
TiO2
1.1 1.3 1.5 1-7
FeO*
10.0
K20
.05.1 .15 .2 -25_ l i i I I
AI 2 0 3 GlassGroup
Chem.Unit
(shipb.)
150-
210 •230.240'
290 •
320 •
400
450
750/760-7 8 0 -
8 1 •860/870 [_
890 ~~
1000
1100
1240-1250-
1280-1290
1 0 -
20-
30-
40-
50-
60-
70-
80-
90-
100-
110 -
120 -
130-
140-
150 -
160 -
170 -
180
190
200-|
210
220
230
240
250
Δ Δa b
Δ Δa b
Δ Δb a
Δ Δb a
ΔΔba
ΔΔa b
X-l A - l
Y-l
Y-2
X-2
X-3
A-2
A-3
B-l
B-2
Y-3
Figure 5. Plots of oxide contents for MgO, CaO, Tiθ2, FeO (total Fe-oxide), K2O,glass compositions. Liquid types are indicated.
versus sub-basement depth for
195
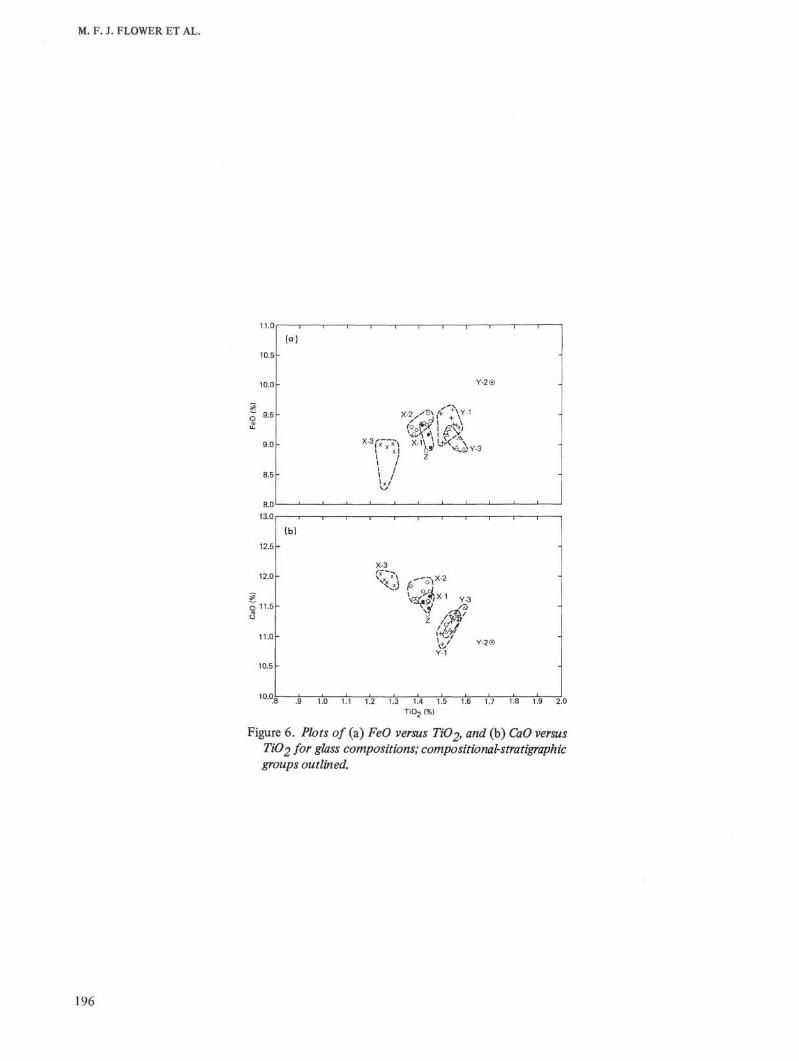
M. F. J. FLOWER ET AL.
(b)
×_3
-
-
$3Λ9I×~' Y _ 3
t / ^Y-1
Y-2®11.0-
.9 1.0 1.1 1.2 1.3 1.4 1.5 1.6 1.7 1.8 1.9 2.0TiO2 (%)
Figure 6. Plots of (a) FeO versus TiO2, and (b) CαO verswsTiC>2 for glass compositions; compositional-stratigraphicgroups outlined.
196

— 0.5r 15r _ 0.5r 15r
I "x ×*$^ I * *Λ«9O.o' 1 ' " ' • 1 ' 1 1 3 - o.θ' ' ' ' ' ' ' ' ' 1 3 -
3 ° 5 r " ^ °•5r
I ,..»v i I i ' **«?o.ol 1 ß—i 1 1 ' 1 1 o - o.o1 ' ' ' 1 1 1 1 1 o - ®
3.0r " 9 - x *$J& 3.0r & 9- 7^*1+
2.0 - 7 - _ 2.0 - 7 -
£• - x xx A^Δ - jj* - ^ V ß"H
1 0 . 5I 1 1 1 1 1 1 1 1 H 1 0 - 5I 1 1 « ' 1 ' " "
21r - 21 -
o.ol—i 1 1 1 1 1 1 1 - o.o' ' ' ' ' ' ' ' — '
_ 0.5r 19- 0.5r 19-
£ g
O.θl L_5U 1 1 1 1 1 1 o 1 7 - O.ol 1 1 ^ 1 ' ' 1 1 g 17-
4.0r - + 4.0r - + ~
| " x x t ^ - I B - × ^ ‰ | - «fc>0 15- •> ?CM CM
CO _ πs -
z •z.
1.0' 1 1 ' " 1 1 1 " 13' 1 > 1 " " " 1 1 1.0' ' 1 1 1 ' ' ' ' 13' ' ' ' ' ' ' ' '
15r 52r 15r 5 2 -
- x * - - * » »
xx Δ Δ % o og 13- g 50- V i q 1 3" g 50- + o ©
§ - . ^ £ • § - £ -11 - 48- 11 - ™ © 48-
9 9 8 7 6 5 4 6 9 8 7 6 5 99 8 7 6 5 4 6 9 8 7 6 5. w-/-i ia/\ n/i-n IO/Λ / I \ /lr. > lo/\ ^/ln^l /oz\
O
ε2&öd
833W
gH
Figure 7. Oxüe versus MgO variation for (a) X-type glasses and (b) y-fype and Z-type glasses; symbols: X-l = x, X-2 = Δ, X-3 = +, F-7 = , Y-2 = , 7-3 = o, a«d^ — '.
- J

0 0
Figure 8. Oxide versus MgO variation for (a) magma batches i- and 4-+ (related to X-type liquids), (b) batches 2- and 3-+ (related to Y-type liquids), and(c)batches 5-Δ and 6-x (related to X-type liquids), and 7-* and 8-0 (probably Y-types). All analyses are corrected for carbonate (see text) and normalized toa H2θ+-free basis. Those with less than 1.25% H2U+ ("fresh " samples) are outlined in terms of respective groupings. Representative tie-lines have been drawnbetween whole rock and associated glass cooling rind compositions.
I >
-I I 1 I U -" 1.0
_l 1 I U

SampleNo.
Depth SiO2
48 48-5 49 49-5 50I i i i i I i i i i I i i i i I i i i i I
TiO21.0 1.5
i I i i i i I i
AI 2 O 316 17 18 19
FeO*7 8 9 101 1 1 1 1 , 1
MgO5 6 71 1 1 1 I
CaO10 11 12 13
1 . 1 1 1 1 1
MagmaGroup
GlassGroup
Chem.Unit
(shipb.)
uo-180-
210-
260-
400-420-450-470-
590'62(6 3 0 ^7 0 0 ^710O-73θC^•750/760-
840910940
10201030106010701090110011101165117011801190
13601370
10
20
30
40
50
60
70
80-
90-
100-
110
120-
130-
UO•
150-
160-
170-
180-
190
200
210
220-
230-
2A0-
250-
r
i
X-l
Y-l
Y-2
X-2
X-3
Y-3
A-1
A-2
A-3
B-l
B-2
Figure 9a. Plots of major oxides versus sub-basement depth for whole-rock compositions. Magma groupings are indicated for their approximate stratigraphic occur-rence. Plots of Si02, Tiθ2, AI2O3, FeO (total iron), MgO, and CaO versus sub-basement depth.

tos 2TI<—i
TIro
90WH>
Sample Depth Na2O K20 P205 C02 H20+
M a g m a G , Q S S
C ^NO ( m ) | f | ^ < [ | 3 0-1 0.15 0-2 0.25 0.3 035 ^ 0.10 _ .15 _ _ -20 _ -25 1 •2 •3 •/, .5 •6 7 Of 1 1-5 2. 2-5 Q f O U p G r o u p ( s h i p b . )
50- 10- \ ^ > 1 / <
/ / \ \ \ ' X"' A"'
Ijg> 30- ^ ^ ^ ^ 3 . 7 Λ
180- \ i / ; /210- 50- \ < ' / j / 2 A-2
260- 1 ~~~~. \ J \
70-400-^_^A 2 ° -—^ fin ? 3 * ^ ^ > ^ • Λ -J.
èiS^100- \ / I / ^ >630^^ / \ / / /700. 110- / \ I J /
750/750 120- < ^ – — =** ^^---^=• ^—~~? ^ ^
910X 1 J ü - / \ . \ / \
i°£^i5°- \ ' / ^ _ i - ― _ ' -^― x-3 B•2
1100-^ J " S = = — > • ^ > " i ^=- —÷-^~ Riii^ i6°- -<L - *—^^ ^ ^ r -c —^5^ 6
i‰y 170-11907
180-
190-
200- °
210-
220-
230-1360- . . . . . ^ ~ r ~ ^ •1370- 240- *
250- 8 Z D
Figure 9b. Plots of major oxides versus sub-basement depth for whole-rock compositions. Magma groupings are indicated for their approximate stratigraphic occur-rences. Plots ofNa2θ, K2O, P2O5J CO2, and ^2^+ versus sub-basement depth.

PETROLOGY AND GEOCHEMISTRY
O 11.5
3
1.0 1.1 1.2 1.3 1.4 1.5 1.6 1.7 1.8 1.9 2.0
Figure 10. CaO versus Ti(?2 for whole rock compositions,carbonate-corrected and normalized to a U2θ+-freebasis. Tie-lines drawn to associated glass cooling rindcompositions; magma batches 1 = ; 2 = A, 3 = D,4 =x,5 = +, 6 = o, 7 * and 8 = 4, outlined for samples with1.25% H2O
+.
110
90
o t u
320
300
280
260
240
220
200
i a n
(d)
-
-
\ N N 4
•
2 ^ Δ "
(Δ /\ Δ *
* 7
I/ ^..
f"°\
\\ o C
3 ^ ^
i
*s -\1
α r] |
-
-
i
50 60 70 80
Zr (ppm)
110
100 110
Figure 11. Plots of large ion lithophile elements versus Zr: (a) Ti02, (b) Y, (c) Sr, (d) V; magma batches are outlined (chon-dritic Ti/Zr av. - 103, Leg 46 range: 107 to 92 fX-3 to Y-2J; chondritic Y/Zr av. - 0.43, Leg 46 range: 0.46 to 0.32 fX-3to Y-2J; chondritic Sr/Zr av. a 2.8, Leg 46 range: 2.8 to 1.3 [X-3 to Y-2]; and chondritic V/Zrav. * 12, Leg 46 range: 4.2to 2.6 [X-3 to Y-2J ).
201

M. F. J. FLOWER ET AL.
Figure 12. Plots of Cr versus MgO with postulated magmabatches outlined. Magma batch 1 = ;2 = , 3 = ,4 = x,5 = +,6 = o, 7=*, and 8 = +.
25
20
15
10
8
I I I I I I L 1
1030
i i I i I
25
20
15
10
8
- 1070
i i i I
2520
15
10
8
1370
i i i i I I I I
2520
15
10
8
6
690—630—840
La Ce Pr Nd Pm Sm Eu Gd Tb Dy Ho Er Tm Yb Lui i i i
La Ce Pr Nd Pm Sm Eu Gd Tb Dy Ho Er Tm Yb Lu
Figure 13. Plots of chondrite-normalized rare earth element abundances, with increasing rare earth atomic number, accordingto magma batches: (a) 1, (b) 2, (c) 3, (d) 4, (e) 5, (f) 6, and (g) 8, and in (h) a summary for the respective magma batchranges.
202


M. F. J. FLOWER ET AL.
PLATE 1Figure 1 Olivine-Plagioclase-Clinopyroxene glomerocryst.
Bochum Sample 150; DSDP Sample 396B-8-2, 3-7cm. O = Olivine, C = Clinopyroxene.
Figure 2 Plagioclases. Bochum Sample 610; DSDP Sample396B-15-5, 108-111 cm.
Figure 3 Plagioclases. Bochum Sample 1110; DSDP Sample396B-22-2, 8-12 cm.
Figure 4 Plagioclases. Bochum Sample 700; DSDP Sample396B-16-5, 34-36 cm.
204

PLATE 1
PETROLOGY AND GEOCHEMISTRY
0.5 mm 1 mm
205

M. F. J. FLOWER ET AL.
PLATE 2Plagioclases
Figure 1 Bochum Sample 1170; DSDP Sample 396B-22-3,49-56 cm.
Figure 2 Bochum Sample 860/870; DSDP Sample 396B-20-1,70-80 cm.
Figure 3 Bochum Sample 600; DSDP Sample 396B-15-5,102-105 cm.
Figure 4 Bochum Sample 910; DSDP Sample 396B-20-2,58-67 cm.
206

PETROLOGY AND GEOCHEMISTRY
PLATE 2
0.5 mm 0.5 mm
207

M. F. J. FLOWER ET AL.
PLATE 3Plagioclases
Figure 1 Bochum Sample 840; DSDP Sample 396B-20-1,35-42 cm.
Figure 2 Bochum Sample 710/720; DSDP Sample 396B-17-1,4-7 cm.
Figure 3 Bochum Sample 1100; DSDP Sample 396B-22-1,125-134 cm.
Figure 4 Bochum Sample 1100; DSDP Sample 396B-22-1,125-134 cm.
208

PETROLOGY AND GEOCHEMISTRY
PLATE 3
0.5 mm
0.3 mm 0.5 mm
209

M. F. J. FLOWER ET AL.
PLATE 4Plagioclases
Figure 1 Bochum Sample 50; DSDP Sample 396B-5-2, 87-98cm. O = Olivine.
Figure 2 Bochum Sample 160; DSDP Sample 396B-8-3, 25-30cm.
Figure 3 Bochum Sample 400; DSDP Sample 396B-14-1,121-127 cm.
Figure 4 Bochum Sample 780; DSDP Sample 396B-18-1,22-27 cm.
210

PETROLOGY AND GEOCHEMISTRY
PLATE 4
0.5 mm 1 mm
0.3 mm
211

M. F. J. FLOWER ET AL.
PLATE 5Olivines
Figure 1 Bochum Sample 860/870; DSDP Sample 396B-20-1,70-80 cm.
Figure 2 Bochum Sample 260; DSDP Sample 396B-11-2,27-33 cm. O = Olivine.
Figure 3 Bochum Sample 860/870; DSDP Sample 396B-20-1,70-80 cm.
Figure 4 Bochum Sample 1370; DSDP Sample 396B-32-1,59-62 cm.
212

PLATE 5
PETROLOGY AND GEOCHEMISTRY
1 mm 0.2 mm
213