8> 8 - superfund records collections | us environmental ... · the results of thip analysis are...
TRANSCRIPT

8
tsoes
Os -5* «u
8>
"81a.
to
«t*
3/ow '
flR3!8336

8
?5
8R318337
ONO
60«tno•oCO
IQ.rf iHg s
«•oa Itos
<4HO4Jo
E
S S S § g3/ow'sanos
F6

CO4J«-l
0>V
CM 0£&4 e<u ofl i-l.O 4JCO COH 4354JaO
Uo a.tt I-rt ^jl EJ1 &O I-ift. Oft.
•oorH "C
C fl)Ih (fl3tfi
•O0)&11tos•o01c4)10rO
IB•HUOO
i
*«
00
AJ0.O0
CO•atHOOO
coH>,Q
4Je<vJJ<u
0),_Jl-(0w
aiy4Ja<cu
o0i-lU.
0)txca- aca
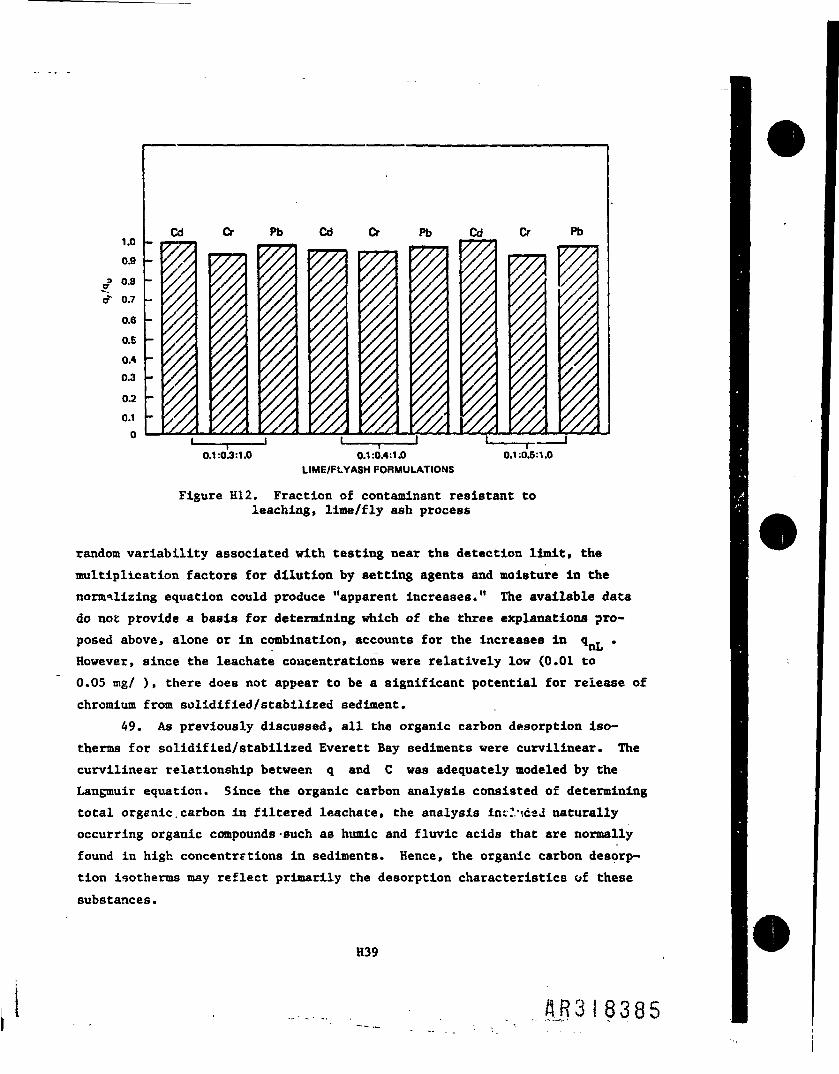
1M(3
•a41
1os
f<«
g
rS
°<*gE
(0<uB
o
0)N•H«1
BO4a
4JU
•ao|4a.
oCMONNOrH
inomenen
eni .00
inen-a-
oo0.
0.
oin
CMON
NHUCO
enO^CM*
t**enONm<f
inmON
»*
in«v
•H
(b
^
inf<<k
oCMOCM
U•
<£nJu
4
f
NOc*>CM
f .rtON*3*CM
00
NO
CMen,_<
0Oft.
ft,
oin
>J8£FH«U
ONf*>
CMOCM
0en<Ten-1
00ONOO
<nCM« f
o0ft.
i
mCM
CMAtg£E*4cu
NOr"»,en
•
<4CM
CMen«— 4
CM_4ON
inNOen
Ooft.
j|.
inCM
«i-l00\ft
•
M
O4£
inO^enCM
* -•*CO«CM
OoON
•*_en
14•H
£>!
x
inen
inC*-4
Oupj4Z
^m00m>4
CMenON00NO
r-.CM
Is"CMCM
•H03
4-t-3
0of-«
ONf•-4
Ou(.J49*z
esi tM NO ^» OO •-> CM enr in »» CM r*ON CM CM
•-> O OO *3" CJNNO CM ON r*> 4oo ON oo *-^ menfM
« en in -4 JNNO »H en m ^ON ON ON ON ON
oo en o NO o*^ CM NO ON Oi— i NO «* m iri
U l-c U•H 1-1 -Hetf co tdfx. 3 *O CM (&«o o. o O> o o > >
J S w S £
in en en <~> entN
wO OO Oo •-< m
< ^ C O D ^C 0 1 ** 00\O H pij
!•». • •
8 . o 0N CJ 0 o
*J (H »J K OM4<JJ J « (« (ljz pa u % 3:F7
s • ,v—/ .^-.'-.-..'A ,"v ' v .- .*ER3!:83-39
«l« o ooC O M
f-4 Cd • CO UO f-l O
41 O •-!•O W $Ni-l XU-l »s
N -H IW fH i-l f-l O01-I4J 4J B «J *J O

costs. The emulsion polymers were found to be Ineffective when applied tothirf mc.r.-.'rial, and were eliminateJ from further consideration. Polymers thatproduced less than 85-v«rcent removal of suspended solids were also eliminatedfrom further consideration.
9. Following the initial technical effectiveness evaluation, the cost-effectiveness of the remaining polymers was evaluated. This was accomplishedby calculating the estic>?red cost per ton of solids removed for each polymer.The results of thip analysis are also summarized in Table F2.
10. The dry polymerc had the lowest optimum dosage and cost. However,because of the complexity of dry polymer handling equipment, the Mquidpolymers are preferred. Therefore, polymers NALCO 503, Clarifloc C-2020, andMagnifloc 581 were selected as having the greatest potential for applicationto the Everett Bay Homeport Project.
Conclusions and Recommendations
Conclusions11. Based on the results of this study, it is concluded that:
£. Chemical clarification using polymer addition is an effectivemethod for improving the removal of suspended solids from siteeffluents generated by disposal of Everett Bay dredgedmaterial.
b_. The dry polymer Hercofloc 1018 was found to be the mosteffective at low dosage rates; however, to obtain ar adequatemixing of this polymer at the site may be very difficult andwill require more handling equipment to be installed.Therefore, Hercofloc 1018 was not recommended.
c, Low-viscosity, highly cationlc liquid polymers were found to bethe most effective and the simplest to use for simulatedEverett Bay site effluent.
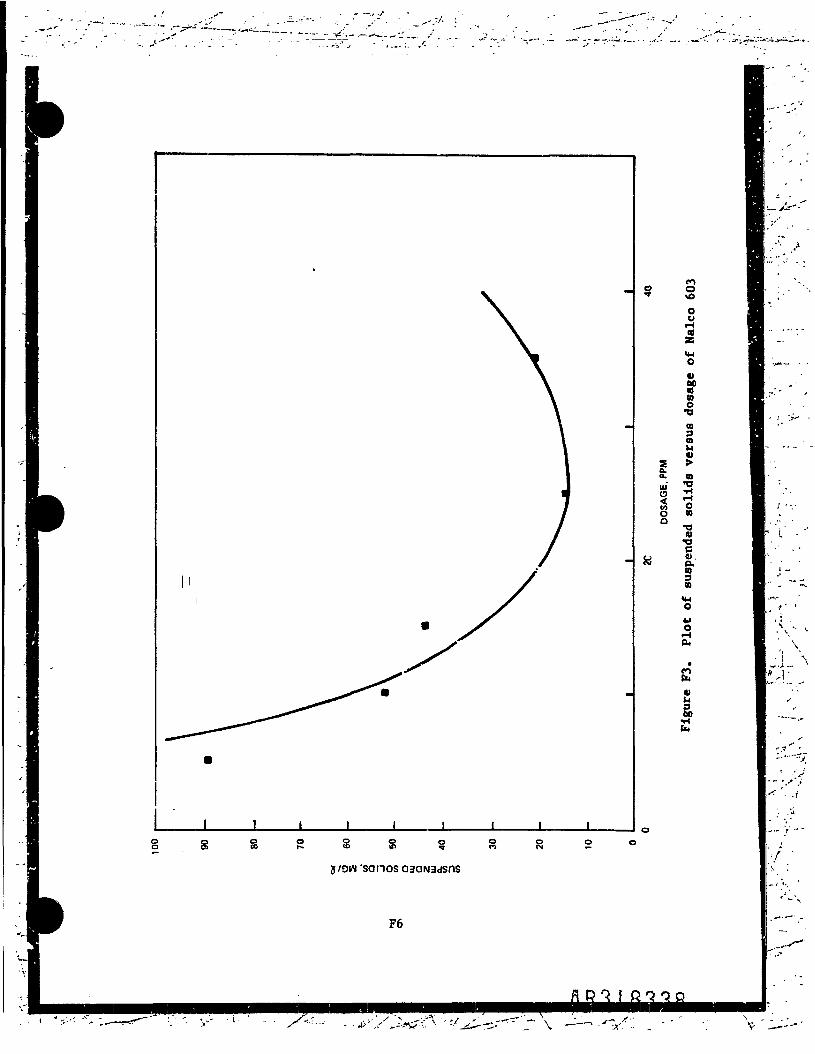
d_. Based on the analysis of cost per dry ton solids removed,NALCO 603 liquid cationic polymer appeared to be the most costeffective. The optimum dosage rate for NALCu 603 wasdetermined to be approximately 25 mg/l.
e. Magnifloc 581 and Clarifloc C-2020 can be used a& alternate~~ polymers should NALCO 603 be unavailable.
F8

Recommcndat ions12. Based on the retults of this study, it is recommended that:
£. If chemical clarification is required, NALCC 603 liquid polymer~ should be used es the coagulant.b. If NALCO 603 is not available, then Magnifloc 581 or Clarifloc~ C-2020 should be used.£. The overall rest of handling the Hercofloc 10X8 should be~" compared to the NALCO 603. If the cost of Hercofloc 1018 is
vezy low compared to the cost of NALCO 603, the complexibilityof handling this polymer may be justified.
F9

APPENDIX G: CONSOLIDATION TESTING
This appendix presents the results of a consolidation test conductedusing the composite sample of Everett Harbor contaminated sediment. The testprovides data for evaluation of filling and settlement rates for confinedsites. The test results are applicable for evaluation of both intertidal andupland sites. The tests were conducted using standard odometers and pro-cedure developed specially for soft sediments (see K. U. Cargill, 1983,"Procedures for Prediction of Consolidation in Soft, Fine-Grained DredgedMaterial," Technical Report D-83-1, US Army Engineer Waterways Experiment
Station, Vicksburg, Miss.).
Gl

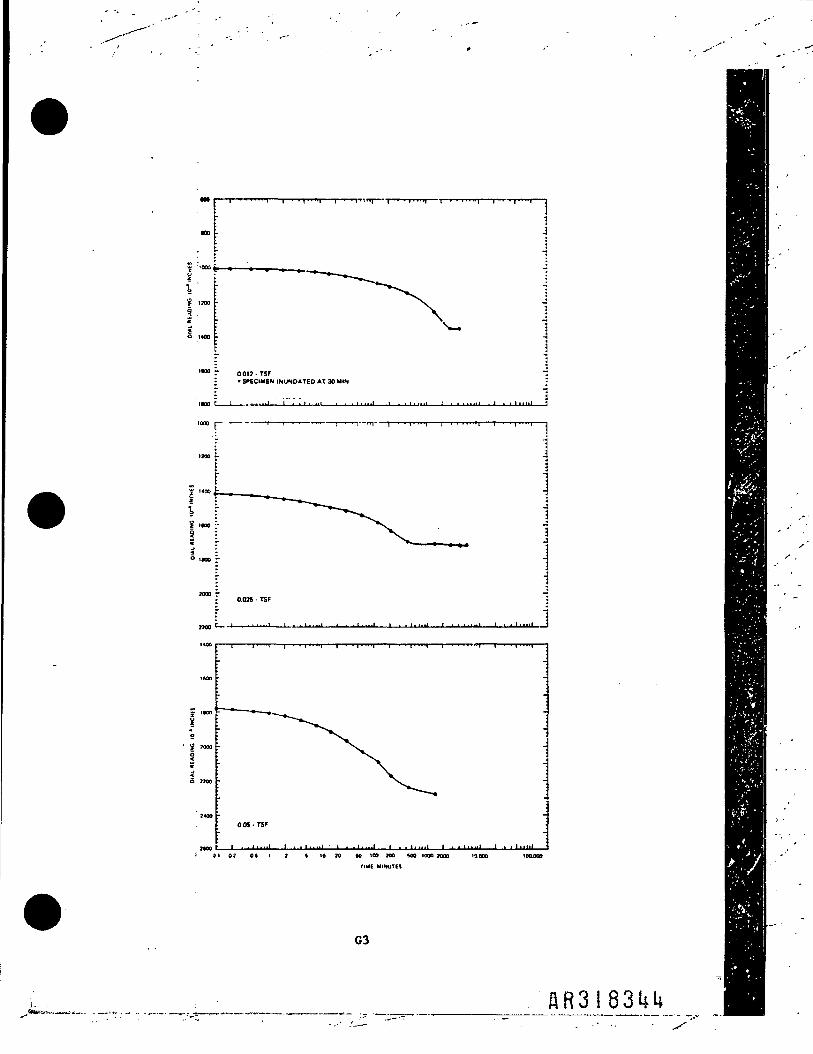
0.01 O.O2 0.03 046 0.1 0.3 0,3 0.4 1 2 3 t 10
O
1 3
i I i I i . i I0.01 0.02 0.03 0.06 0.1 0.2 0.3 0.6 i 2 3 S 10
PRESSURc, TSF
BEFORE TEST AFTER TEST
OVERBURDEN PRESSURE. TSF
PRECONSOL. PRESSURE. TSF
COMPRESSION INDEX
TYPE SPECIMEN
DIA. IN 4.44
UNDISTURBED
HT. IN 1.236
WATER CONTENT. %
DRY DENSITY, PCF
SATURATION.
VOID RATIO
BACK PRESSURE, TSF
166.1
30.6
4.817
ee.256.1
100-
3.003
CLASSIFICATION ORGANIC SILT (OH). GRAYISH BLACK
L*. 116 PL 67 PI SB
G3 2.70 <EST)
REMARKS
PROJECT EVERETT BAY. WA
BORING NO. -
DEPTH/ELEV -
SAMPLE NO. -
DATE 11 FEB8S
CONSOLIDATION TEST REPORT
SHEET OF
G2
J MO)
s£<o noo
2MO -
: on • TSF
20 U 100 TOO MO 1000 7000 10.000
TIME MINUTES
G3
flR3!83l*i»

o.»-T$f
0 1 0 2 01 1 2 t 10 20 10 tOO 900 MO 1000 MOO 10.000
GA

I MHO
S
oi az at i 7 i to 20 H 100 200 uo 1000 2000 itooo 100.000
G5

APPENDIX H: PROCEDURES FOR EVALUATION OF SOLIDIFICATION/STABILIZATION TECHNOLOGY
Introduction
1. When contaminated dredged material with a potential fee leaching isdisposed in an upland site, the site must be planned co prevent ground-waterpollution. Current strategies for minimizing ground-water pollution includeproper site selection, dewatering to minimize leachate productior, lining ofbottom and sides to prevent leakage and seepage, capping to minimize infil-tration and thereby leachate production, and leachate collection and treat-Bent. Economic considerations and tough environmental constraints fordisposal are providing initiative for developing innovative approaches toupland disposal of contaminated dredged material. With proper development,new strategies such as acidification/stabilization of dredged material toprevent or retard leaching and the use of clean dredged material to adsorbcontaminants in leachate draining from solidified/stabilized dredged materialcould provide the disposal technology needed to contain and iutobilize con-taminants in an upland site.
2. Solidification/stabilization is a state-of-the-art technology forthe treatment and disposal ox' contaminated materials. The technology has beanapplied in Japan to bottom sediments containing toxic substances (KitP andF..OO 1983, Nakamura 1983, Otsuki and Shiira 1984) and in the United States toindnstrial wastes (Pojasek 1979; Malone, Jones, and Larson 1980). Tittlebauraet al. (1985) reviewed the current technology and its potential application towastes high in organic contaminants. Because of sediment contamination inparts of Everett Bay, innovative contaminant immobilization techniques may beneeded to satisfy site-specific environmental constraints for disposal.Experiences in Japan with bottom sediments and in the United States withIndustrial sludges indicate that solidification/stabilization is a promisingcontaminant immobilization technology for materials that show a potential forleaching.
3. Solidification is the process of eliminating the free water in asemisolld by hydration with a setting agent(s). Typical setting agentsinclude portland cement, lime, fly ash, Kiln dust, slag, and combinations ofthese materials. Stabilization can be both physical and chemical. Physical
HI
stabilization refers to improved engineering properties such as bearing capac-ity and trafficability. Chemical stabilization is the alteration of the chem-ical fora of the contaminants to make them less soluble and/or less leachable.Solidification is a physical stabilization process that usually, but notalways, provides some chemical stabilization.
4. Since physical stabilization and solidification are equivalent interms of the end products, the terms are often usec interchangeably, withsolidification being the more commonly used term. The literature also usesthe terms "chemical stabilization" and "stabilization" interchangeably, albeit ____
BBHnot without some confusion.
5. Solidification (physical stabilization) immobilizes contaminantsthrough alteration of the physical character of the material. The developmentof structure immobilizes contaminated solids (i.e., the solid mass is dimen-sionally stable), and the solids do not move. Since most of the contaminantsin dredged material are tightly bound to the sediment phase, solidification isan important immobilizing mechanism (Kita and Kubo 1983). Solidification alsoretfur.es, the accessibility ot water to the contaminated solids within thecemented matrix. Water accessibility to the contaminated solids is an impor-tant factor because it partially determines the rate at which contaminants are
\leached.
6. Solidification/stabilization processes are usually formulated tominimize the solubility of metals by controlling pH and alkalinity. Addi-tional metal immobilization can be obtained by modifying the process toinclude chemisorption (Myers 10J5). Because anions are typically more diffi-cult to bind in Insoluble compounds, most solidification/stabilization pro-cesses rely on microencapsulation to immobilize anions. Some vendors ofsolidification/stabilization technology claim to be able to immobilize organiccontaminants. There is as yet, however, no scientific evidence that stabili-zation of organic contaminants against aqueous leaching occurs using cement-and pozzolan-based systems (Tlttlebaum et al. 1985). Practically no publishedinformation exists on the aqueous leaching of organic contaminants fromsolidified/stabilized materials. Further, the state of the art for processdesign is primarily empirical. Thus, a process formulation cannot be designedon the basis of chemical characterization of the material to be solidified/stabilized alone. It is, therefore, necessary to conduct laboratory leachtests to evaluate chemical stabilization effectiveness. Although chemical
H2
AR3I83I*8

stabilization has to be evaluated on a case-by-case basis, isolation of con-taaina-ed dredged material solids in a cemented matrix appears to be a prom-ising technology for significantly reducing or eliminating the release ofcontaminants, particularly metals, from dredged material.
7. The technical feasibility of reducing contaminant mobility inEverett Bay sediment by solidification/stabilization was investigated in aseries of laboratory-scale applications of selected solidification/stabilization processes. The processes evaluated were portland cement, port-land cement with Firmix (a proprietary additive), Firmix, and lime with flyash. All of these processes are commercially available.
Materials and Methods
Materials
8. Sediment acquisition, mixing, and transportation procedures havebeen previously described. The sediment was stored at 4° C until used. Priorto use, the contents of the sediment container (55-gal* drum) were mixed andsieved through a 1/4-in. sieve to remove large wood chips that were present inthe sediment. No other processing (e.g., dewatering) was applied prior toapplying the various solidification/stabilization processes. Type I portlandcement was used in the processes involving portland cement, class C fly ashwas used in the processes involving fly ash, and hydrated lime was used in thelime with fly ash process. The proprietary additive, Firmix, is a solidifi-cation agent that is commercially available. Firmix was obtained from TridentEngineering, Baltimore, Md.Laboratory processing
9. The process additives were mixed with sediment in a Hobart C-100mixer (2.5-gal capacity) for 5 min per additive. After mixing, the freshlyprepared solidified sediment was cast in 2-in. cube molds for unconfined com-pressive strength testing and standard compaction molds for chemical leachtesting. The samples were stored at 98-percent relative humidity and 23" Cuntil tested. A standard cure, time of 28 days was used in all of the testingunless otherwise noted.
* A table of factors for converting non-Si units of measurement to SI(metric) units is presented on page 14 of the main text.
K3
i,-,': QR3I83U9

Experimental design10. Each process was applied in three formulations. The formulations
for each process differed in respect to the dosage of setting agent used, notthe types of agents used. By testing different processes in varying formula-tions, data were obtained for making comparisons among processes and processformulations.
11. Unconfined compressive strength was the key test for physical sta-bilization; the serial, graded batch leach test was the key test for chemical K8HHBI"''/' -•
B B B B B B Hll S '•**' **stabilization. Leach tests and unconfined compressive strength tests wereconducted on each process formulation.Physical properties testa
12. Unconfined compressive strength (UCS) was determined according tothe ASTM Compressive Strength of Hydraulic Cement Mortars (C-109) procedure.Three replicates were run for each determination at 7-, 14-, 21-, and 28-daycure time intervals. In addition, uuconfined comprecsiv* strength at 60- and90-day cure times was determined for some formulations.Serial, graded batch leach tests
13. Background. The serial, graded batch leach test is a simplifi-cation of the sequential batch leach test described in Appendix C. In theserial, graded procedure, a sample is leached one time at several liquid-solids ratios (Houle and Long 1980). A table of solid phase and aqueous phaseconcentrations is developed from analyses of the leachatee produced. These mg aaem —•» -^ ^ ^ lomB i >. •data are plotted to produce a desorption isotherm. This procedure is simplerthan the sequential leach procedure because the mass of solids being leachedhas to be measured and handled only once.
14. From the desorption isotherm, contaminant-specific coefficients canbe obtained that describe the interphase transfer of contaminant from thesolid phase to the aqueous phase. The Interpretation of data from serial,graded batch leach tests is similar to the interpretation previously described BTTflCffff -/-"'in Appendix C for data from sequential batch leach tests. Of particularimportance is Equation C5 (Equation HI below) and Figure C5 of Appendix C.
qt - KdC + qr _ (HI)
H4
A-R3I8350
I-'-

\
quation HI assuaes that a fraction of the solid phase contaminant concentra-ion is resistant to leaching and the solid to liquid phase transfer of the.••enable fraction is governed by a reversible process. In this model, the•elationship between the solid phase concentration, q , and the aqueous phase:onc«ntration, C , is linear. Two parameters describe the relationship, alistribution coefficient, K, , that relates leachable solid phase concentra-
Q:ion to aqueous phase concentration and the solid phase concentration resis-:ant to leaching, q . Similar models have been used in various studies oncontaminant mobility in sediments (Di Toro and Horzempa 1982, Jaffe andFerrara 1983). If the desorption Isotherms obtained frca leach tests are notlinear or do not provide a well-defined relationship between solid and aqueousphase concentrations, other models and approaches to interpreting the data maybe necessary.
15. The serial, graded batch leach procedure assumes that the liquid-solids ratio does not affect the chemistry of the leaching process, i.e., thedistribution coefficient is not dependent on liquid-solids ratio. The litera-ture indicates that this assumption is probably not correct for untreatedsediment although the reason for this is not entirely clear (Voice, Rice, andWeber 1983; Di Toro et al. 1986). For solidified/stabilized sediment, changesin the chemistry of the aqueous phase with varying liquid-solids ratio proba-bly have a more profound effect on interphase contaminant transfer thanchanges in the concentration of solids. Specifically, if pH variessignificantly, the solubility of Mtals will vary. The excess alkalinity ofthe solidification reagents, however, tends to stabilise pH.
16. Chemical leach tests. Serial, graded batch leach tests were run onsamples taken from the center of the 4-in,-diam specimens cast in compactionmolds. The 4-in. specimens were broken apart to obtain the samples forchemical leach testing. The samples were ground on a Brinkman centrifugalgrinding mill to pass a 0.5-nm screen before leach testing. The leach pro-cedure consisted of contacting solidified sediment samples with distilled-deionized water on a mechanical shaker for 24 hr in liquid-solids ratios asfollows: 100 ml:50 g, 100 ml:20 g, 100 mis 10 g, 100 ml:5 g, and 100 ml:l g.The extractions were run in triplicate in 250-ml polyethylene bottles laid inthe horizontal position. After shaking, the mixtures were filtered through0.45-u membrane filters and analyzed for arsenic, cadmium, chromium, lead,
H5
AR3I835

zinc, and organic carbon. Blanks were prepared by carrying deionized-distilled water through the same shaking and filtration procedures. Chemicalanalysis procedures arc described in Appendix C.
17. The chemical leach data were reduced to tables of solid and aqueousphase concentrations using the calculations described below. The solid phasecontaminant concentration after leaching is given by:
Solidified sediment Solidified sediment Mass of contaminantcontaminant contaminant leached_____concentration - concentration - Mass solidifiedafter leaching before leaching sediment leached
orq . q _ C(V/M) (H2)
q • total contaminant concentration in the solid phase afterleaching, mg/kg
q » initial contaminant concentration in the solid phase, mg/kgC • contaminant concentration in the leachate, mg/iV - volume of aqueous phase (leachate), £
M • mass of solidified sediment leached, kg
Equation H2 relates to a single contaminant. Siuce the liquid-solids ratio(L/S) is given by V/M , Equation H2 can be written as
q - qo - C(L/S)
Equation H2 was used to calculate the solid phase concentration, q , corre- •spending to the aqueous phase concentration determined by chemical analysisfor the L/S used. Since all the tests used 100 ml of distilled-deionizedwater, the L/S is 100 ml divided by the mass of solidified/stabilized sedimentleached in grams.
18. The initial solid phase concentration, q , for each contaminantis given by the following equation
H6
flR318352

(H3)Ho (1 + w)(l + R)
whereS « contaminant concentration in the sediment before
solidification, mg/kg (dry weight basis)w « moisture content of the wet sediment, kg water/kg sediment
solidsR •> dosage of solidification/stabilization reagents, kg
reagents/kg wet sediment processed
The aoistur* content of the sediment was 1.572 kg/kg, and values for S aregiven in Table Cl, Appendix C. of this report.
Results
Physical properties19. The UCS for the portland cement, portland cement with Firmix,
Firmix, and lime with fly ash processes was measured at cure times of 7, 14,21, and 28 days. These data are presented in Tables HI through H4, and areplotted in Figures HI through H4. The points in the figures are averages ofthree replicates.
20. The UCS data showed, as expected, that the higher the additivedosage, the higher the strength of the solidified product. For example, the28-day UCS for the 0.05 portland cement:! sediment weight ratio was 35 psi;for the 0.1:1 weight ratio of portland cement to sediment the 28-day UCS was71 psi, and the 28-day UCS for the formulation using a 0.2:1 weight ratio ofPortland cement :o sediment was 226 psi. The gain in UCS with cure time forthe various portland cement formulations is shown in Figure HI. For thePortland cement with Firmix process, the optimum formulation for strengthdevelopment was the formulation using equal proportions of portland cement andFirmix. This is shown in Figure H2. As shown in Figure H3, a higher dosageof fly ash in the fly ash with lim~ process formulation produced a strongerproduct. The 28-day value for the 0.5 fly ash:0.1 lime:1.0 sediment formula-tion in Figure H3 is questionable. One of the three replicates for this pointis in agreement with the data for the other points on the strength versus cure
H7
AR3I8353

Table HIComparison of Unconfined Compressive Strengths for Various
Portland Cement /Sediment Formulations
Formulation*
0.05/1.00.1/1.00.2/1.0
71644150
Unconfined
14
296417
CompressiveCure Time,
2132*70188
Strength, psi,days
283571226
by
602474210
* Portland cement/sediment.
Table H2Comparison of Unconfined Compressive Strengths for Various
Formulation*0.1/0.2/1.00.15/0.15/1.00.2/0.1/1.0
Portland Cement/Firmlx/Sediment Formulations
Unconfined Compressive StrengthCure Time, days
7 14 21225 359 484361 472 562242 341 **
, psi,
28507605385
by
60536711485
* Portland cement/Firmix/sediment.** No data.
H8

Tabls H3Comparison of Unconfined Compressive Strengths for Various
Formulation*0.4/1.00.5/1.00.6/1.0
Firmix/SediTsent
Unconfined
7 144 55 217 22
Forwulations
CoBprensive StrengthCure Time, days
, pc.ii
21 2G 603 728 5338 274 1
93111.153
. by
905655601,176
* Firalx/sediment.
Table H4Comparison of Unconfined Compressive Strengths for Various
Type C Fly Ash/Lime/Sediment Formulations
Formulation*0.3/0.1/1.00.4/0.1/1.00.5/0.1/1.0
_2132335
Unconfined
U173848
CompressiveCure Time,
21163657
Strength, psi, bydays
282651199
60497275
* Fly ash/lime/sediment.
H9
i r> •••• r- r~1 8355

PORTLAND CEMENT: SEDIMENT RATIO• 0.05:1.0• 0.1:1.0A 0.2:1.0
20 40 60 80 100CURE TIME. DAYS
Figure HI. Unconfined compressive strength, portland cement process
time curve. The other two replicates were extremely high relative to theother data for the lime with fly ash process, possibly due to an instrumentmalfunction during UCS testing.
21. The fly ash/lime process produced the product with the lowest UCSat 28 days, and the portland cement with Firmix process produced the productwith the highest 28-day UCS. The Firmix process produced the highest 90-daystrength of all the processes tested (1,176 psi).
22. The steady gain in strength with cure time recorded for all of theprocess formulations, Figures H1-H4, showed that the sediment solidifieddespite the potential for interference from the various contaminants in thesediment. If the setting reactions responsible for solidification were notoccurring, the products would not gain strength as they cured. This is asignificant finding in light of what is known about the potential for inter-ference (Jones et al. 1985).
23. There is, however, evidence of retardation in jet time for theFirmix formulations. The strength versus cure time curves in Figure H4 showed
HiO
QR3I8356

PORTLAND CEMENT: FIRMIX: SEDIMENT RATIO• 0.1:0.2:1.09 0.15:0.15:1.04 0.2:0.10:1.0
20 40 60 80CURE TIME. DAYS
Figure H2. Unconfined compressive strength, portand cement/Flmix process
that strength is continuing to develop beyond 28 days. Firmix usually reachesmaximum strength in about 30 days with clean sediments.*
24. The range in product strengths, 35 to 1,176 psi, is indicative ofthe versatility and flexibility of solidification as a treatment process forimmobilizing the contaminated solids in Everett Bay sediments. For compar-ison, the unconfined compressive strengths of concrete clays of various con-sistency end solidified Industrial sludge, are shown in Table H5. Solidified/stabilized Everett Bay sediments had strengths that were above the rangenormally associated with hard clay and solidified industrial sludge and belowthe range normally associated with low-strength concrete.Chemical leach data
25. Analysis of the blanks. Analysis of the blanks analyzed during thechemical leach tests is summarized in Table H6, which lists the detection
* Personal Communication, 1986, Mitchell Kaplan, Trident Engineering,Baltimore, Md.
Hll
ftR318357

FLY ASH: LIME: SEDIMENT RATIO• 0.3:0.1:1.0• 0.4:0.1:1.0A 0.5:0.1:1.0
I ^^ CURE TIME, DAYS
Figure H3. Unconfined compressive strength, Firmix process
limits, range, mean, standard deviation, and 95-percent confidence intervalfor arsenic, cadmium, chromium, lead, zinc, and dissolved organic carbon(DOC). The blanks were generally near or below the chemical analyticaldetection limits. Arsenic, zinc, and DOC were below the detection limit forall the blanks. Cadmium, chromium, and lead were above the detection limitsin the majority of the blanks. Leachate samples with contaminant concentra-tions within the 95-percent confidence Interval or concentrations below thedetection limits were considered not distinguishable from the blanks and wereassigned contaminant concentrations equal to the value for the 95-percentconfidence interval. Chromium had two blank concentrations that wereextremely high, thus driving the value for the 95-percent confidence intervalup. The high values were 0.014 and 0.021 mg/t, and could be consideredoutliers. They were not discarded from the data set, however, because anexplanation for these high values could not be reconstructed from an examina-tion of the laboratory notebooks. The 95-percent confidence irierval valuesfor cadmium and lead were not affected by data that could be outliers. When
H12
AR3I8358

1.4 i-
FIRMIX: SEDIMENT RATIO• 04:1.0A 0.6:1 JO
Xtcfc 1.0
ccfcuj 0.8
g111
0.68OuiC 0.4
0.2
00 20 40 60 80 100
CURE TIME, DAYS
Figure H4. Unconfined compressive strength, lime/fly ash process
determining the various statistical parameters, concentration values less thanthe detection limit were given a value equal to one half the detection limit.
26. Desorption isotherm data. The results from the serial, gradedbatch leach tests conducted on portland cement, lime with fly ash, Firmix, andportland cement with Firmix solidified/stabilized Everett Bay sediments arepresented in Tables H7 through H18. The tables are organized by process andprocess formulation. Each table contains data for one process formulation.The first column in each table lists the nominal liquid-solids ratio. Themass of solidified sediment leached with 100 ml of water is presented in thesecond column. The remaining entries in each table list aqueous phase con-taminant concentration, C , and the corresponding solid phase concentration,q , for five metals and organic carbon. Differences in solid phase concen-tration for identical aqueous phase concentrations at the same liquid-solidsratio reflect slight differences in the amount of solids weighed for leach
H13

Table H5Uneonfined Compressive Strengths of Various Materials
UnconfinedCompressiveStrength
Material Type psiClay Very soft <3.5
Soft 3.5-7Medium 7-14Stiff 14-28Hard 28-**Very hard 56
Concrete Low strength 2,000Medium strength 5,000
Soil-like FGD sludge 23-43solidified waste Electroplating sludge 32(Bartos and NI/CAD battery sludge 8Palermo 1977) Brine sludge 22
CA fluoride sludge 25
testing. The aqueous phase concentration, C , refers to the contaminant con-centration in the filtered (0.45-p) leachate.
27. Desorption isotherms were plotted for the- data in Tables H7-H18.Representative desorption isotherms are presented in Figures H5-H8. Theisotherms in this set of figures illustrate the important features of thedifferent types of isotherms that were obtained, as discussed below.
28. Classification of desorption isotherms. A classification schemewas developed to provide a convenient framework for interpreting the desorp-tion data. The data collected from the serial, graded batch leaching testsfall into four general classifications: no-release, low-release, clustered,and curvilinear isotherms. The characteristics of these desorption isothermclassifications are discussed below. Table H19 lists the processes by for-mulation and the respective desorption isotherm classification for eachprocess formulation and contaminant.
29. For some of the desorption isotherm data, the leachate concentra-tions were within the 95-percent confidence interval for the blanks for all ofthe liquid-solids ratios used in the series of leach tests. The tests in
H14
3R3I836Q
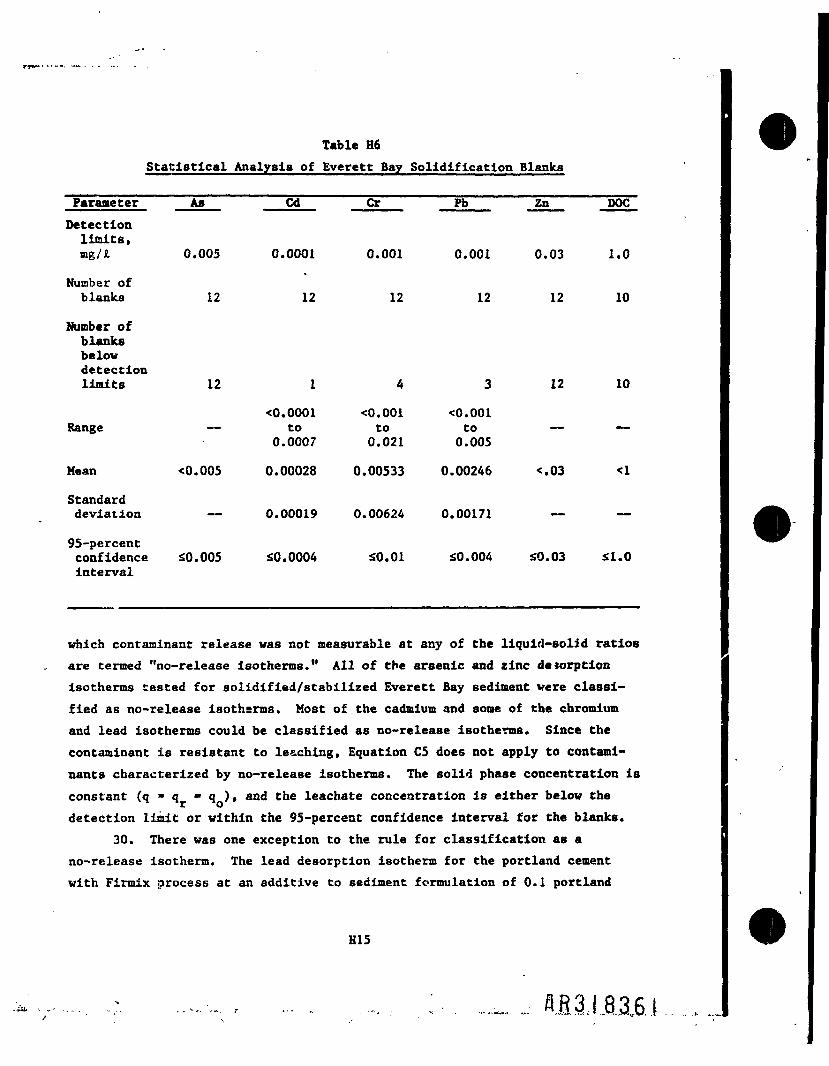
Table H6Statistical Analysis of Everett Bay Solidification Blanks
Parameter As Cd Cr Pb Zn DOCDetectionlimits,mgU 0.005 0.0001 0.001 0.001 0.03 1.0
Number ofblanks 12 12 12 12 12 10
Number ofblanksbelowdetectionlimits 12 1 4 3 12 10
<0.0001 <0.001 <0.001Range — to to to — ~
0.0007 0.021 0.005
Mean <0.005 0.00028 0.00533 0.00246 <.03 <1
Standarddeviation — 0.00019 0.00624 0.00171 — —
95-percentconfidence 20.005 SO.0004 £0.01 SO.004 £0.03 £1.0interval
which contaminant release was not measurable at any of the liquid-solid ratiosare termed "no-release isotherms." All of the arsenic and zinc deiorptionisotherms tested for solidified/stabilized Everett Bay sediment were classi-fied as no-release isotherms. Most of the cadmium and some of the chromiumand lead isotherms could be classified as no-release isotherms. Since thecontaminant is resistant to leaching, Equation C5 does not apply to contami-nants characterized by no-release isotherms. The solid phase concentration isconstant (q - q * q ), and the leachate concentration is either below thedetection limit or within the 95-percent confidence Interval for the blanks.
30. There was one exception to the rule for classification as ano-release isotherm. The lead desorption isotherm for the portland cementwith Firmix process at an additive to sediment formulation of 0.1 portland
H15
fl.83,11,3,6!

gu
i4.
a*• o.c
se1M„
oIa
•
41
!"S(A44
I1•H
SBUinOo
•ocN
]
J
U
u-He
*o
s
1 M 0 <0 mJn e r» M> en"^ 1 R 5 R•1 en en en en| CM CM CM CM
o«| s « a s
J* * * «0.3 - - -• „•M m m m m
1 o o o e_t| m m en mO <l O o O O
in o o o o
JSS = =^
u<{ i i s s31 o o o o
1 O> Oi 0i O>
1 O O 0 OU*U 0 0 O O
in o o o o
«"j • • » -' J J „• _•
1 0 0 0 0
J- - - -il <o « >c o
3j 7 7 7 7
1 m tn tn tn0^88888| 0 0 0 0
? Ji i i iJC I —— M -c IA
•e o0 • O Q O Otn ee 5 o 5 «M
<a
CM
m
m
oo
0%
So
01
oo-•*
CM
!o
o«M
in8o
8tn
oCM
enCM
CM
S
so
s
•foo
o0o
CM
•V
o
o«M
i0
«n8*n
s
<a o
II
S S
m tn
O o0 0
s; s
CO f-o o0 O
0> 0>
o o0 Oo o
CM CM
IIo o
S SCM CM
8 §o o
8 Su SO 0
0 0
m
OCM
•»
s
so
s
oo
o>
o0o
CM
,O
oCM
io
8o
0
e
CM
5
S
Soo
g
too
•»m
eoo
CM
m
O
SCM
§o
8g
tn
•*
CM
CM
«n
s
oo
,
CM
O
0oo
CM
O
sCM
io
,oM
m
O CO «O CO— i 00 O CO^ en ** mCM co en o*•*•*•*<*CM CM CM CM
o * m *o
tn m in m
00 — 0
0 O O O0000
o o* r- o*
CM 8 O O
o o o o
m in m m
o o o cr0 0 O 0o o o o
CM CM CM CM
r- CM o« 0>
i i § §o o o o
•*•*••*CM CM CM CM
m m tn m88880000
i ii 1 io o o o•M tn in tn
tn CM CM CM
jj44
c•aX
Jr-t
4*
"H
38"o
*
H16
SR3I8362

u>AJepu
a 2
J'1
CJ *""JnSI
8
S"ll"I
Ju •1s 11° 381
,
i
|1
8u«8Mr |
9 >H Ulo- o «b""
O f. »» «M CM en
SIssss1
ta tr m c* CM oen en en <n * *
o o o o o oo o o o o o
SO O « CM CMCM tn CA tM 0>
o o o o en o5 S 5 5 o 5o o o o o o
V
o o o e o oo o o n o oo o o o o o
iliiiiO O O O O O
- - - - - -777777
i 8 i i § 8o o o o e o
s i i i i i— — — CA in m
f 8 § S S S
<*
•»
oo
M>04
1oV
s
oo
,0
s
8o
io
0
«1
en•n
Soo
,§oV
Oo
o8o
$
8o
io
0
to
s
so
s
§oV
oo
,o
«
8o
CM
8o
o
en
o0o
to9>
ioV
oo
Ioo
0\
80
,oCM
in
m
^
omOo
£
8o
o0
Jo
oo>
8o
ioCM
in
S
^
Soo
s
8o
3eo
CM
8o
s
8O
«n8OCM
tn
0
CM
8o
S
8o
S
CM
Oo
N
8o
S
8O
CM
8S
CM
S
—
in
eo
S
5o
oo
CM
80
8
8o
,otn
CM
•*
„
m
ooo
S;
so
A
O
Oo
m
O
8
8o
,Oin
CM
H17

j
er-J ox
I0«jJ CM
*!
-1*-• "^4M
tj J OS| 0
J.•3•JOd g8jo
5 "I*8g J2
S| 0
«r S.s "1*S
V
5 ^ *c••
*«diS] 0*
•0 -0 O
tr o • o•4 en CK o
|o
CM
een0o
c*MT
oo
A
o0o
CMO
A
0
»n80
tn8
S
to0
CM
OenOO
OX
0u
e0o
s
10
tn8o
I
o3
r-.
o
goo
S
0oo
eoo
s
jo
in80
im
oCM
or*•o
o
goo
g
oo
ooo
o
,o
tn8o
en8m
0
s
0
g0o
£
inoo
o09
•0o
,0
m8o
m8tn
0(M
§
so
en
oCM
o
o0o
s
-*
o
tf\8o
m8o
0
OXR
goo
CMo
oo
eoo
s
,o
80
§o
0
stn
oo
o
so
o0o
s
«T
o
tn80
8o
o
to
CM
1o
CM
en00
o
Go
s
,o
CO
in80
m8oCM
m
s
1o
atA
oV
o
enoo
£
,o
to
m8o
i0
m
sr*.
CM
goo
s
tn8o
A
ooo
18
,o
CO
m80
CH
8oCM
m
eno
goo
men
OX
0o
s
en3o
s
«*
o
80
,om
CM
ms
goe
z
so
o
0
,o
CO
m80
8oom
CM
r»oCM
m
goo
en
to80
en
A
tooo
s
oen§o
CO
A
8o
,s
CM
H18

••i•*KE"u
B•*» w:l
O IM 0)
5 2 S5 s 1eA C
* 5e.C O«* •s ?t-4 •«
gsl4«Oklo»&
•Ml S f ^ f ^ O * v 4 * ^ f * ' ^ " * W > ^ - « * ^ ^
^ i^^--.-^^-.^^^.^^^.^4
fl «M ^4 M CM CM <M
rr-J « ^ r - . r x O O O O O O O O O O O O
i
U * J o O O O O O O O O O > 3 O Q O O
1 «5 V «? 9 ? 9 9 9 ? ? * 9 9
3H
V^J •» Cft 9 O O O O O O O O O O O O
j: j o o o o o o o o o - < o o o — —o* ] o o o o o o o o o o o o o o o
• *rS]^^<'J'<'J9^^<'?'<'J^^^^
u^|iliiilililililii
o-S °. *? °. •*.•*.•*."" "i "i *; " " *j "i
Iko'd 888888888888888"mmmirrx 1 ****-» t n t n m o o d o d d d o ' o| - « - M M C M c M r < 4 t n m i n
**Q T) O
c r o c i o o o c o o d o o i X i n m c M C M C M» 4 t A K O O O C M C M C M - « < M i M
5
i
j
H19
, AR3I8365 1
g
Oa-HCO
|»J
ChroBlta
I
Arsenic
•o3cr*4J
M-«iO-J -•1
H-Jh-I-t>-J oul?Jl§ffl *"
-IS"•d «Jl°
J 231 _er "."I
-1 =0<| 0Jjo
J S
"H?
""d iV'
«51 ONJfj °
»3l§4?* 1 ">•sjs* 1-33 -•H 4J «
53 gi»4
•0•c
j*
en
O
9
iCM
,
9
r*CM
»A
OO
?m
9
§°
00o>0
i9
8w«
oo
<oMT
2
0
9
«oCM
,
9
inCM
oxA
0s9
-*
9
§9
CO
0
9
CM
8*H
gf*
tnCM
g
o9
SenCM
,9
enooA
O0
9
•r
9
g9
in89
m8m
S
s
s
o9
iCM
SO
9
eno0A
Oo9
•*
9
9
«ng9
m
0CM
tno
om
O
9
*CM
MTOO
9
en00
Os
«o»4Oo
^
9
g9
m8?
008m
oCM
3
oto
0
9
CM«CM
,
9
enoo
in0o
9
§9
m89
CM
80
O
z
s
s9
CMMT«M
,
?
m01
CPt
mSo
9
§9
in89
CM
80
o
s
S
o?
CM•»CM
^
9
enson
enenO0
9
9
in89
en80
O•4
C*
•*
If*
0
?
MT«»CM
g
9
en
o
CMCM0o
9
i9
in89
*9OO
g
in
R
*N
Oi
s9
3CM
,
9
eno0
<eSo
9
i9
tn89
inoooCM
IA
<*CM
*
0-s
O
9
MTMTCM
,
9
eno0
S0
9
9
moo9
etoo0CM
ft
S
en
o
o9
in•«CM
SUO
m
o
oo
9
9
m89
0in
CM
OmCO
en
o
0
9
in*CM
ingo
in
o
OXen0o
«
9
g89
in89
8O
Om
tM
O<tf00
en
3en
S9
m<CM
ingo
OX
0A
e-»en00
<oCO
9
en89
^
in89
Oin
CM
•sCA
K
15rJB4t>
S,o
|I
•38
H20

8
h« *
S 22 5
aB _3•8
a
T?
O
e •s 5
i« « 9 < e > « ' O < O M > « > t O t O < O S > < O M > «
cj«J — — — « r M t . c r ™ r - p . o — 3 3 t» SMl v* — — CM CM CM
'5 r;r;'^p7"*"**i*-*1'I'n''1**''Jyi c M C M C M m m m i n i n i n i n m i n i n i n i n• l e n c n e n e n e n c n e n e n e n c n e n e n e n e n e n
O O O O O O O O O O O O O O O
•1 « ox ox — en ox — e n m r » M > i O M » M r M rJl O CM — lO — i n v O M > M > « M S M J » * M 5
Tud
S\ m m m c n c * c n < 4 r « « * * i n t n i n i n < n i AM| OjD Cfi (O O* 9 C O A Oi O O* O O> ON flK• I A A A A A A A A A A A A
^
^ ? » i • s ? °" °' I * CM •*a? u.I o o oI V V
tM — « — « VO M> M> « MS MJ
A A A A
S o o S o o o e s S o t S o o o e ao o o o o o o o o o o o o o o
V W V V
cr
_ . 322" — — — 2222 — 2 —e j - i ] b o o o S o o S o S o S o o oo o o e o o o o o o o -a o o ov v v v v v v v v v v v
PX ox ox ox e r ox
CO toO O O O O O OA A A A
b
o o o o o o o o o o o oV V V V V V
J l e o c o e n c M c M c M e n e n e n e n c n c n e n e n oor* j . . . . . . . . . . . . . . .gl o o o - - - - - . - . - - - - - -
]
•0 -O Ov4 V4 V43 rt Us&sJ
O O O O O O O O o mO O O « M e M C M ^ ^ » M
H21
31'83 6 7

C4O
°*i —»i i _ „o - > J 5 c 3 o o o o o c j o o o o - ^ ^ o9 9 * 00000000000
y dlne
m
_^ _ _ "sj| o o o > o x p p p o p p p p p o p o0
h
II- 6o 0
>.b*
i
entn — o e j o « e r e M m e o e M - e r * M « - « — —
— — c M o x o c o m o x o i c r n o xCT> 00 C-
U
5 - - - - - - - - - - - - - - o. J O O O O O O O O O O O O O O^ e n c n e n e n e n e n e n e n c n e n e n e n e n e nU - V . J O C 3 P O O O O O O O C 9 O O O
•J99'9"9'9'9"S9'9*9"9S99 9
o s 0 N O O » H » - « « " « o « - * » i « O O « - * » * c nc M C M C M c n c n e n e n c n e n e n c n e n c n e n c n• ^ • j f - f l * * * * " * * * " 1 * * * * * * * * 1 * " ' * * * * *
«. . _ , _ _ — m e j o o x o O M )o — — o e M C M C M i n i n m — I C M —
j:U - ^ | O O O O O O O O C O O O O O C 3
000000000099*9*
^n r ^ . r v r > « o o o ^ * ^ ^ ^ 4 » 4 ^ * * » 4 « ^ ' Hc** J e o t o t o o x o x o x o x o x o x o x o x o x o x o x o x*\ 9* 9* 9* 9* 9* 9* 9* 9' 9* 9* 9.' 9 9* 9' 9*
"9'9'9*9'99'9'99*9'9'9'
j; ooi°- °8J * f
A tn m m «n tn mod § 8 8 8 8 8
*\ <9 9* 9* 9 9* V
1
999
°"~_.'ft'/i'Tt'/t'ft'it'XTt'ft'X'ft'tt
i n i n m m m i n i n i n8 8 8 8 8 8 8 8 89* 9* 9* 9 9" 9" 9 9" 9*
•o8 8 8 § 8 § 8 8 § 8 8- 8*o
T) T3 O
o- o e*4 (/> flfi
o o o o o o o o p m m i n c M C M c MO C 3 O C M C M C M — — —
H22
flR3{8368

Proce«i
3<£
1
s &i :
B1O•M
!4*i
*-s44
|•tojsz
,l»t:Fl!
o—p
J
"f
j
'-iija
i30d
•1
JHiS ^5 J0 S*,
| cfj4
S5u1l•1riI11!j -on•
i
4B
^«lS1*
3—44o- o a•4 tn x
"1 *
R 3
tn m
g gO Oo o
CM »-4
A
8 8p PV
to to
MT MTP P0 0
O P
O 00 0
0 0" "
Im *n8 8o o
Ia §55
o oo o
1 "1CM 8
11o o
CM CM
A
8 5O PV
CD OX
en CMP PP P
P O
i ip P
eo r>
m ino po OO 0
i §
g g
•» to
2 2
11e e
CM (M
S 8p P
P 01A
P cnP P0 oV
P O
o o0 0
r» r~
in in8 8O O
§ §
o oCM -CM
CM •*
8 R
11P O
CM CM
tM —•O Oo o
o oA
0 —0 PO 0V
P O
p gp p
CM CM
m »no o0 0o o
o PP Po o
0 O— r*
i"» r»*
OO CMCM en
— CM
oo o
cn en
g g0 0p p
CM —
— enO —O O
o oA
0 00P 00 OV
0 P
1 1P 0
CM m
m mSo0
o o
§*" S0
o o— CM
o m
O O
m 03en en
CM CM
P O
en en
o oen eno oP P
- e^
•v in
0 0
o o
CM r-»0 0O 0
p o
1 i0 0
m m
iiO 0
r- toS 8O 0CM CM
in m
m tn00 00f f>
•» •*
o oCO COcn en
O Ocn eno o0 P
CM CM
P CM
P P
CO OX
o oA
r- OO 0o o
V
s 5o o
§ C M
80 0
tn in8 g0 0
§ 80 0o om in
CM CM
inox
•<r
oeocn
oenoo
CM
8p
CO
o
oo
CMm
O
ip«
mgo
os •om
CM
•S
*?8£?**>•JSU
54J
|•
Lidifled
s*MO••2«
H23
AR3I8369

p
a.
mS o
H
O
D
o
O
I — o x m « f > r - « c o r - — o o r - M ) M 7 v eJ n t n c M « t n < o i n t n « « i n e * o ? t o t o i o ** > J o o > o x t o t D c M — l O i o w c M o x r ^ o x t ner«fj— e M e - > e r . o s o — — — O O C M — •*•••»
— O O P o o f > C M C MC M C M C « > r * . S O C M C M C M
ic M < M e M O e n e n t n « * * 0. ^ . - . • M c n C M t M * * - * - * '
r ^ r * . r ^ ~ 4 ~ 4 * M - * . 4 r - 4 r s o « « O t 0 r * . r * . r *c M C M > c M m t n u t m m t n i n t n m i n i n i ne n c n c n e n e n c n e n c n m e n c n c n e n c n c n
....88888888888888O —J O O O P P P P O O O O O O O O
9* 9 9* 9* 9* V 9 9* 9* 9* 9* 9 9* 9* 9*•ij v ^ a > f n r - * t n o o * n * a o r - e n o x c oc M < 7 t o x « 4 r * 4 r » * i n o o i n i n i n * o i n ^ «
oi cn *4 CM ox o\ « «_ _ _ _ r^ fs. Q nfS O * ^ i * - 4 ^ - 4 > ^ e 6 < - ^ c M C M O r ^ o o^ o o o o o o o o o o o ^ o
o o o o o o o o o o o o o o o
c M S c M C M S $ ? $ i n t n i n t n i n t nr * p * . o \ o » o s o x o N c r » o ^ o x o \ o > o x o 1 ^
• ^ e n o c o r ^ o t ' ^ e n c n e n o c N O C M t nr 4 C M C M * n < * ^ ' ^ ' 4 * 4 < M « M M « < M « * ^ * ^ « MO O O O O O O O O O O O O O Oo d d o d d d o d d o d o d o
^ • N ^ ^ ^ ^ e p e o^ ^ - ^ C O O O O O O P Q . ^ . . - * - .OX OX <7^ Oh en OX O O O O O Or * . r * . r * . r t r - r - c d f D a o f o e d < Dr ^ f - . r - r - f - r - r ^ f ' . ^
9 9 9 9 9 9 9 9 9 9 9 9 9 9 9
19 9 9 9 9 9 9 9 9 9 9 9 9 9 9o t a o m a o c O Q D c n m c n t p % O ' o r * » f < « r * »o o f l o o o e M C M C M c n e n e n e n e n e n c n e n e n
9
1
m t n t n t n m i n m m m i n i n i n i n i n t ng g 8 g g g g g g g g g g 8 g9* 9* 9* 9' 9' 9* 9* 9' 9' 9* 9* 9* 9* 9* 9'
§ ^ i n e n * p ^ o o e M — t r * « 4 r < M Q O go o o o o o o o o o o o o o
. « t . - « _ 4 m m m o o o o o o o o o* ^ ^ 4 ^ ^ c M C M C M i n m i n
5- -3 .3""
§ 0 0 0 0 0 0 0 0O O C M C M C M - ^ — 1 — 4
H24
CM CM CM
•O
o

B» •?* "°
u1
s
B
M
c
S
. -°B°J!*cl
8
°" n o x o l o x o S o S S S o S S S S ot f l - 4 * - > - 4 C M e M < M f > 4 C M r M < M e M N f M C 4 C M
5 2 2 3 S — oxp
* 4 C M * - 4 i n i n i n i n i n t n i n i n « n i n i n > nts» CO t** **9 *Q *G t£ <•< «M •** O O Oox CM ox cn cn cn to *Q **o oo oo oo ON ON oxO O O en en en fn cn cn en en en cn en en
u * J o o o o o o S S S o S o o S S
U
A A A A A A A A A A A A A
o o o o o o o o o o o o o o9 9' 9' 9* o* 9* 9* 9 9* 9* 9* 9* 9* 9*
i5
J .o § S S 5 3Ml r* r-. r«. •* tn n*
5fl 2 S 2 S 2 2I A A A A
O M > P N N r « t n c o r . o O e - —U ^ P P P P P O P P O P P P P P O
9 9 * 9 * d ^ o o c > o o p p o o ps *•
u
Ml r* e-» e ox ox oxil •»•»•» f~ e~ i-r- l ox ox 01 o\ o> ox•I 9* 9' 9 9* 9* 9*
en enC D t O C O t O t O t Oo
CM
ep
e9 9 9 9 9 9 ° 9 9
89* 9' 9* 9 9 9 9* 9* 9 9* 9* 9' •> 9 9
B | A A A A A A A A A f \ A n A / V A "
G
jtfl
A A A A A A A A A A A A A A A
1t n t n t n m t n t n m m m i n i n t n i n t n i ng 8 8 8 8 g 8. 8 g g 8 8 8 8 8
' t J e J S S o S o o S o S o S o o olJ
lI
p P p pCM in m m
•o -o o"332- , o o o o o o o o o m v i t n c M C M C Mt C / 1 0 ^ O O O e M C M C M ^ ^ » 4 . M
H25
8*3
„ _ _ _ _ J 8 8 8 8 8 8 8 3 8 5" ' 9' 9* 9' 9* 9" 9 9' 9* 9* 9* 9* °' 9* °"
0
o
o o o o t o x r * * o x t n o c M » > 4 * ? a o * ^ c n* o m « n o x o x o x . H < » 4 e M c o o x o x c M c n c no x o x o x o x o x o o o o x o x o x o o o
O s o x o o - < o « * o x m r ^ » - * i n ^ f - i•«j*-. o H c n c M C M t n t n i n
o 9 o o r » * r * f i ^ ' f t > w , ) f c * > t i i - c i * _ e j O O Oo x o x c n e n m % o s o « c e o o c o o x o x o x
o
• * | < n e n c n e n c n e n e n e n e n e n e n e n e n e n c no o o o o o o o o o o o o o oi
S » - « o D - r ^ « « r - ' . r ^ « # o x o x o x ^ c MO X C O « O * * r O O < 6 Q . < 4 * O O X * i D * » « C M
o o„ J•M 44
08 8• a.•M Id
O C M O * 4 > c M t n c M C O ^ > c n r ^ c n i n « ^ c r t. e » t . » M ) . * . » 4 « » 4 . » 4 . - « * * i - « C M * - 4 C M C n m "u - ^ J o o o o o o o o o o o o o o
d o d d d d d d d d d d o d
° 9 9 9 9 9 9 9 9 9 9 9 9 9 9
^ *6 * *o in »**o O O * r « 4 r ^ « 6 t s 9 * . o m r -
cn * •«
-I S S S
* 9
S tSox ox ox ox ox ox C7* ox ox ox ox ox ox ox ox
9* 9* 9 9* 9* 9' 9* 9* 9* 9* 9* 9* 9 9* 9*
- i s s s s s s s s s s s s s sp p p p 8 8 8 8 8 8 8 8
9 9 9 9 9 9 9 9 9 9 9 9 9 9
i, - =
i n * * r C M C M C M C M C M C M r ^ r » r < ^ C M C M C MS o o o o i n i n i n r - r » » f ^ o x o x o xC S | t * 9 « O \ O « e D l e D * e O « e D t e O * e O % t O > e O « * D
:1
in tn j * t i n * n i n i n i n t n i n t n t n m i ng g g g g g g g g g g g g g9 9* 9 9' 9 9 9* 9' 9* 9* 9* 9* 9* 9*
• t T ^ e O ^ ^ f e O O x ^ o r ^ - r ^ t n i n ^ e D O Q O§ 0 0 0 0 0 0 0 0 0 0 0 0 0 0o o c o o o o o o o o o o o^ ^ ^ t n t n m o o o o o o o o o^ ^ • ^ • ^ c M C M C M i n m i n
T3 .g•H *ri <a «-4er o g o o o o c o o o
O O C M C M C M « < N * M o 4
H26
tn in CM CM CM
o
8
SR3I8372

£!
•g
8 g 8 g g g g g 8 g g g So P P P P o P P o p p p* o*
1
O
C
o o x c n m « « < 4 r e n < n o o t o c n r - i n e nCM — — 0«en — tn — t n t n m t o < « r c M c n— • V M T P o i Q — CM — t n c n c n m m i nO X O X O X O O I P O P P P P P P P P— — —— CM —— C M e M C M e M t M t M e M e M C M e M
•MSIHi• M e n o o s o e n o s O O N O — — o e n < oSI t M C M « M i e S » » l » O l t M » M — — - * c n « M T
— — — CM CM ,N « <* <*
CM — p o o o o o o t n m m x r * *cn en
888888888888888u - o o o o o o o o o o o o o o o-I1o o p p p p o p p p p p p p? ° 9
S P Q C M C M C M s O v O s O O O t O t O O X C D v Oo o e n c n c n e n c n c n c n c n e n c n e n e n* ? • »<*?«••«*?<*•»*•«*?*
1er~~l ...ejd o o o
00— 4J
o.• S O B to « i - i - _ , - 2 2 - 2 2 - 2 2 S 2- • U ^ J p p p p p O O O O P P P P P P
O O O O O P C B P P O
M| — — 2 — —>-J 00000SI P d d P pI V V V V
>r<saXOlO I O i a X O l O X O X O X O N O X O N O N O X O X O N O N
O O O O O00000
9 O P P P P O O O O O O O O Ov v v v v v v v v v v v
i-ii
o o o o o o i n i n i n r - r v r ^ O N O N c r .
m m m t n i n i n i n i n i n i n i n m i n i n mO ^ J g g g g g g g g g g g g g g g
? ?O p O O P P O O O O P O O O O
^ J g 8 8 8 8 g 8 £ 8 g g 8 S I 1— — — i n i n i . x p p p o d c * d d d
« "a og.-3
H27
!
11118373

12.4
12.2
12.0
11JB
11.6
f 11.4cf
11.2
- CHROMIUM
11X)
103 -
1O6 -
10.40.02
Figure H5. Chromium desorption isotherm, 0.1:0.2:1.0portland/Firmlx process
cement: 0.2 Firmix:! sediment was classified as a no-release isotherm. Leadwas detected in one sample out of 15 samples included in the aeries of leachtests for this process formulation (Table H16) . The concentration in this onesample was relatively low (0.008 mg/l) . This isotherm was therefore clas-sified as a no-release isotherm.
31. For some of the desorption data, the amount of contaminant releasedwas below the detection Unit for all but one or two of the liquid-solidsratios in the series. When the contaminant was detected, it was usuallydetected in the tests conducted at the lowest liquid-solids ratios used in theseries, i.e., 2:1 and 5:1. Desorption isotherms characterized by aqueousphase contaminant concentrations below the detection limit for liquid-solidsratios greater than 5:1 are termed "low-release isotherms." Several of thecadmium, chromium, and lead desorption isotherms were classified as low-release isotherms. These are listed in Table H19. Low-release isotherms donot provide enough points above the detection limit to determine if
H28

12.0
11.8
11J5
11.4
11.2
a10.8
10JB
10.4
102
10.0
LEAD
H •
i : i______I______i______I0 0.004 0.008 00)12 0.016 0.020 0.024 0.028
C.mQ/8
Figure H6. Lead desorption isotherm, 0.1:0.5:1.0lime /fly ash process
Equation C5 models contaminant release. Since low-release isotherms charac-terize contaminants that leach near the detection limit, low-release isothermsare indicative of solidified/stabilized sediment that does not have a signif-icant leaching potential.
32. The desorption isotherm plots for some of the leachate data wereclustered. Plots that produced clusters are termed "clustered isotherms."Clustered desorption isotherms indicate that there is not a well-definedrelationship between solid and aqueous phase concentrations, and Equation C5does not therefore model the data. Most of the serial, graded batch leachtests for chromium and lead produced clustered isotherms with horizontalorientations. Examples of clustered isotherms with horizontal orientationsare shown in Figures H5 and H6.
33. A clustered isotherm with a horizontal orientation indicates thatthe distribution coefficient, K. , is zero. Theoretically, when R. isequal to zero, the q versus C plot should be a horizontal line that
H29
AR3I8375

19.4 r
19.3 - ORGANIC CARBON *,
19 J
19.1
xa 19.0
18.7
18.640 80 120 160 200 240 280
C.mg/K
Figure H7. Organic carbon isotherm, 0.4:1.0 Firmix process
intercepts the ordinate at q . If K. is zero, all of the leachablecontaminant concentration in the solidified/stabilized sediment is released ineach leach test in the graded series. Thus, the solid phase concentration atthe end of each test approaches the concent r at iv.ii that is resistant toleaching, q . Since the solid phase concentration of leachable contaminantis constant and neither reversible exchange or sorption occurs, the aqueousphase concentration, C , depends only on the dilution provided by the variousliquid-solids ratios used in the series. The aqueous phase concentration,therefore, decreases by dilution with increasing liquid-solids ratio. Theisotherms shown in Figures H5 and H6 closely approximate the theoreticalresult for K. equal to zero. For horizontally oriented clustered isotherms,Equation C5 becomes
q - q r
H30
AR318376

23JB r
2X6
23.4
23.2
23.0
"o 223*•x^ 22.0fo* 22.4
22.2
22.0
21.8
21.4
ORGANIC CARBON
0 0.2 0.4 0.6 OS IJOTHOUSANDS. C. mg/2
Figure H8. Organic carbon isotherm, 0.1:1.0 portland cement process
and Equation H2 becomes
qr " qo ~ C(L/S)
?4. The desorption isotherms for organic carbon (OC) Indicated acurvilinear relationship between solid and aqueous phase OC concentrations.Some examples of these isotherms are shown in Figures H7 and H8. Curvilinearplots usually occur in adsorption studies involving organic chemicals. Threeadsorption isotherms are well known, the BET, Freundllch, and Langmuir iso-therms (Weber 1972).
35. The Langmuir equation was chosen for application to the OCdesorption Isotherm data. The Langmuir equation is given below.
(H4)(1 + bC)
H31
3.18377

Table H19Comparison of Process Isotherm Types*
Process As Cd Cr Pb Zn OC**Portland cement
0.05:1.0
0.10:1.0
0.20:1.0
Firmix
0.40:1.0
0.50:1.0
0.60:1.0
Lime:fly ash
0.1:0.3:1.0
0.1:0.4:1.0
0.1:0.5:1.0
Portland:Firmix
0.10:0.20:1.0
0.20:0.10:1.0
0.15:0.15:1.0
* KRI - no-release isotherm.LRI - low-release Isotherm.CI • clustered isotherm.CLI - curvilinear isotherm.
** OC - organic carbon.
H32
flR3!8378

whereq - solid phase contaminant concentration, mg/kgQ • mono layer sorptlon capacity of the solid phase, mg/kgb - Langmuir constant related to the energy of adsorption, 1/mgC - aqueous phase concentration, mg/t
Equation H4 models a contaminant that is totally leachable, i.e., q isequal to zero.
36. By fitting the data to the linearized form of the Langmuir equationgiven below, the Langmuir coefficients, Q and b , can be obtained.
«>37. The Langmuir coefficients determined by regression of Equation H5
onto the OC desorption data are presented in Table H20. The coefficients of2determination, r , values, and normalized sorption capacities, Q , are
also presented in Table H20. Normalized sorption capacities are discussedlater.
238. The r values indicate that the fit of the nonlinear desorption
model provided by the Langmuir equation was good for all of the OC data.However, since fitting Equation H5 to experimental data involves regressing C
2against itself, the r values have limited meaning. An inspection of theOC desorption isotherms showed the nonlinear ity of the process controllingOC: desorption to be unmistakable. Thus, a nonlinear model, such as theLangmuir equation, is appropriate.
39. Process effectiveness for contaminant immobilization. If a processprovides complete immobilization for each contaminant, all of the contaminantdesorption Isotherms will be no-release isotherms. None of the processesinvestigated completely immobilized all of the contaminants in Everett daysediment . On the basis of the number of no-release isotherms (Table H19) , theFirmix process had the best metals immobilization potential, with nineno-release isotherms. The portland cement and portland cement with Firmixprocesses each had eight no-release isotherms, and the lime with fly ash hadseven no-release Isotherms.
H33
AR.3I8379
Table H20Comparison of Langmuir Coefficients and Normalized Sorption Capacity
ProcessPortland cement0.05:1.00.10:1.00.20:1.0
Firmix0.40:1.00.50:1.00.6:1.0
Lime: fly ash0.1:0.3:1.00.1:0.4:1.00.1:0.5:1.0
Portland : Firmix0.10:0.20:1.00.20:0.10:1.00.15:0.15:1,0
r2
0.9990.9990.999
0.9990.9990.999
0.9990.9990.999
0.9990.9990.999
b
0.15510.11880.3756
1.47871.12001.3234
0.51530.32420.3743
0.69640.64040.4723
Q, mg/kg
25,016.422,853.722,149.2
19,393.917,822.316,901.5
18,974.017,759.616,488.3
20,655.520,293.620,615.6
Qn. mg/kg
67,599.361,965.258,107.1
51,876.448,292.946,078.9
50,753.252,529.344,952.4
69,063.767,853.768,930.3
40. As discussed previously, the loach data for metals producedno-relec.se, low-release, and horizontally oriented clustered isotherms. Sinceall of the arsenic and zinc leach data produced no-release isotherms, thefraction of arsenic and zinc that is resistant to leaching, q , is near orequal to the initia . metal concentration in the solidified/stabilized sedi-ment, q . Thus, solidified/stabilized Everett Bay sediment does not appearto have a significa- -. leaching potential fo~ arsenic and zinc.
41. For low-'elease and clustered isotherms, the contaminant concentra-tion resistant to Jcaching, q , was determined by averaging the solid phaseconcentrations corresponding to leachate concentrations above the detection
H34
flR3!8380

limit. The bar graphs in Figures H9 through H12 show the fraction of cadmium,chromium, and lead resistant to leaching, <"._/<!- • 1° the solidified/stabilized product*. Figure H9 shows that greater than 98 percent of themetals in the Firmix products was resistant to leaching. As indicated inFigure H10, greater than 95 percent of the metals in the portland cement prod-ucts was resistant to leaching. Figure Hll shown that great sr than 97 percentof the metals in the portland cement with Firmix products was resistant to1* aching. Figure H12 shows that the fraction leachable from the lime with flyash products was generally greater than 93 percent of q . Thus, dependingon the process formulation and the metal of interest, 93 percent or more ofthe contaminant was resistant to leaching.
42. Contaminant-specific methodologies for comparing process effective-ness are outlined below for metals and organic carbon. The methodology formetals is based on the normalized leachable metal concentration in thesolidified/stabilized sediment, and the methodology for organic carbon isbased on normalized Langmuir curves.
43. The leachable contaminant concentration in the solidified sediment,q. , is given byLi
« - « - « (H6)
whereq - leachabl - contaminant concentration in the solidified/stabilized
sediment, mg/kgq - initial contaminant concentration in the solidified/stabilized0 sediment before leaching, mg/kgq - contaminant concentration in the solidified/ stabilized sediment7 that is resistant to leaching, mg/kg
The leachable contaminant concentration, q. , in the solidified sediment isLIan important index of contaminant mobility since this quantity is the mass ofcontaminant available for release to the aqueous phase.
44. As previously discussed, no-release isotherms indicate that q isapproximately equal to q . The leachable concentration, q, , in this caseis ze-o. The fraction resistant to leaching, q /q , for desorption iso-therms classified as no-release and clustered isotherms was also discussedearlier. Leachable metal concentrations as defined by Equation H6 were cal-culated using the same data used to prepare Figures H9-H12.
H35
4R3I838I
1.0
0.9
0-8
0.7
0.6
0.60.4
OJ
0.2
0.1
C d C r P b C d C r P b C d C r P b
I I I0.4:1.0 0.5:1.0 04:1.0
FIRMIX FORMULATIONS
Figure H9. Fraction of contaminant resistant to leaching, Firmix process
Leachable metal concentrations of cadmium, lead, and chromium for each processare presented in Tables B21, H22, and H23, respectively. To compare processesvlth different additive dosages and to compare solidified/stabilized sedimentwith untreated sediment, the leachable contaminant concentration in thesolidified sediment was normalized with respect to the mass of wet sedimentthat was processed for solidification/stabilization. The leachable contami-nant concentration normalized with respect to the mass of sediment that wasprocessed is given by
qnL " qL(1 * R)<1 * w) (H7)
whereq^ - leachable contaminant with respect to the mass of the
sediment processed by solidification, mg/kg
qT - leachable contaminant concentration with respect to the massof solidified sediment, mg/kg
R - dosage of solidification/stabilization reagents,kg reagents/kg wet sediment processed
H36
RR3I8382

C d C r P b Cd Cr P b C d Cr Pb1.0 |-03
0.7
0.60.6
0.4
0.3
0.2
0.10
—————I ^ I i0.05:1.0 0.10:1.0 0.20:1.0
PORTLAND CEMENT FORMULATIONS
Figure H10. Fraction of contaminant resistant to leaching,Portland cement process
w - moisture content of the wet sediment, kg water/kg sedimentsolids
45. Tables H21, U22, and H23 also list for each process the normalizedleachable concentrations for cadmium, lead, and chromium, respectively. Theleachable metal concentrations in untreated anaerobic sedimeijt (Table Cll) arealso presented in each table for comparison.
46. As shown in Table H21, solidification/stabilization reduced themass of leachable cadmium in the sediment. The Firmix process was particu-larly effective in reducing the normalized leachable cadmium concentration.The order of decreasing effectiveness was Firmix > portland cement > portlandcement with Firmix > lime with fly ash.
47. Table H22 lists the leachable and normalized leachable concentra-tions -for lead. The Firmix and portland cement with Firmix processes reducedthe mass of leachable lead in the sediment. The portland cement and lime withfly ash processes showed increased q . The order of decreasing effective-ness was portland cement with Firmix > Firmix > lime with fly ash > portlandcement.
H37
-R3I8383

IX)
0.9
0.80.7
0.6
0.5
0.4
0.3
0.2
0.10
C d C r P b C d C r P b C d C r P b
0.2:0.1:1.0 0.1:0.2:1.0 0.15:0.15:1.0PORTLAND CEMENT/FIRMIX FORMULATIONS
Figure Hll. Fraction of contaminant release toleaching, portland cement/Firmix process
48. The data for chromium indicated that solidification/stabilizationincreased the leachable chromium in -he sediment. This is shown by the nor-malized leachable chromium concentrations presented in Table H23. The port-land cement process increased q . the least. It is possible that theincieases were due to contamination in the process setting agents. However,it is not likely that all of the setting agents would be contaminated. Inprevious work with the same processes and another sediment, the results forchromium were inconsistent, i.e., no process consistently showed increased orreduced q T for all additive dosages. Another explanation for increases innL*q is that solidification/stabilization increased the leachability of thechromium in the sediment. It is difficult, however, to reconcile such anexplanation with the published literature on solidification/stabilizationtechnology. Chromium mobilization by solidification/stabilization has notbeen previously reported. It is also possible that the increases are"apparent increases" that result when the leachable concentration, qT , isLInormalized. If the leachate concentrations are controlled or influenced by
H38
flR3i838U
1.003
°'80.7
0.6
O.S
0.40.3
0.20.1
C d C r P b C d C r P b C d C r P b
0.1:0.3:1.0 0.1:0.4:1X) 0.1:0.5:1.0LIME/FLY ASH FORMULATIONS
Figure HI2. Fraction of contaminant resistant toleaching, lime/fly ash process
random variability associated with testing near the detection limit, themultiplication factors for dilution by setting agents and moisture in thenormalizing equation could produce "apparent increases." The available datado not provide a basis for determining which of the three explanations pro-posed above, alone or in combination, accounts for the Increases in q T .nLfHowever, since the leachate concentrations were relatively low (0.01 to0.05 mg/ ), there does not appear to be a significant potential for release ofchromium from solidified/stabilized sediment.
49. As previously discussed, all the organic carbon desorption iso-therms for solidified/stabilized Everett Bay sediments were curvilinear. Thecurvilinear relationship between q and C was adequately modeled by theLangmuir equation. Since the organic carbon analysis consisted of determiningtotal organic. carbon in filtered leachate, the analysis in .-uisJ naturallyoccurring organic compounds-such as humic and fluvic acids that are normallyfound in high concentrations in sediments. Hence, the organic carbon desorp-tion isotherms may reflect primarily the desorption characteristics of thesesubstances.
H39
/IR3I8385

Table H21Summary of Leaching Indices for Solidified/Stabilized
Sediment, Cadmium Data
Process V "*/k* V Og/kg
H40
Untreated anaerobic sediment 0.11 0.11
Portland cement/sediment0.05:1.0 0.0018 0.00480.10:1.0 0.00925 0.0260.20:1.0 NRI NRI
Firmix/sediment0.4:1.0 NRI NRI0.5:1.0 NRI NRI0.6:1.0 0.014 0.0057
Lime/fly ash/sediment0.1:0.3:1.0 0.005 0.0180.1:0.4:1.0 0.036 0.140.1:0.5:1.0 NRI NRI
Portland cement/Firmix/sediment0.2:0.1:1.0 NRI NRI0.1:0.2:1.0 0.029 0.0970.15:0*15:1.0 0.011 0.037
BR318386

Table H22
Summary of Leaching Indices for Solidified/StabilizedSediment, Lead Data
Process V m g / k g q n L » ffig/kg
H41
Untreated anaerobic sediment 1.12 1.12
Portland cement/sediment0.05:1,0 0.76 2.040.10:1.0 0.32 2.570.20:1.0 0.61 1.89
Firmix/sediment0.4:1.0 0.025 0.090.5:1.0 0.023 0.090.6:1.0 0.275 0.88
Portland cement/firmix/sediment0.2:0.1:1.0 NRI NTJ0.1:0.2:1.0 NRI NRI0.15:0.15:1.0 0.03 0.1
Lime/fly ash/sediment0.1:0.3:1.0 0.24 0.860.1:0.4:1.0 0.32 1.230.1:0.5:1.0 0.32 1.32
Portland cement/Firmix./sediment0.2:0.1:1.0 NRI NRI0.1:0.2:1.0 NRI NRI0.15:0.15:1.0 0.03 0.1
J\ 8318387

Table H23Summary of Leaching Indices for Solidified/
Stabilized SeJiruent, Chromium Data
Process qL, mg/kg q^, mg/kg
H42
Untreated anaerobic sediment 0.4 0.4Portland cement/sediment0.05:1.0 NRI NRI
0.10:1.0 0.22 0.620.20:1.0 0.17 0.52
Firmix/sediment
0.4:1.0 NRI NRI0.5:1.0 0.26 10.6:1.0 0.28 1.2
Lime/fly ash/sediment0.1:0.3:1.0 0.72 2.40.1:0.4:1.0 0.54 2.10.1:0.5:1.0 0.69 2.8
Portland cement/Firmix/sediment0.2:0.1:1.0 0.33 1.10.1:0.2:1.0 0.23 0.770.15:0.15:1.0 0.19 0.63
QR3I8388

50. The sorption capacities of the solidified/stabilized sediment(Table H2D) were normalized with respect to the mass of the wet sedimentsolidified using the same approach previously described for normalized leach-able metal concentrations. The normalized sorption capacity, Q , representsthe maximum organic carbon concentration that the solid phase can sorb.Hence, the higher Q , the greater the capacity of the solids for organiccarbon.
51. All of the normalized sorption capacities for the solidified/stabilized sediment were slightly less than the organic carbon concentrationof the untreated anaerobic sediment (71,500 mg/kg). Normalized sorptioncapacities less than the original bulk sediment organic carbon concentrationswere expected since setting agents probably compete with sorbed contaminantsand organic matter for reactive sites on the sediment solids. Apparently, thesetting agents add little or no sorption capacity.
52. Process effectiveness can be compared using normalized sorptioncapacities. However, this approach can be misleading if Q is large and theLangmuir sorption constant, b , is low. The -oduct, Ob , represents theslope of the isotherm in the linear region at che lower end of the isotherm.The steeper the slope, the better the immobilization of organic carbon. Abetter approach to comparing the relative effectiveness of the processes is tographically compare normalized desorption isotherms. Figure H13 shows thenormalized organic carbon desorption isotherms for each process formulation.From this figure, it is evident that the portland cement with Firmix processprovided the best control for leaching of organic carbon.
Limitations of Laboratory Evaluations
53. Several important aspects of field application were not addressed inthis laboratory study. Topics beyond the scope of this investigation includescale-up factors, long-term stability of the solidified/stabilized sediment,and engineering economy. In the field, strengths may be lower than thoseobtained in the laboratory due to lower mixing efficiency and/or dosage con-trol. The implementation strategy will affect mixing efficiency and dosagecontrol. For this reason, these factors ata best evaluated in a field demon-stration. Temperature is another processing variable that was not investi-gated that can be important in the field.
H43
§R.3j8389

80,000 I-
70.000 -
30>00° • 1. 0.1:0.2:1.0 Portland:Firmix:Sodim«m2. 0.16:0.15:1.0 Portl*nd:Firinix:S«dinwflt3. 0.2:0.10:1.0 Portl*nd:Firmix:Sedirrwm4. 0.05:1.0 Portland Cemtmt:Sedim«nt5. 0.10:1 JO Portland Cwntmt:S«dinMnt6.0.20:1.0 Portland Cemtnt:Stdinwnt7. 0.1:0.4:1.0 Lime :Flyt»h: Sediment8. 0.40:1.0 Firmix:Sediment9. 0.1:0.3:1.0 Lim»:Fiv«h:Sediment10. 0.60:1.0 Firmix:Se»diment11. 0.60:1.0 Firmix:SBdiment12. 0.1:0.6:llJO Lim.:Fly«»h:Sodiment
II_____I_____I_____I_____I
20,000
10.000
0 200 400 600 800 1000 1200 1400 1600C.rng/8
Figure HI3. Normalized organic carbon isotherms
54. Caution must also be exercised in extrapolating the desorption datato the field. The surface area for leaching in the field cay be differentfrom that in the serial, graded batch leach tests. Since the solidified/stabilized sediment samples were ground, the surface area to mass ratio in thelaboratory tests is probably higher than that in the field. However, thelaboratory leach data are not necessarily conservative since the impact ofgrinding on contaminant mobility is poorly understood.
55. Chemical leach data from serial, graded batch leach tests and themethods of data analysis presented in this report were designed to provide abasis for evaluating the source term in permeant-porous media equations.
H44
flR3i8390

Permeant-poroua media equations are mass transport equations that describe thegeneration of leachate as water percolates through a porous medium, such assolidified/stabilized sediment. Mass transport models with other assumptionsand equations, such as the solid-phase diffusion approach (Cote and Isabel1984), might also be applied to solidified/stabilized sediment and give rea-sonable resulce. The permeant-porous media model is probably a worst-casemodel, and the solid-phase diffusion model is probably a best-case model(Myers and Hill 1986). The lack of detailed field records, howe\sr, makes adefinitive statement concerning the relative merits of the two approachesimpossible.
Potential Implementation Scenarios
56. Solidification/stabilization technology can potentially be imple-mented in a variety of ways, depending on the design of the disposal facilityand th-a manner in which the setting agents are added to and mixed with thedredged material (Francingues 1984). Two design concepts for disposal of thecontaminated dredged material in an upland site are illustrated in Figures H14and H15. Other designs and mixing concepts or modifications of those pre-sented below may also be feasible.Disposal site design
57. The layered concept shown in Figure H14 involves alternating layersof clean dredged material and contaminated dredged material that has beensolidified/stabilized. The initial lift of clean dredged material would betiewatered to promote densification and consolidation to provide a low-permeability foundation. Once this layer has achieved the desired degree ofconsolidation, the solidified/stabilized dredged material would be placed ontop. Conventional earthmoving equipment would be used for shaping as nec-essary before the .solidified/stabilized material hardened.
5P. One alternative to the layered design for a confined disposalfacility Is the liner concept. The liner concept Incorporates solidification/stabilization as a treatment to produce a low-permeability foundation. Alayer of solidified/stabilized dredged material is initially placed in thesite; then, contaminated dredged material is disposed and dewatered. A cleanlayer of dredged material is used as final cover.
H45
AR3I.839I

CONCEPTUAL SKETCH FOR STRATIFIED DISPOSAL
:FINAL COVER LAYER'
LAYER OF CONTAMINATED MATERIAL OsS^ ^
*: CLEAN LAYER oTFiNF'BRAIN MATERIAL ?&
. LAYER OF CONTAMINATED MATERIAL XssI* CLEAN LAYER OF FINE GRAIN MATERIAL
Figure HI4. Disposal concept for alternating layers ofsolidified/stabilized dredged material
59. The secure disposal concept shown in Figure H15 provides thehighest degree of environmental protection. A soil or flexible membraneliner (or both) is used to line the bottom and sides of the disposal site. Acoarse-grain layer is used for leachate collection. Contaminated dredgedmaterial that has been solidified/stabilized is then placed into the preparedsite so that a monolithic block develops rs the material cures.
60. As an alternative to the secure facility, the liner and coarse-grain layer could be deleted from the disposal site design if the permeabilityand leachability of the solidified/stabilized dredged material are suffi-ciently low. Laboratory permeabilities in the range of 10 to 10 cm/sechave been achieved with solidification/stabilization of industrial waste(Bartos and Palermo 1977). Soils with laboratory permeabilities of10~ cm/sec or less are considered for liner construction.Addition and mixing methods
61. Three basic methods of agent addition and mixing are consideredfeasible CFrancingues 1984). These are in situ mixing, plant mixing, and area
mixing.62. In situ mixing is suitable for dredged material that has been ini-
tially deiatered. In situ mixing is most applicable for the addition of largevolumes of low-reactivity setting agents. This method employs conventional
H46
8R3I8392

DISPOSAL CONCEPT FOR STABILIZATION IN SECURE FACILITY
Figure H15. Disposal concept for solidification/stabilization in a secure facility
construction machinery, such as a backhoe, to accomplish the mixing process.Where large containment areas are being treated, a clamshell dredge and/ordraglines may be used. An alternative to conventional construction equipmentinvolves agent addition and mixing by injection. Specially designed equipmentthat is commercially available can be used to inject and mix setting agentswith The materials to be solidified/stabilized. The system moves laterallyalong the perimeter of a facility, solidifying the material within the reachof the injection boom. As soon as one pass is completed and the material hasset long enough to support the injection carrier, the process is repeated.The equipment advances in this manner until the job is complete.
63. Plant mixing is most suitable for application at sites with rela-tively large quantities of contaminated material to be treated. In the plantmixing process, the dredged material is mechanically mixed with the settingagent(s) in a processing facility prior to disposal. If the volume of mate-rial to be processed does not justify the expense of a mixing plant, onealternative is to mix the setting agent (s) with the dredged material in a scowbefore it is unloaded. Mixing may be accomplished in route to a docking site,as shown in Figure H16, using a specially designed system mounted on the scowfor this purpose, or by using a shore-based irjection system, as shown in Fig-ure HI7. In the latter, track-mounted injection equipment would move along
H47
sit*., .'-.,**»*JJL3.L833JL

Figure HI6. Conceptual sketch of scow fitted wit.i mechanism formixing setting agents with dredged material
Figure HI 7. Conceptual sketch of shore-based mixing alternative
H48
the dock and reach all parto of the scow. Solidifying agent in a dry state ispiped directly from a tank truck to the injector. Since the setting processtakes several days before freshly prepared, solidified/stabilized dredgedmaterial IB hardened and cannot be rehandled, the risk of having the materialset up before it can be removed from the scow is minimal.
64. Areawide mixing is applicable to those confined disposal siteswhere high-solids content slurries must be created. Areawide mixing involvesthe use of agricultural-type spreaders and tillers to add and mix settingagent(s) with dredged material. Areawide mixing is land intensive andpresents the greatest possibility for fugitive dust, organic vapor, and odorgeneration. Implementation of the areawide mixing concept will require thatthe dredged material be sufficiently dewatered to support constructionequipment.
Cost
65. Actual project cost data are not available for solidification/stabilization of dredged material. Application of the technology to hazardouswaste is estimated to cost $30 to $50 per ton (Cullinane 1985). The actualcost will vary with the amount of setting agent(s) required. The amount ofsetting agent(s) required depends on the implementation strategy and the per-formance criteria that are specified. Cost estimates must also take intoconsideration the volume increase due to the addition of setting agents(s) andfuture expenditures needed for end uses anticipated at the site. The cost-effectiveness of solidification/stabilization technology as an alternative toliners and leachate collection, treatment systems, or other ground-water pol-lution control strategies for upland disposal sites depends on the site-specific environmental constraints that are placed on disposal.
Conclusions
66. The range, in 28-day UCS was 35 to 605 psi, depending on theagent(s) used for solidification and the dosage applied. The maximum strengthrecorded was 1,176 psi at 90 days. This range in product strength _sindicative of the versatility of solidification as a physical stabilizationprocess for Everett Bay sediment. The technology has the flexibility to meet
H49
SR3I8395
specifications for physical stability ranging from primarily immobilizing sed-iment solids in a low-strength product to producing a material suitable forend uses typical of soft concrete.
67. Solidification/stabilization reduced the leachability of selectedmetals. Arsenic and zinc were completely immobilized by the processesincluded in this study. Depending on the process and process formulation,93 percent or greater of the cadmium, chromium, and lead in the solidified/stabilized sediment was resistant to leaching. Analysis of the leachate dataindicates that solidified/stabilized Everett Bay sediment does not have a sig-nificant leaching potential for metals.
68. Solidification/stabilization did not significantly alter the sorp-tion capacity of the sediment for organic carbon. Data were not available toevaluate the potential of solidification/stabilization technology to reducethe leachability of specific organic compounds.
69. Solidification/stabilization technology can be implemented in avariety of ways. The implementation strategy and the performance criteriaselected impact cost. The cost-effectiveness of solidification/stabilizationtechnology as an alternative to other leachate control strategies depends onthe site-specific constraints for upland disposal.
References
Bartos, M. J., and Palermo, M. R. 1977. "Physical and Engineering Propertiesof Hazardous Industrial Waste and Sludges," EPA-600/2-77-139, US EnvironmentalProtection Agency, Cincinnati, Ohio.
Cote, P. L., and Isabel, D. 1984. "Application of a Dynamic Leaching Test toSolidified Hazardous Wastes," Hazardous and Industrial Waste Management andTesting, Third Symposium, STP 851, American Society for Testing and Materials,Philadelphia, Pa.
Cullinane, M. J. 1985. "Field-Scale Solidification/Stabilization of Hazard-ous Wastes," paper presented at the National Conference on EnvironmentalEngineering, American Society of Civil Engineers, 1-3 July 1985, Boston, Mass.
Di Toro, D. M., and Horzeopa, I'-. M. 1982. "Reversible and Resistant Compo-nents of PCB Adsorption-Desorption: Isotherms," Environmental Science andTechnology, Vol 16, No. 9, pp 594-602.
Di Toro, D. M., Mahony, J. D., Kirchgraber, P. R., O'Byrne, A. L., Pasquale,L. R., and Piccirilli, D. C. 1986. "Effects of Nonreversibility, ParticleConcentration, and Ionic Strength on Heavy-Metal Sorption," EnvironmentalScience and Technology, Vol 20, No. 1, pp 55-61.
H50
AR3I8396

Francingues, Jr., N. R. 1984. "Identification of Promising Concepts forTreatment of Contaminated Sediments," Proceedings of the ?.0th US/Japan ExpertsMeeting on Management of Bottom Sediments Containing Toxic Substances,US Army Engineer Water Resources Support Center, Fort Belvoir, Va.Houle, H. J., and Long, D. E. 1980. "Interpreting Results from Serial BatchExtraction Tests of Wastes and Soils," Proceedings of the Sixth AnnualResearch Symposium on Hazardous Wastes, EPA-600/9-80-010, US EnvironmentalProtection Agency, Cincinnati, Ohio.Jaffe, P. R., and Ferrara, R. A. 1983. "Desorption Kinetics in Modeling ofToxic Chemicals," Journal of Environmental Engineering. Vol 109, pp 859-867.Jones, J. N., Bricka, R. M., Myers, T. E., and Thompson, D. W. 1985."Factors Affecting Stabilization/Solidification of Hazardous Waste,"Proceedings of the Eleventh Annual Research Symposium on Land Disposal ofHazardous Waste, EPA-600/9-35-013, US Environmental Protection Agency,Cincinnati, Ohio.Kita, D., and Kubo, H. 1983. "Several Solidified Sediment Examples," Pro-ceedings of the Seventh Annual US/Japan Experts Meeting on Management ofBottom Sediments Containing Toxic Substances, US Army Engineer Water ResourcesSupport Center, Fort Belvoir, Va.Malone, P. G., Jones, L. W., and Larson, R. J. 1980. "Guide to the Disposalof Chemically Stabilized and Solidified Waste," SW-872, US EnvironmentalProtection Agency, Cincinnati, Ohio.Myers, T. E. 1985. "Sorbent Assisted Solidification of a Hazardous Waste,"Proceedings; International Conference on New Frontiers for Hazardous WasteManagement, EPA-600/9-85-025, US Environmental Protection Agency, Cincinnati,Ohio.Myers, T. E., and Hill, D. 0. 1986. "Extrapolation of Leach Test Data to theField Situation," Journal of the Mississippi Academy of Science, Vol 31,pp 27-45.Nakamura, M. 1983. "Experiences with the Stabilization of Sediments," Pro-ceedings of the Seventh Annual US/Japan Experts Meeting on Management ofBottom Sediments Containing Toxic Substances, US Army Engineer Water ResourcesSupport Center, Fort Belvoir, Va.Otsuki, T., and Shima, M. 1984. "Soil Improvement by Deep Cement ContinuousMixing Method and Its Effect on the Environment," Proceedings of the EighthAnnual US/Japan Experts Meeting on Management of Bottom Sediments ContainingToxic Substances, US Army Engineer Water Resources Support Center, FortBelvoiz, Va.Pojasek, R. B. 1979. Toxic and Hazardous Waste Disposal, Vol 1, Ann ArborScience, Ann Arbor, Mien.Tittlebaum, M. E., Seals, R. K., Cartledge, F. K., and Engels, S. 1985."State of the Art on Stabilization of Hazardous Organic Liquid Wastes andSludges," CRC Critical Reviews in Environmental Control, Vol 15, Issue 2,pp 179-211.Voice, T. C., Rice, C. P., and Weber, W. J. 1983. "Effect of Solids Concjn-tratlon on the Sorptive Partitioning of Hydrophobic Pollutants in Aquatic Sys-tems," Environmental Science and Technology, Vol 17, No. 9, pp 513-518.
H51
AR3JR

Weber, Walter, J., Jr. 1972. Physicochemical Processes for Water QualityControl, Wiley-Interscience, New York.
H52
AR3I8398

APPENDIX I: MONITORING PLANS
1. This appendix contains draft monitoring plans for dredging and dis-posal operations for the Everett Homeport project. Separate plans areincluded for dredging operations, contained aquatic disposal (CAD) placement,contained aquatic disposal mound and cap behavior, and intertidal disposal.The level of detail in the plans is intended to provide general guidance onmonitoring and the level of effort involved in the monitoring. Since some ofthe alternatives for dredging and disposal are still under development, theseplans cannot be considered final and must be refined once final scheduling anddesign for the project have been completed. A panel to include experts famil-iar with local conditions should be formed to assist in refining the plans.These monitoring plans have been revised from those presented in the DisposalAlternatives report to reflect more recent information on the proposedalternatives.
2. The objectives of the monitoring plans given here are the following:a. To determine the degree of sediment resuspension at the point of
dredging during representative dredging operations.b_. To verify modeling predictions of dredged material behavior to
include mass release during open-water disposal for the CADalternative.
c. To determine the area of deposition of dredged material on thebottom following each phase of disposal for CAD.
d. To determine the cap thickness immediately following disposaland after initial consolidation for CAD.
e_. To determine the effectiveness of the cap in chemically isolat-ing the contaminated sediments for CAD.
_f. To determine contaminant releases from effluent, surface runoff,and leachate for confined upland or intertidal alternatives.
Since CAD is identified as the preferred alternative and designs for CAD havebeen proposed, the monitoring plans are more detailed for CAD.
Biological Monitoring
3. The monitoring plans described here are restricted to physical andchemical parameters. It is recognized that biological monitoring should beconsidered as a part of the overall monitoring effort. Biological monitoringshould reflect the concerns of resource agencies and should be developed in
II

cooperation with biologists familiar with local species and conditions. Plansfor biological monitoring can be finalized once a disposal alternative andfinal site design have been selected.
Monitoring Plan for Dredging Operations
Purpose and scope
4. The purpose of this monitoring plan is to define the sediment resus-pension and contaminant release of a dredge plant operating in contaminatedsediments. The plan is oriented toward clamshell dredging, which is the pre-ferred method for the CAD alternative. The monitoring effort will identifythe resuspension of sediments generated by the dredging operation and any pos-sible release of contaminants from the sediment to the water column. A samplegrid rear the dredging operation will be defined where samples and measure-ments of the resuspendec sediment plume will be collected. I'i'-c ete water
samples, current measurements, and other parameters will be obtained at thesample grid points. The intent of this plan Is to intensely monitor represen-tative dredging operations over a 2-day period. The procedures described inthis section are not intended for routine use throughout the entire dredgingproject.Sampling procedure
5. Sampling locations. There will be 1 day of background sampling fol-lowed by 2 days of sampling during the dredging operation. The sample gridwill be completed three times during each sampling day. Each sample set willbe sampled in the same order as the previous set, such that the first stationsampled on the first set will be the first station sampled on the second set.Background sampling will be done prior to the start of dredging and willinclude water samples for total suspended solids (TSS) determination and cur-
rent measurements to describe the hydraulic regime of the area to be dredged.6. The sample grid will consist of 10 sampling stations arranged in two
perpendicular transects. The first transect will be parallel to the dir'7tionof flow in the area to be dredged with seven sampling stations located at geo-metrically increasing distances from the point of dredging. Stations will belocated 100, 200, 400, 800 and 1,600 ft downcurrent from the point of dredg-ing. One station 100 ft upcurrent from the point of dredging and a station onthe dredge nearest the point of dredging will complete the first transect.
12

The second tr&nsect will be perpendicular to the first and located 200 ftdowncurrent from the point of dredging. It will consist of three stations. Asketch showing the grid is presented as Figure II.
7. Watei.- column samples for suspended solids. At each samplingstation, discrete water samples will be collected at the near-bottom (1 to5 ft above bottom), middepth, and near-surface (1 to 5 ft below the surface).These water samples will be analyzed for TSS only, and should be of sufficientvolume (approximately 200 ml) to perform the analysis.
8. Current measurements. After background data have established thegeneral flow pattern, current measurements will be collected throughout thesample collection effort at the 100-ft upcurrent station, the 400- and1,600-ft dovmcurrent stations, and the three stations that comprise the secondtransect. The current measurements will be obtained at similar depths(surface, middepth and near bottom) as the water column samples.
9. Water column samples for chemical analysis. On the first day ofsampling, during the dredging operation, water samples will be collected forwater quality analyses. The samples will be collected at four of the stationsalong the first transect: 100 ft upcurrent of the point of dredging, at thestation nearest the downcurrent side of the point of dredging (either on thebarge or 100 ft downstream), and at the 200- and 400-ft downcurrent stations.This cample set will be collected once at each station ey-apt for the firststatic downstream from the dredge, which will be sampled three times duringthe day. The water quality samples will be collected at the near-surface,middepth, and bottom at each station. Three replicates from each samplingdepth will be obtained by sequential sampling at each depth. Each sample rep-licate will be of sufficient volume for the chemical analyses to be performed.
10. Labeling and field log. For the plume sampling, there are 10 sam-pling stations. A sample number consisting of four gomponents will beassigned to each sample. The four components are: date, station, depth, andtime. The date will be represented by a two-digit number depicting the day ofthe month. The station portion of the sample number will be assigned sequen-tially, such that the 100-ft upcurrent station will be 01; the station on thedredge, 02; the station 100-ft downstream, 03; and the rest as shown in Fig-ure II. The depths will be similarly numbered, 1 for surface, 2 for middepth,and 3 for bottom. The sampling time will be incorporated such that, for asample collected on the first day of the month and at 0800 hr at the 200-ft
13
AR3l8kOI

UJ* rO rO\ut \ \
I ;1T
SOB £ HtaB«J
8 S SO 00
1C:tyQj
Q
1ce50
8O
«,
o
KUlm3Z
§t-
w
o
«cc§ -u
oQ
-
-
-
S
8
8
g
§
r-u.
1gUlcOILOas8 o
CO CLSos.u.Ul
zIB
5
i
u0exOI
S4J4J
Jj>b)
IT|usV0.oS3*f*460•o01
•oMHO
1Hu04J
ieO
•o•JJ600)(XW<0to
M
01s60•H
14

downstream station, the sample number would be 01-04-02-0800 if it wereobtained at middepth.
11. A field log will be kept to outline sampling procedures and iden-tify each sample. The field log will be arranged into sampling days. Eachsampling day will begin by recording the names of the persons collecting thesaiplec, a description of the weather condition (approximate wind speeds anddirection, etc.), and a description and/or sketch of the dredging operationfor that day. Each time the dredge makes a significant movement, such aschanges in position in the channel, it will be recorded in the field log.Each sample will be identified by sample number, depth, time, and distancefrom the point of dredging. Other events recorded each day will include:cycle time of the dredge bucket, current measurements, any interruptions ofthe dredging operation, water temperature, any ship movement in the vicinityof the field study, and any other event the data recorder feels to bepertinent to the field study. Similar procedures for labeling and fieldlogging should be used in other portions of the monitoring.Laboratory testing
12. Total suspended solids. All the discrete water column samples willbe analyzed for TTS in accordance with the AWWA-WPCF-PHS Standard Methods(total of 250 samples).
13. Chemical analysis of water column samples. All water quality sam-ples collected at the station immediately downstream from the dredging opera-tion (total of 27) will be analyzed for TSS, dissolved chemical concentrations(filtered or centrifuged subsamples), and total chemical concentrations. Adissolved sample will be defined as that passing 0.45-jj filters. This willyield a total of 54 water samples for chemical analysis. Both the total anddissolved subsamples will be analyzed for metals, nutrients, PCBs, and PAHs.A list of specific parameters for analysis will be provided by the SeattleDistrict. The remaining water quality samples (27) will be split; subsampleswill be filtered or centrifuged, preserved, and retained for possible laterchemical analysis.
Report14. The contractor will summarize the data collected in a report to
include tables of all test resultc, descriptions of the test procedures used,copies of sample logs and field notes, and any other information pertinent tothe sampling and testing.
15

Monitoring Plan for Dredged Material Placementfor the CAD Alternative
Purpose and scope15. The purpose of this monitoring program is to determine actual dis-
position of dredged material during disposal for the CAD alternative and toverify mathematical models used to predict such behavior. Verification ofmodeling assumptions regarding the behavior of material during descent to thebottom, surge along the bottom, and initial transport through diffusion willbe accomplished by intensely monitoring several barge dumps using arrays ofinstrumentation in the water column and on the bottom. The area of depositionfollowing each phase of disposal will be determined by comparisons of bathy-metric surveys taken before and after each phase of disposal, supplemented bydata from instrumentation on the bottom. The monitoring program outlinedcould be applied with modifications to most coastal dredged material disposalsites possessing similar water depths and maximum currents.
16. The data to be collected are needed to characterize the disposalsite and the properties of the material in the disposal vessel, as well as todescribe the descent of the material as it falls through the water column,spreads over the bottom as a density current, and finally is transported bythe ambient current while undergoing turbulent diffusion. The instrumentationrequired to accomplish the monitoring program, as well as the placement ofInstruments around the disposal point, is described below. It is assumed thatdisposal will be from bottom-dump scows. If a different dredging method isselected, appropriate modifications to this plan must be made.Field data collec"ion program
17. To provide insight into the fate of dredged material disposed atthe designated disposal site as well as to furnish data for verifying math-ematical models, field data must be collected throughout the placement pro-cesses that occur during several disposal operations* and for a short periodof time after each operation. A major problem that must be overcome stemsfrom the fact that dredged material placement occurs through a series of rapid
* For purposes of this mouitoring program, a "disposal operation" is definedas the filling, transport, and subsequent release of a single load ofdredged material.
16

three-dimensional processes that may be quite difficult to observe. Therequirement for rapid and continuous observations of dredged material place-ment can best be met by optical transmittance and acoustic and water flowmeasurements.* Both continuous observations at one location and observationprofiles through the water column must be made. Comparison with suspendedsolids concentration measured in simultaneously taken water samples willensure reliability of transmissometer calibration. A survey echo sounder canbe used to track dredged material through the water. If the boundary betweenthe ambient water and water containing dredged material is a sharp one, therounder permits flow velocities and layer thicknesses to be measured. Flowvelocities of dredged material can also be mea&ured directly with standardcurront meters. These methods of measurement will be used simultaneouslyduring each disposal operation monitored.Instrument requirements
18. Transmissometers. The requirements of the transmissometer designare mechanical rigidity and sufficient strength to withstand forces encoun-tered during the release of dredged material. It is also necessary that theinstruments operate at much higher sediment concentrations than are usual foroptical methods. A total of six transmissometers must be used simultaneouslyduring the monitoring program.
19. Acoustic transducers. Acoustic pulses of 200-kHz frequency returngood echoes from small concentrations of fine-grain sediments. Based uponwork by Proni et al.,** standard echo sounder equipment should suffice todetect the presence of dredged material. For example, Raytheon survey fathom-eters operating at 200 kHz with an 8-deg cone angle might be used. A total ofnine transducers must be used simultaneously during the monitoring program.
20. Current meters. Fluid flow measurements are needed to determinethe background current at the disposal sites and to record the velocity of thebottom surge and the speed of descent of the dredged material. Measurementsof speed and direction of the background current can be made with an Endeco
* 11. J. Bokuniewicz et al. 1978. "Field Study of the Mechanics of thePlacement of Dredged Material at Open-Water Disposal Sites," TechnicalReport D-78-7, US Army Engineer Waterways Experiment Station, Vicksbur;Miss.
** J. K. Proni et al. 1976. "Acoustic Tracking of Ocean-Dumped SewageSludge," Science. Vol 193, pp 1005-1007.
17
.1R3JJA05 „

current meter, or equivalent, mounted on taut moorings at the desired dis-tances above the bottom. Several types of flowmeters could be used to measurethe speed of flow in the bottom surge, e.g., a standard Price meter of thetype designed to measure flow in rivers. At least one current meter and sevenflowmeters must be used simultaneously during the monitoring program.
21. Survey equipment. The monitoring program Includes detailed bathy-metric surveys. A Ratheon survey echo sounder, or equivalent, could be used.
22. Water pumps. Submersible electric pumps with a capacity of atleast 0.01 m /min must be used to collect water samples during each disposaloperation. At least six pumps must be used simultaneously during themonitoring program.
23. Range and bearings. The positions of observing points around thescow should be determined by electronic positioning equipment similar toLoran C positioning system or better. This equipment should be calibratedusing fixed range markers and coordinates from navigational charts. Rangescan be taken with an optical range finder, and bearing compasses can be usedss a field check on the electronic positioning.
24. Deposition samplers. Alternatives are available to measure theextent of depositions occurring from disposal activities. For example, onetype sampler may consist of sediment collection vessels mounted at multiplelevels on a tripod that will rest on the bottom. The lower vessels willreflect accumulation of material reaching the samplers due to the bottomsurge. The uppermost vessel will reflect only the deposition of material dueto transport-diffusion. A diagram of the sampler is shown in Figure 12.(This sampler is identical to that used by Mr. Glenn Earhardt, Baltimore Dis-trict, in similar studies.) As a supplement or alternate, a sediment pro-filing camera such as REMOTES (Remote Ecological Monitoring of the Seafloor),or comparable, can be used to measure the thickness of the deposited sedi-ments. Use of deposition samples is critical in measuring the extent of thin-ner layers of deposited material that would not be observable by surveys.
25. Sediment sampler. The properties of the dredged material in thebarge are required for each disposal operation monitored. To determine prop-erties of the material at various vertical locations in the barge, a syringemounted on a long pole with the piston pointing up can he used. With thisconfiguration, no material wiJ.1 enter until the syringe is at the desired
18
HR3I8
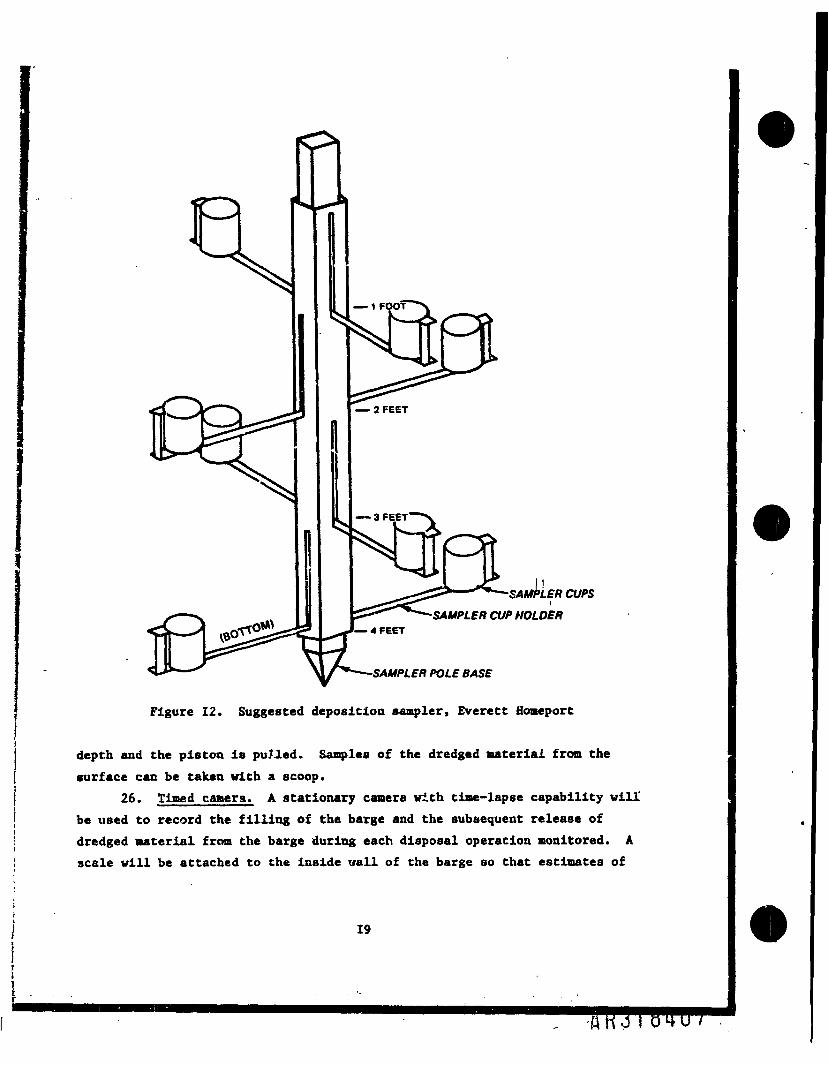
If/? CUPSI
SAMPLER CUP HOLDER4 FEET
-SAMPLER POLE BASE
Figure 12. Suggested deposition sampler, Everett Homeport
depth and the piston is pulled. Samples of the dredged material from thesurface can be taken with a scoop.
26. Timed camera. A stationary camera with time-lapse capability willbe used to record the filling of the barge and the subsequent release ofdredged material from the barge during each disposal operation monitored. Ascale will be attached to the inside wall of the barge so that estimates of
19
volumes and rates of filling and release can be determined from thephotographs.
27. Observation boats. At least seven observation boats will be usedsimultaneously during the disposal operation sampling period. The boatsshould be large enough to accommodate three crew members, who will handleequipment and record d*ta, plus all necessary equipment. The observationboats will serve as a working platform for the crew and should be stable underexpected working conditions. The boats should also be able to anchor in thewater depths anticipated at the site and be equipped with electronicpositioning equipment.
Description of disposaloperations to be monitored
28. The disposal barge will be stationary during the monitoring opera-tion. A range of disposal operations consisting of varying volume and dredgedmaterial possessing different sediment and water content should be monitored(if applicable). In addition, disposals should be conducted at differenttimes in the tidal cycle, reflecting the maximum and slack current velocitiesduring the flood and ebb tides, and in different water depths (if applicable).Data collection phases
29. Major factors affecting the short-term fate of dredged materialdisposed in open water are the disposal site characteristics, the propertiesof the disposed material, and the type of disposal operation. Data concerningeach factor must be collected. The behavior of the material can be separatedinto three phases: convectlve descent, during which the dump cloud or dis-charge jet falls under the influence of gravity; bottom collapse, occurringwhen the descending cloud or jet impacts the bottom; and passive transport-diffusion, commencing when the material transport and spreading are determinedmore by ambient currents and turbulence than by the dynamics of the disposaloperation. Data describing the movement of the dredged material through eachof these phases will be collected.
30. Bathymetry. Bathymetrie surveys will be obtained prior to disposaland after the entire volume of dredged material has been placed in each phass.Phases to be surveyed include the berm (if used), first contaminated mound,
110
fl-R3ifiuna

first cap, second contaminated mound, and second cap. Other supplemental sur-veys would be desirable to determine progress during each phase.
31. The predisposal survey is to establish existing depth gradients andto serve as "prehistory" of the site prior to initial disposal. The post-disposal surveys will be used to help determine mound configuration and sedi-ment volumes.
32. Disposal site characteristics. Current velocity and direction datafrom at least one station will be collected during the sampling period. Suchdata can then be converted to a local velocity field through a ratio of waterdepths. A sufficiently large density gradient in sufficiently deep water canresult in arrest of the descent phase. Therefore, the vertical density pro-file at the time of maximum flood, ebb, and slack-water current velocitieswill be obtained at the deepest point In the disposal site. This will requirethe collection of salinity and temperature data.
33. Properties of dredged material. Data must be collected concerningthe properties of the dredged material in the barge prior to all disposaloperations that are monitored. Timed photographs should be taken as thebarges are filled during dredging. Samples of dredged material, for subse-quent laboratory analysis, must be taken from the barges with the syringe sam-pler previously discussed. In most cases the material will not be uniformlydistributed over the depth; therefore, samples should be taken at the surface,at middepth, and near the bottom. These samples will be analyzed for tlie fol-lowing parameters: moisture content, Atterberg limits, bulk density, specificgravity of solids, void ratio, and the particle size distribution. Chemicalcomposition should ilso be determined.
34. Point of discharge. Control of the point of discharge will beimportant throughout the disposal operation. Appropriate control for thepoint of discharge will be specified in the plans and specifications and willbe used to establish the points of discharge during the monitoring. Controlfor the point of discharge could be established by prelocated taut-line buoy,electronic positioning with onboard computer printout, or other appropriatemeans. The disposal barge during placement of contaminated sediments shouldbe stationary during the release phase for each dump. This will assist inkeep Lng the dredged material mass in a clumped condition for descent.
35. Disposal operation data. The quantity of material and the mode ofoperation of the bottom-dump doors must be provided for each disposal
111
operation monitored. Information concerning the time required to complete thedischarge of material from individual barges as well as the time required forcomplete discharge is essential. In addition, the location of the doors belowthe water surface, the distance from the doors to the center of gravity of thedredged material, and the dimensions of the doors muse be furnished. The rateof emptying of the barges can bt determined by taking a series of timed pho-tographs of the barges during discharge. Water level measured against a scalephotographed in place in the barges can then be converted to volume of mate-rial with the aid of calibration curves available from builder's drawings.Timing of events during the monitoring efforts should be based on the time atwhich the scow doors are first opened. Observers should be placed on the scowto call or signal the time of discharge.
36. Descent data. Processes that occur during the descent of dredgedmaterial through the water column determine the impact velocity at the bottom,the location of the impact point, and ihe amount of material that reaches thebottom. Field observations ue-'.ng transducers and a flowmeter are intended toyield information on the descent velocity, size, and entrainment of thedescending cloud or jet. The instruments to provide theae data may bedeployed as shown in Figure 13.
37. Release of much of the dredged material in the form of cohesiveblocks or clods will occur if the material in the barges is cohesive and thewater content is low. Evidence on the formation of clods during the releaseof the material must be provided. This can be obtained by either taking bot-torn photographs under the disposal vessel immediately after the disposaloperation, through acoustic data, or both. A transducer looking downwardalongside the disposal vessel will be used to detect the presence of clodsduring free-fall.
38. Detailed information on the descent of the dredged material will beobtained with transducers and flowmeters. The transducers should be used toproduce beams directed downward, upward, and sideways. From the transducerdata, the speed of the descending cloud or Jet can be determined. The speedof the descending jet of dredged material will also be measured with a flow-meter. A low threshold propeller should be used to enable the measurement offlow velocities from almost zero to perhaps 3 to 4 fps. The flowmeter couldbe attached alongside'the transducer as shown in Figure 13.
112

0)•a
uQ H•U O
O.
a o
u 0)CO MB 01ft >W
O •B£55•u a.4u w3 B00 01•H UB «g-0
01-4 JSa wi!cOi O
toM
01M
113
t ft?. > i

39. Bottom surge and spread data. Impact of the descending jet orcloud with the bottom deflects the flow of dredged material and entrainedwater to form a surge or density current that spreads away from the impactpoint. The surge spreads radially outward with both its thickness and speeddecreasing as its radius Increases. The cntrainment of ambient water into thesurge and friction eventually cause the velocity of the surge co decrease tothe point where much of its contained sediment is deposited. The iaitialenergy of the surge and the rate of energy dissipation determine the range ofthe surge, as well as the area of the bottom that will be covered by dredgedmaterial, the form, and the thickness of the deposit. To adequately describethe bottom surge it is necessary to know its velocity as a function of dis-tance from the impact point, its thickness, and the concentration of solidscontained. The rate at which the leading edge of the surge spreads outwardfrom the Impact area can be determined by noting the time at which the spread-ing surge of dredged material arrives at a number of stations various dis-tances from the disposal vessel. Since the bottom surge resulting from thedisposal of dredged material can be expected to spread over several hundredfeet, the distribution of stations shown in Figure 14 will be used. Since thedisposal is made over an essentially flat area of the disposal site, the surgeshould be symmetrical about the impact point. The station located 200 ftupcurrent of the descent impact point will be used to confirm this.
40. At each station, the arrival time of the surge will be detectedwith a transmissometer, a 200-kHz acoustic transducer, and a flowmeter or abottom-mounted recording current meter. A typical configuration of instru-ments required tc characterize the bottom surge is shown in Figure 15. Theinstruments must be secured in such a way as not to be displaced or damaged bythe bottom surge.
41. The thickness of the surge and the change in thickness in time willalso be measured by the acoustic transducers. Because of the suspendedsolids, the fluid in the bottom surge should return a good echo of the 200-kHzacoustic pulses.
42. To monitor the concentration of suspended sediment in the bottomsurge as well as the suspended sediment concentrations in the transport-diffusion phase, both transmissometers and water samples collected with sub-merged pumps will be employed. The transmissometers and pumps should
114
v --- ."

DISPOSALVESSEL f OBSERVER
f STATIONS••—••
200 *"" ' ** 200 400 800 1«00 3200
AMBIENTCURRENT
Figure 14. Distribution of deposition samplers, Everett Homeport
OBSERVATION_ BOATn___
3 \
FLOWMETERTRANSMISSOMETER - €=J>
CURRENT fS\ % —— - _METER LJ tZJ> r jj
. I
A TRANSDUCER
WATER PUMP
rn nn n^i n 11111111111111111111111111111111111111111111Figure 15. Data collection stations for observing the bottomsurge and transport-diffusion of the suspended sediment cloud,
Everett Homeport
115

Initially be stationed about 2 ft above the bottom and continuously pump waterto the observer boat above for purposes of monitoring the surge. Discretewater samples should be collected at the 200- and 400-ft stations at 30-secintervals for the first 3 to 5 min, and every minute thereafter until thesurge has passed. Water samples obtained simultaneously with transmittancereadings rhould provide a check on the transmissomater calibration, and willbe be particularly useful if the sediment concentration is too large to bemeasured by optical methods. The solids content of the water sacples can bedetermined by filtration through millipore filters followed by weighing of thedried sediment. The bottom surge phase of the disposal operation should beover approximately 15 min after its initiation. Additional sample volumes forwater quality should be taken at the 200-ft station during this period.
43. Transport-diffusion data. To provide Information on the longerterm of transport and diffusion of the suspended sediment cloud remainingafter the energy of the bottom surge has been dissipated, sediment concentra-tion and cloud thickness data should continue to be collected at all stationsuntil the next disposal event. During this period, alternating trans-missometer readings and water samples should be collected. The data should beobtained throughout the. water column at near-surface, middepth, and near-bottom. A sampling interval of 3 to 5 min would probably be sufficient.
44. Deposition data. Deposition samplers should be Installed or sedi-ment profile samples collected at the same locations shown on the grid in Fig-ure 14 to determine the quantity and distribution of settling from thedisposal operation. A bathymetrie survey of the dredged material mound shouldalso be obtained at the time of the deposition data collection.Water quality samples
45. Samples for water quality analysis will be collected at the stationnearest the downcurrent side of the point of •"sposal. The water quality sam-ples will be collected at the near-surface, m—idepth, and bottom at each sta-tion. Three replicates from each sampling depth will be obtained bysequential sampling at each depth. Each sample replicate will be of suffi-cient volume for the chemical analyses to be performed, including TSS, dis-solved chemical concentrations (filtered or centrifuged subsamples), and totalchemical concentrations. Dissolved samples will be defined as that parsing0.45-p filters. This will yield a total of nine water samples for chemical
116

analysis for each disposal operation monitored. Both the total and dissolvedsubsamples will be analyzed for metals, nutrients, PCBs, and PAHs. A list ofspecific parameters for analysis will be provided by the Seattle District.Data analysis and report
46. All data collected by the contractor will be furnished; however,the contractor will also analyze the data to provide the following informationin either graphic or tabular form for each ' , osal operation monitored:
a. Water depths over the disposal a'te and a description of therelative roughness of the bottom.
b. Magnitude and direction of ambitat current as a function oftime and position in the water column at the background currentstation. The water depth at the current station must beprovided.
c. Vertical profile of ambient density at maximum flood and ebbcurrent velocities and slack-water periods of the tidal cycle.
d. Amount of dredged material disposed in each disposal operation,bulk density, vertical variation of density in the hopper,grain-size distribution, void ratio, and Atterberg limits ofthe material in the hoppers or scow. Drawings of the disposalbarge showing the bottom doors and a detailed narrativedescribing the actual disposal operations, e.g., time requiredfor disposal to be completed, etc. In addition, visual obser-vations of the wind and sea conditions should be provided.
e_. Time required for the disposed cloud or jet of material tostrike the bottom, its growth while falling through the watercolumn, its velocity at bottom encounter, an estimate of theamount of solids that falls as clods, and the average fallvelocity of these clods must be provided.
f_. Time history of the radial spreading of the bottom surge and a~ time history of the flow velocity, surge thickness, and sus-
pended sediment concentrations at each of the stations.£. Thickness of deposited material obtained from the deposition
samplers. In addition, from the bottom photographs and theresurvey information, the volume of material deposited.
47. A written report describing the monitoring will be prepared, toinclude narrative descriptions of the conditions during monitoring, equipmentutilized, monitoring techniques employed, results, and any other datapertinent to the monitoring effort.Summary
48. The fate of dredged material released at an open-water disposalsite is determined by disposal site characteristics, properties of the mate-rial, aid the nature of the disposal operation. The objective of this

monitoring program is to follow the pith of the dredged material, to determinehow much material reaches the bottom, in what form, and how long it takes forthe placement processes controlled by the factors above to go to completion.Results from the field data collection will provide quantitative informationon how much material will be retained in the site from individual disposaloperations and the distribution of that material on the bottom. In addition,the detailed data collected during the descent, bottom collapse, andtransport-diffusion phases will aid greatly in the calibration of mathematicalmodels for predicting the short-term physical fate of dredged material duringopen-water disposal operations.
Monitoring Plan tor Mound and Cap Behavior
General49. This plan is intended to provide dcta for determining the final cap
thickness immediately following disposal and after initial consolidation, andthe effectiveness of the cap in chemically isolating the contaminated sedi-ments. This will be accomplished by physical and chemical analysis of coresamples taken through the cap at various time intervals. Information on mate-rial type, density, and void ratios must be obtained at various times before,during, and after the dredging] and subsequent disposal and capping operationsto qu&atify the amount and condition of materials involved. The monitoringeffort would be similar to that carried out for the recent capping demonstra-tion project on the Duwaraish Waterway. Determination of the materials' insitu engineering properties over time is necessary. Also, chemical analysisof the sediments and the pore water will yield information on possible con-taminants ami any discernible migration of these contaminants through the capinto the water column. Several types of activities are necessary to obtainthe required information.
50. In situ samples of the sediments must be obtained before dredging,during storage/transport in the barge, and at several times after placement atthe disposal site. Core borings of the sediment/dredged material will provideinformation concerning types of materials involved in this disposal operation;this information will be useful in predicting anticipated behavior of thematerial and in interpreting and understanding observed field behavior, i.e.,rate of consolidation and possible erodibility of the sediments. Sampling
118

will also provide data on void ratios/densities of the material at varioustimes during the dredging/disposal operation; this will allow determination ofthe (average) effect of various dredging/disposal activities on sedimentcharacteristics. Void ratio data will provide needed information about theconditions existing when consolidation begins.Sampling and materials
51. Portions of the sampling requirements may be covered in other mon-itoring plans or sufficient data may be available from previous samples. How-ever, all required sampling is discussed in this monitoring plan. Sampleswill be taken at selected locations within the contaminated shoal to bedredged within representative transport barges and at the disposal site. Allcore samples will be taken with a Vibracore, or equivalent, core sampler. A20-ft vibracore sample, or a shorter sample if refusal is reached before20 ft, will be taken at each sampling location. Within the barge, grab sam-ples will be taken during barge loading. Portions of all samples taken priorto disposal operations will be available for chemical analysis, as deemed nec-essary by sediment chemists. Samples taken subsequent to disposal will becollected for the dual purposes of geotechnical and chemical analysis.
52. Vibracore samples of the foundation soils will be obtained from thedisposal site before the disposal operation begins. Vibracore samples will beobtained at stations corresponding to these shown in Figure 13. The boringsshould be centered iu the disposal site in the upslope to downslope direction.These samples are necessary for delineation of foundation materials fromdredged material in future borings collected at the disposal site. Priorknowledge of the foundation material to be expected at the disposal site willbe invaluable in identification of the foundation/dredged material interface,particularly if any intermixing of materials occurs during disposal or sam-pling operations.
53. After placement of both the contaminated material and the cappingmaterial, core borings will be taken at specified time intervals to provideprofiles of engineering properties. This will provide a means of monitoringany changes in the capped site in both the spatial and time dimensions.
54. Initial samples at the capped site will be taken utilizing theVibracore sampler. Whether or not thi«* sampler is used for future core bor-ings on this project is dependent upon (a) quality of the samples obtainedinitially from the capped site and (b) continued availability of the
119
J 7

equipment. Twenty-foot samples will be taken at locations selected to corre-spond with settlement plates that will have been placed in th* dipposal sitebefore sampling occurs. Vibracore samples will be taken of locations. Theschedule for sampling should be: immediately after cap placement and then at6, 12, and 18 months after cap placement.Laboratory testing (geotechnical)
55. The vibracore borings-will be visually inspected and photographedsoon after completion of the sampling operation. Portions of each boring willbe selected for laboratory testing. Sell classification will be determinedfor each sample; testing will include water content, Atterberg limits, spe-cific gravity, and grain-size distribution (hydrometer and/or sieves analysis).Consolidation tests will also be performed on selected samples. The number ofsamples selected for testing will be dependent upon results of the visualexamination of the cores.Settlement plates
56. Deployment and monitoring of settlement plates in the mcund isdesirable to differentiate between mound consolidation and mound erosion.Designs for settlement plates, aonltorlng requirements, diving plans, etc.,were necessary for similar mound monitoring conducted at the Duwamish demon-stration recently conducted in the Seattle District.
57. It is recognized that the water depth at the proposed CAD sitewould present significant problems for such a monitoring effort. Finaldecisions on deployment *nd mouitoring of settlement plates should be madeonly after final CAD site design is complete and a more through evaluation ofthe potential problems for monitoring can be made.Chemical migration through cap
58. Movement of contaminants through the cap and their rate of movementshould be determined using a combination of water column and sediment coresampling. As contaminants move into the clean cap material from the contami-nated sediment, they will be adsorbed by the clean material. As the adsorp-tive capacity of the 1-wer cap layer is reached, the contaminants continue tomove upward into cap sediment with remaining adsorptive capacity. Over time,the cap should become progressively more contaminated if contaminants aremqving from the underlying material, and a discernible contaminant wave couldbe observed. If the contaminants exceed the adsorptive capacity of the cap,they will diffuse into the overlying water. To track and quantify these
120

contaminant movements, cores and water samples should be taken as soon aftercapping as possible (within 1 month), then at 12 and 24 months after capping.
59. Water samples must be obtained from as near the bottom as possible(within 1 m) and should include four samples taken in a transect across thesite and an equal number of samples taken at an appropriate reference site.These samples must be filtered or centrifuged to remove particulate matter.
60. Sediment samples for chemical analysis will be obtained from vibra-cores. Four to six cores in a transect will be needed. Sampling will V«concentrated in the cap material and the upper 30 cm of capped sediment.Beginning at the surface of the core, twenty-three 4-cm sections will be takenin each core. This will ensure that all cap material to the clean/contam-inated interface will be sampled despite localized variations in the capdepth. In addition, one rample of capped material will be taken at a depth of6 ft.
Monitoring Plan for Intertidal Disposal
61. Monitoring efforts for intertidal disposal sites should includeeffluent monitoring during filling operation, surface water monitoring duringa representative storm event, and leachate monitoring using observation wells.
I Since design for intertidal sites is still under way, only descriptive plans'are given here.Effluent monitoring
62. Since the effluent discharged during filling operations potentiallyaccounts for the majority of contaminant release from an intertidal site,routine monitoring should take place throughout the filling operations. Theroutine monitoring could be limited to suspended solids and perhaps represen-tative chemical parameters to determine the overall efficiency of the site inretaining contaminants. The routine samples should be taken and analyzed on adally basis for suspended solids and parameters such as dissolved oxygen.Routine samples should be taken on a weekly basis for chemical analysis. Eachroutine sample should be composited from several grab samples of the effluenttaken from the discharge weir overflow. In addition to the routine sampling,a more intensive sampling effort should be carried out during one representa-tive filling day early in the disposal operation. This sampling effort willbe used to verify the accuracy of the modified elutriate test as a predictive
121

technique for the project. On the intensive sampling day, a fotal of12 influent and 12 effluent samples should be taken on an approximately hourlybasis. This will provide a basis for establishing the contaminant retentionefficiency of the site, as well as a basis for verifying the totcl contaminantmass release from the site.
63. All samples taken for chemical analysis should be analyzed fortotal and dissolved concentrations of the parameters of concern in addition tosuspended solids. Early routine monitoring can verify which parameters arelikely to be present in the effluent, and costs of monitoring could be sub-sequently reduced by eliminating other parameters from the analysis.Surface runoff monitoring
64. Monitoring of surface runoff quality should be conducted for a rep-resentative storm event. It is assumed that runoff water from storms would beponded in the site by control of the weir boarding, and water would only bereleased once suspended solies had settled from the ponded water to thegreatest possible degree. Therefore, the monitoring should be conducted bysampling directly from the pond during cr shortly after the storm event.Three replicate samples would be taken from the pond at the weir structure.The samples would be analyzed in the same manner as effluent samples takenduring filling as described sbove.Ground-water monitoring
65. Escape of contaminants from nearshore disposal sites can occur dueto the close proximity to and movement of water adjacent to the site. Moni-toring of contaminant, escaping into adjacent waters and ground waters is com-plex and costly. Tidal fluctuations at nearshore cites may affect thedirection and flow of ground water through the disposal sites. Since the con-taminated dredged material will be placed at or below the ground-water level,the contaminants will be in direct contact with the ground water, and thepotential for contaminant migration will exist. The results of testing haveindicated that the contaminants are sediment bound as long as the materialremains saturated; however, ground-water monitoring to confirm this would berequired. If the installation of liners to prevent contaminant migration isrequired, monitoring to evaluate the effectiveness of the liner system bothbelow and outside the site would be necessary.
66. Ground-water monitoring wells should be established around theentire sice at both the East Waterway and Snohomish sites. From preliminary
122

•ketches, the total diked perimeters of the 100-acre Snohomish Channel siteand tue Cast Waterway site are approximately 7,600 ft and 4,000 ft, respec-tively. If wells are spaced at 500-1t intervals, this would require theinstallation of 15 veils for the Snohomish Channel and 8 wells for the EastWaterway. These wells should be screened in the water-carrying stratumaround the site. Additionally, veils may also be installed in the dikes tomonitor ssepage through the dikes.. Monitoring wells installed inside the dis-posal areas will evaluate leachate percolating through the base of the dis-posal site. Monitoring wells installed outside the dikes when compared toveils through the dikes could be used to evaluate the dilution factor at thedikes.
67. The contaminants of concern have been identified by the SeattleDistrict ao: chromium (Cr), nickel (M), copper (Cu), zinc (Zn), arsenic (As),lead (Pb), cadmium (Cd), mercury (Hg), polychlorinated biphenyls (PBCs), poly-nuclear aromatic hydrocarbons (PAHs), and 1- and 2-methylnaphthalene.Sampling should begin before dredged material placement to evaluate backgroundconditions. Background conditions should be evaluated for tidal and seasonalfluctuation. The sampling frequency should be more frequent during the begin-ning of the dredging project to evaluate the initial Impact of the contami-nated sediments in the disposal sites. After disposal operations arecompleted and the clean caps are in place, sampling may be performed less fre-quently unless evidence of contaminant migration is seen.
68. Action threshold levels for contaminants of concern may be estab-lished to indicate the probability of exceeding chronic saltwater criteria atthe dike face. This would indicate a failure of the disposal site andcontrols to adequately contain the contaminants, and may justify initiating aremedial action. A monitoring program frequency and threshold level similarto the program used at the Port of Seattle for the Terminal 91 confined dis-posal of contaminated sediments may be used.
69. A detailed monitoring program cannot be developed without detaileddata as to dik? layout and construction, control measures to be constructed,and dredged material placement schedules. When ;hese c.ita become available orare developed along with more detailed information as to the hydrogeology ofthe site, a more detailed monitoring program outlining well placement and sam-pling strategy can be developed.
123

ND89
DTI