8 - 1 © 2003 pearson prentice hall statistical methods
TRANSCRIPT
8 - 8 - 11
© 2003 Pearson Prentice Hall© 2003 Pearson Prentice Hall
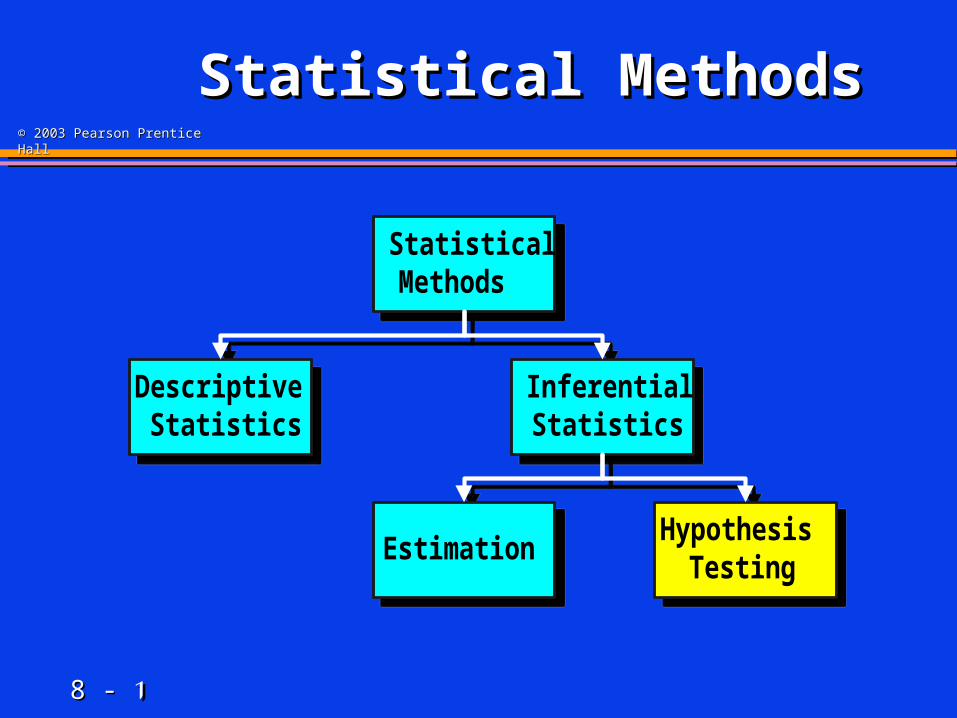
Statistical MethodsStatistical Methods
StatisticalMethods
DescriptiveStatistics
InferentialStatistics
EstimationHypothesis
Testing
StatisticalMethods
DescriptiveStatistics
InferentialStatistics
EstimationHypothesis
Testing
8 - 8 - 22
© 2003 Pearson Prentice Hall© 2003 Pearson Prentice Hall
Hypothesis Testing Hypothesis Testing ConceptsConcepts
8 - 8 - 33
© 2003 Pearson Prentice Hall© 2003 Pearson Prentice Hall
Hypothesis TestingHypothesis Testing
8 - 8 - 44
© 2003 Pearson Prentice Hall© 2003 Pearson Prentice Hall
Hypothesis TestingHypothesis Testing
PopulationPopulation
8 - 8 - 55
© 2003 Pearson Prentice Hall© 2003 Pearson Prentice Hall
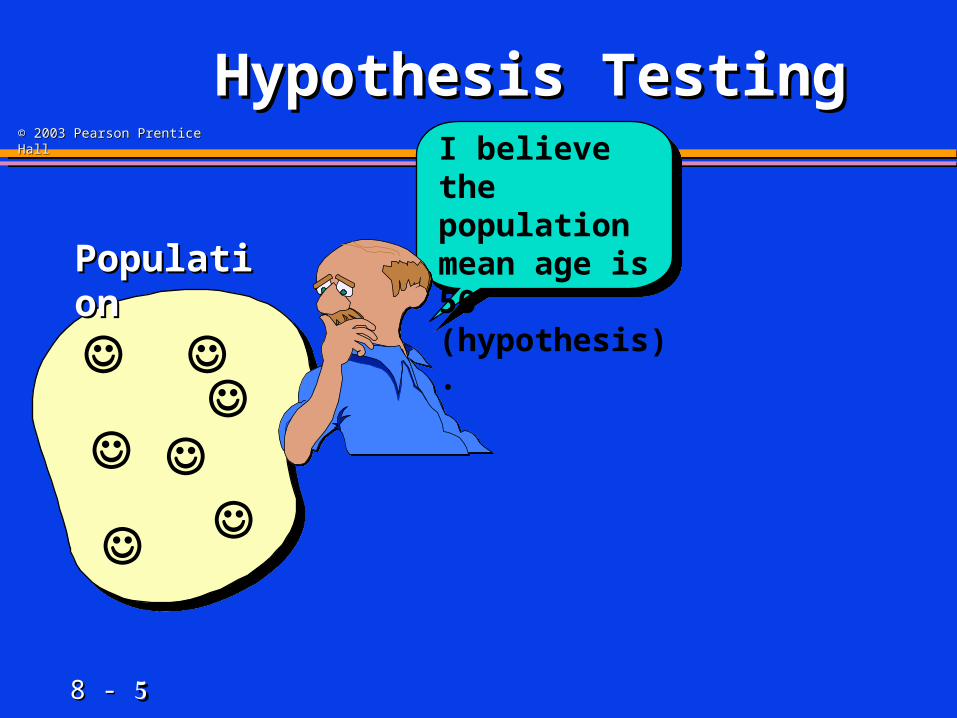
Hypothesis TestingHypothesis Testing
PopulationPopulation
I believe the population mean age is 50 (hypothesis).
8 - 8 - 66
© 2003 Pearson Prentice Hall© 2003 Pearson Prentice Hall
Hypothesis TestingHypothesis Testing
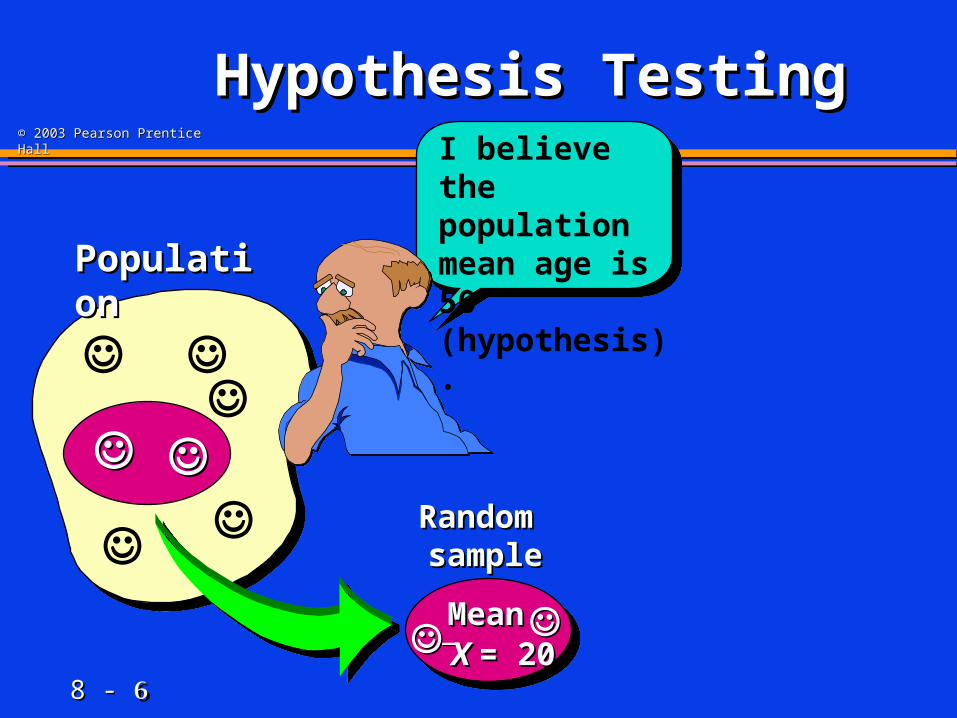
PopulationPopulation
I believe the population mean age is 50 (hypothesis).
MeanMean X X = 20= 20
Random Random samplesample
8 - 8 - 77
© 2003 Pearson Prentice Hall© 2003 Pearson Prentice Hall
Hypothesis TestingHypothesis Testing
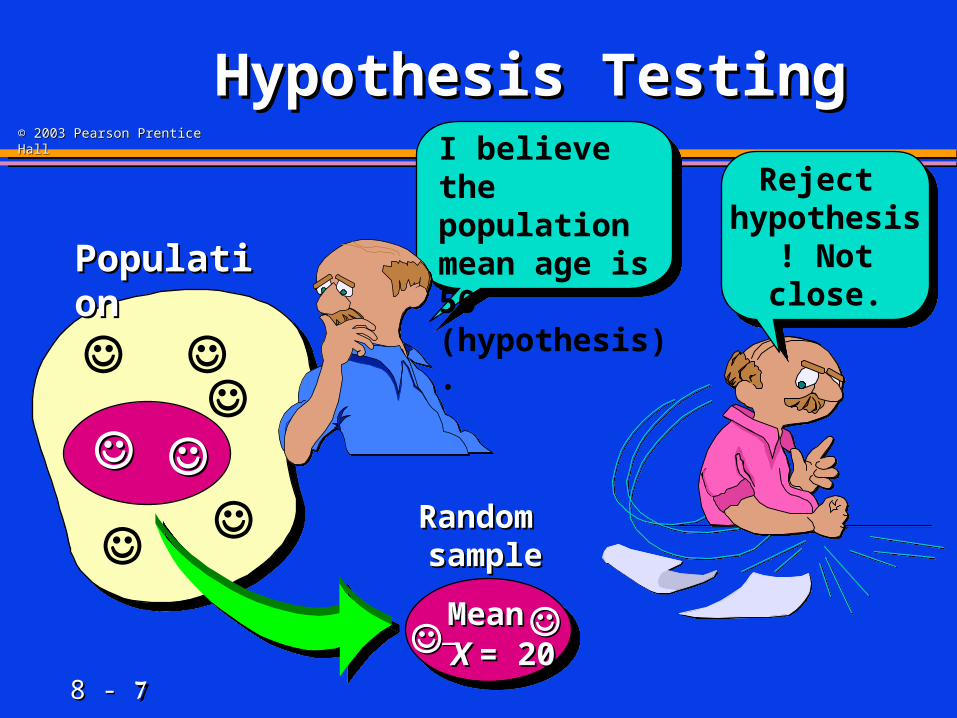
PopulationPopulation
I believe the population mean age is 50 (hypothesis).
MeanMean X X = 20= 20
Reject hypothesis! Not close.
Reject hypothesis! Not close.
Random Random samplesample
8 - 8 - 88
© 2003 Pearson Prentice Hall© 2003 Pearson Prentice Hall
What’s a What’s a Hypothesis?Hypothesis?
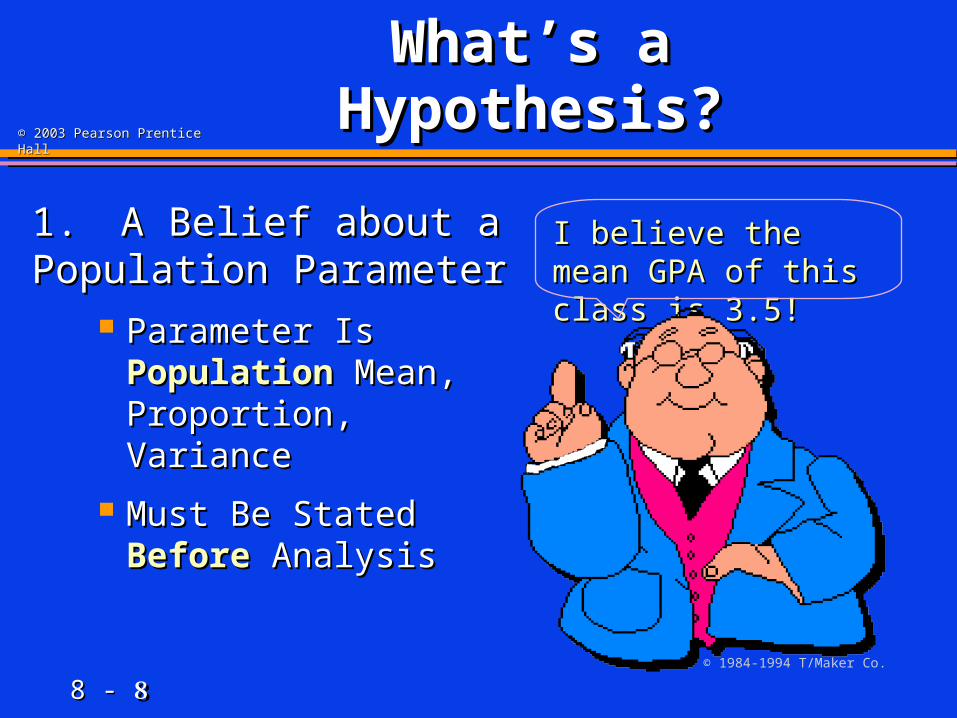
1.1. A Belief about a A Belief about a Population ParameterPopulation Parameter
Parameter Is Parameter Is PopulationPopulation Mean, Mean, Proportion, VarianceProportion, Variance
Must Be StatedMust Be StatedBeforeBefore Analysis Analysis
I believe the mean GPA I believe the mean GPA of this class is 3.5!of this class is 3.5!
© 1984-1994 T/Maker Co.
8 - 8 - 99
© 2003 Pearson Prentice Hall© 2003 Pearson Prentice Hall
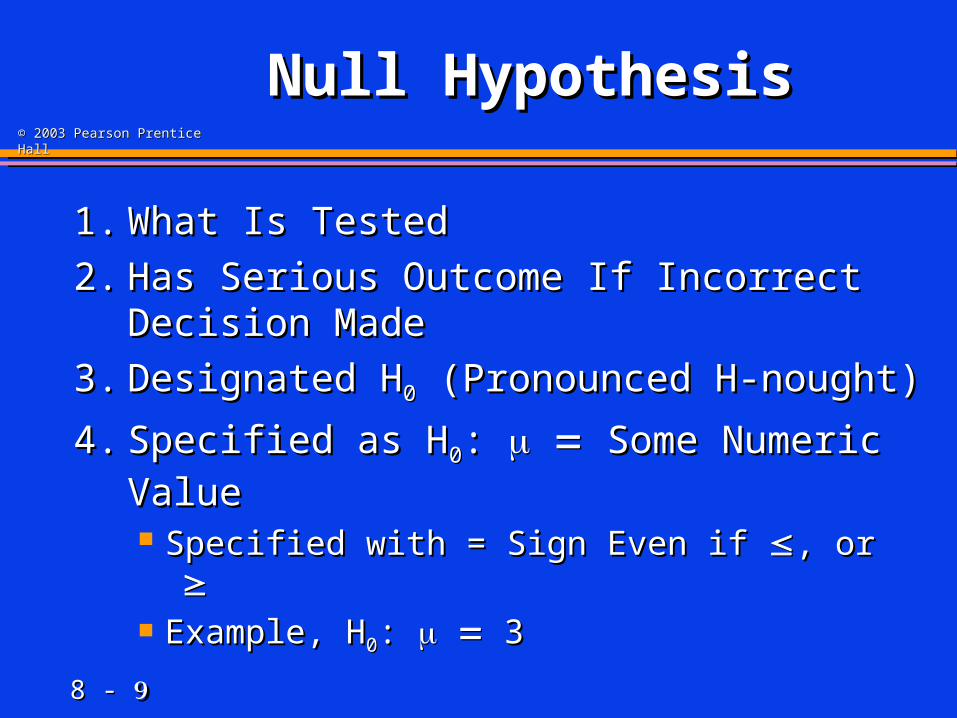
Null HypothesisNull Hypothesis
1.1. What Is TestedWhat Is Tested
2.2. Has Serious Outcome If Incorrect Has Serious Outcome If Incorrect Decision MadeDecision Made
3.3. Designated HDesignated H00 (Pronounced H-nought) (Pronounced H-nought)
4.4. Specified as HSpecified as H00: : Some Numeric Some Numeric
Value Value Specified with = Sign Even if Specified with = Sign Even if , or , or Example, HExample, H00: : 3 3
8 - 8 - 1010
© 2003 Pearson Prentice Hall© 2003 Pearson Prentice Hall
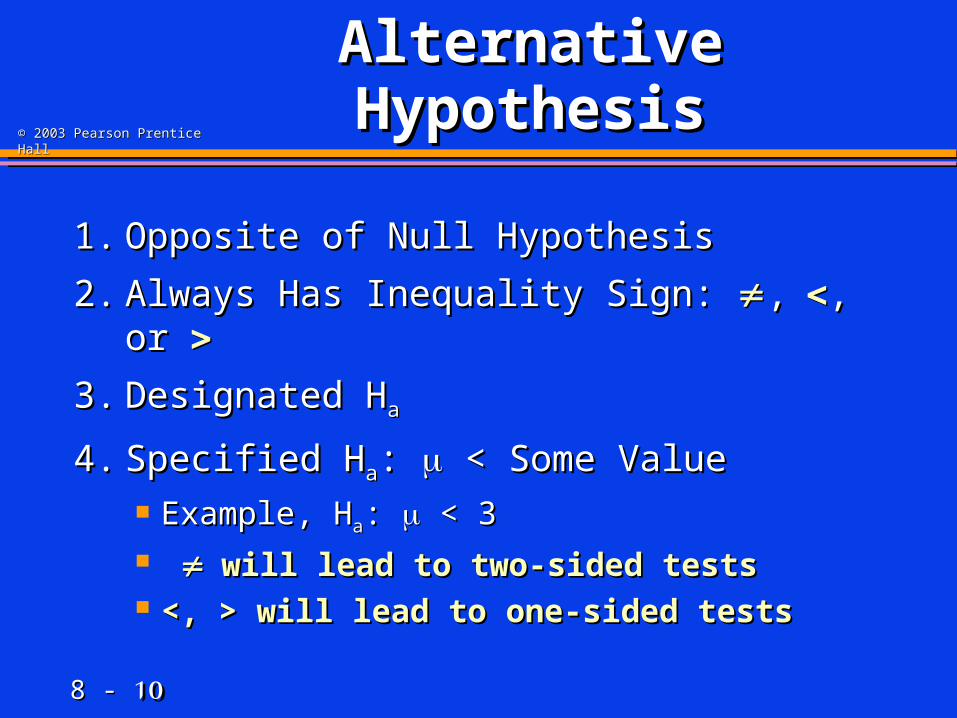
Alternative Alternative HypothesisHypothesis
1.1. Opposite of Null HypothesisOpposite of Null Hypothesis
2.2. Always Has Inequality Sign:Always Has Inequality Sign: ,,, or , or
3.3. Designated HDesignated Haa
4.4. Specified HSpecified Haa: : < Some Value < Some Value Example, HExample, Haa: : < 3 < 3 will lead towill lead to two-sided tests two-sided tests <, > will lead to one-sided tests<, > will lead to one-sided tests
8 - 8 - 1111
© 2003 Pearson Prentice Hall© 2003 Pearson Prentice Hall
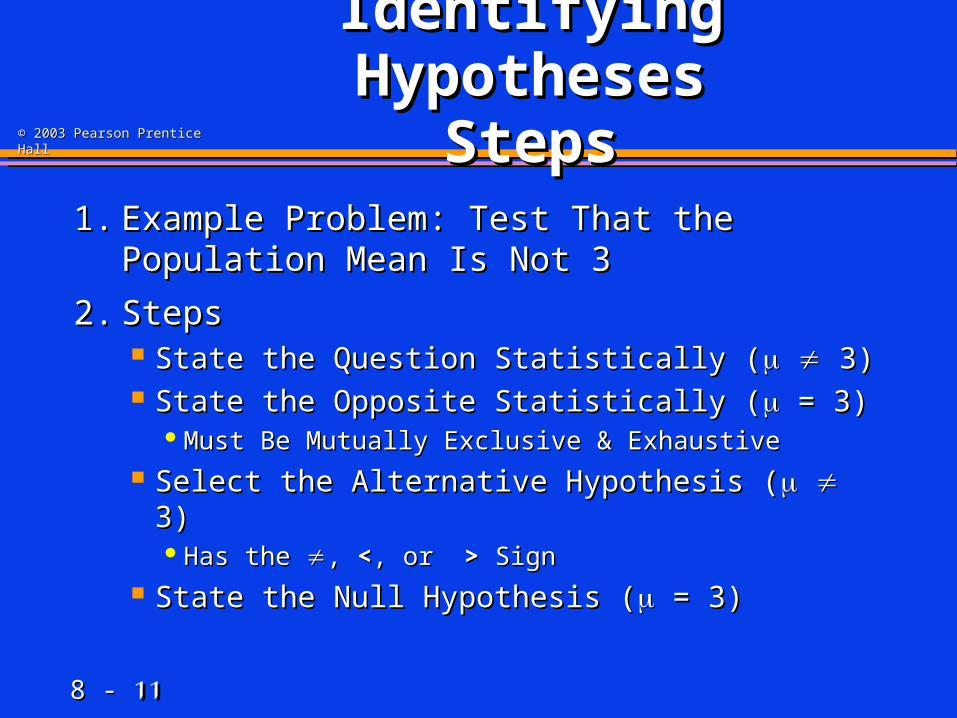
Identifying Identifying HypothesesHypotheses
StepsSteps1.1. Example Problem: Test That the Example Problem: Test That the
Population Mean Is Not 3Population Mean Is Not 3
2.2. StepsSteps State the Question Statistically (State the Question Statistically ( 3) 3) State the Opposite Statistically (State the Opposite Statistically ( = 3) = 3)
Must Be Mutually Exclusive & ExhaustiveMust Be Mutually Exclusive & Exhaustive Select the Alternative Hypothesis (Select the Alternative Hypothesis ( 3) 3)
Has the Has the , , <<, or , or > > SignSign State the Null Hypothesis (State the Null Hypothesis ( = 3) = 3)

8 - 8 - 1212
© 2003 Pearson Prentice Hall© 2003 Pearson Prentice Hall
State the question statistically: State the question statistically: = 12 = 12
State the opposite statistically: State the opposite statistically: 12 12
Select the alternative hypothesis: Select the alternative hypothesis: HHaa: :
1212
State the null hypothesis: State the null hypothesis: HH00: : = 12 = 12
Is the population average amount of TV Is the population average amount of TV viewing 12 hours?viewing 12 hours?
What Are the What Are the Hypotheses?Hypotheses?
8 - 8 - 1313
© 2003 Pearson Prentice Hall© 2003 Pearson Prentice Hall
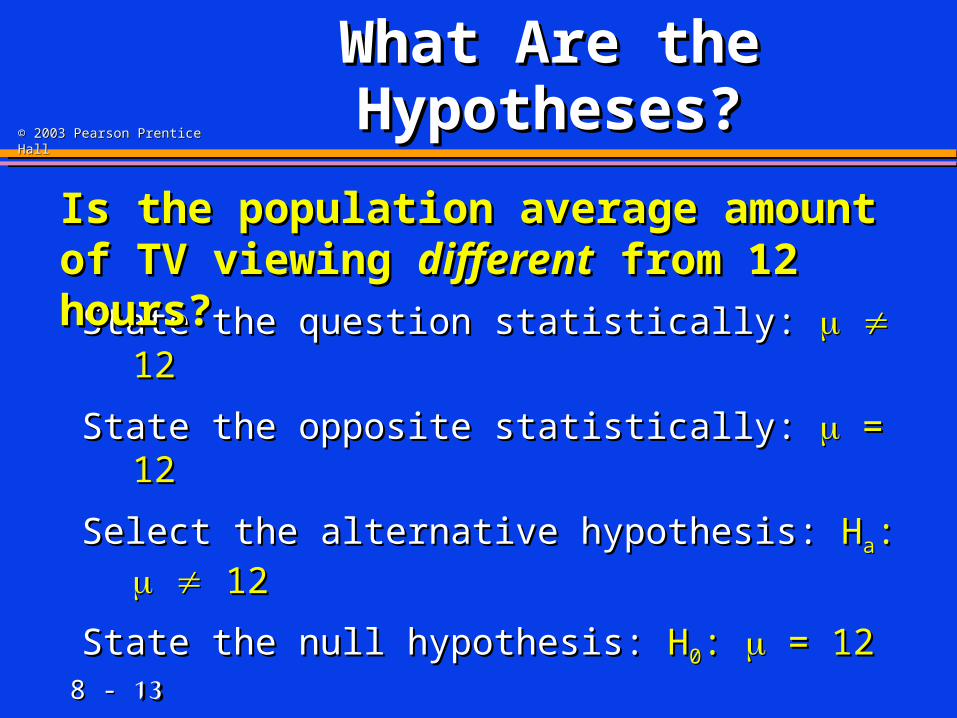
State the question statistically: State the question statistically: 12 12
State the opposite statistically: State the opposite statistically: = 12 = 12
Select the alternative hypothesis: Select the alternative hypothesis: HHaa: :
1212
State the null hypothesis: State the null hypothesis: HH00: : = 12 = 12
Is the population average amount of TV Is the population average amount of TV viewing viewing differentdifferent from 12 hours? from 12 hours?
What Are the What Are the Hypotheses?Hypotheses?
8 - 8 - 1414
© 2003 Pearson Prentice Hall© 2003 Pearson Prentice Hall
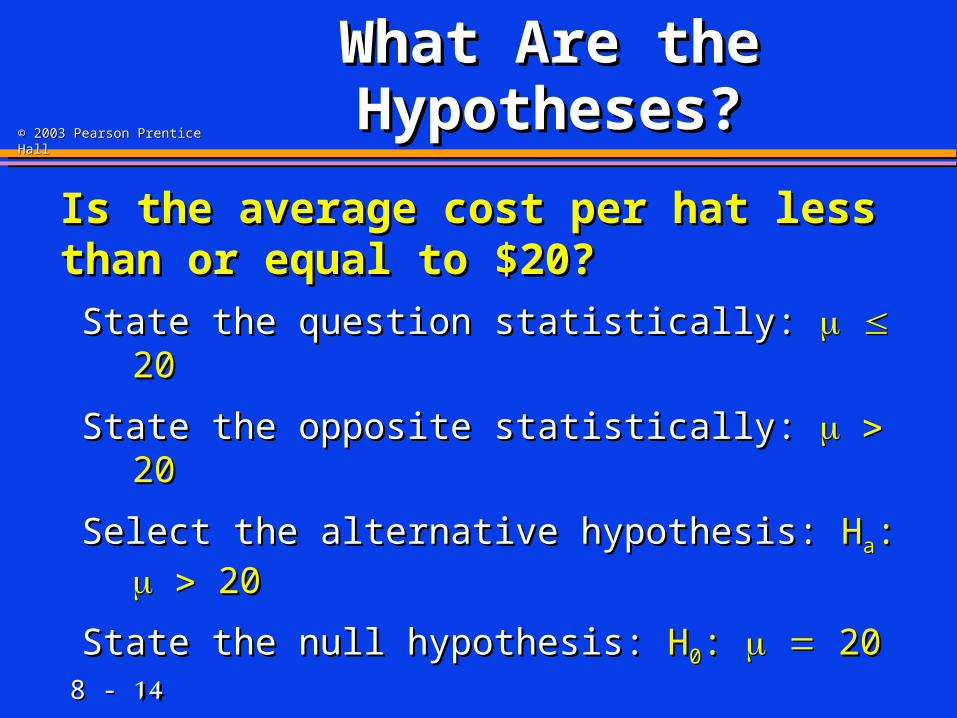
State the question statistically: State the question statistically: 20 20
State the opposite statistically: State the opposite statistically: 20 20
Select the alternative hypothesis: Select the alternative hypothesis: HHaa: : 20 20
State the null hypothesis: State the null hypothesis: HH00: : 20 20
Is the average cost per hat less than or Is the average cost per hat less than or equal to $20?equal to $20?
What Are the What Are the Hypotheses?Hypotheses?
8 - 8 - 1515
© 2003 Pearson Prentice Hall© 2003 Pearson Prentice Hall
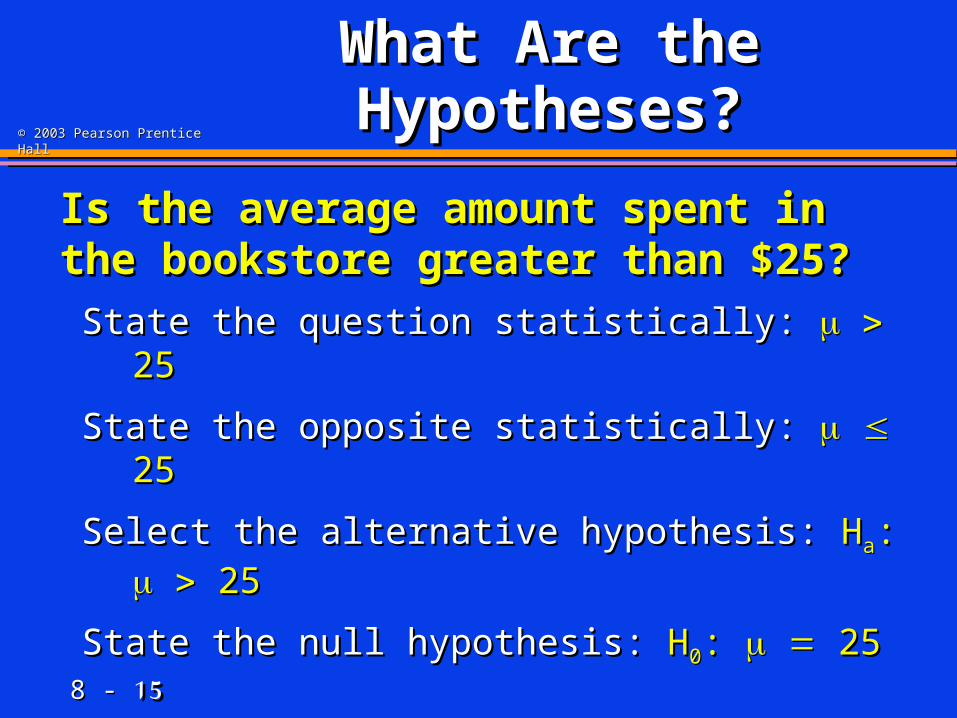
State the question statistically: State the question statistically: 25 25
State the opposite statistically: State the opposite statistically: 25 25
Select the alternative hypothesis: Select the alternative hypothesis: HHaa: : 25 25
State the null hypothesis: State the null hypothesis: HH00: : 25 25
Is the average amount spent in the Is the average amount spent in the bookstore greater than $25?bookstore greater than $25?
What Are the What Are the Hypotheses?Hypotheses?

8 - 8 - 1616
© 2003 Pearson Prentice Hall© 2003 Pearson Prentice Hall
Basic IdeaBasic Idea
8 - 8 - 1717
© 2003 Pearson Prentice Hall© 2003 Pearson Prentice Hall
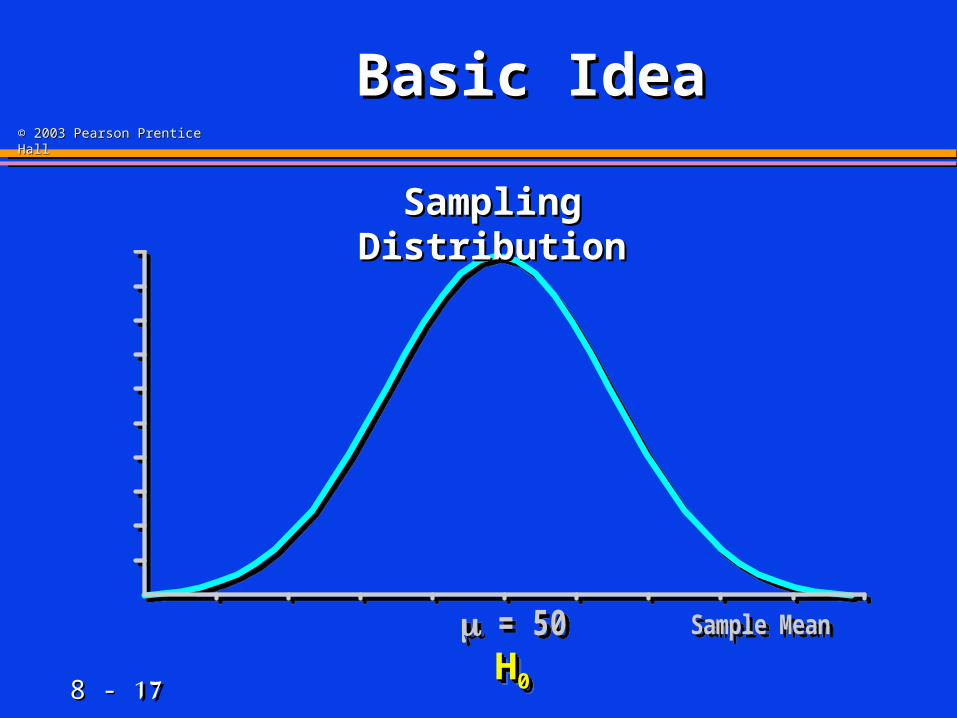
Basic IdeaBasic Idea
Sample Mean = 50 Sample Mean = 50
HH00HH00
Sampling DistributionSampling Distribution
8 - 8 - 1818
© 2003 Pearson Prentice Hall© 2003 Pearson Prentice Hall
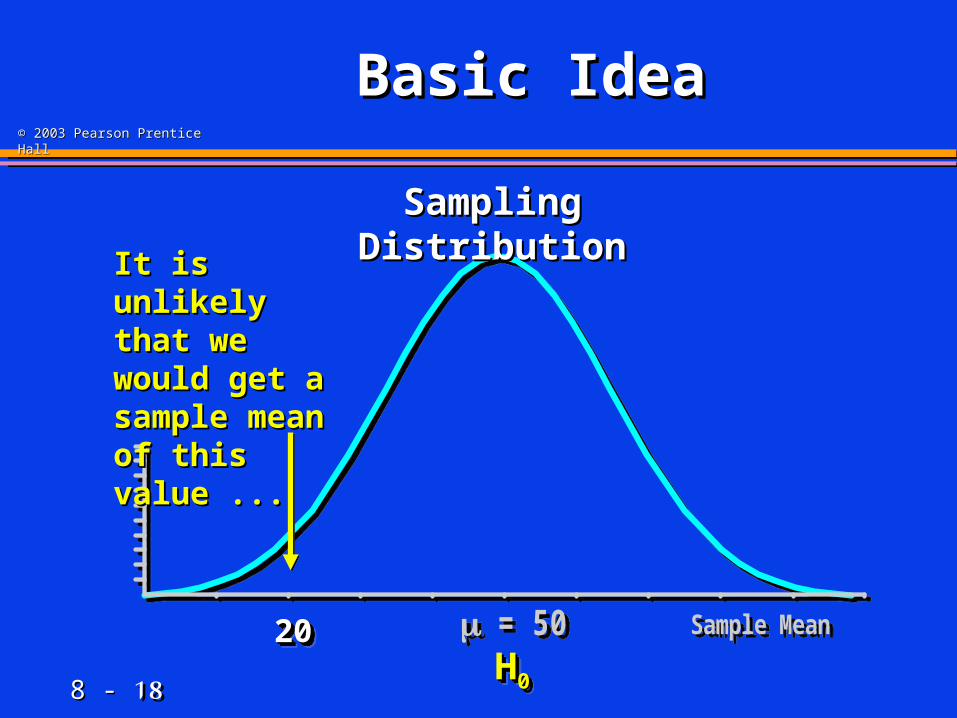
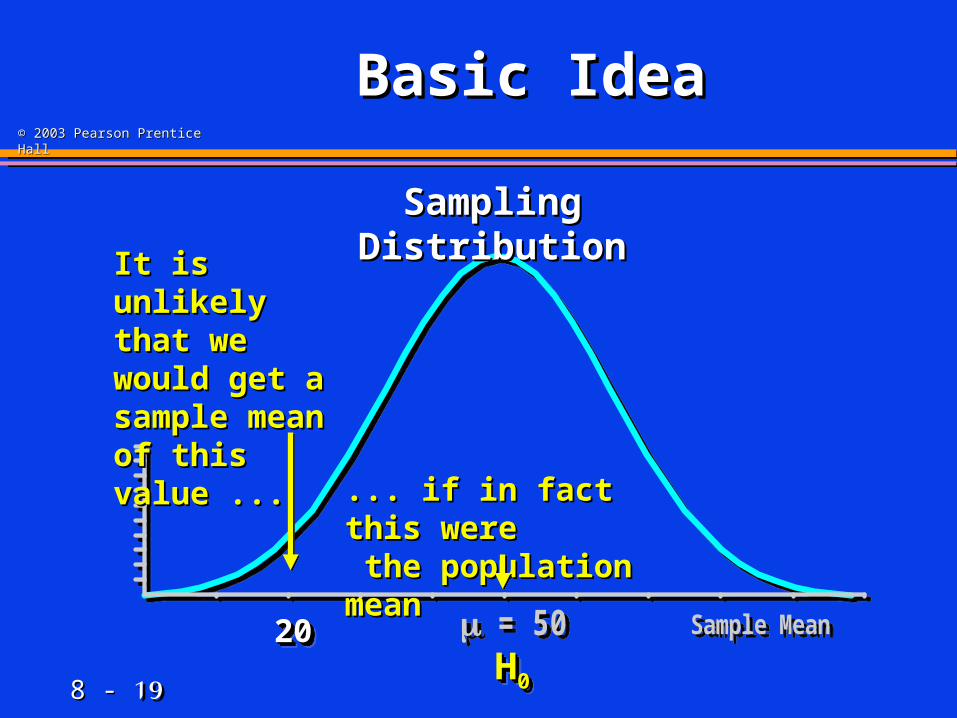
Basic IdeaBasic Idea
Sample Mean = 50 Sample Mean = 50
Sampling DistributionSampling Distribution
It is unlikely It is unlikely that we would that we would get a sample get a sample mean of this mean of this value ...value ...
20202020HH00HH00
8 - 8 - 1919
© 2003 Pearson Prentice Hall© 2003 Pearson Prentice Hall
Basic IdeaBasic Idea
Sample Mean = 50 Sample Mean = 50
Sampling DistributionSampling Distribution
It is unlikely It is unlikely that we would that we would get a sample get a sample mean of this mean of this value ...value ...
... if in fact this were... if in fact this were the population mean the population mean
20202020HH00HH00
8 - 8 - 2020
© 2003 Pearson Prentice Hall© 2003 Pearson Prentice Hall
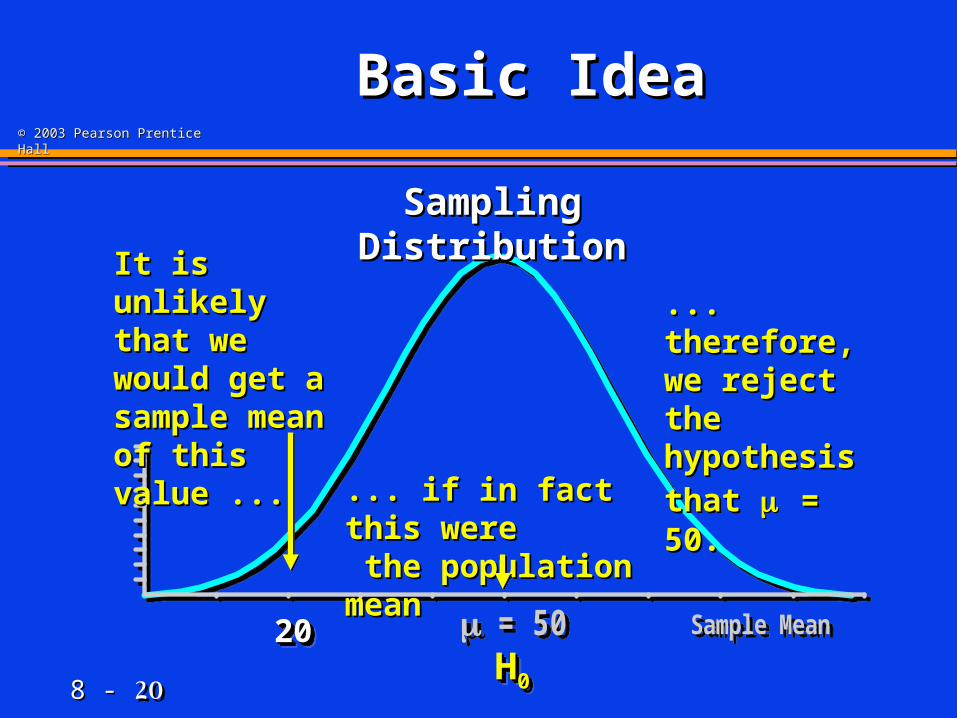
Basic IdeaBasic Idea
Sample Mean = 50 Sample Mean = 50
Sampling DistributionSampling Distribution
It is unlikely It is unlikely that we would that we would get a sample get a sample mean of this mean of this value ...value ...
... if in fact this were... if in fact this were the population mean the population mean
... therefore, ... therefore, we reject the we reject the hypothesis hypothesis
that that = 50.= 50.
20202020HH00HH00
8 - 8 - 2121
© 2003 Pearson Prentice Hall© 2003 Pearson Prentice Hall
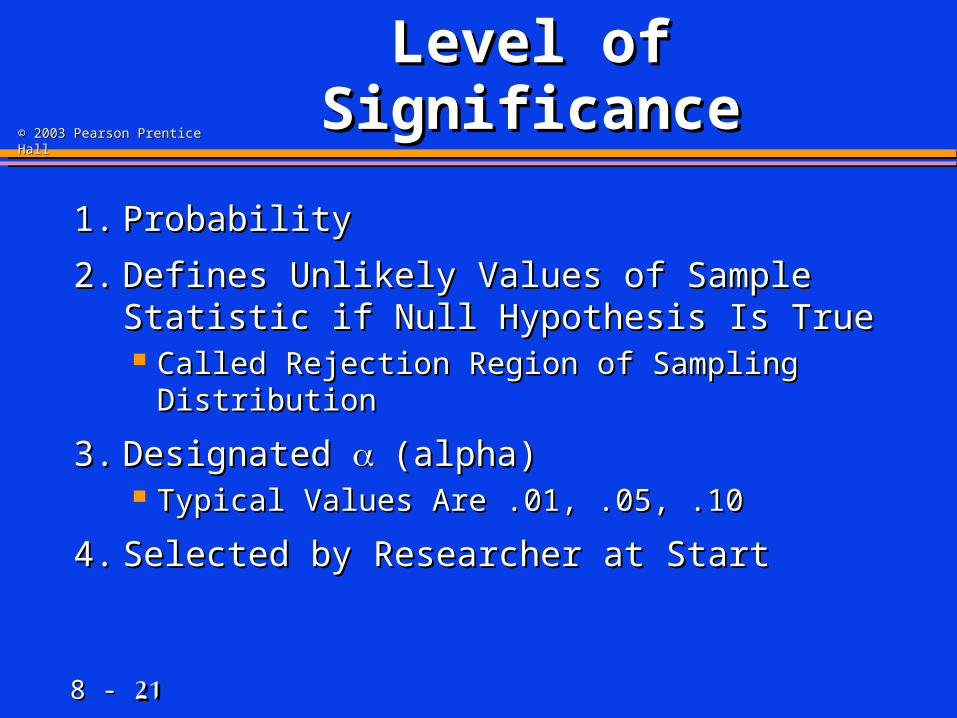
Level of SignificanceLevel of Significance
1.1. ProbabilityProbability
2.2. Defines Unlikely Values of Sample Defines Unlikely Values of Sample Statistic if Null Hypothesis Is TrueStatistic if Null Hypothesis Is True Called Rejection Region of Sampling Called Rejection Region of Sampling
DistributionDistribution
3.3. Designated Designated (alpha)(alpha) Typical Values Are .01, .05, .10Typical Values Are .01, .05, .10
4.4. Selected by Researcher at StartSelected by Researcher at Start
8 - 8 - 2222
© 2003 Pearson Prentice Hall© 2003 Pearson Prentice Hall
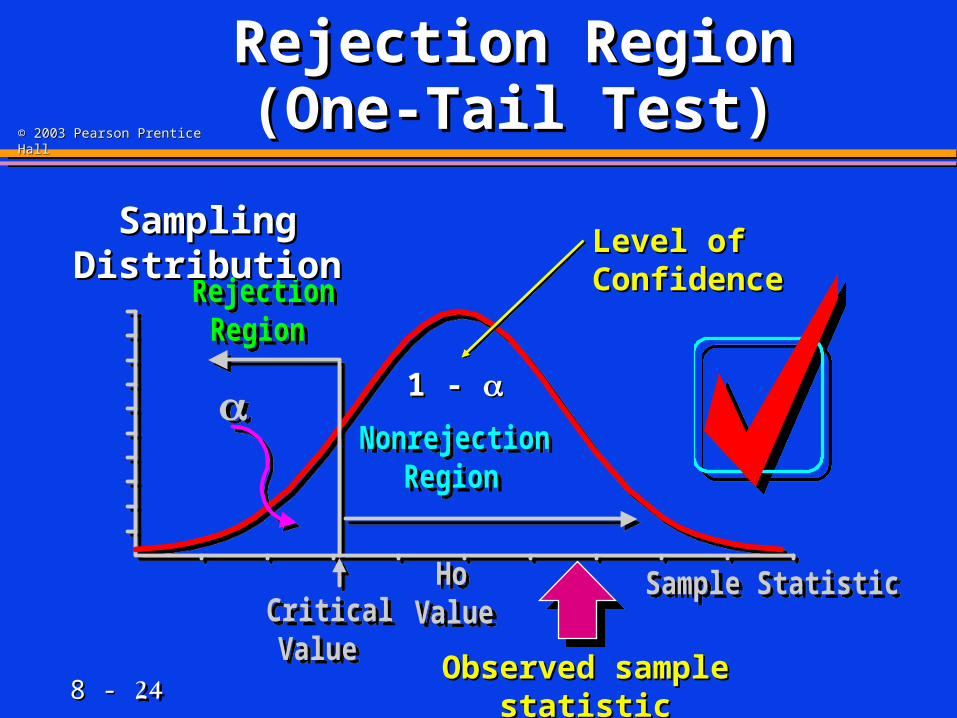
Rejection Region Rejection Region (One-Tail Test) (One-Tail Test)

8 - 8 - 2323
© 2003 Pearson Prentice Hall© 2003 Pearson Prentice Hall
Rejection Region Rejection Region (One-Tail Test) (One-Tail Test)
HoValueCritical
Value
Sample Statistic
RejectionRegion
NonrejectionRegion
HoValueCritical
Value
Sample Statistic
RejectionRegion
NonrejectionRegion
Sampling DistributionSampling Distribution
1 - 1 -
Level of ConfidenceLevel of Confidence
8 - 8 - 2424
© 2003 Pearson Prentice Hall© 2003 Pearson Prentice Hall
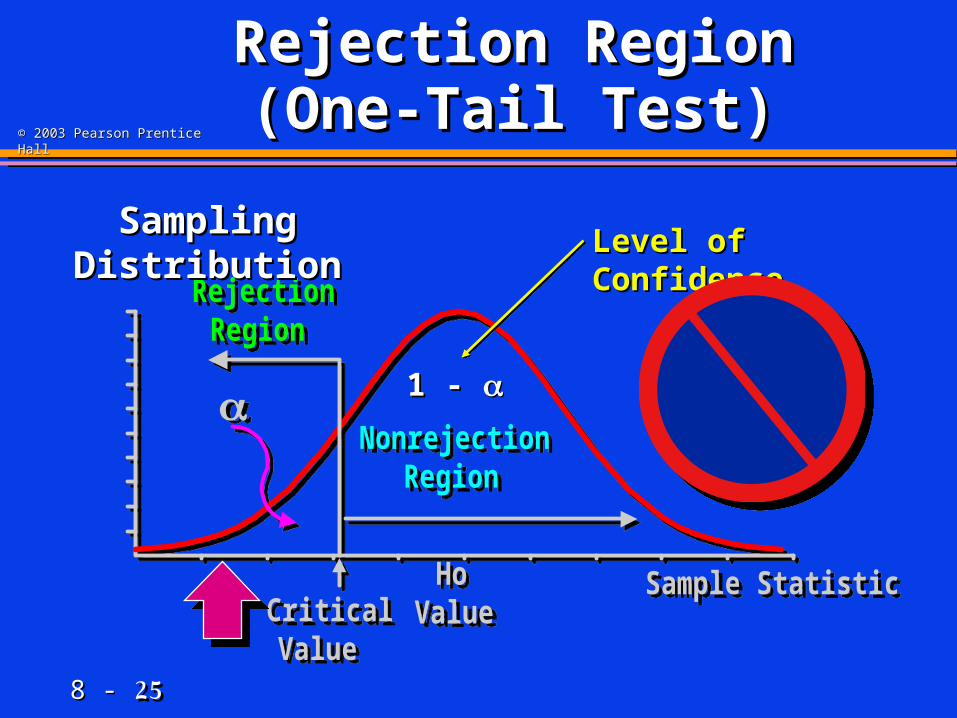
Rejection Region Rejection Region (One-Tail Test) (One-Tail Test)
HoValueCritical
Value
Sample Statistic
RejectionRegion
NonrejectionRegion
HoValueCritical
Value
Sample Statistic
RejectionRegion
NonrejectionRegion
Sampling DistributionSampling Distribution
1 - 1 -
Level of ConfidenceLevel of Confidence
Observed sample statisticObserved sample statistic
8 - 8 - 2525
© 2003 Pearson Prentice Hall© 2003 Pearson Prentice Hall
Rejection Region Rejection Region (One-Tail Test) (One-Tail Test)
HoValueCritical
Value
Sample Statistic
RejectionRegion
NonrejectionRegion
HoValueCritical
Value
Sample Statistic
RejectionRegion
NonrejectionRegion
Sampling DistributionSampling Distribution
1 - 1 -
Level of ConfidenceLevel of Confidence

8 - 8 - 2626
© 2003 Pearson Prentice Hall© 2003 Pearson Prentice Hall
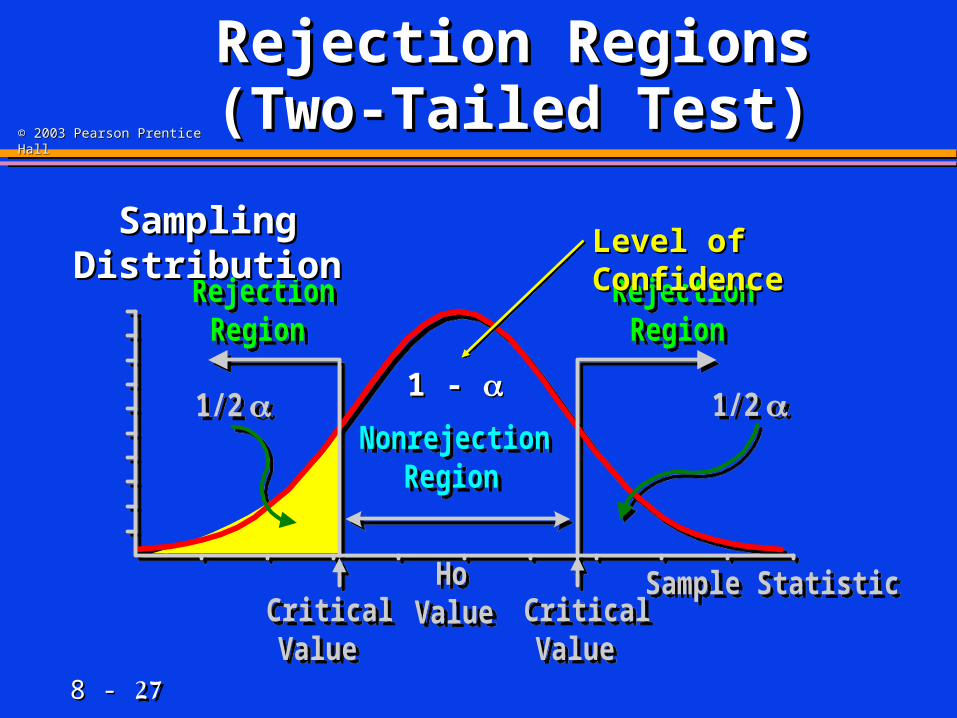
Rejection Regions Rejection Regions (Two-Tailed Test) (Two-Tailed Test)
8 - 8 - 2727
© 2003 Pearson Prentice Hall© 2003 Pearson Prentice Hall
Rejection Regions Rejection Regions (Two-Tailed Test) (Two-Tailed Test)
HoValue Critical
ValueCriticalValue
1/2 1/2
Sample Statistic
RejectionRegion
RejectionRegion
NonrejectionRegion
HoValue Critical
ValueCriticalValue
1/2 1/2
Sample Statistic
RejectionRegion
RejectionRegion
NonrejectionRegion
Sampling DistributionSampling Distribution
1 - 1 -
Level of ConfidenceLevel of Confidence
8 - 8 - 2828
© 2003 Pearson Prentice Hall© 2003 Pearson Prentice Hall
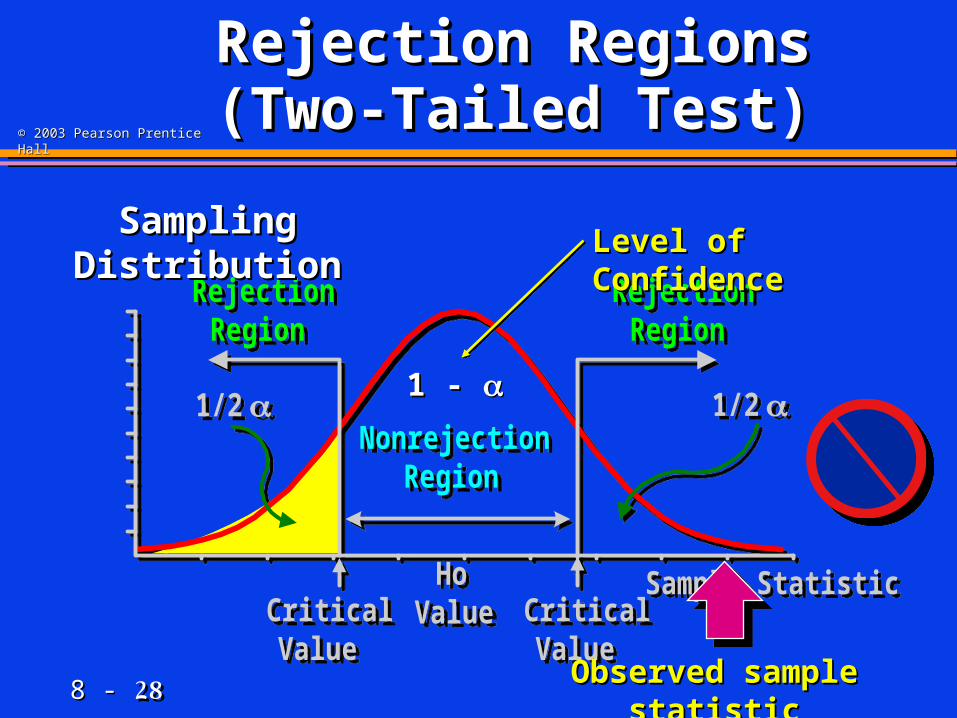
Rejection Regions Rejection Regions (Two-Tailed Test) (Two-Tailed Test)
HoValue Critical
ValueCriticalValue
1/2 1/2
Sample Statistic
RejectionRegion
RejectionRegion
NonrejectionRegion
HoValue Critical
ValueCriticalValue
1/2 1/2
Sample Statistic
RejectionRegion
RejectionRegion
NonrejectionRegion
Sampling DistributionSampling Distribution
1 - 1 -
Level of ConfidenceLevel of Confidence
Observed sample statisticObserved sample statistic
8 - 8 - 2929
© 2003 Pearson Prentice Hall© 2003 Pearson Prentice Hall
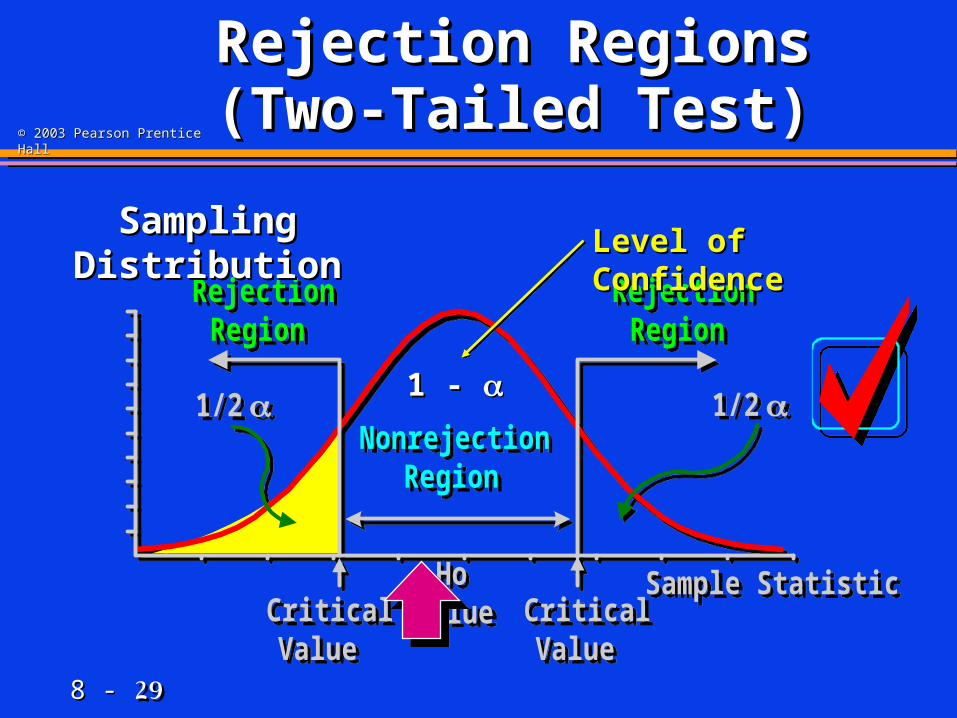
Rejection Regions Rejection Regions (Two-Tailed Test) (Two-Tailed Test)
HoValue Critical
ValueCriticalValue
1/2 1/2
Sample Statistic
RejectionRegion
RejectionRegion
NonrejectionRegion
HoValue Critical
ValueCriticalValue
1/2 1/2
Sample Statistic
RejectionRegion
RejectionRegion
NonrejectionRegion
Sampling DistributionSampling Distribution
1 - 1 -
Level of ConfidenceLevel of Confidence
8 - 8 - 3030
© 2003 Pearson Prentice Hall© 2003 Pearson Prentice Hall
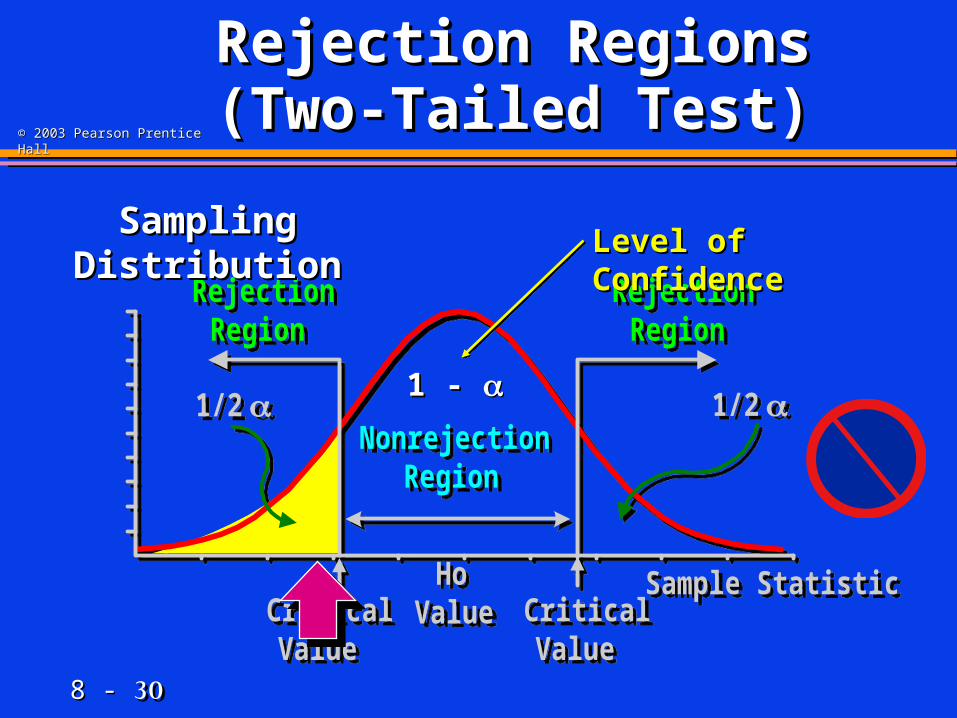
Rejection Regions Rejection Regions (Two-Tailed Test) (Two-Tailed Test)
HoValue Critical
ValueCriticalValue
1/2 1/2
Sample Statistic
RejectionRegion
RejectionRegion
NonrejectionRegion
HoValue Critical
ValueCriticalValue
1/2 1/2
Sample Statistic
RejectionRegion
RejectionRegion
NonrejectionRegion
Sampling DistributionSampling Distribution
1 - 1 -
Level of ConfidenceLevel of Confidence
8 - 8 - 3131
© 2003 Pearson Prentice Hall© 2003 Pearson Prentice Hall
Hypothesis Testing Hypothesis Testing StepsSteps
8 - 8 - 3232
© 2003 Pearson Prentice Hall© 2003 Pearson Prentice Hall
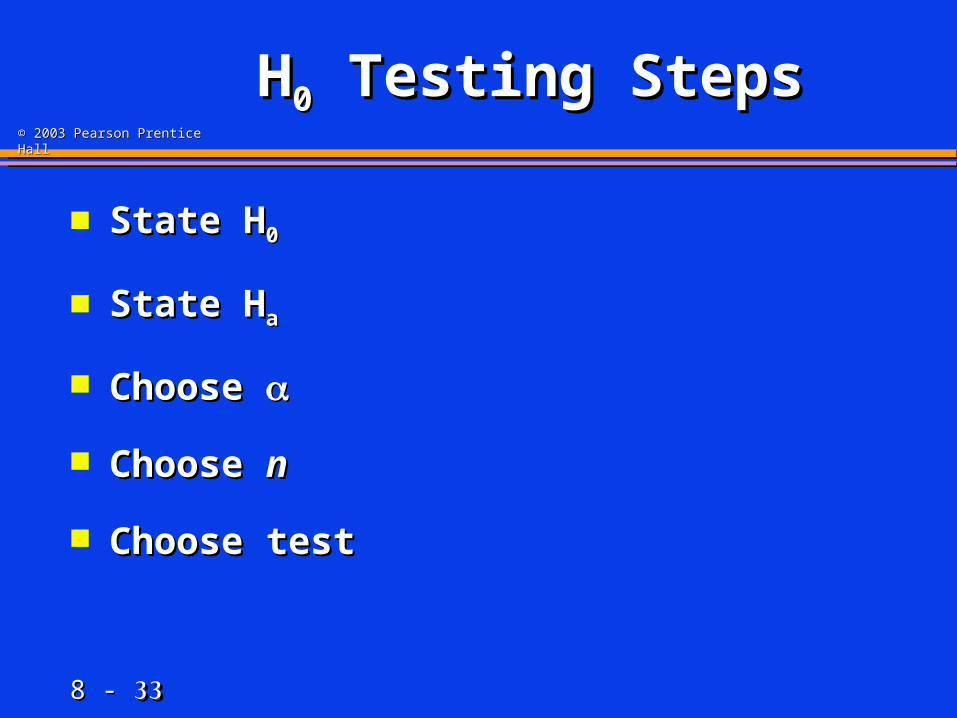
HH00 Testing Steps Testing Steps
8 - 8 - 3333
© 2003 Pearson Prentice Hall© 2003 Pearson Prentice Hall
HH00 Testing Steps Testing Steps
State HState H00
State HState Haa
Choose Choose
Choose Choose nn
Choose testChoose test
8 - 8 - 3434
© 2003 Pearson Prentice Hall© 2003 Pearson Prentice Hall
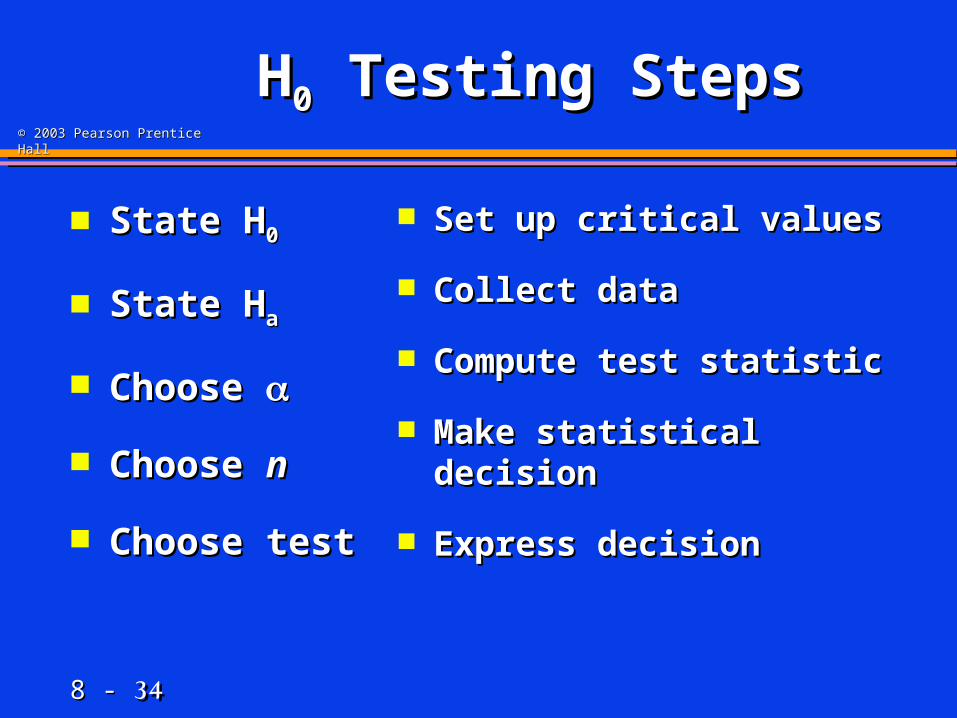
HH00 Testing Steps Testing Steps
Set up critical valuesSet up critical values
Collect dataCollect data
Compute test statisticCompute test statistic
Make statistical decisionMake statistical decision
Express decisionExpress decision
State HState H00
State HState Haa
Choose Choose
Choose Choose nn
Choose testChoose test
8 - 8 - 3535
© 2003 Pearson Prentice Hall© 2003 Pearson Prentice Hall
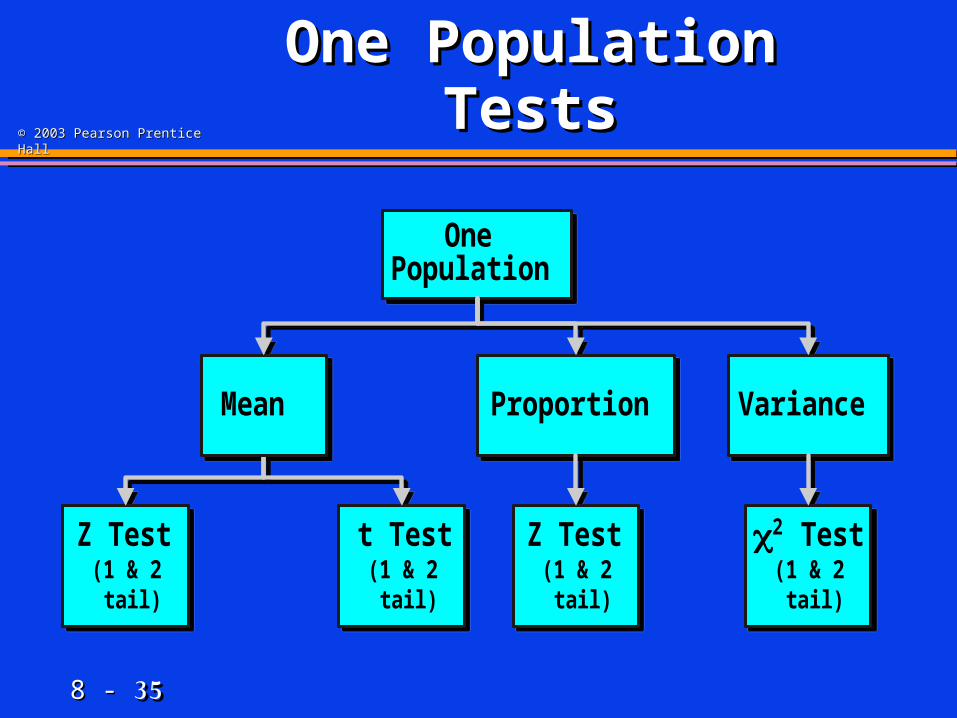
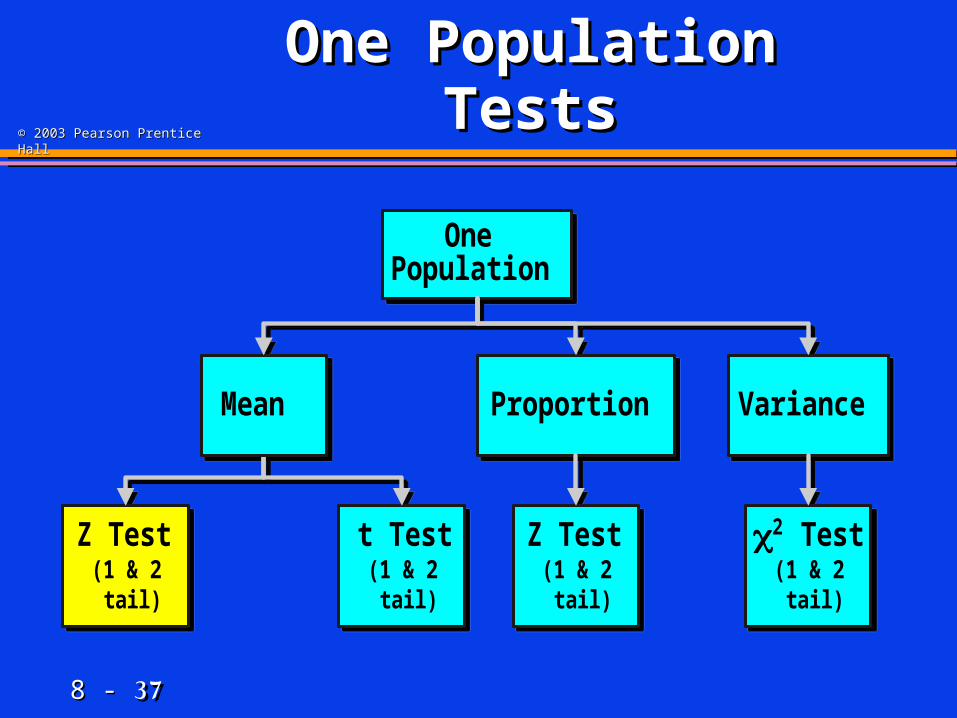
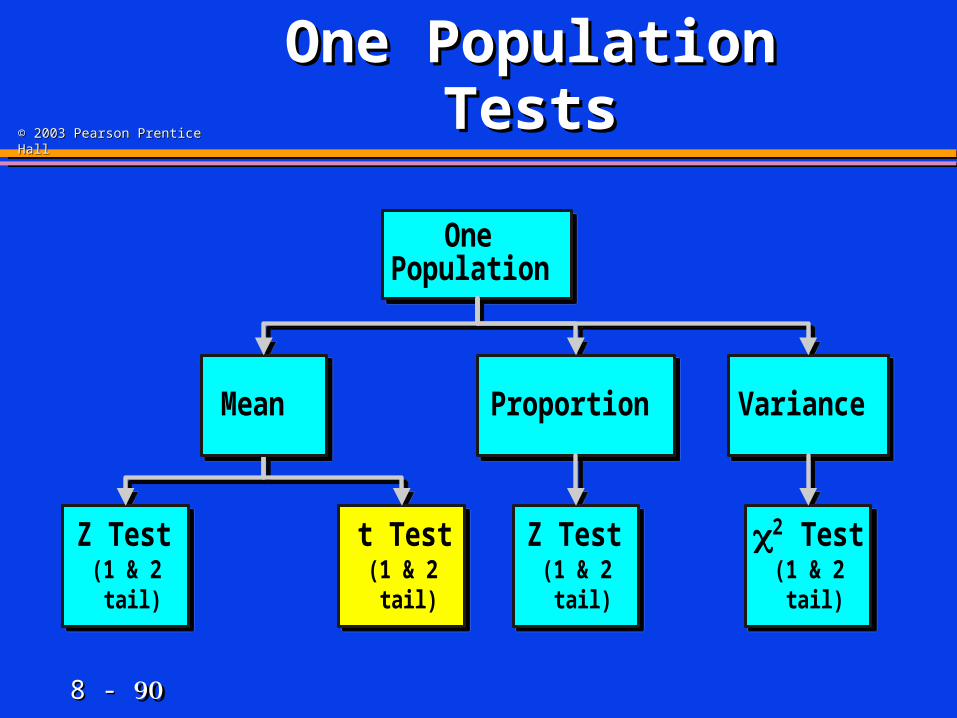
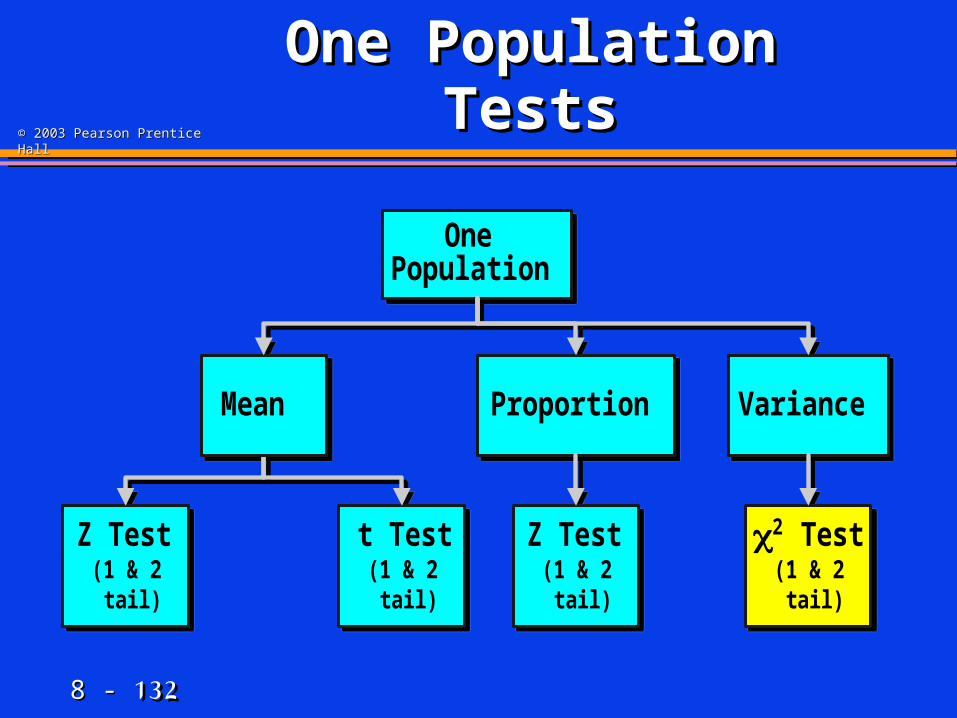
One Population One Population TestsTests
OnePopulation
Z Test(1 & 2tail)
t Test(1 & 2tail)
Z Test(1 & 2tail)
Mean Proportion Variance
2 Test(1 & 2tail)
OnePopulation
Z Test(1 & 2tail)
t Test(1 & 2tail)
Z Test(1 & 2tail)
Mean Proportion Variance
2 Test(1 & 2tail)
8 - 8 - 3636
© 2003 Pearson Prentice Hall© 2003 Pearson Prentice Hall
Two-Tailed Z Test Two-Tailed Z Test of Mean (of Mean ( Known) Known)
8 - 8 - 3737
© 2003 Pearson Prentice Hall© 2003 Pearson Prentice Hall
One Population One Population TestsTests
OnePopulation
Z Test(1 & 2tail)
t Test(1 & 2tail)
Z Test(1 & 2tail)
Mean Proportion Variance
2 Test(1 & 2tail)
OnePopulation
Z Test(1 & 2tail)
t Test(1 & 2tail)
Z Test(1 & 2tail)
Mean Proportion Variance
2 Test(1 & 2tail)
8 - 8 - 3838
© 2003 Pearson Prentice Hall© 2003 Pearson Prentice Hall
Two-Tailed Z Test Two-Tailed Z Test for Mean (for Mean ( Known) Known)
1.1. AssumptionsAssumptions Population Is Normally DistributedPopulation Is Normally Distributed If Not Normal, Can Be Approximated by If Not Normal, Can Be Approximated by
Normal Distribution (Normal Distribution (nn 30) 30)
2.2. Alternative Hypothesis Has Alternative Hypothesis Has Sign Sign
8 - 8 - 3939
© 2003 Pearson Prentice Hall© 2003 Pearson Prentice Hall
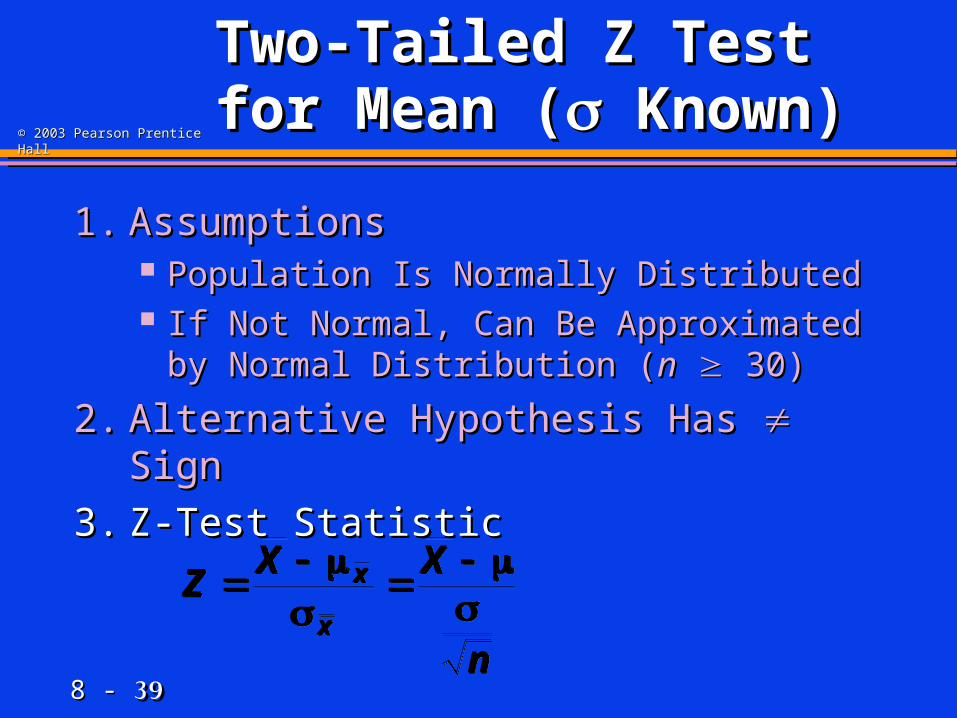
Two-Tailed Z Test Two-Tailed Z Test for Mean (for Mean ( Known) Known)
1.1. AssumptionsAssumptions Population Is Normally DistributedPopulation Is Normally Distributed If Not Normal, Can Be Approximated by If Not Normal, Can Be Approximated by
Normal Distribution (Normal Distribution (nn 30) 30)
2.2. Alternative Hypothesis Has Alternative Hypothesis Has Sign Sign
3.3. Z-Test StatisticZ-Test Statistic
ZX X
n
x
x
Z
X X
n
x
x
8 - 8 - 4040
© 2003 Pearson Prentice Hall© 2003 Pearson Prentice Hall
Two-Tailed Z TestTwo-Tailed Z Test Example Example
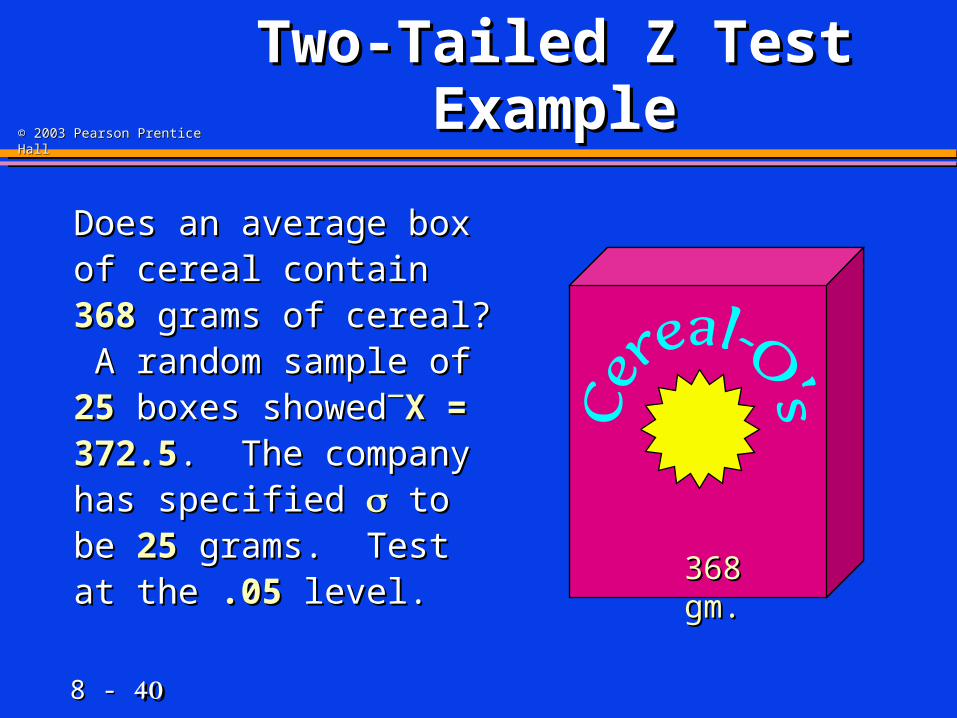
Does an average box of Does an average box of cereal contain cereal contain 368368 grams grams of cereal? A random of cereal? A random sample of sample of 2525 boxes boxes showedshowedX = 372.5X = 372.5. The . The company has specified company has specified to be to be 2525 grams. Test at grams. Test at the the .05.05 level. level. 368 gm.368 gm.
8 - 8 - 4141
© 2003 Pearson Prentice Hall© 2003 Pearson Prentice Hall
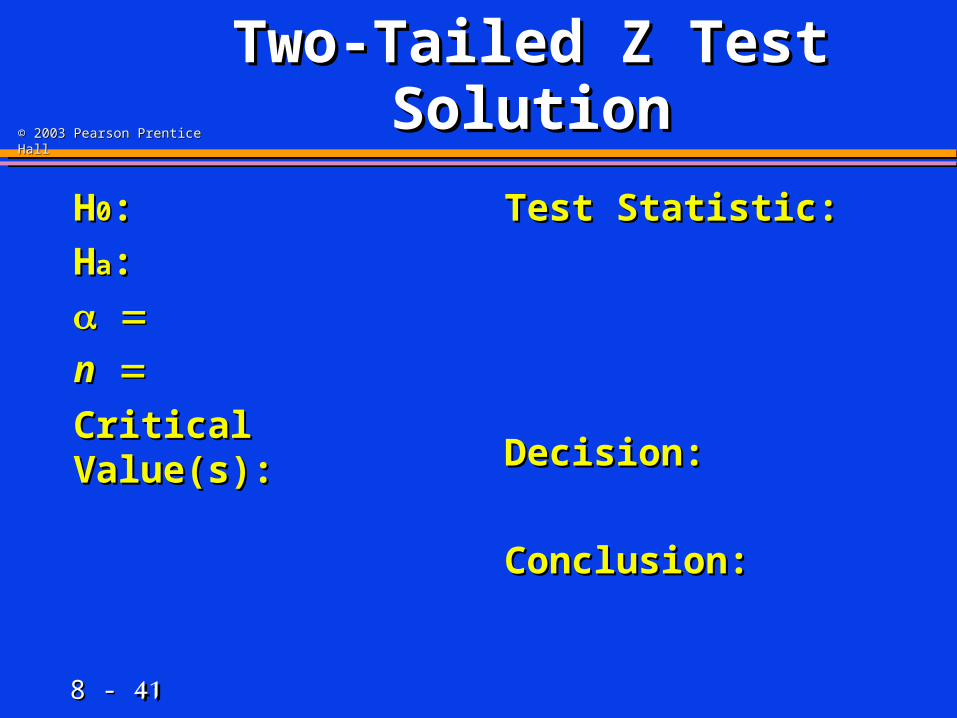
Two-Tailed Z Test Two-Tailed Z Test SolutionSolution
HH00: :
HHaa: :
nn
Critical Value(s):Critical Value(s):
Test Statistic: Test Statistic:
Decision:Decision:
Conclusion:Conclusion:

8 - 8 - 4242
© 2003 Pearson Prentice Hall© 2003 Pearson Prentice Hall
Two-Tailed Z Test Two-Tailed Z Test SolutionSolution
HH00: : = 368 = 368
HHaa: : 368 368
nn
Critical Value(s):Critical Value(s):
Test Statistic: Test Statistic:
Decision:Decision:
Conclusion:Conclusion:

8 - 8 - 4343
© 2003 Pearson Prentice Hall© 2003 Pearson Prentice Hall
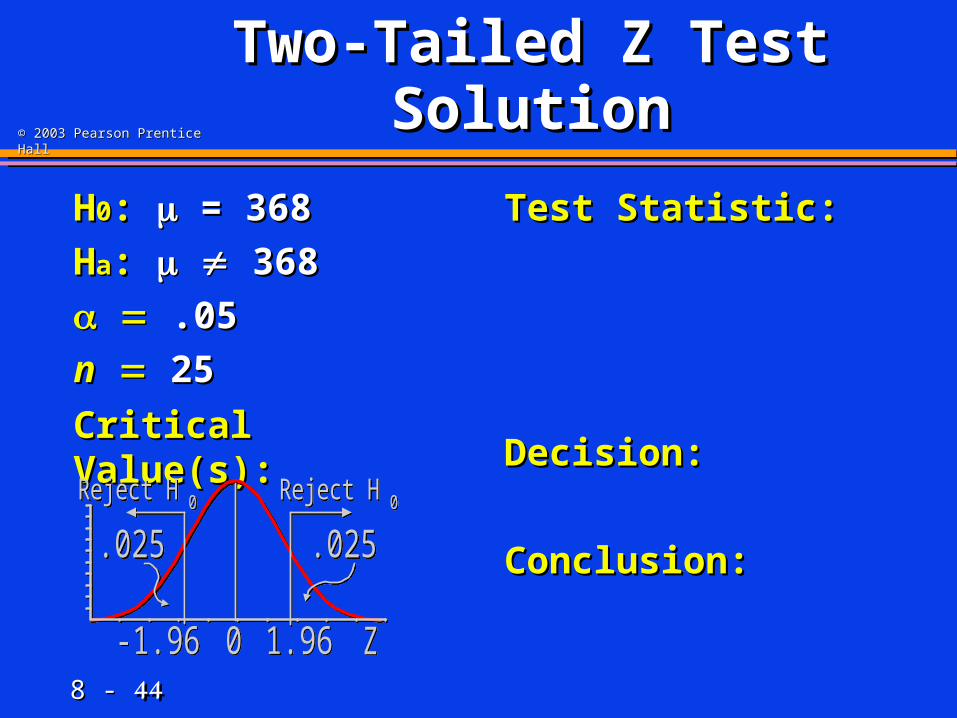
Two-Tailed Z Test Two-Tailed Z Test SolutionSolution
HH00: : = 368 = 368
HHaa: : 368 368
.05.05
nn 2525
Critical Value(s):Critical Value(s):
Test Statistic: Test Statistic:
Decision:Decision:
Conclusion:Conclusion:
8 - 8 - 4444
© 2003 Pearson Prentice Hall© 2003 Pearson Prentice Hall
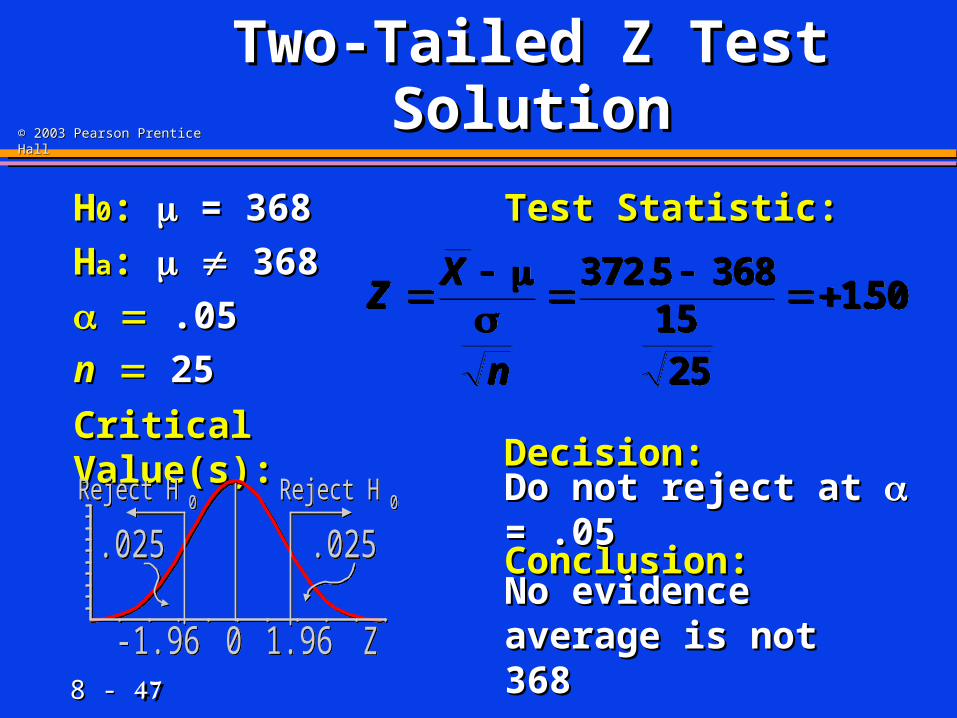
Two-Tailed Z Test Two-Tailed Z Test SolutionSolution
HH00: : = 368 = 368
HHaa: : 368 368
.05.05
nn 2525
Critical Value(s):Critical Value(s):
Test Statistic: Test Statistic:
Decision:Decision:
Conclusion:Conclusion:
Z0 1.96-1.96
.025
Reject H 0 Reject H 0
.025
Z0 1.96-1.96
.025
Reject H 0 Reject H 0
.025
8 - 8 - 4545
© 2003 Pearson Prentice Hall© 2003 Pearson Prentice Hall
Two-Tailed Z Test Two-Tailed Z Test SolutionSolution
HH00: : = 368 = 368
HHaa: : 368 368
.05.05
nn 2525
Critical Value(s):Critical Value(s):
Test Statistic: Test Statistic:
Decision:Decision:
Conclusion:Conclusion:
Z0 1.96-1.96
.025
Reject H 0 Reject H 0
.025
Z0 1.96-1.96
.025
Reject H 0 Reject H 0
.025
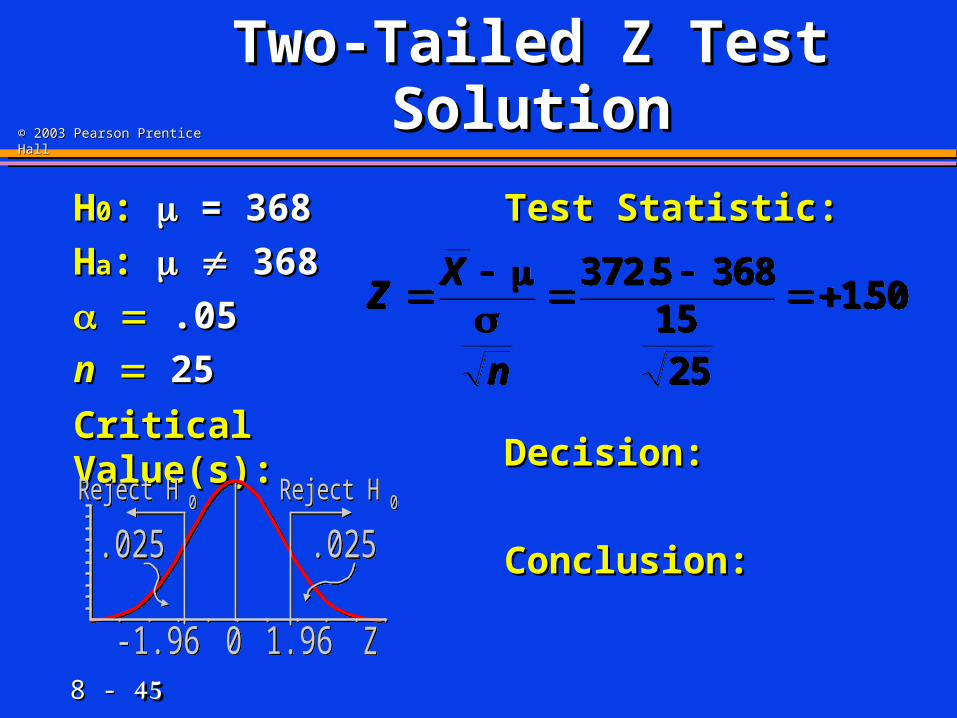
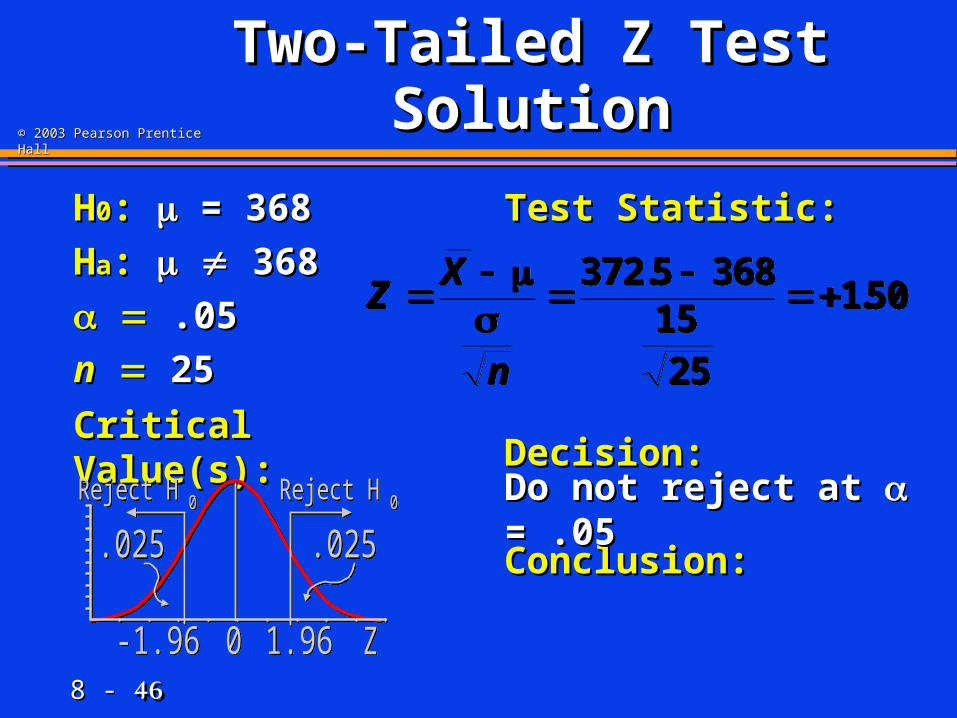
ZX
n
372 5 368
1525
150.
.ZX
n
372 5 368
1525
150.
.
8 - 8 - 4646
© 2003 Pearson Prentice Hall© 2003 Pearson Prentice Hall
Two-Tailed Z Test Two-Tailed Z Test SolutionSolution
HH00: : = 368 = 368
HHaa: : 368 368
.05.05
nn 2525
Critical Value(s):Critical Value(s):
Test Statistic: Test Statistic:
Decision:Decision:
Conclusion:Conclusion:
Z0 1.96-1.96
.025
Reject H 0 Reject H 0
.025
Z0 1.96-1.96
.025
Reject H 0 Reject H 0
.025
ZX
n
372 5 368
1525
150.
.ZX
n
372 5 368
1525
150.
.
Do not reject at Do not reject at = .05 = .05
8 - 8 - 4747
© 2003 Pearson Prentice Hall© 2003 Pearson Prentice Hall
Two-Tailed Z Test Two-Tailed Z Test SolutionSolution
HH00: : = 368 = 368
HHaa: : 368 368
.05.05
nn 2525
Critical Value(s):Critical Value(s):
Test Statistic: Test Statistic:
Decision:Decision:
Conclusion:Conclusion:
Z0 1.96-1.96
.025
Reject H 0 Reject H 0
.025
Z0 1.96-1.96
.025
Reject H 0 Reject H 0
.025
ZX
n
372 5 368
1525
150.
.ZX
n
372 5 368
1525
150.
.
Do not reject at Do not reject at = .05 = .05
No evidence No evidence average is not 368average is not 368

8 - 8 - 4848
© 2003 Pearson Prentice Hall© 2003 Pearson Prentice Hall
Two-Tailed Z Test Two-Tailed Z Test Thinking ChallengeThinking Challenge
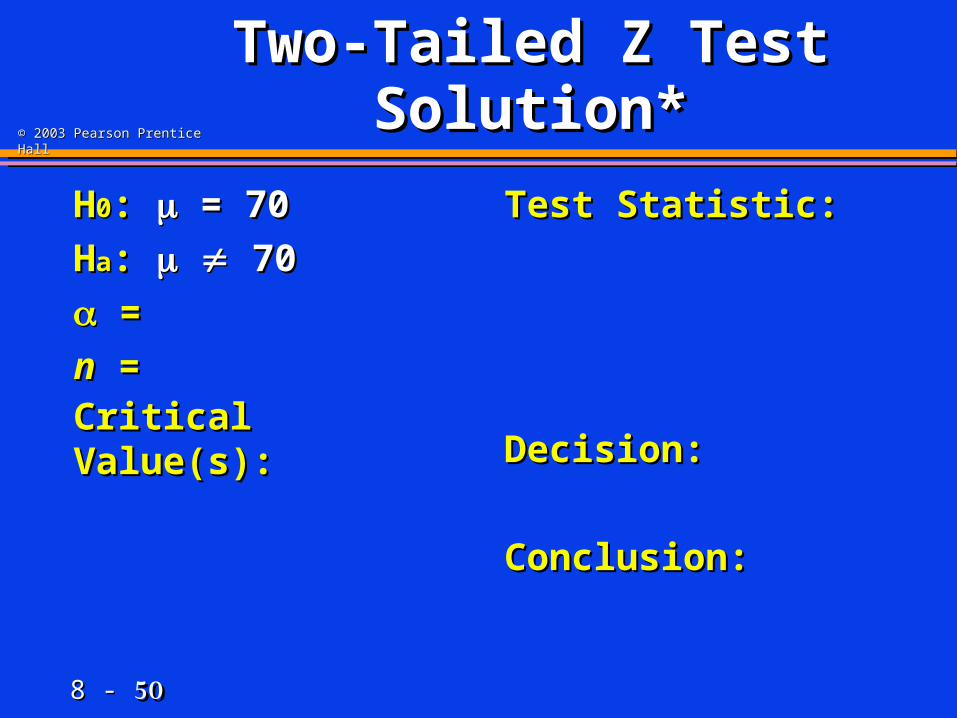
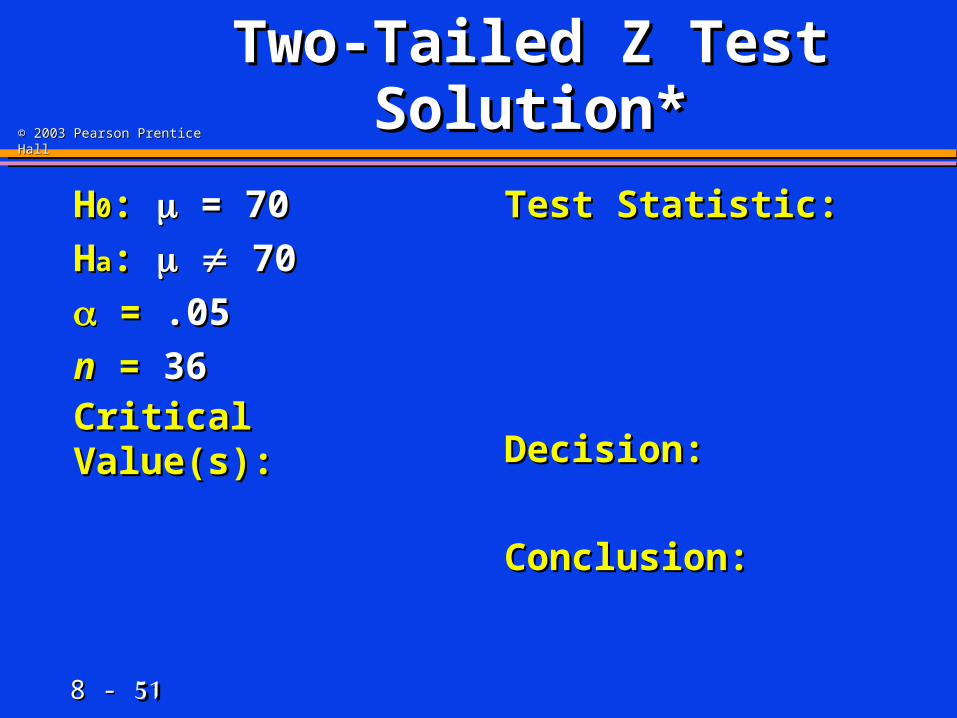
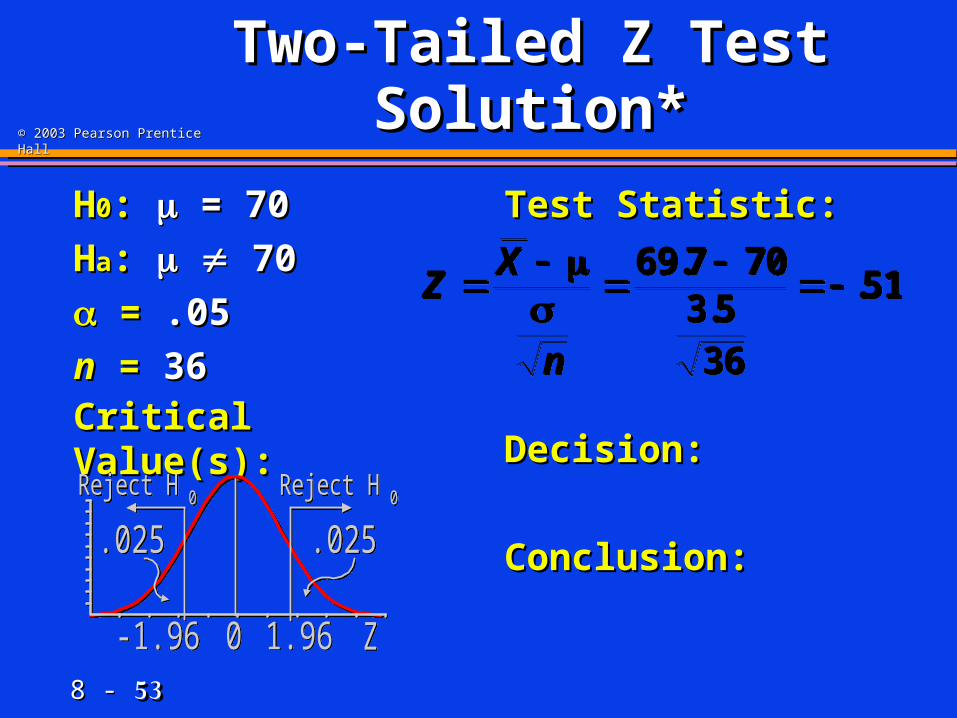
You’re a Q/C inspector. You want to You’re a Q/C inspector. You want to find out if a new machine is making find out if a new machine is making electrical cords to customer electrical cords to customer specification: specification: averageaverage breaking breaking strength of strength of 7070 lb. with lb. with = 3.5 = 3.5 lb. lb. You take a sample of You take a sample of 3636 cords & cords & compute a sample mean of compute a sample mean of 69.769.7 lb. lb. At the At the .05.05 level, is there evidence level, is there evidence that the machine is that the machine is notnot meeting the meeting the average breaking strength?average breaking strength?

8 - 8 - 4949
© 2003 Pearson Prentice Hall© 2003 Pearson Prentice Hall
Two-Tailed Z Test Two-Tailed Z Test Solution*Solution*
HH00: :
HHaa: :
= =
nn = =
Critical Value(s):Critical Value(s):
Test Statistic: Test Statistic:
Decision:Decision:
Conclusion:Conclusion:
8 - 8 - 5050
© 2003 Pearson Prentice Hall© 2003 Pearson Prentice Hall
Two-Tailed Z Test Two-Tailed Z Test Solution*Solution*
HH00: : = 70 = 70
HHaa: : 70 70
= =
nn = =
Critical Value(s):Critical Value(s):
Test Statistic: Test Statistic:
Decision:Decision:
Conclusion:Conclusion:
8 - 8 - 5151
© 2003 Pearson Prentice Hall© 2003 Pearson Prentice Hall
Two-Tailed Z Test Two-Tailed Z Test Solution*Solution*
HH00: : = 70 = 70
HHaa: : 70 70
= = .05.05
nn = = 3636
Critical Value(s):Critical Value(s):
Test Statistic: Test Statistic:
Decision:Decision:
Conclusion:Conclusion:
8 - 8 - 5252
© 2003 Pearson Prentice Hall© 2003 Pearson Prentice Hall
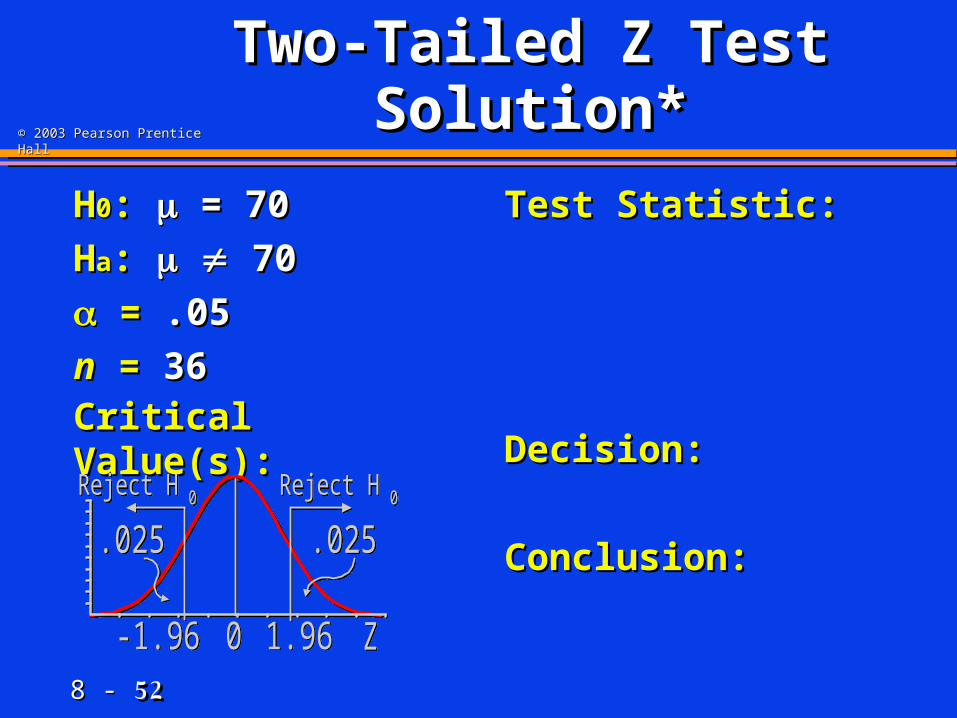
Two-Tailed Z Test Two-Tailed Z Test Solution*Solution*
HH00: : = 70 = 70
HHaa: : 70 70
= = .05.05
nn = = 3636
Critical Value(s):Critical Value(s):
Test Statistic: Test Statistic:
Decision:Decision:
Conclusion:Conclusion:
Z0 1.96-1.96
.025
Reject H 0 Reject H 0
.025
Z0 1.96-1.96
.025
Reject H 0 Reject H 0
.025
8 - 8 - 5353
© 2003 Pearson Prentice Hall© 2003 Pearson Prentice Hall
Two-Tailed Z Test Two-Tailed Z Test Solution*Solution*
HH00: : = 70 = 70
HHaa: : 70 70
= = .05.05
nn = = 3636
Critical Value(s):Critical Value(s):
Test Statistic: Test Statistic:
Decision:Decision:
Conclusion:Conclusion:
Z0 1.96-1.96
.025
Reject H 0 Reject H 0
.025
Z0 1.96-1.96
.025
Reject H 0 Reject H 0
.025
ZX
n
69 7 70
3 536
51.
..Z
X
n
69 7 70
3 536
51.
..
8 - 8 - 5454
© 2003 Pearson Prentice Hall© 2003 Pearson Prentice Hall
Two-Tailed Z Test Two-Tailed Z Test Solution*Solution*
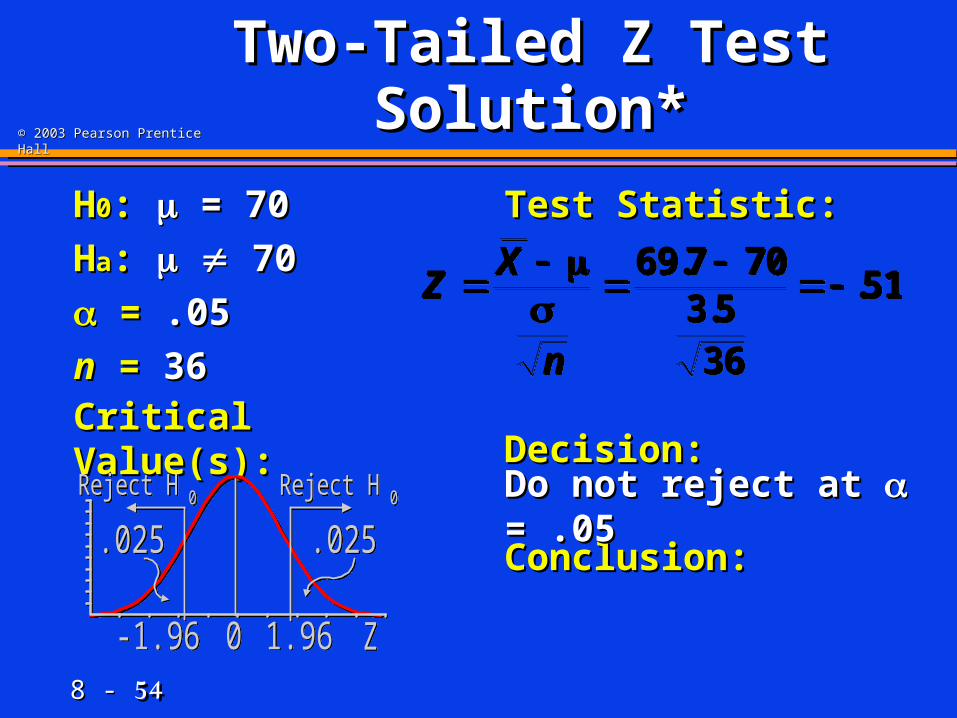
HH00: : = 70 = 70
HHaa: : 70 70
= = .05.05
nn = = 3636
Critical Value(s):Critical Value(s):
Test Statistic: Test Statistic:
Decision:Decision:
Conclusion:Conclusion:
Z0 1.96-1.96
.025
Reject H 0 Reject H 0
.025
Z0 1.96-1.96
.025
Reject H 0 Reject H 0
.025
ZX
n
69 7 70
3 536
51.
..Z
X
n
69 7 70
3 536
51.
..
Do not reject at Do not reject at = .05 = .05
8 - 8 - 5555
© 2003 Pearson Prentice Hall© 2003 Pearson Prentice Hall
Two-Tailed Z Test Two-Tailed Z Test Solution*Solution*
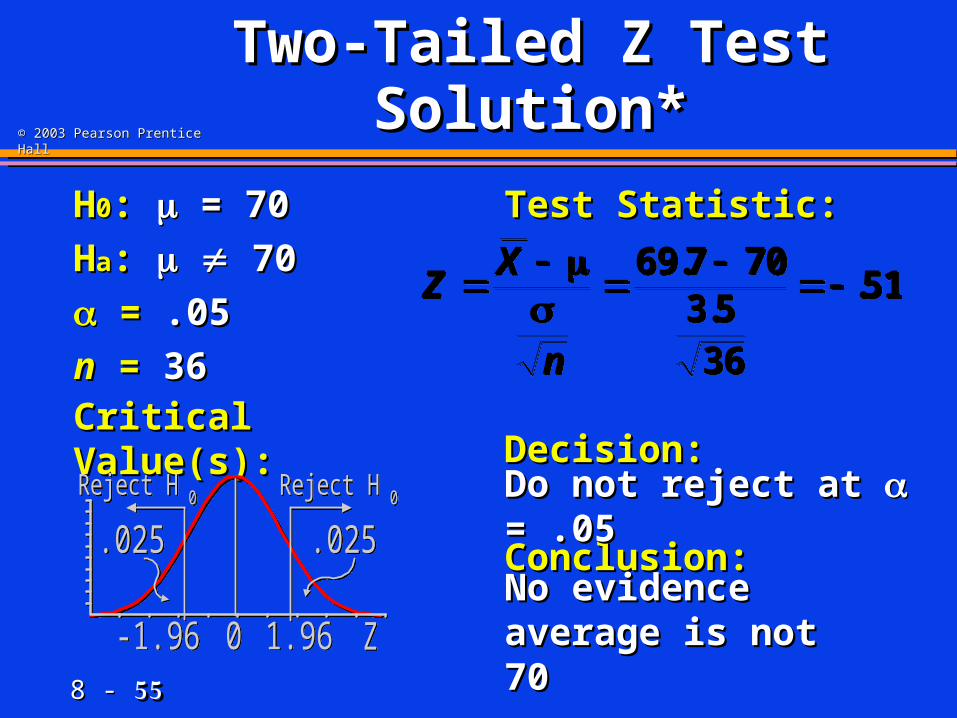
HH00: : = 70 = 70
HHaa: : 70 70
= = .05.05
nn = = 3636
Critical Value(s):Critical Value(s):
Test Statistic: Test Statistic:
Decision:Decision:
Conclusion:Conclusion:
Z0 1.96-1.96
.025
Reject H 0 Reject H 0
.025
Z0 1.96-1.96
.025
Reject H 0 Reject H 0
.025
ZX
n
69 7 70
3 536
51.
..Z
X
n
69 7 70
3 536
51.
..
Do not reject at Do not reject at = .05 = .05
No evidence No evidence average is not 70average is not 70
8 - 8 - 5656
© 2003 Pearson Prentice Hall© 2003 Pearson Prentice Hall
One-Tailed Z Test One-Tailed Z Test of Mean (of Mean ( Known) Known)
8 - 8 - 5757
© 2003 Pearson Prentice Hall© 2003 Pearson Prentice Hall
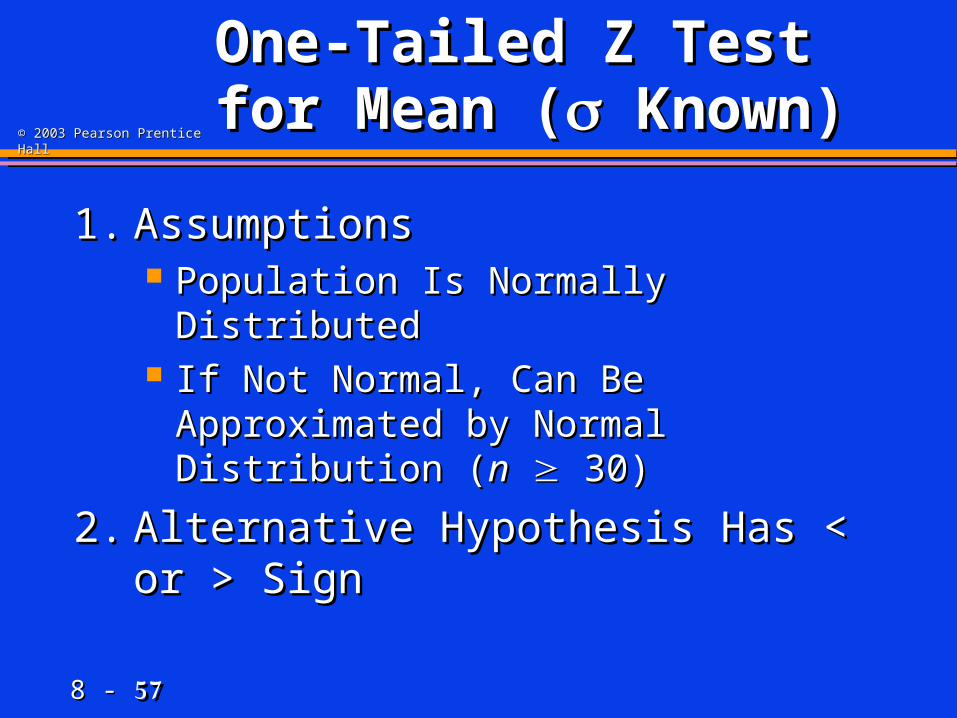
One-Tailed Z Test One-Tailed Z Test for Mean (for Mean ( Known) Known)
1.1. AssumptionsAssumptions Population Is Normally DistributedPopulation Is Normally Distributed If Not Normal, Can Be Approximated by If Not Normal, Can Be Approximated by
Normal Distribution (Normal Distribution (nn 30) 30)
2.2. Alternative Hypothesis Has < or > SignAlternative Hypothesis Has < or > Sign
8 - 8 - 5858
© 2003 Pearson Prentice Hall© 2003 Pearson Prentice Hall
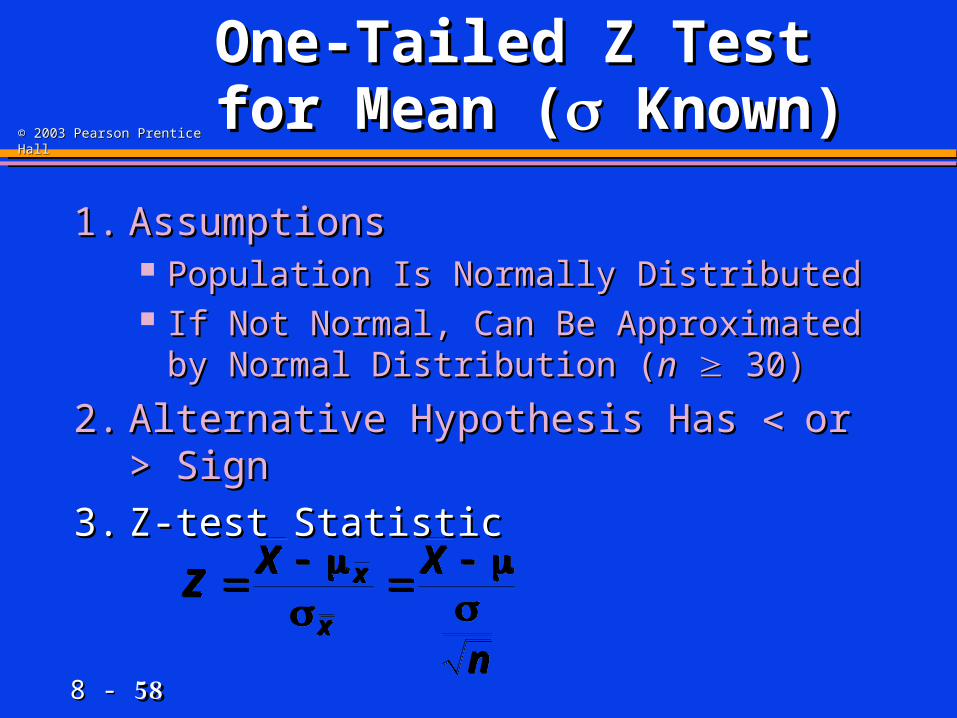
One-Tailed Z Test One-Tailed Z Test for Mean (for Mean ( Known) Known)
1.1. AssumptionsAssumptions Population Is Normally DistributedPopulation Is Normally Distributed If Not Normal, Can Be Approximated by If Not Normal, Can Be Approximated by
Normal Distribution (Normal Distribution (nn 30) 30)
2.2. Alternative Hypothesis Has Alternative Hypothesis Has or > Signor > Sign
3.3. Z-test StatisticZ-test Statistic
ZX X
n
x
x
Z
X X
n
x
x
8 - 8 - 5959
© 2003 Pearson Prentice Hall© 2003 Pearson Prentice Hall
One-Tailed Z Test One-Tailed Z Test for Mean Hypothesesfor Mean Hypotheses
8 - 8 - 6060
© 2003 Pearson Prentice Hall© 2003 Pearson Prentice Hall
Z0
Reject H 0
Z0
Reject H 0
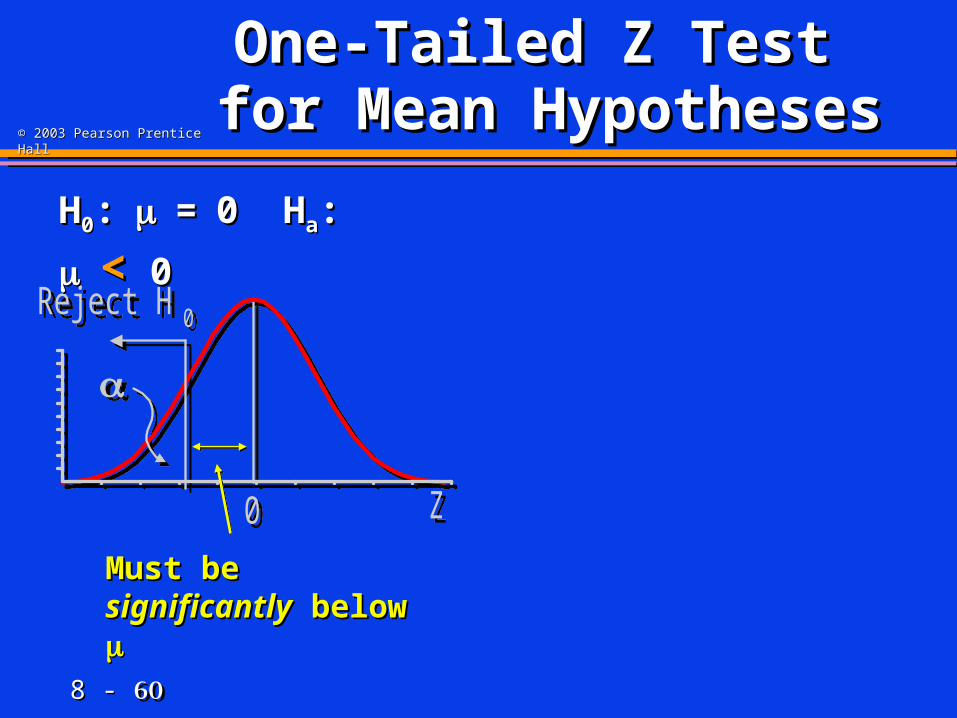
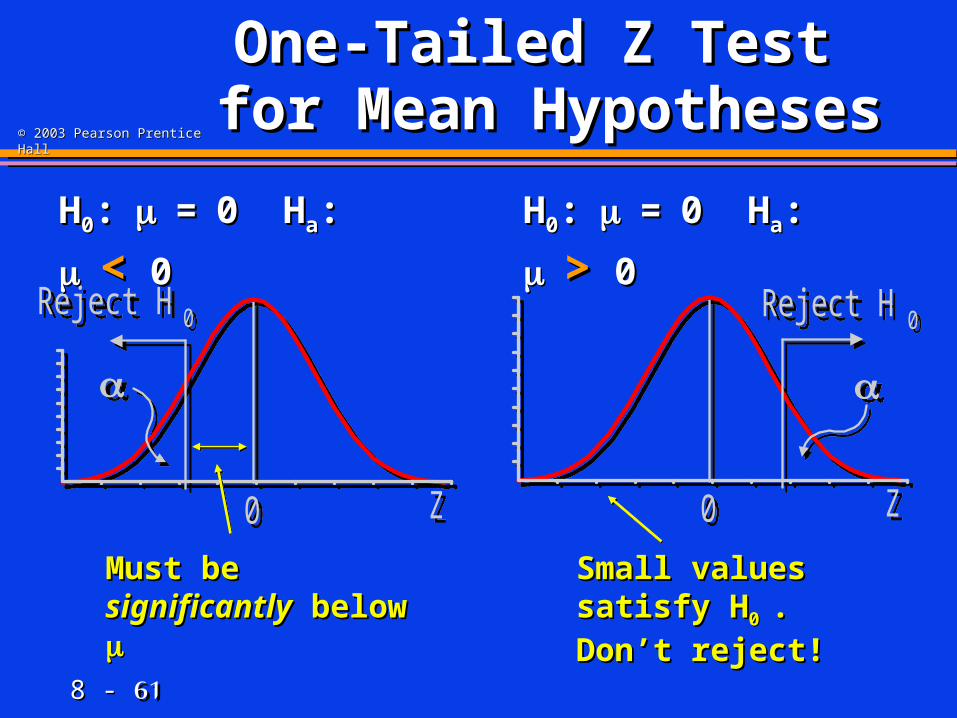
One-Tailed Z Test One-Tailed Z Test for Mean Hypothesesfor Mean Hypotheses
HH00::==0 H0 Haa: : << 0 0
Must be Must be significantlysignificantly below below
8 - 8 - 6161
© 2003 Pearson Prentice Hall© 2003 Pearson Prentice Hall
Z0
Reject H 0
Z0
Reject H 0
Z0
Reject H 0
Z0
Reject H 0
One-Tailed Z Test One-Tailed Z Test for Mean Hypothesesfor Mean Hypotheses
HH00::==0 H0 Haa: : << 0 0 HH00::==0 H0 Haa: : >> 0 0
Must be Must be significantlysignificantly below below
Small values satisfy Small values satisfy HH0 0 . Don’t reject!. Don’t reject!
8 - 8 - 6262
© 2003 Pearson Prentice Hall© 2003 Pearson Prentice Hall
One-Tailed Z Test One-Tailed Z Test Finding Critical ZFinding Critical Z
8 - 8 - 6363
© 2003 Pearson Prentice Hall© 2003 Pearson Prentice Hall
Z0
= 1
Z0
= 1
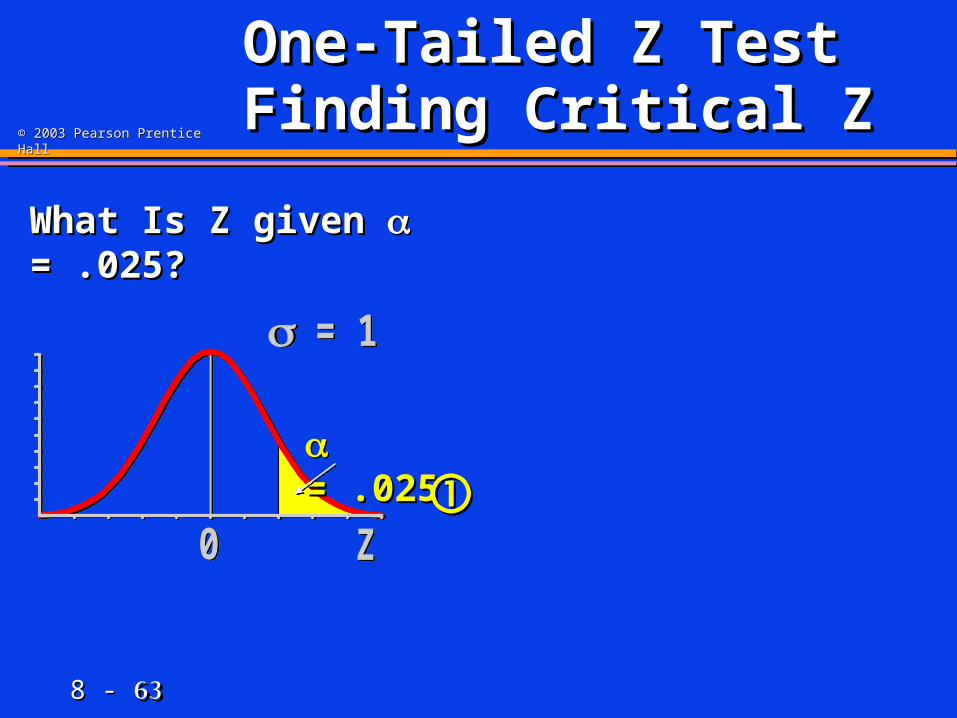
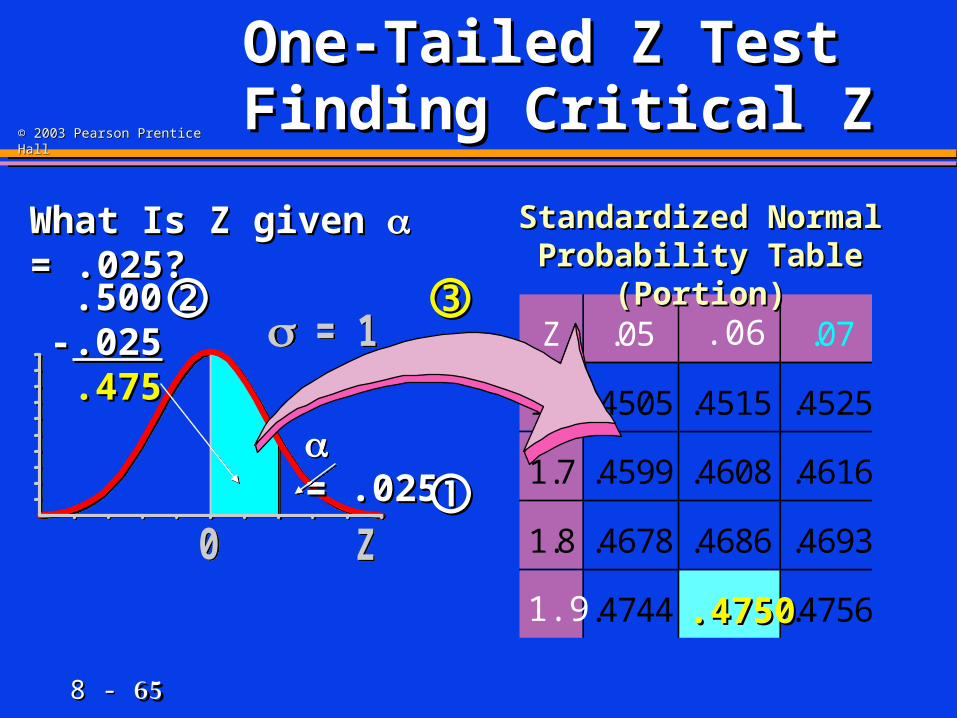
One-Tailed Z Test One-Tailed Z Test Finding Critical ZFinding Critical Z
What Is Z given What Is Z given = .025? = .025?
= .025= .025
8 - 8 - 6464
© 2003 Pearson Prentice Hall© 2003 Pearson Prentice Hall
Z0
= 1
Z0
= 1
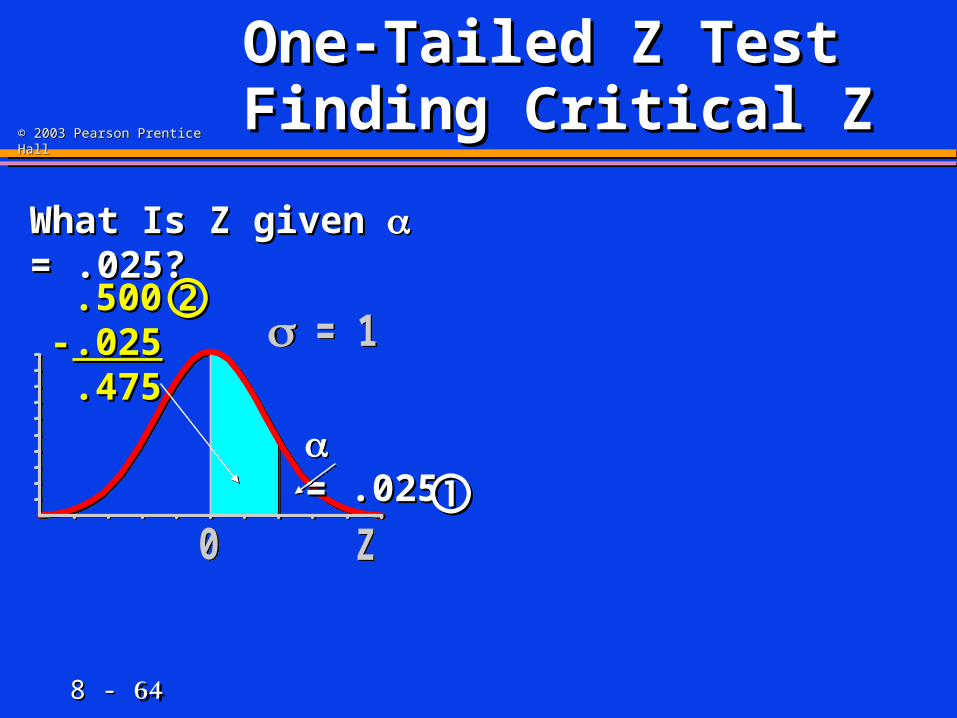
One-Tailed Z Test One-Tailed Z Test Finding Critical ZFinding Critical Z
.500 .500 -- .025.025
.475.475
What Is Z given What Is Z given = .025? = .025?
= .025= .025
8 - 8 - 6565
© 2003 Pearson Prentice Hall© 2003 Pearson Prentice Hall
Z .05 .07
1.6 .4505 .4515 .4525
1.7 .4599 .4608 .4616
1.8 .4678 .4686 .4693
.4744 .4756
Z0
= 1
Z0
= 1
One-Tailed Z Test One-Tailed Z Test Finding Critical ZFinding Critical Z
.500 .500 -- .025.025
.475.475
.06
1.9 .4750.4750
Standardized Normal Standardized Normal Probability Table (Portion)Probability Table (Portion)
What Is Z given What Is Z given = .025? = .025?
= .025= .025
8 - 8 - 6666
© 2003 Pearson Prentice Hall© 2003 Pearson Prentice Hall
Z .05 .07
1.6 .4505 .4515 .4525
1.7 .4599 .4608 .4616
1.8 .4678 .4686 .4693
.4744 .4756
Z0
= 1
1.96 Z0
= 1
1.96
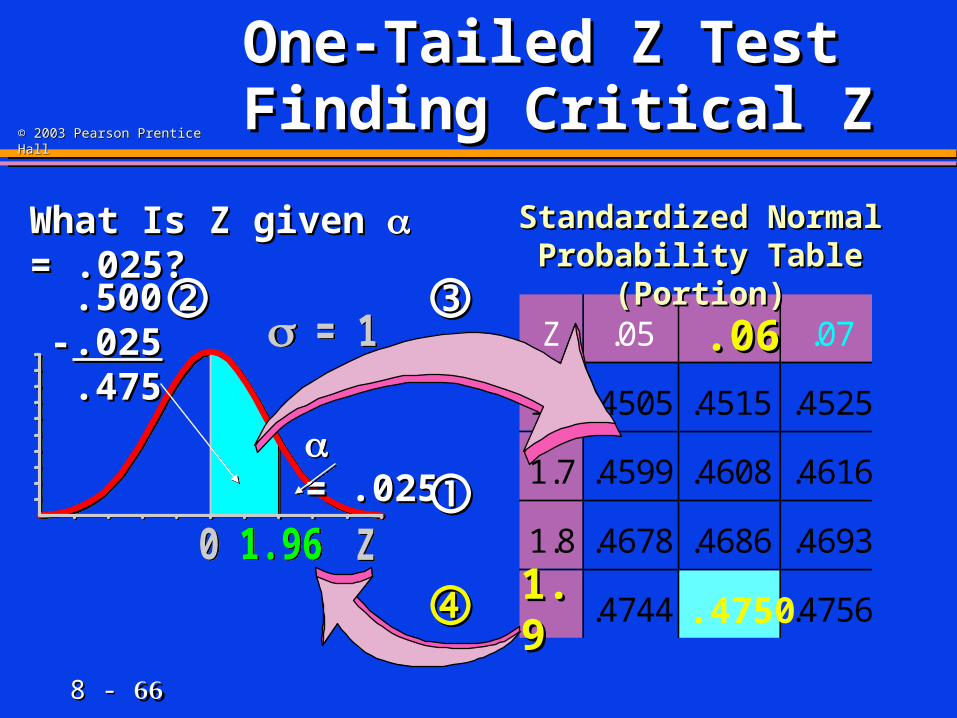
One-Tailed Z Test One-Tailed Z Test Finding Critical ZFinding Critical Z
.500 .500 -- .025.025
.475.475.06.06
1.91.9 .4750
Standardized Normal Standardized Normal Probability Table (Portion)Probability Table (Portion)
What Is Z given What Is Z given = .025? = .025?
= .025= .025
8 - 8 - 6767
© 2003 Pearson Prentice Hall© 2003 Pearson Prentice Hall
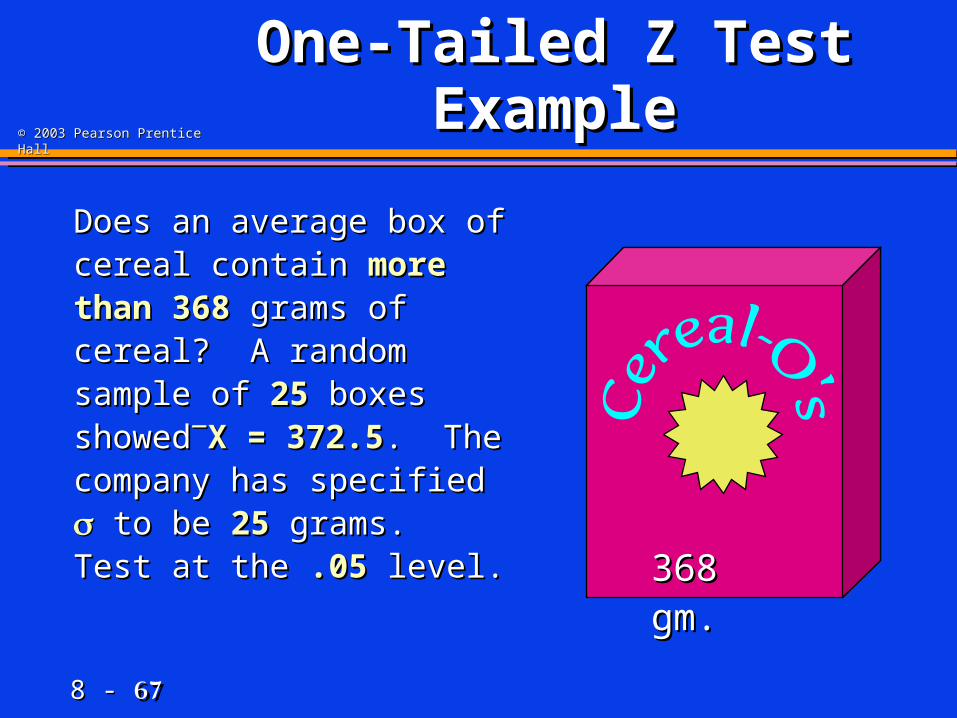
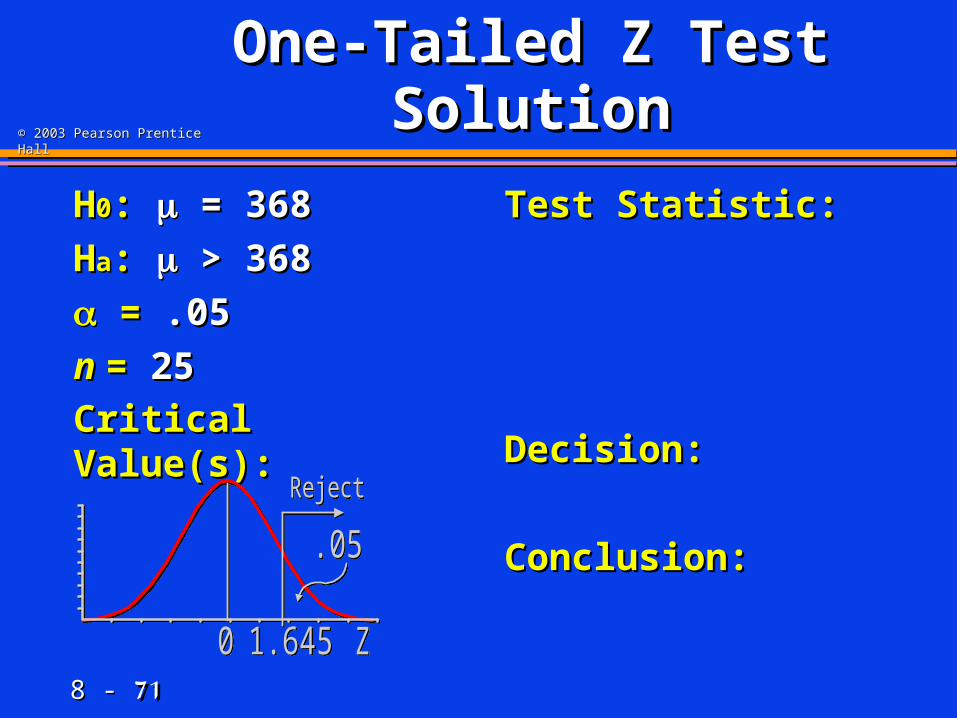
One-Tailed Z TestOne-Tailed Z Test Example Example
Does an average box of Does an average box of cereal contain cereal contain more thanmore than 368368 grams of cereal? A grams of cereal? A random sample of random sample of 2525 boxes showedboxes showedX = 372.5X = 372.5. . The company has The company has specified specified to be to be 2525 grams. Test at the grams. Test at the .05.05 level.level.
368 gm.368 gm.

8 - 8 - 6868
© 2003 Pearson Prentice Hall© 2003 Pearson Prentice Hall
One-Tailed Z Test One-Tailed Z Test SolutionSolution
HH00: :
HHaa: :
= =
n n = =
Critical Value(s):Critical Value(s):
Test Statistic: Test Statistic:
Decision:Decision:
Conclusion:Conclusion:

8 - 8 - 6969
© 2003 Pearson Prentice Hall© 2003 Pearson Prentice Hall
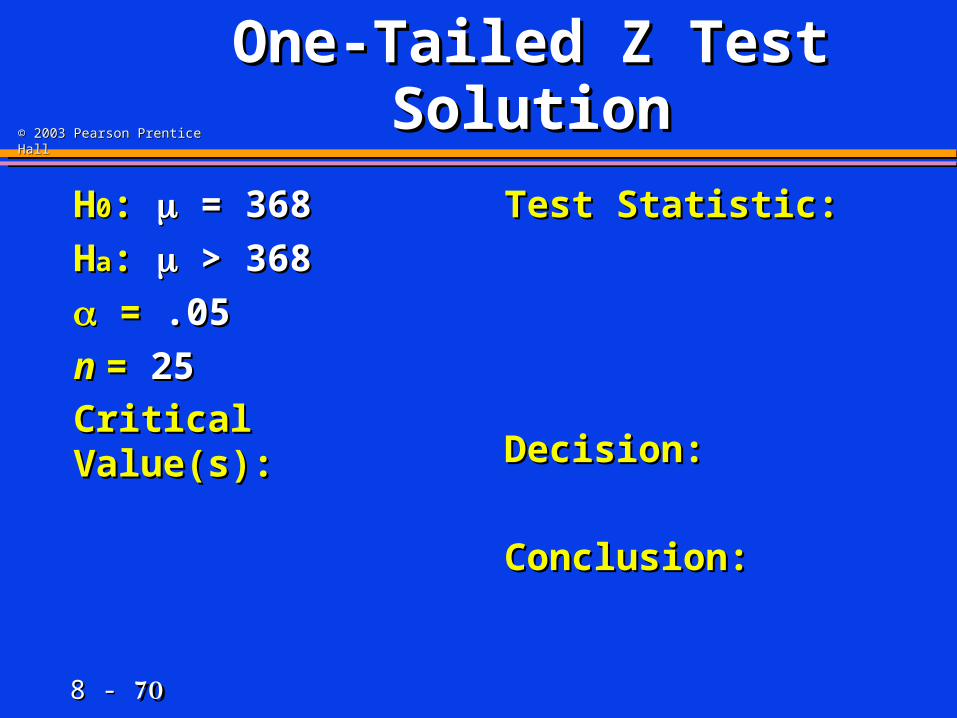
One-Tailed Z Test One-Tailed Z Test SolutionSolution
HH00: : = 368 = 368
HHaa: : > 368 > 368
= =
n n = =
Critical Value(s):Critical Value(s):
Test Statistic: Test Statistic:
Decision:Decision:
Conclusion:Conclusion:
8 - 8 - 7070
© 2003 Pearson Prentice Hall© 2003 Pearson Prentice Hall
One-Tailed Z Test One-Tailed Z Test SolutionSolution
HH00: : = 368 = 368
HHaa: : > 368 > 368
= = .05.05
n n = = 2525
Critical Value(s):Critical Value(s):
Test Statistic: Test Statistic:
Decision:Decision:
Conclusion:Conclusion:
8 - 8 - 7171
© 2003 Pearson Prentice Hall© 2003 Pearson Prentice Hall
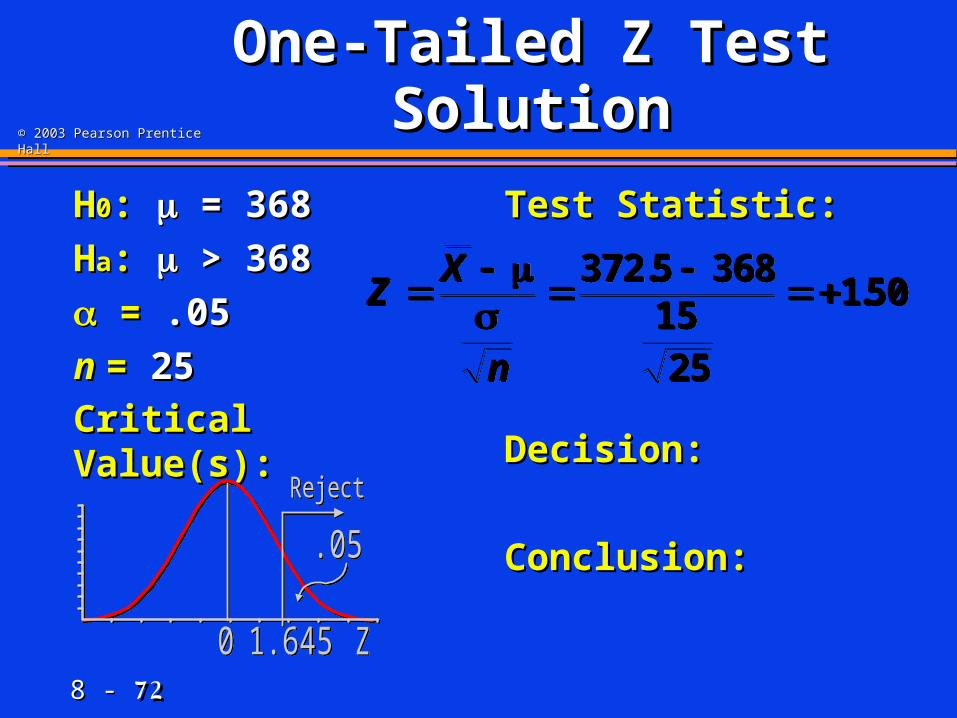
One-Tailed Z Test One-Tailed Z Test SolutionSolution
HH00: : = 368 = 368
HHaa: : > 368 > 368
= = .05.05
n n = = 2525
Critical Value(s):Critical Value(s):
Test Statistic: Test Statistic:
Decision:Decision:
Conclusion:Conclusion:
Z0 1.645
.05
Reject
Z0 1.645
.05
Reject
8 - 8 - 7272
© 2003 Pearson Prentice Hall© 2003 Pearson Prentice Hall
One-Tailed Z Test One-Tailed Z Test SolutionSolution
HH00: : = 368 = 368
HHaa: : > 368 > 368
= = .05.05
n n = = 2525
Critical Value(s):Critical Value(s):
Test Statistic: Test Statistic:
Decision:Decision:
Conclusion:Conclusion:
Z0 1.645
.05
Reject
Z0 1.645
.05
Reject
ZX
n
372 5 368
1525
150.
.ZX
n
372 5 368
1525
150.
.
8 - 8 - 7373
© 2003 Pearson Prentice Hall© 2003 Pearson Prentice Hall
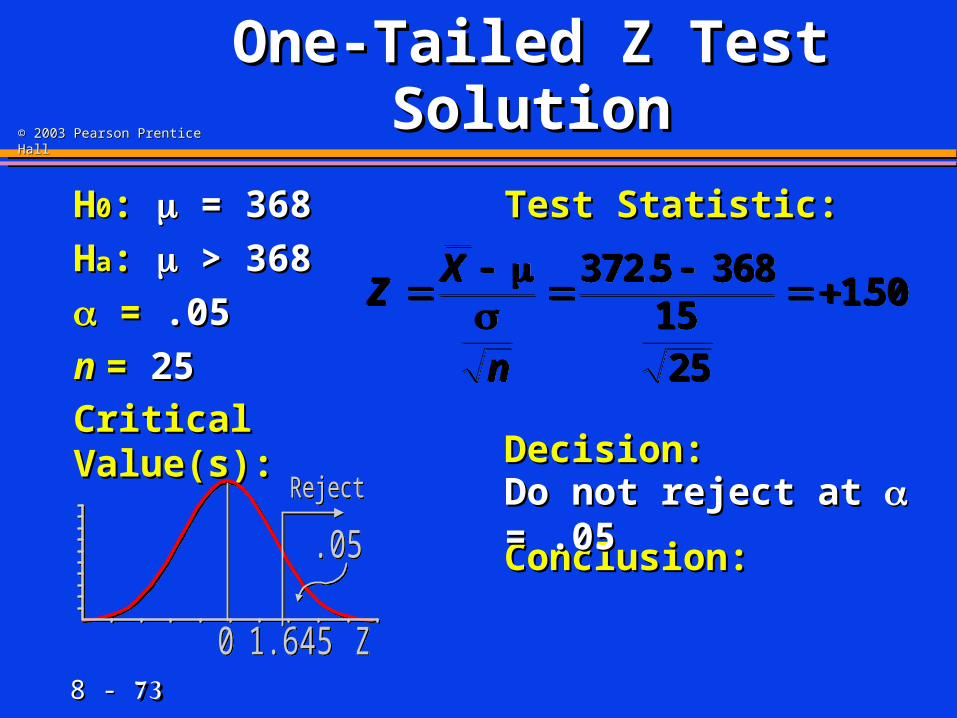
One-Tailed Z Test One-Tailed Z Test SolutionSolution
HH00: : = 368 = 368
HHaa: : > 368 > 368
= = .05.05
n n = = 2525
Critical Value(s):Critical Value(s):
Test Statistic: Test Statistic:
Decision:Decision:
Conclusion:Conclusion:
Z0 1.645
.05
Reject
Z0 1.645
.05
Reject
ZX
n
372 5 368
1525
150.
.ZX
n
372 5 368
1525
150.
.
Do not reject at Do not reject at = .05 = .05
8 - 8 - 7474
© 2003 Pearson Prentice Hall© 2003 Pearson Prentice Hall
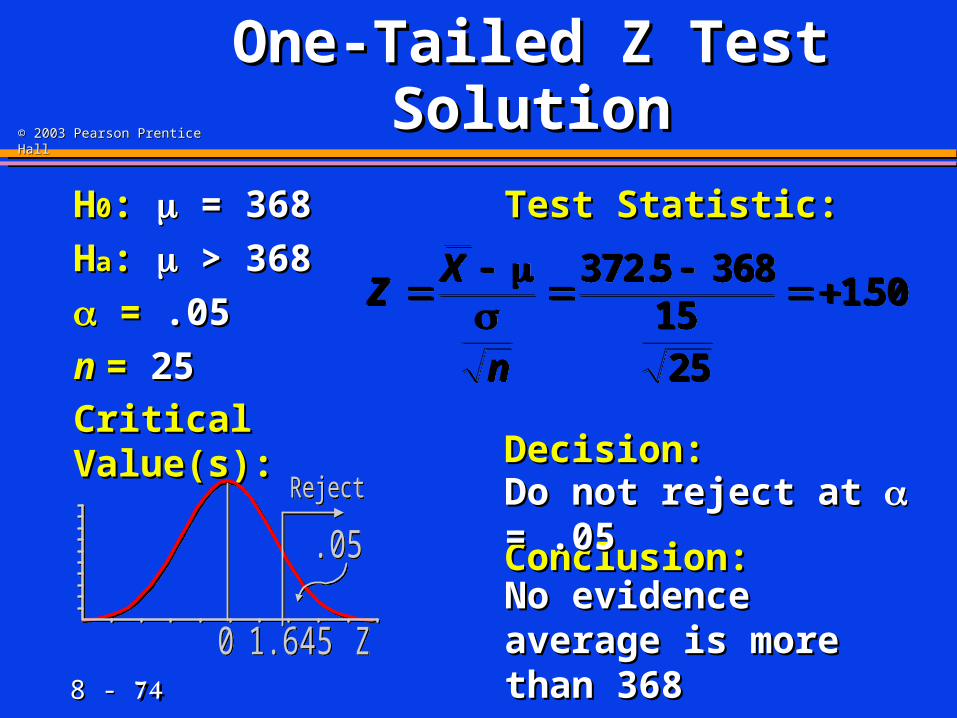
One-Tailed Z Test One-Tailed Z Test SolutionSolution
HH00: : = 368 = 368
HHaa: : > 368 > 368
= = .05.05
n n = = 2525
Critical Value(s):Critical Value(s):
Test Statistic: Test Statistic:
Decision:Decision:
Conclusion:Conclusion:
Z0 1.645
.05
Reject
Z0 1.645
.05
Reject
ZX
n
372 5 368
1525
150.
.ZX
n
372 5 368
1525
150.
.
Do not reject at Do not reject at = .05 = .05
No evidence average No evidence average is more than 368is more than 368
8 - 8 - 7575
© 2003 Pearson Prentice Hall© 2003 Pearson Prentice Hall
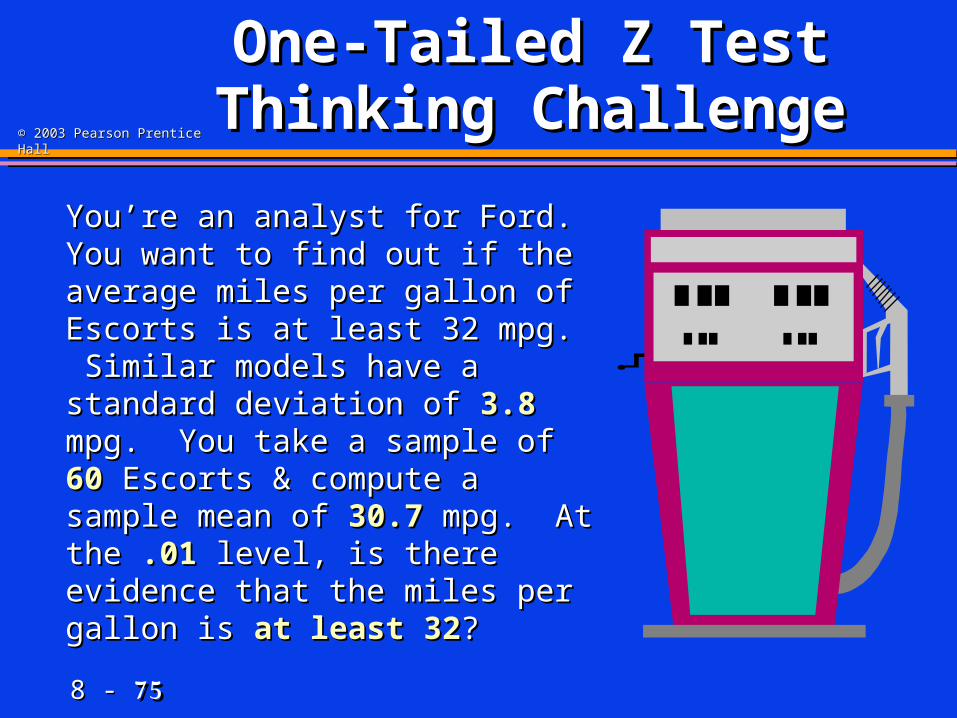
One-Tailed Z Test One-Tailed Z Test Thinking ChallengeThinking Challenge
You’re an analyst for Ford. You You’re an analyst for Ford. You want to find out if the average want to find out if the average miles per gallon of Escorts is at miles per gallon of Escorts is at least 32 mpg. Similar models least 32 mpg. Similar models have a standard deviation of have a standard deviation of 3.83.8 mpg. You take a sample of mpg. You take a sample of 6060 Escorts & compute a sample Escorts & compute a sample mean of mean of 30.730.7 mpg. At the mpg. At the .01.01 level, is there evidence that the level, is there evidence that the miles per gallon is miles per gallon is at leastat least 3232??
8 - 8 - 7676
© 2003 Pearson Prentice Hall© 2003 Pearson Prentice Hall
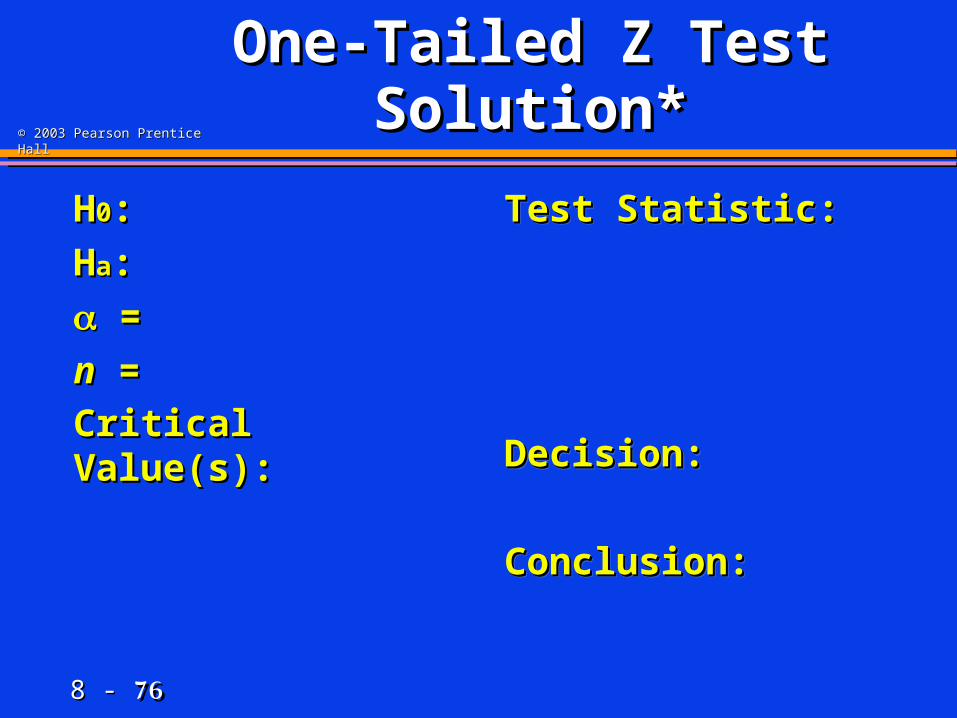
One-Tailed Z Test One-Tailed Z Test Solution*Solution*
HH00: :
HHaa: :
= =
nn = =
Critical Value(s):Critical Value(s):
Test Statistic: Test Statistic:
Decision:Decision:
Conclusion:Conclusion:
Test Statistic: Test Statistic:
Decision:Decision:
Conclusion:Conclusion:
8 - 8 - 7777
© 2003 Pearson Prentice Hall© 2003 Pearson Prentice Hall
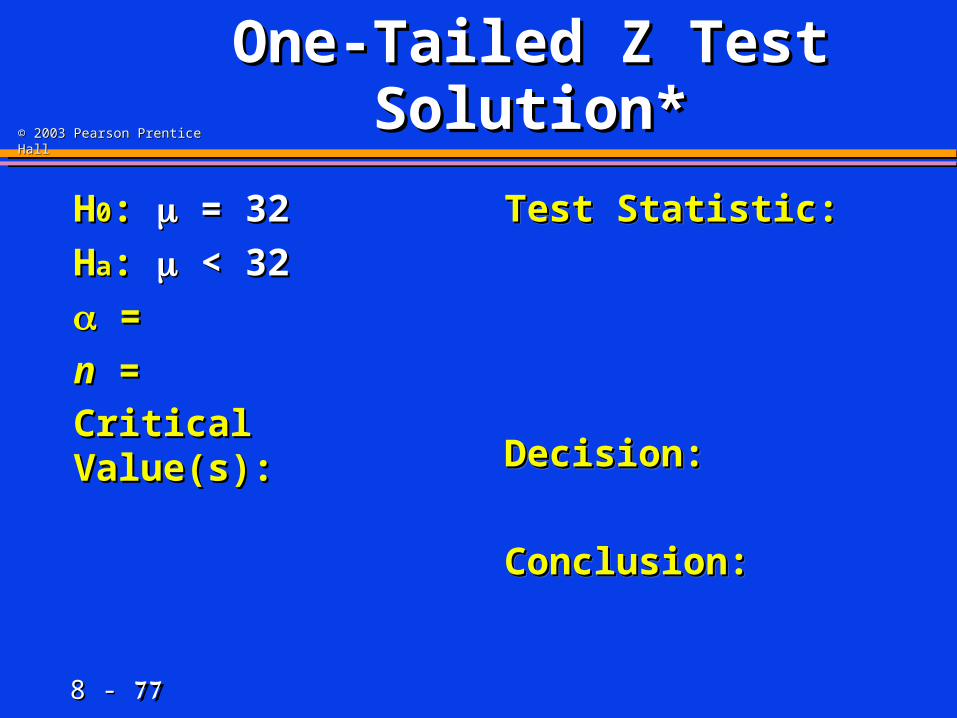
One-Tailed Z Test One-Tailed Z Test Solution*Solution*
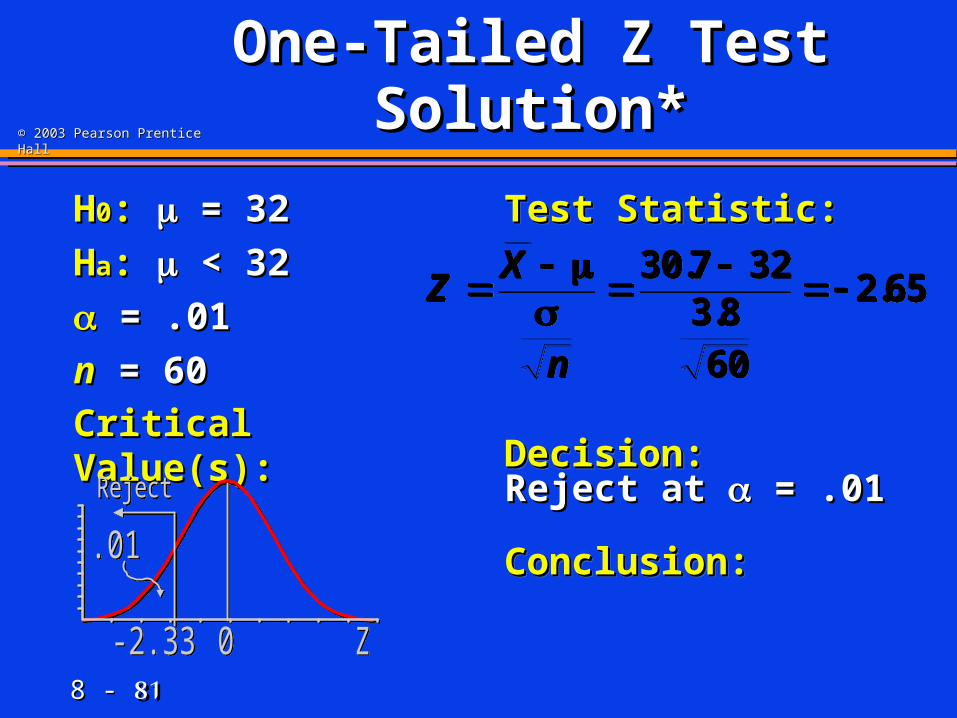
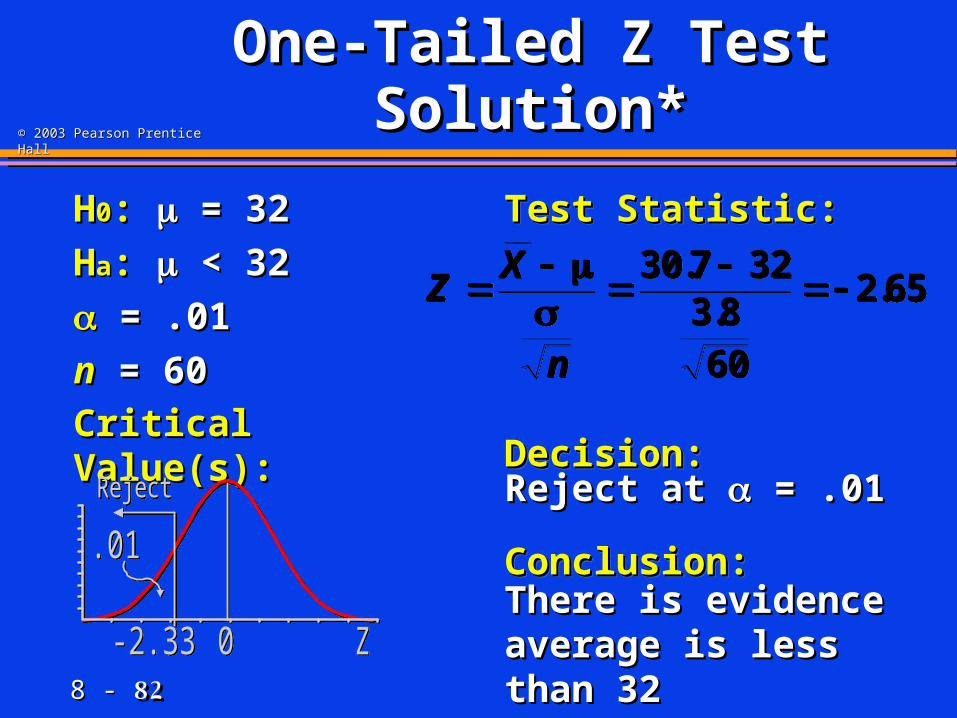
HH00: : = 32 = 32
HHaa: : < 32 < 32
= =
nn = =
Critical Value(s):Critical Value(s):
Test Statistic: Test Statistic:
Decision:Decision:
Conclusion:Conclusion:
Test Statistic: Test Statistic:
Decision:Decision:
Conclusion:Conclusion:
8 - 8 - 7878
© 2003 Pearson Prentice Hall© 2003 Pearson Prentice Hall
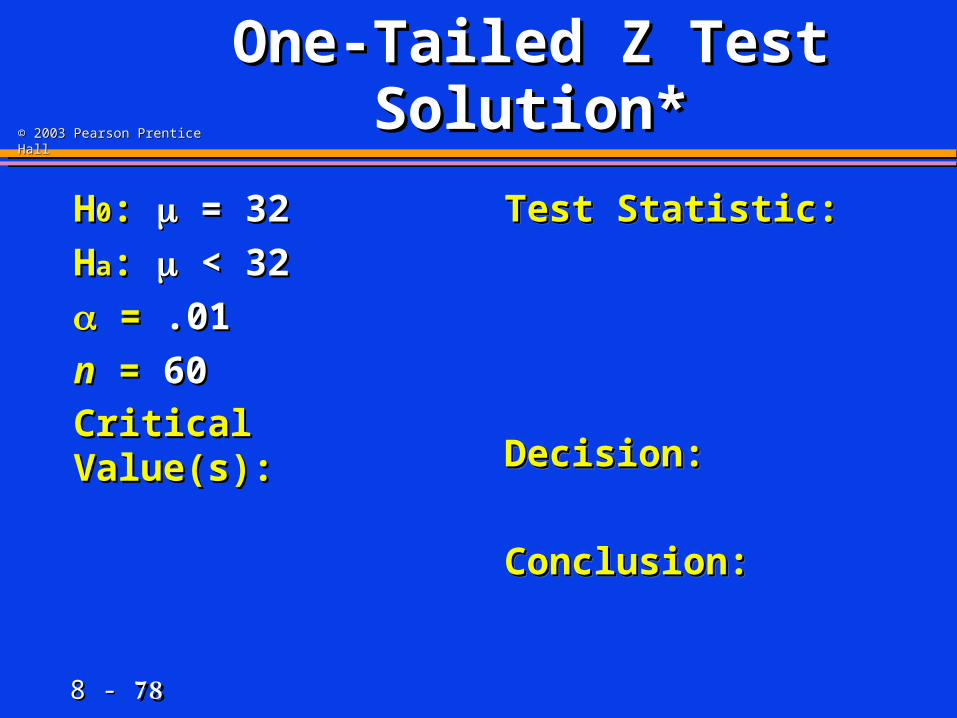
One-Tailed Z Test One-Tailed Z Test Solution*Solution*
HH00: : = 32 = 32
HHaa: : < 32 < 32
== .01 .01
nn = = 6060
Critical Value(s):Critical Value(s):
Test Statistic: Test Statistic:
Decision:Decision:
Conclusion:Conclusion:
Test Statistic: Test Statistic:
Decision:Decision:
Conclusion:Conclusion:

8 - 8 - 7979
© 2003 Pearson Prentice Hall© 2003 Pearson Prentice Hall
One-Tailed Z Test One-Tailed Z Test Solution*Solution*
HH00: : = 32 = 32
HHaa: : < 32 < 32
= .01= .01
nn = 60= 60
Critical Value(s):Critical Value(s):
Test Statistic: Test Statistic:
Decision:Decision:
Conclusion:Conclusion:
Test Statistic: Test Statistic:
Decision:Decision:
Conclusion:Conclusion:
Z0-2.33
.01
Reject
Z0-2.33
.01
Reject

8 - 8 - 8080
© 2003 Pearson Prentice Hall© 2003 Pearson Prentice Hall
One-Tailed Z Test One-Tailed Z Test Solution*Solution*
HH00: : = 32 = 32
HHaa: : < 32 < 32
= .01= .01
nn = 60= 60
Critical Value(s):Critical Value(s):
Test Statistic: Test Statistic:
Decision:Decision:
Conclusion:Conclusion:
Test Statistic: Test Statistic:
Decision:Decision:
Conclusion:Conclusion:
Z0-2.33
.01
Reject
Z0-2.33
.01
Reject
ZX
n
30 7 32
3 860
2 65.
..Z
X
n
30 7 32
3 860
2 65.
..
8 - 8 - 8181
© 2003 Pearson Prentice Hall© 2003 Pearson Prentice Hall
One-Tailed Z Test One-Tailed Z Test Solution*Solution*
HH00: : = 32 = 32
HHaa: : < 32 < 32
= .01= .01
nn = 60= 60
Critical Value(s):Critical Value(s):
Test Statistic: Test Statistic:
Decision:Decision:
Conclusion:Conclusion:
Test Statistic: Test Statistic:
Decision:Decision:
Conclusion:Conclusion:
Z0-2.33
.01
Reject
Z0-2.33
.01
Reject
ZX
n
30 7 32
3 860
2 65.
..Z
X
n
30 7 32
3 860
2 65.
..
Reject at Reject at = .01 = .01
8 - 8 - 8282
© 2003 Pearson Prentice Hall© 2003 Pearson Prentice Hall
One-Tailed Z Test One-Tailed Z Test Solution*Solution*
HH00: : = 32 = 32
HHaa: : < 32 < 32
= .01= .01
nn = 60= 60
Critical Value(s):Critical Value(s):
Test Statistic: Test Statistic:
Decision:Decision:
Conclusion:Conclusion:
Test Statistic: Test Statistic:
Decision:Decision:
Conclusion:Conclusion:
Z0-2.33
.01
Reject
Z0-2.33
.01
Reject
ZX
n
30 7 32
3 860
2 65.
..Z
X
n
30 7 32
3 860
2 65.
..
Reject at Reject at = .01 = .01
There is evidence There is evidence average is less than 32average is less than 32

8 - 8 - 8383
© 2003 Pearson Prentice Hall© 2003 Pearson Prentice Hall
Decision Making RisksDecision Making Risks
8 - 8 - 8484
© 2003 Pearson Prentice Hall© 2003 Pearson Prentice Hall
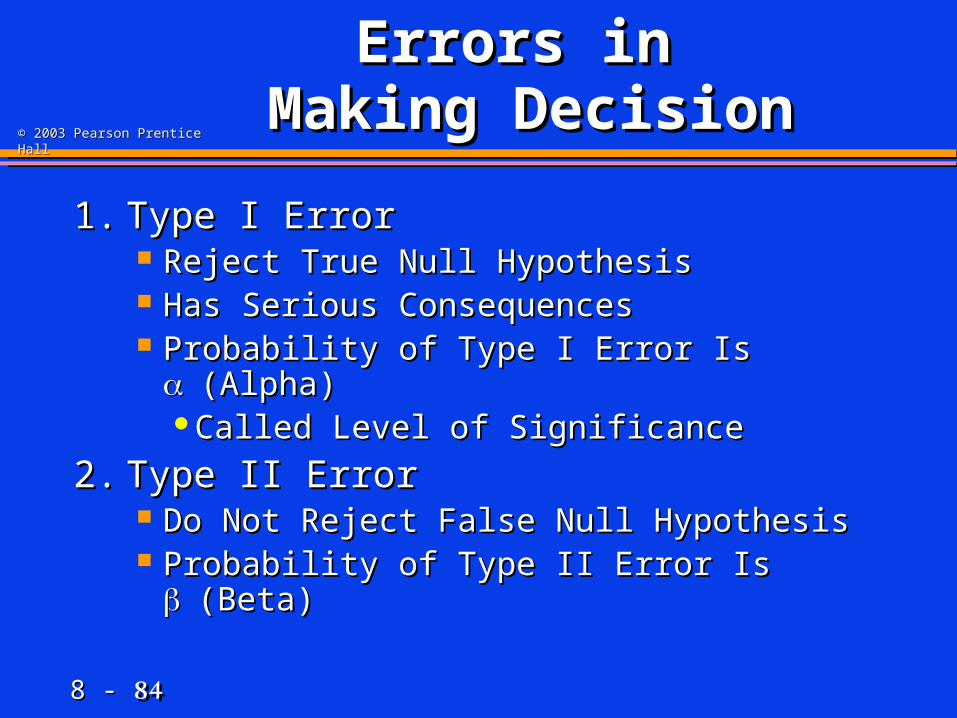
Errors in Errors in Making DecisionMaking Decision
1.1. Type I ErrorType I Error Reject True Null HypothesisReject True Null Hypothesis Has Serious ConsequencesHas Serious Consequences Probability of Type I Error Is Probability of Type I Error Is (Alpha)(Alpha)
Called Level of SignificanceCalled Level of Significance
2.2. Type II ErrorType II Error Do Not Reject False Null HypothesisDo Not Reject False Null Hypothesis Probability of Type II Error Is Probability of Type II Error Is (Beta)(Beta)
8 - 8 - 8585
© 2003 Pearson Prentice Hall© 2003 Pearson Prentice Hall
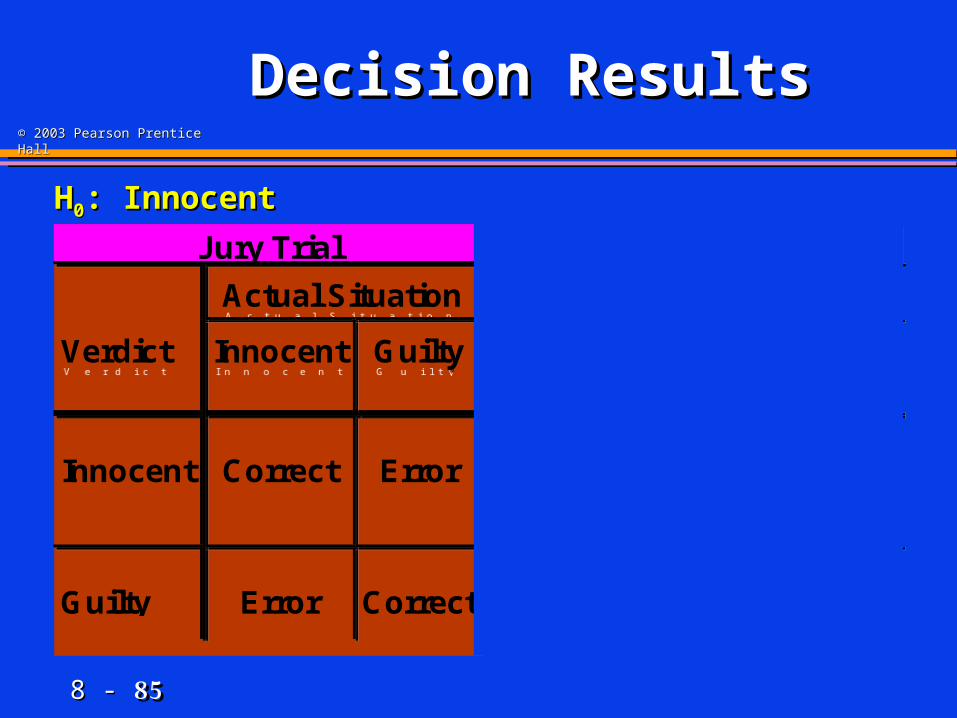
Jury Trial H0 Test
Actual Situation Actual Situation
Verdict Innocent Guilty Decision H0 True H0
False
Innocent Correct ErrorDo NotReject
H0
1 - Type IIError
()
Guilty Error Correct RejectH0
Type IError ()
Power(1 - )
Jury Trial H0 Test
Actual Situation Actual Situation
Verdict Innocent Guilty Decision H0 True H0
False
Innocent Correct ErrorDo NotReject
H0
1 - Type IIError
()
Guilty Error Correct RejectH0
Type IError ()
Power(1 - )
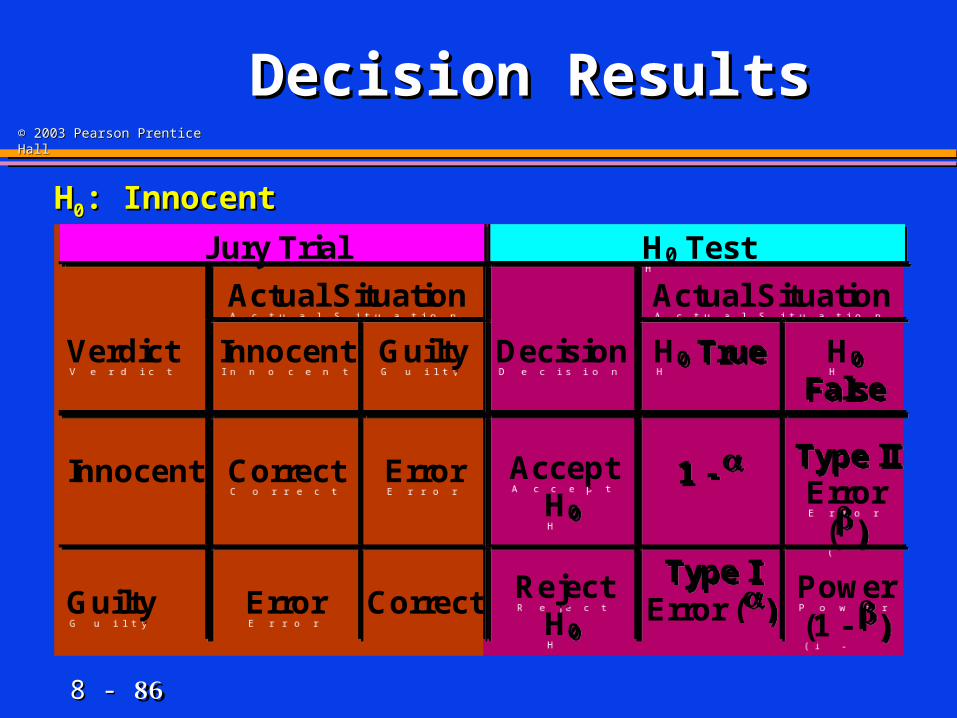
Decision ResultsDecision Results
HH00: Innocent: Innocent
8 - 8 - 8686
© 2003 Pearson Prentice Hall© 2003 Pearson Prentice Hall
Jury Trial H0 Test
Actual Situation Actual Situation
Verdict Innocent Guilty Decision H0 True H0
False
Innocent Correct Error AcceptH0
1 - Type IIError
()
Guilty Error Correct RejectH0
Type IError ()
Power(1 - )
Jury Trial H0 Test
Actual Situation Actual Situation
Verdict Innocent Guilty Decision H0 True H0
False
Innocent Correct Error AcceptH0
1 - Type IIError
()
Guilty Error Correct RejectH0
Type IError ()
Power(1 - )
Decision ResultsDecision Results
HH00: Innocent: Innocent
8 - 8 - 8787
© 2003 Pearson Prentice Hall© 2003 Pearson Prentice Hall
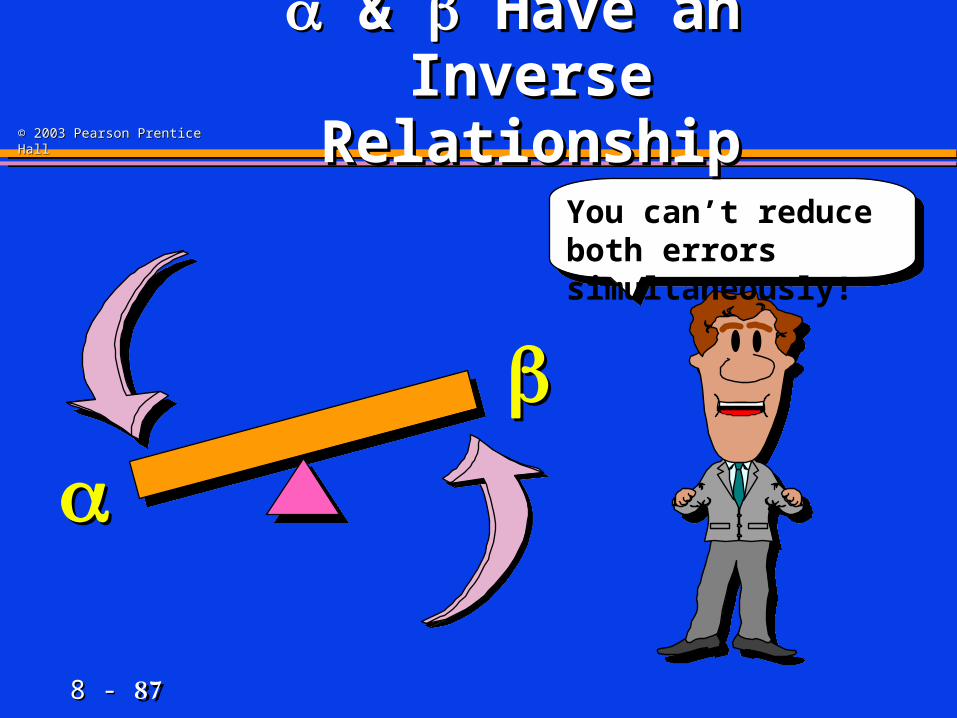
& & Have an Have an Inverse RelationshipInverse Relationship
You can’t reduce both errors simultaneously!
8 - 8 - 8888
© 2003 Pearson Prentice Hall© 2003 Pearson Prentice Hall
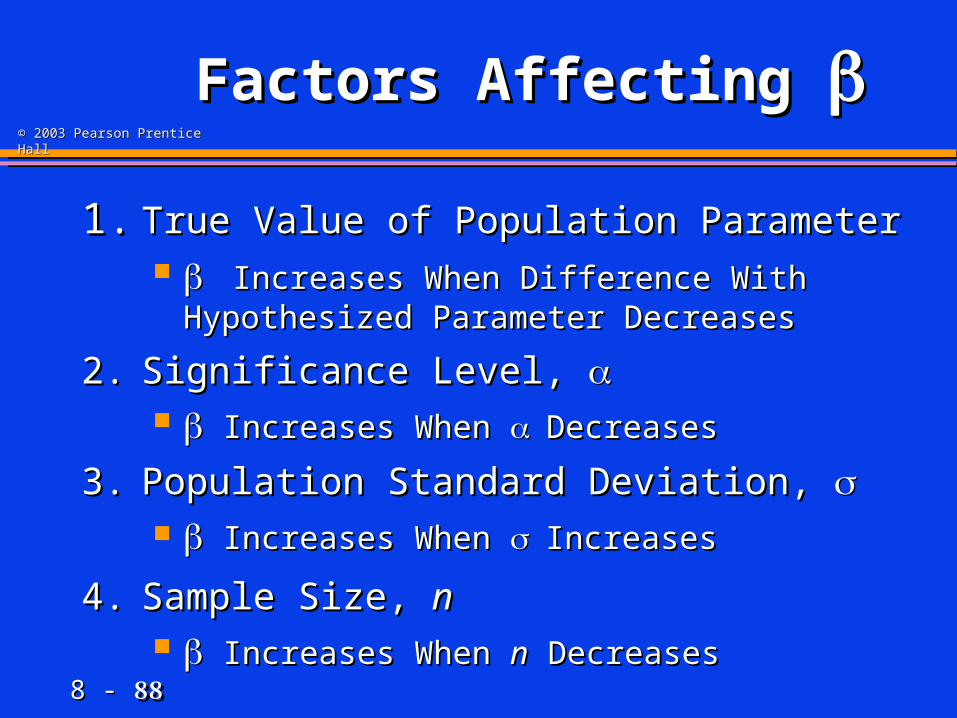
Factors Affecting Factors Affecting
1.1. True Value of Population ParameterTrue Value of Population Parameter Increases When Difference With Hypothesized Increases When Difference With Hypothesized
Parameter DecreasesParameter Decreases
2.2. Significance Level, Significance Level, Increases When Increases When DecreasesDecreases
3.3. Population Standard Deviation, Population Standard Deviation, Increases When Increases When Increases Increases
4.4. Sample Size, Sample Size, nn Increases When Increases When nn Decreases Decreases
8 - 8 - 8989
© 2003 Pearson Prentice Hall© 2003 Pearson Prentice Hall
Two-Tailed t Test Two-Tailed t Test of Mean (of Mean ( Unknown) Unknown)
8 - 8 - 9090
© 2003 Pearson Prentice Hall© 2003 Pearson Prentice Hall
One Population One Population TestsTests
OnePopulation
Z Test(1 & 2tail)
t Test(1 & 2tail)
Z Test(1 & 2tail)
Mean Proportion Variance
2 Test(1 & 2tail)
OnePopulation
Z Test(1 & 2tail)
t Test(1 & 2tail)
Z Test(1 & 2tail)
Mean Proportion Variance
2 Test(1 & 2tail)
8 - 8 - 9191
© 2003 Pearson Prentice Hall© 2003 Pearson Prentice Hall
t Test for Mean t Test for Mean (( Unknown) Unknown)
1.1. AssumptionsAssumptions Population Is Normally DistributedPopulation Is Normally Distributed If Not Normal, Only Slightly Skewed & If Not Normal, Only Slightly Skewed &
Large Sample (Large Sample (nn 30) Taken 30) Taken
2.2. Parametric Test ProcedureParametric Test Procedure
8 - 8 - 9292
© 2003 Pearson Prentice Hall© 2003 Pearson Prentice Hall
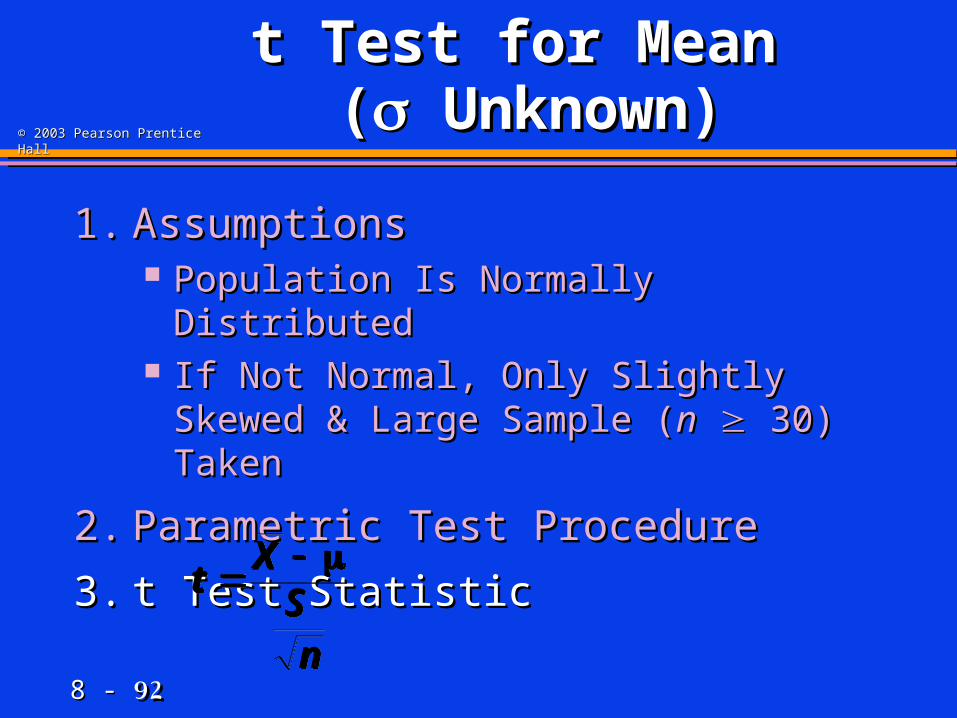
t Test for Mean t Test for Mean (( Unknown) Unknown)
1.1. AssumptionsAssumptions Population Is Normally DistributedPopulation Is Normally Distributed If Not Normal, Only Slightly Skewed & If Not Normal, Only Slightly Skewed &
Large Sample (Large Sample (nn 30) Taken 30) Taken
2.2. Parametric Test ProcedureParametric Test Procedure
3.3. t Test Statistict Test Statistic
tX
Sn
tX
Sn
8 - 8 - 9393
© 2003 Pearson Prentice Hall© 2003 Pearson Prentice Hall
Two-Tailed t TestTwo-Tailed t Test Finding Critical t Finding Critical t
ValuesValues
8 - 8 - 9494
© 2003 Pearson Prentice Hall© 2003 Pearson Prentice Hall
t0 t0
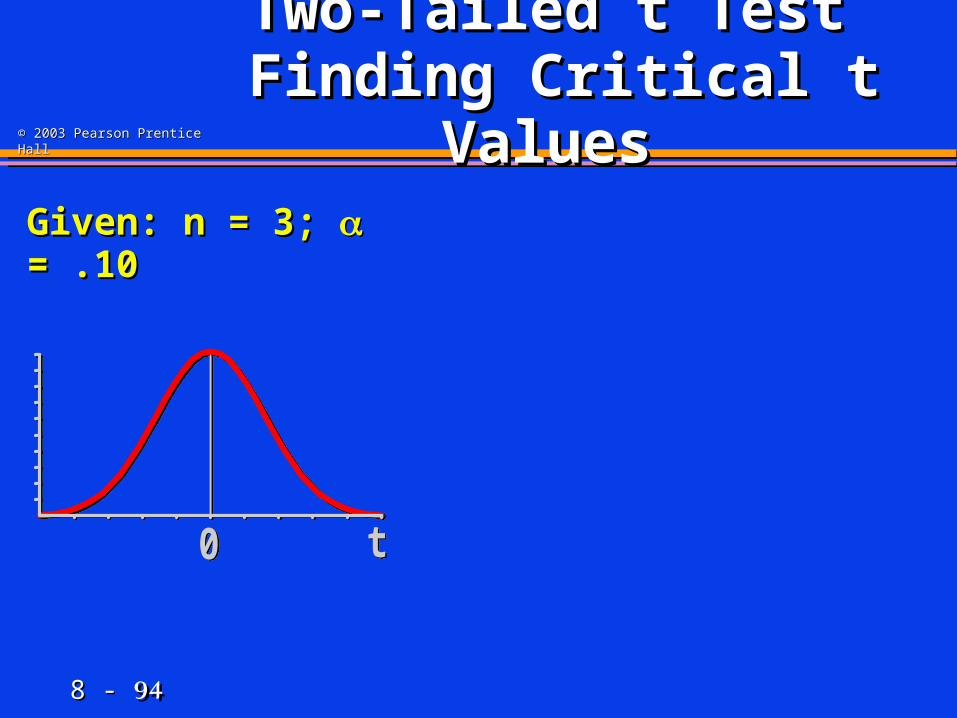
Two-Tailed t TestTwo-Tailed t Test Finding Critical t Finding Critical t
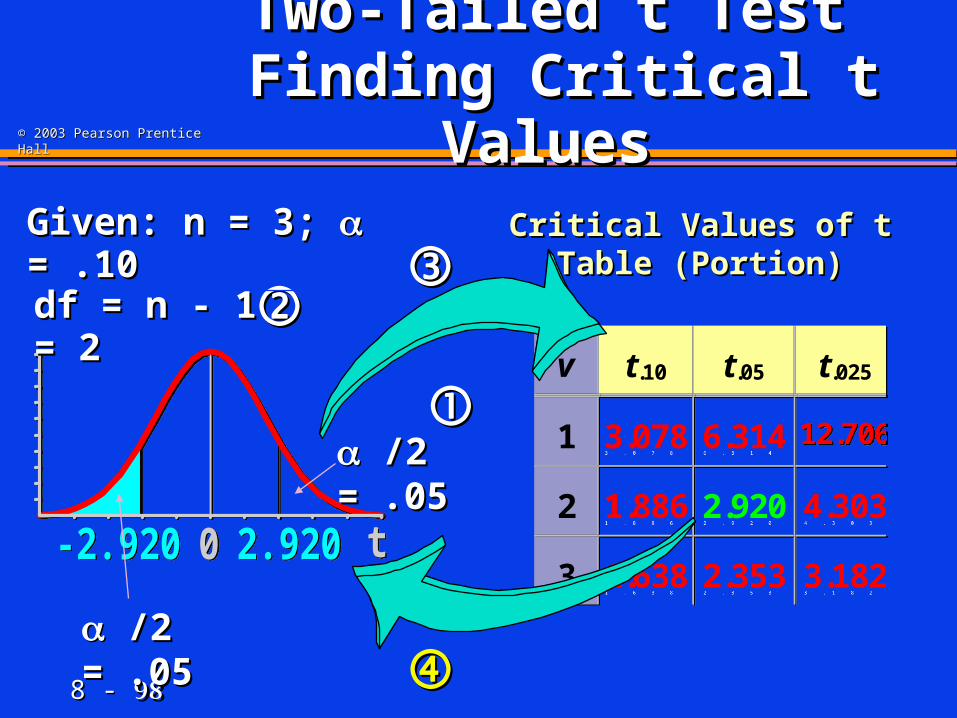
ValuesValuesGiven: n = 3; Given: n = 3; = .10 = .10
8 - 8 - 9595
© 2003 Pearson Prentice Hall© 2003 Pearson Prentice Hall
t0 t0
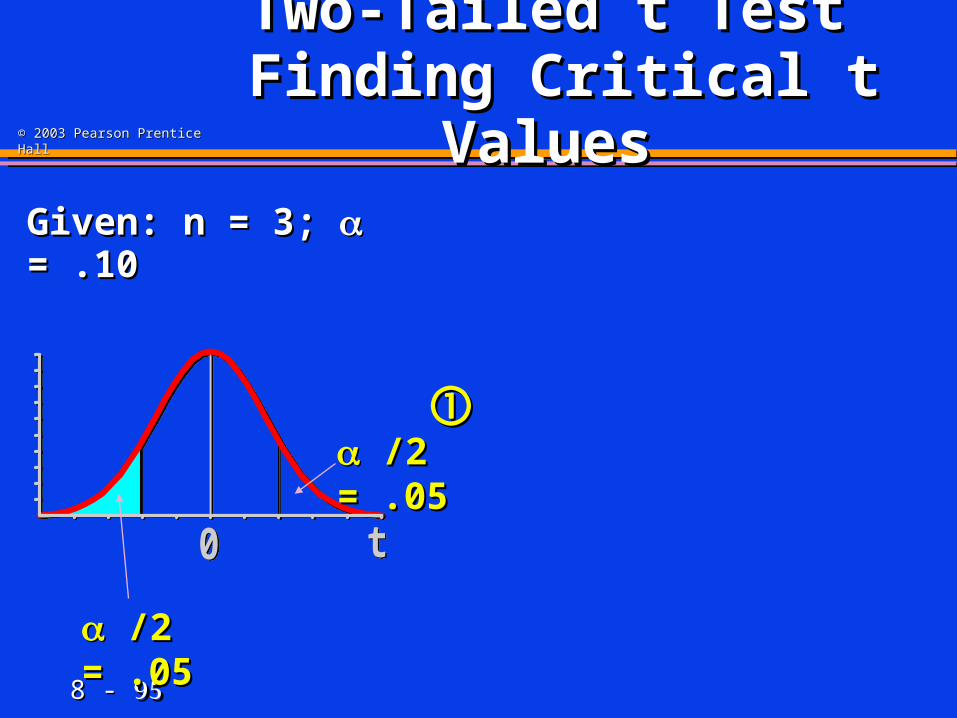
Two-Tailed t TestTwo-Tailed t Test Finding Critical t Finding Critical t
ValuesValues
/2 = .05/2 = .05
/2 = .05/2 = .05
Given: n = 3; Given: n = 3; = .10 = .10
8 - 8 - 9696
© 2003 Pearson Prentice Hall© 2003 Pearson Prentice Hall
t0 t0
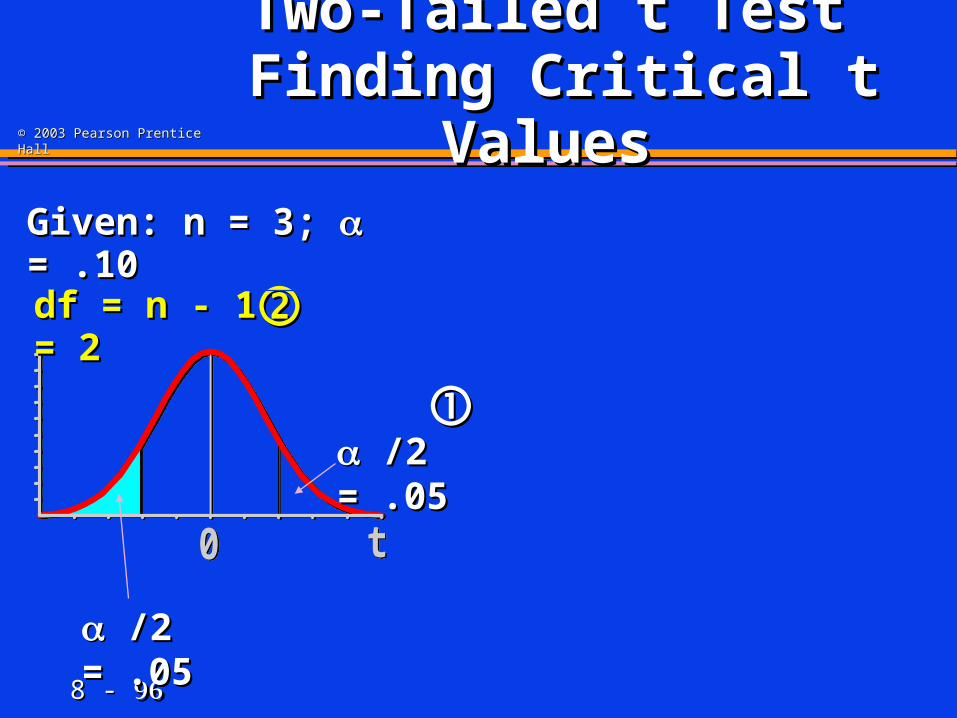
Two-Tailed t TestTwo-Tailed t Test Finding Critical t Finding Critical t
ValuesValues
/2 = .05/2 = .05
/2 = .05/2 = .05
Given: n = 3; Given: n = 3; = .10 = .10
df = n - 1 = 2df = n - 1 = 2
8 - 8 - 9797
© 2003 Pearson Prentice Hall© 2003 Pearson Prentice Hall
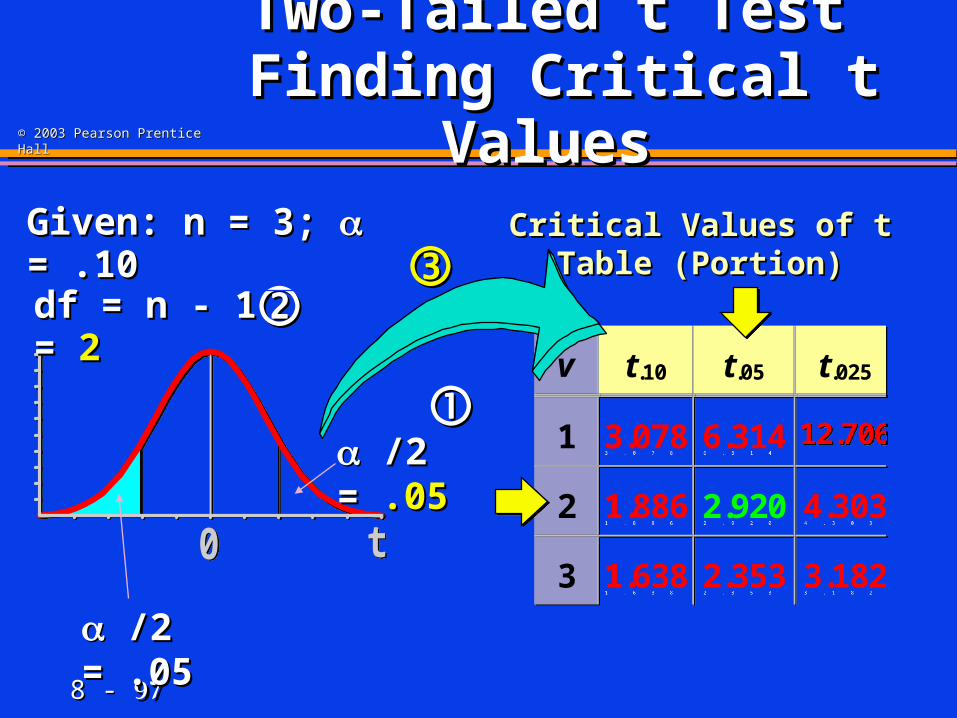
v t.10 t.05 t.025
1 3.078 6.314 12.706
2 1.886 2.920 4.303
3 1.638 2.353 3.182
v t.10 t.05 t.025
1 3.078 6.314 12.706
2 1.886 2.920 4.303
3 1.638 2.353 3.182t0 t0
Two-Tailed t TestTwo-Tailed t Test Finding Critical t Finding Critical t
ValuesValuesCritical Values of t Table Critical Values of t Table
(Portion)(Portion)
/2 = /2 = .05.05
/2 = .05/2 = .05
Given: n = 3; Given: n = 3; = .10 = .10
df = n - 1 = df = n - 1 = 22
8 - 8 - 9898
© 2003 Pearson Prentice Hall© 2003 Pearson Prentice Hall
v t.10 t.05 t.025
1 3.078 6.314 12.706
2 1.886 2.920 4.303
3 1.638 2.353 3.182
v t.10 t.05 t.025
1 3.078 6.314 12.706
2 1.886 2.920 4.303
3 1.638 2.353 3.182t0 2.920-2.920 t0 2.920-2.920
Two-Tailed t TestTwo-Tailed t Test Finding Critical t Finding Critical t
ValuesValuesCritical Values of t Table Critical Values of t Table
(Portion)(Portion)
/2 = .05/2 = .05
/2 = .05/2 = .05
Given: n = 3; Given: n = 3; = .10 = .10
df = n - 1 = 2df = n - 1 = 2
8 - 8 - 9999
© 2003 Pearson Prentice Hall© 2003 Pearson Prentice Hall
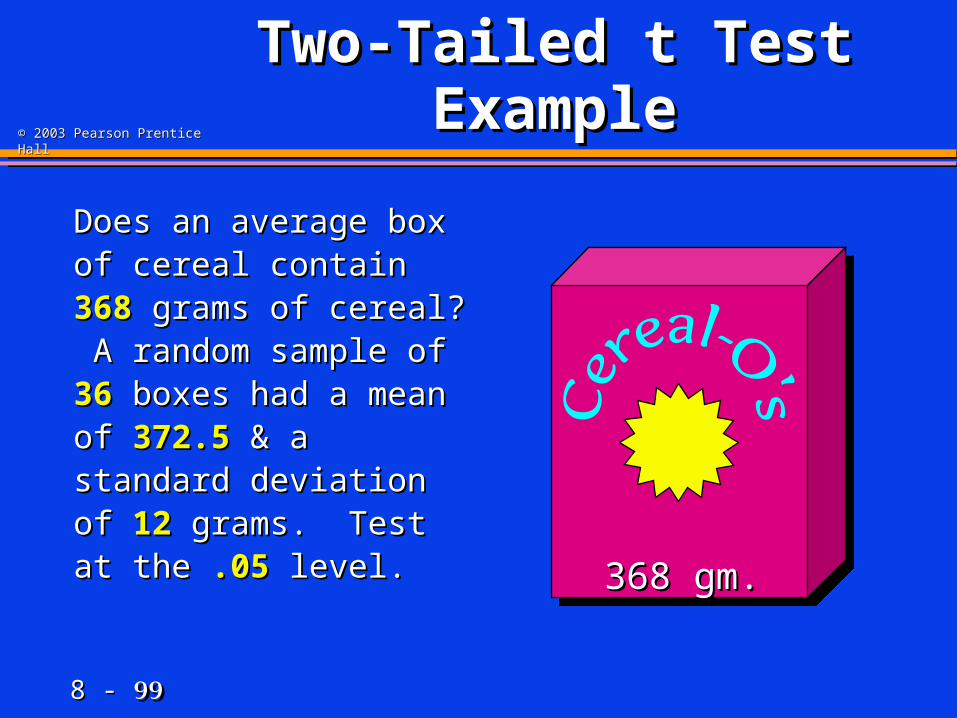
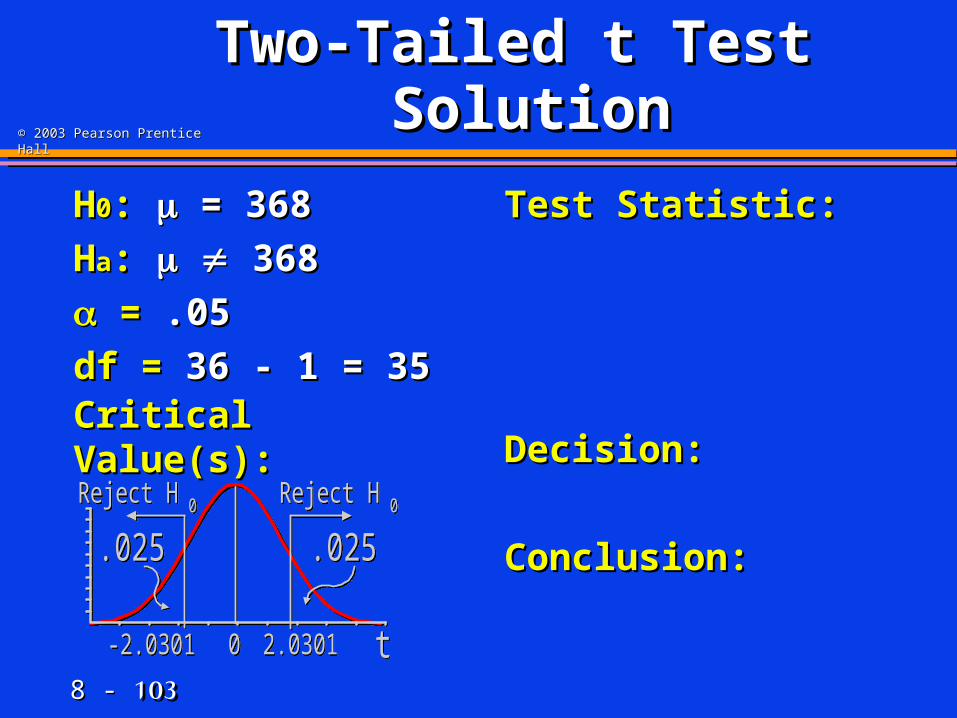
Two-Tailed t TestTwo-Tailed t Test Example Example
Does an average box of Does an average box of cereal contain cereal contain 368368 grams of cereal? A grams of cereal? A random sample of random sample of 3636 boxes had a mean of boxes had a mean of 372.5372.5 & a standard & a standard deviation ofdeviation of 1212 grams. grams. Test at the Test at the .05.05 level. level. 368 gm.368 gm.

8 - 8 - 100100
© 2003 Pearson Prentice Hall© 2003 Pearson Prentice Hall
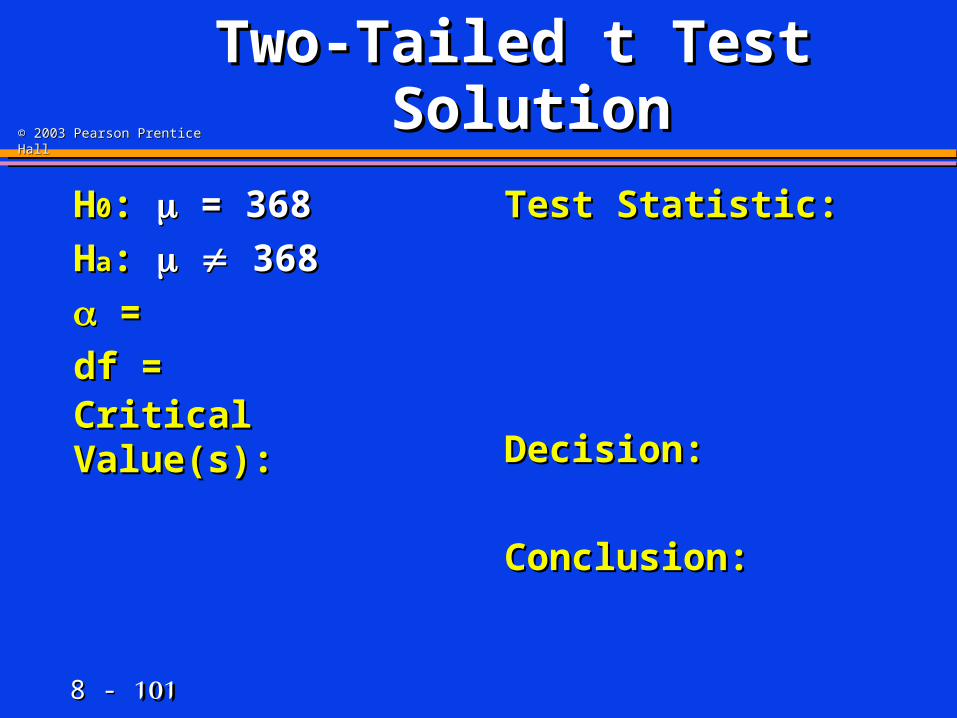
Two-Tailed t Test Two-Tailed t Test SolutionSolution
HH00: :
HHaa: :
= =
df = df = Critical Value(s):Critical Value(s):
Test Statistic: Test Statistic:
Decision:Decision:
Conclusion:Conclusion:
8 - 8 - 101101
© 2003 Pearson Prentice Hall© 2003 Pearson Prentice Hall
Two-Tailed t Test Two-Tailed t Test SolutionSolution
HH00: : = 368 = 368
HHaa: : 368 368
= =
df = df = Critical Value(s):Critical Value(s):
Test Statistic: Test Statistic:
Decision:Decision:
Conclusion:Conclusion:
8 - 8 - 102102
© 2003 Pearson Prentice Hall© 2003 Pearson Prentice Hall
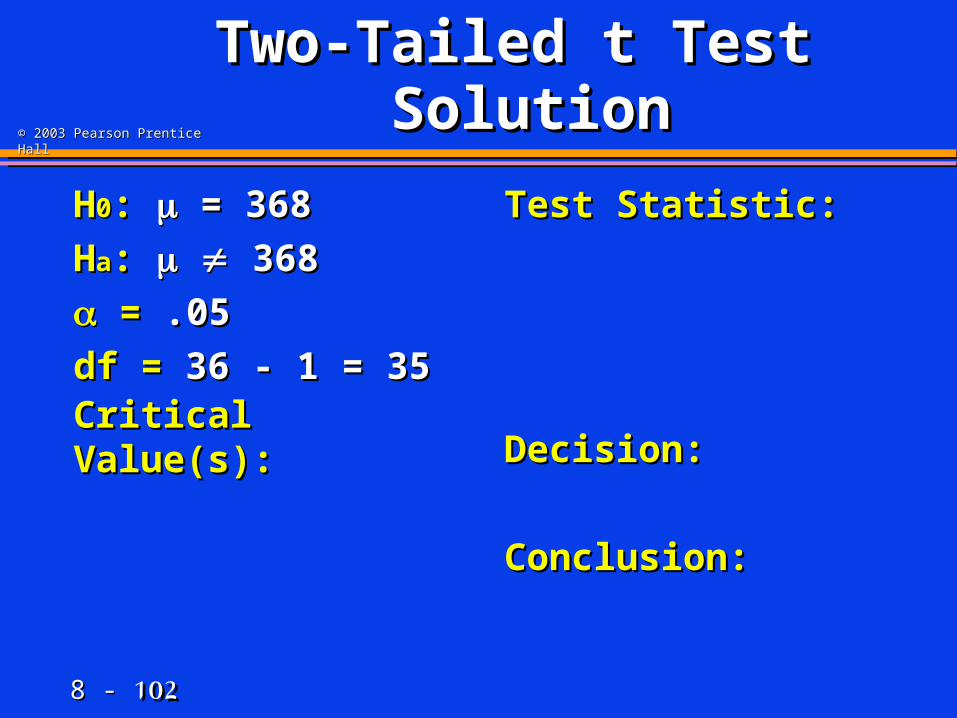
Two-Tailed t Test Two-Tailed t Test SolutionSolution
HH00: : = 368 = 368
HHaa: : 368 368
= = .05.05
df = df = 36 - 1 = 3536 - 1 = 35Critical Value(s):Critical Value(s):
Test Statistic: Test Statistic:
Decision:Decision:
Conclusion:Conclusion:
8 - 8 - 103103
© 2003 Pearson Prentice Hall© 2003 Pearson Prentice Hall
Two-Tailed t Test Two-Tailed t Test SolutionSolution
HH00: : = 368 = 368
HHaa: : 368 368
= = .05.05
df = df = 36 - 1 = 3536 - 1 = 35Critical Value(s):Critical Value(s):
Test Statistic: Test Statistic:
Decision:Decision:
Conclusion:Conclusion:
t0 2.0301-2.0301
.025
Reject H 0 Reject H 0
.025
t0 2.0301-2.0301
.025
Reject H 0 Reject H 0
.025
8 - 8 - 104104
© 2003 Pearson Prentice Hall© 2003 Pearson Prentice Hall
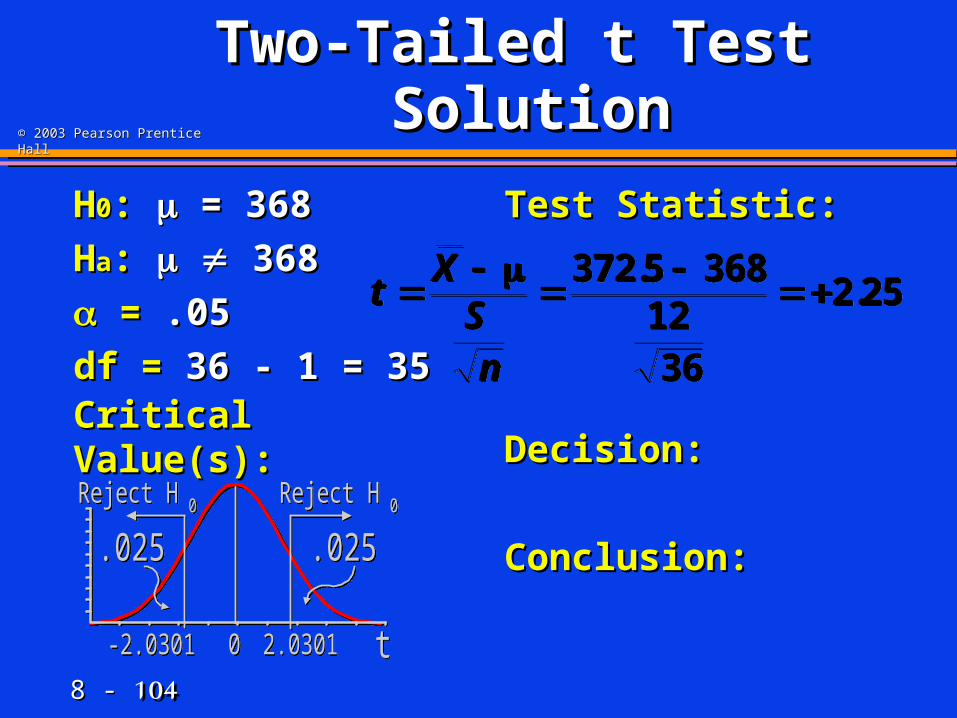
Two-Tailed t Test Two-Tailed t Test SolutionSolution
HH00: : = 368 = 368
HHaa: : 368 368
= = .05.05
df = df = 36 - 1 = 3536 - 1 = 35Critical Value(s):Critical Value(s):
Test Statistic: Test Statistic:
Decision:Decision:
Conclusion:Conclusion:
t0 2.0301-2.0301
.025
Reject H 0 Reject H 0
.025
t0 2.0301-2.0301
.025
Reject H 0 Reject H 0
.025
tX
Sn
372 5 368
1236
2 25.
.tX
Sn
372 5 368
1236
2 25.
.
8 - 8 - 105105
© 2003 Pearson Prentice Hall© 2003 Pearson Prentice Hall
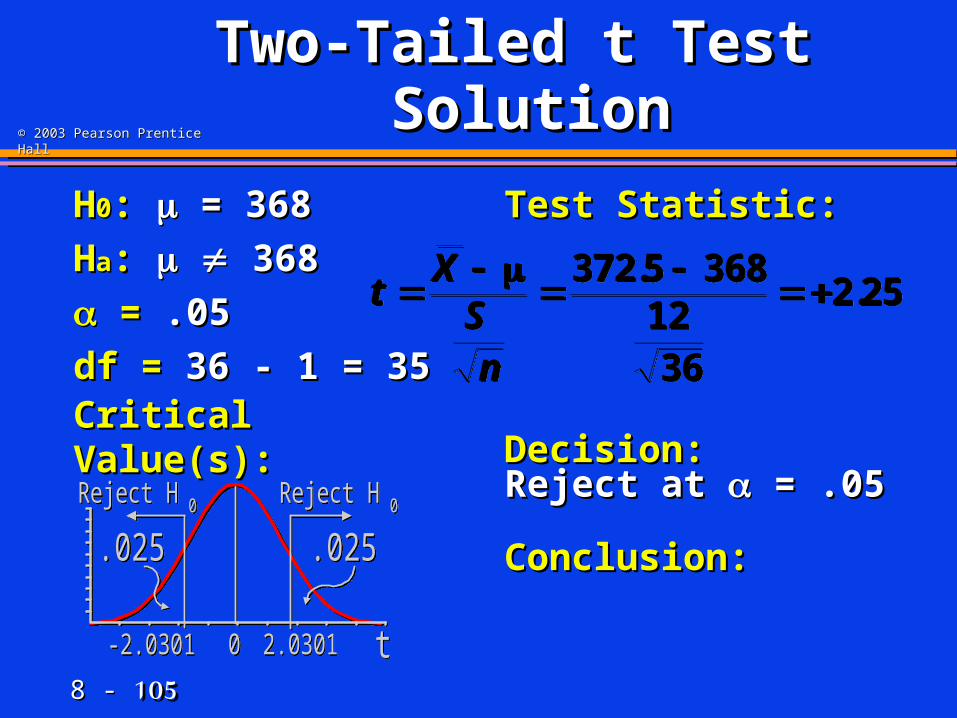
Two-Tailed t Test Two-Tailed t Test SolutionSolution
HH00: : = 368 = 368
HHaa: : 368 368
= = .05.05
df = df = 36 - 1 = 3536 - 1 = 35Critical Value(s):Critical Value(s):
Test Statistic: Test Statistic:
Decision:Decision:
Conclusion:Conclusion:
t0 2.0301-2.0301
.025
Reject H 0 Reject H 0
.025
t0 2.0301-2.0301
.025
Reject H 0 Reject H 0
.025
tX
Sn
372 5 368
1236
2 25.
.tX
Sn
372 5 368
1236
2 25.
.
Reject at Reject at = .05 = .05
8 - 8 - 106106
© 2003 Pearson Prentice Hall© 2003 Pearson Prentice Hall
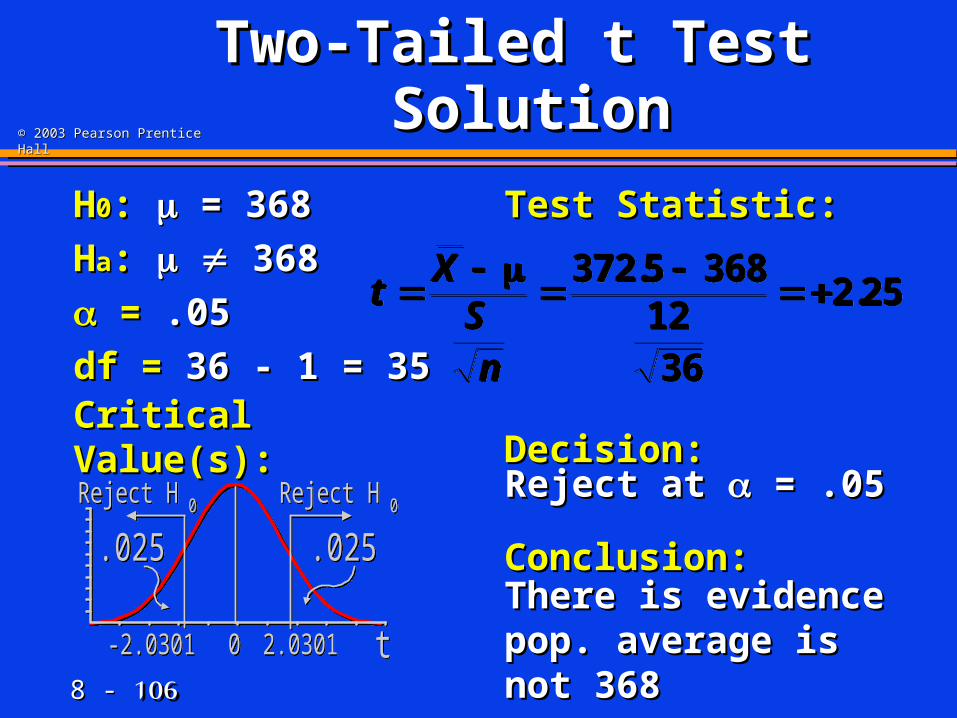
Two-Tailed t Test Two-Tailed t Test SolutionSolution
HH00: : = 368 = 368
HHaa: : 368 368
= = .05.05
df = df = 36 - 1 = 3536 - 1 = 35Critical Value(s):Critical Value(s):
Test Statistic: Test Statistic:
Decision:Decision:
Conclusion:Conclusion:
t0 2.0301-2.0301
.025
Reject H 0 Reject H 0
.025
t0 2.0301-2.0301
.025
Reject H 0 Reject H 0
.025
tX
Sn
372 5 368
1236
2 25.
.tX
Sn
372 5 368
1236
2 25.
.
Reject at Reject at = .05 = .05
There is evidence pop. There is evidence pop. average is not 368average is not 368
8 - 8 - 107107
© 2003 Pearson Prentice Hall© 2003 Pearson Prentice Hall
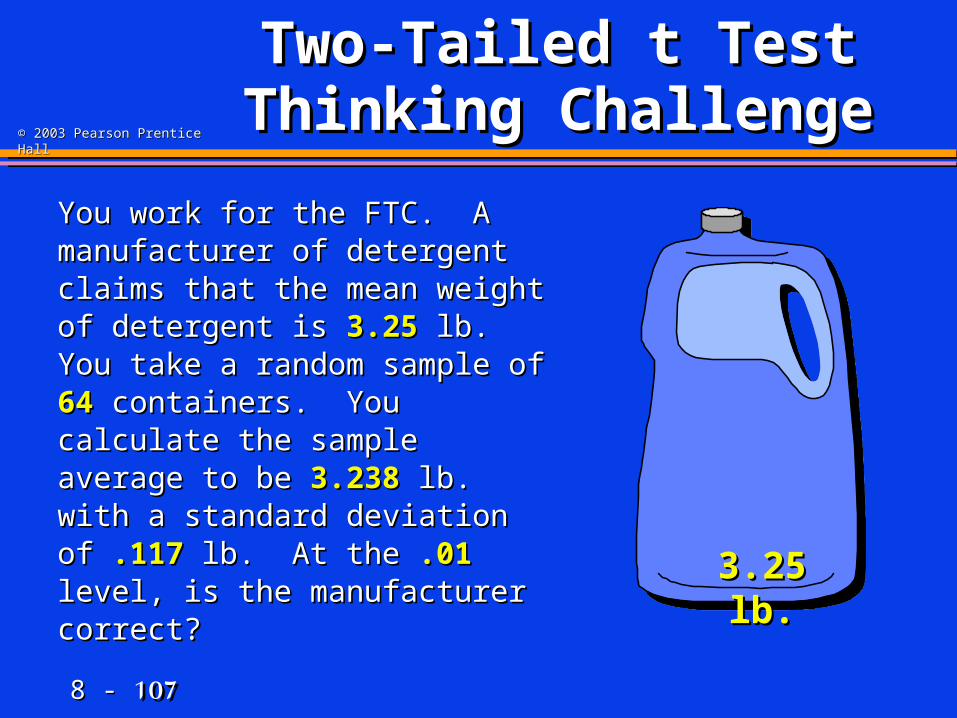
Two-Tailed t TestTwo-Tailed t TestThinking ChallengeThinking Challenge
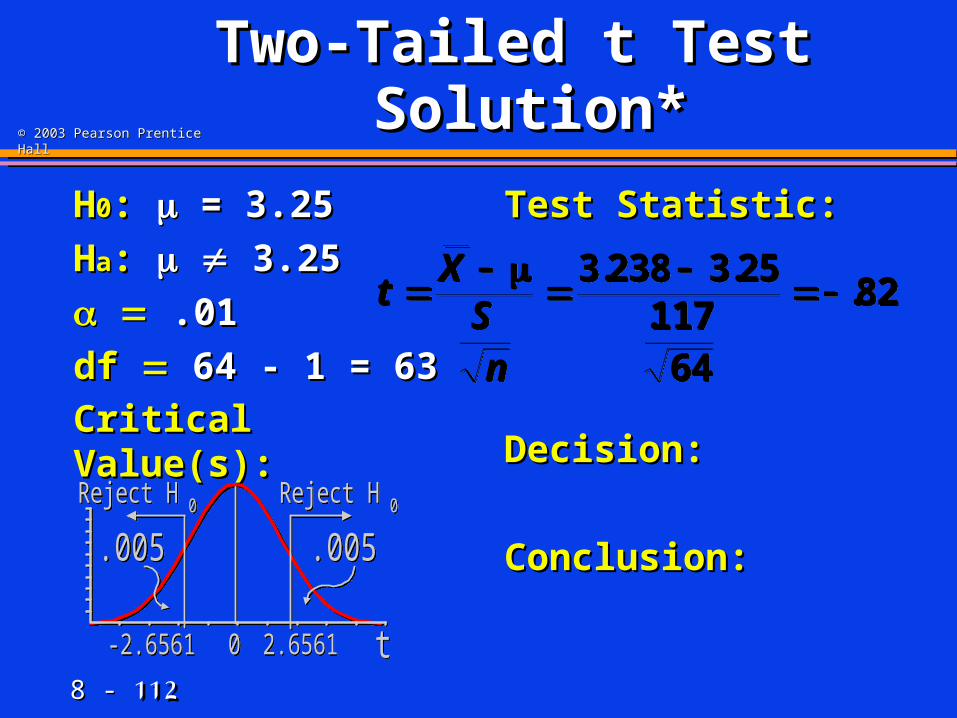
You work for the FTC. A You work for the FTC. A manufacturer of detergent manufacturer of detergent claims that the mean weight claims that the mean weight of detergent is of detergent is 3.253.25 lb. You lb. You take a random sample of take a random sample of 6464 containers. You calculate the containers. You calculate the sample average to be sample average to be 3.2383.238 lb. with a standard deviation lb. with a standard deviation of of .117.117 lb. At the lb. At the .01.01 level, is level, is the manufacturer correct?the manufacturer correct?
3.25 lb.3.25 lb.
8 - 8 - 108108
© 2003 Pearson Prentice Hall© 2003 Pearson Prentice Hall
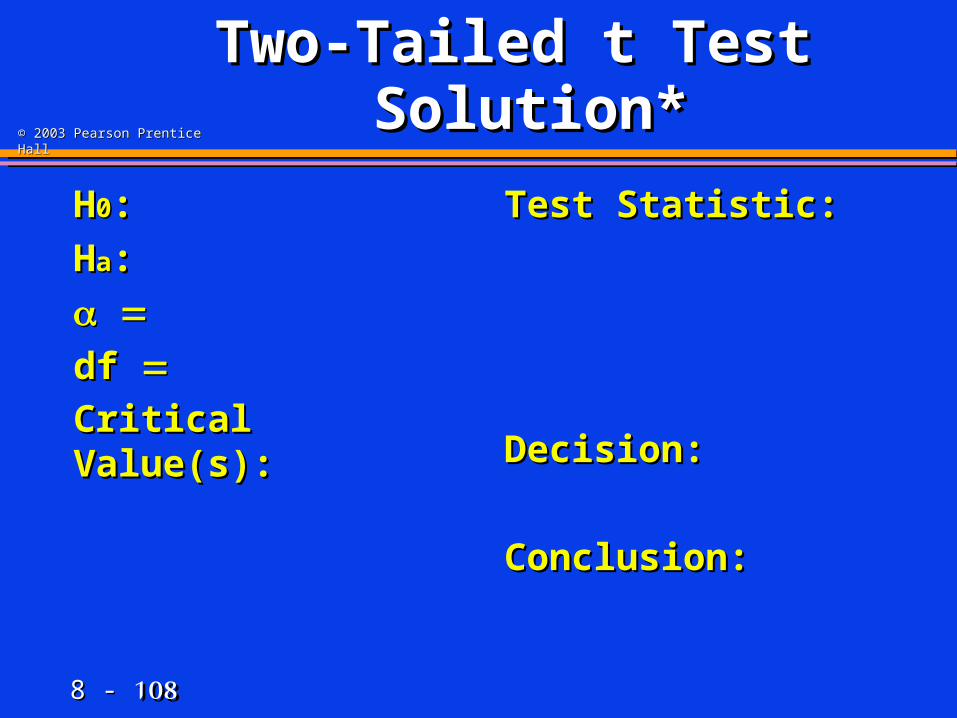
Two-Tailed t Test Two-Tailed t Test Solution*Solution*
HH00: :
HHaa: :
df df
Critical Value(s):Critical Value(s):
Test Statistic: Test Statistic:
Decision:Decision:
Conclusion:Conclusion:
8 - 8 - 109109
© 2003 Pearson Prentice Hall© 2003 Pearson Prentice Hall
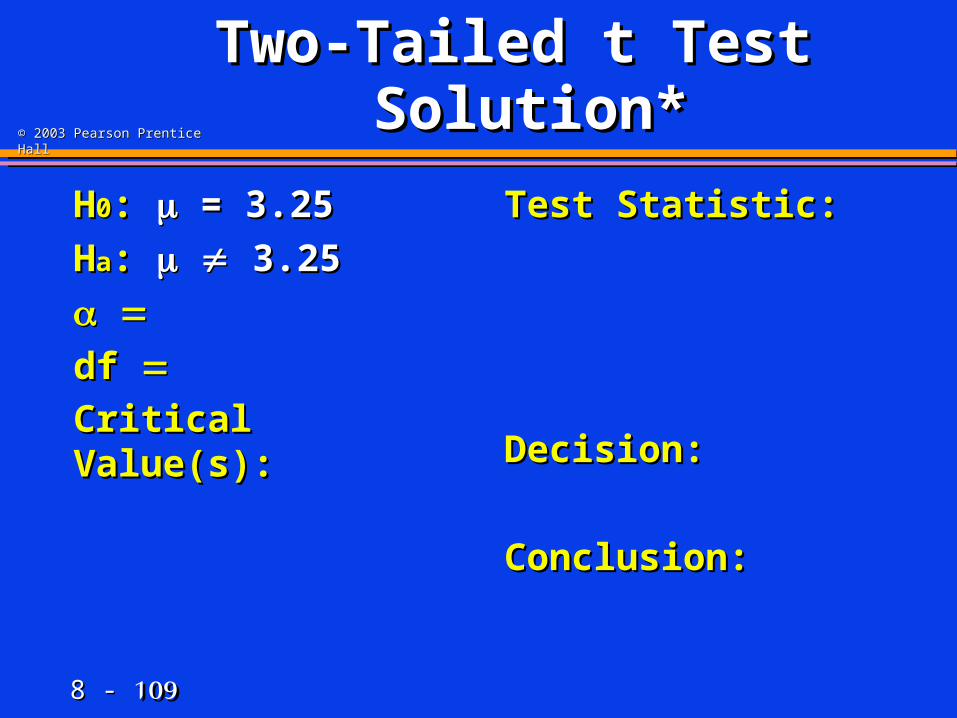
Two-Tailed t Test Two-Tailed t Test Solution*Solution*
HH00: : = 3.25 = 3.25
HHaa: : 3.25 3.25
df df
Critical Value(s):Critical Value(s):
Test Statistic: Test Statistic:
Decision:Decision:
Conclusion:Conclusion:
8 - 8 - 110110
© 2003 Pearson Prentice Hall© 2003 Pearson Prentice Hall
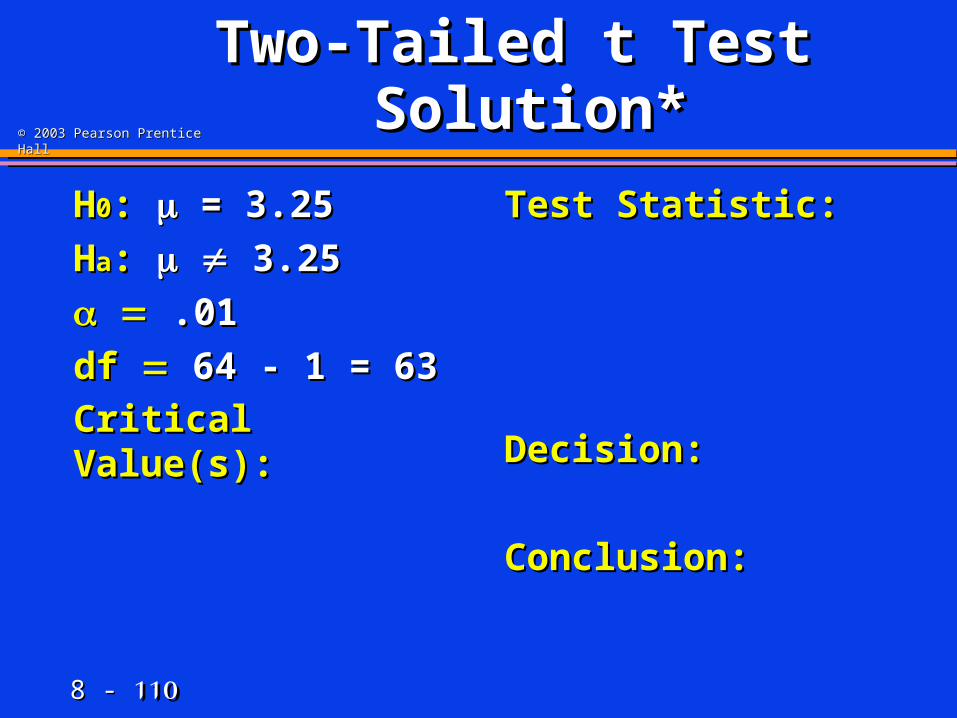
Two-Tailed t Test Two-Tailed t Test Solution*Solution*
HH00: : = 3.25 = 3.25
HHaa: : 3.25 3.25
.01.01
df df 64 - 1 = 6364 - 1 = 63
Critical Value(s):Critical Value(s):
Test Statistic: Test Statistic:
Decision:Decision:
Conclusion:Conclusion:

8 - 8 - 111111
© 2003 Pearson Prentice Hall© 2003 Pearson Prentice Hall
Two-Tailed t Test Two-Tailed t Test Solution*Solution*
HH00: : = 3.25 = 3.25
HHaa: : 3.25 3.25
.01.01
df df 64 - 1 = 6364 - 1 = 63
Critical Value(s):Critical Value(s):
Test Statistic: Test Statistic:
Decision:Decision:
Conclusion:Conclusion:
t0 2.6561-2.6561
.005
Reject H 0 Reject H 0
.005
t0 2.6561-2.6561
.005
Reject H 0 Reject H 0
.005
8 - 8 - 112112
© 2003 Pearson Prentice Hall© 2003 Pearson Prentice Hall
Two-Tailed t Test Two-Tailed t Test Solution*Solution*
HH00: : = 3.25 = 3.25
HHaa: : 3.25 3.25
.01.01
df df 64 - 1 = 6364 - 1 = 63
Critical Value(s):Critical Value(s):
Test Statistic: Test Statistic:
Decision:Decision:
Conclusion:Conclusion:
t0 2.6561-2.6561
.005
Reject H 0 Reject H 0
.005
t0 2.6561-2.6561
.005
Reject H 0 Reject H 0
.005
tX
Sn
3 238 3 25
11764
82. .
..t
XSn
3 238 3 25
11764
82. .
..
8 - 8 - 113113
© 2003 Pearson Prentice Hall© 2003 Pearson Prentice Hall
Two-Tailed t Test Two-Tailed t Test Solution*Solution*
HH00: : = 3.25 = 3.25
HHaa: : 3.25 3.25
.01.01
df df 64 - 1 = 6364 - 1 = 63
Critical Value(s):Critical Value(s):
Test Statistic: Test Statistic:
Decision:Decision:
Conclusion:Conclusion:
t0 2.6561-2.6561
.005
Reject H 0 Reject H 0
.005
t0 2.6561-2.6561
.005
Reject H 0 Reject H 0
.005
tX
Sn
3 238 3 25
11764
82. .
..t
XSn
3 238 3 25
11764
82. .
..
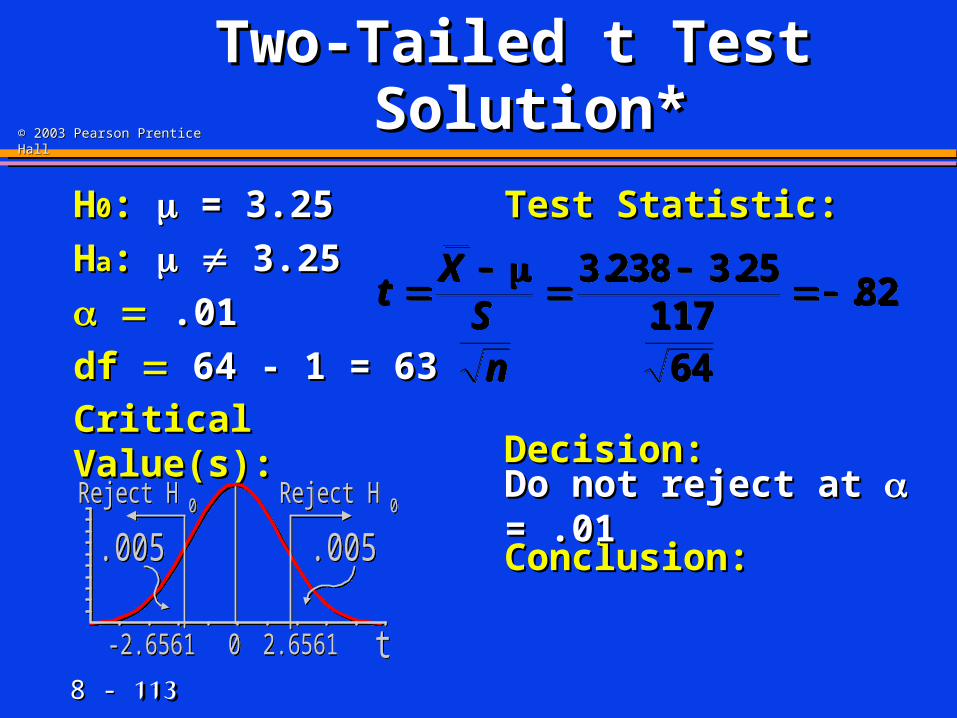
Do not reject at Do not reject at = .01 = .01
8 - 8 - 114114
© 2003 Pearson Prentice Hall© 2003 Pearson Prentice Hall
Two-Tailed t Test Two-Tailed t Test Solution*Solution*
HH00: : = 3.25 = 3.25
HHaa: : 3.25 3.25
.01.01
df df 64 - 1 = 6364 - 1 = 63
Critical Value(s):Critical Value(s):
Test Statistic: Test Statistic:
Decision:Decision:
Conclusion:Conclusion:
t0 2.6561-2.6561
.005
Reject H 0 Reject H 0
.005
t0 2.6561-2.6561
.005
Reject H 0 Reject H 0
.005
tX
Sn
3 238 3 25
11764
82. .
..t
XSn
3 238 3 25
11764
82. .
..
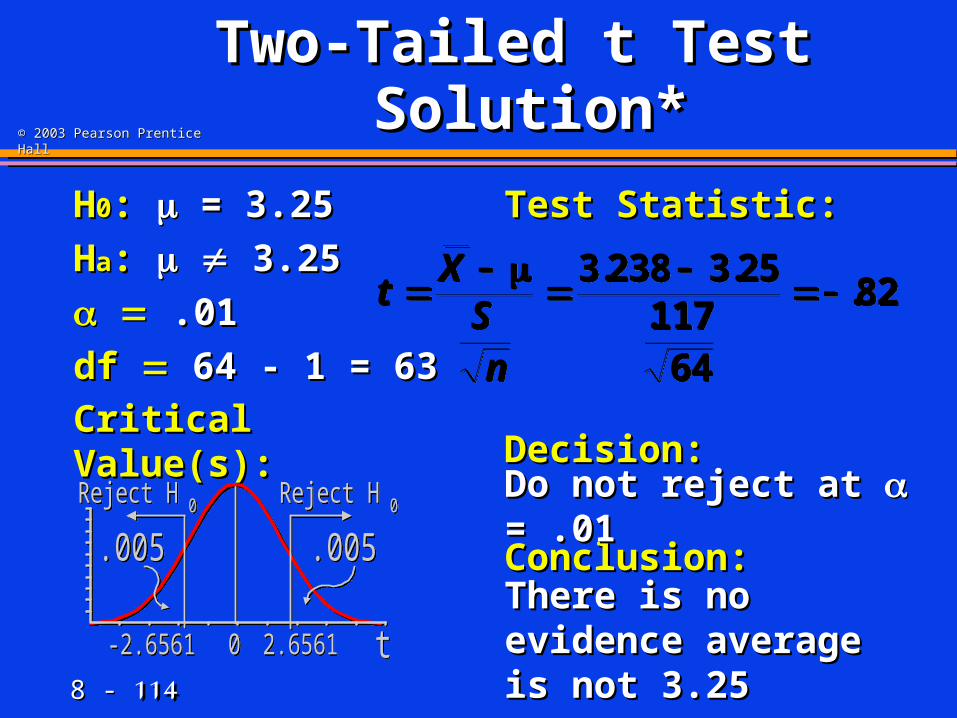
Do not reject at Do not reject at = .01 = .01
There is no evidence There is no evidence average is not 3.25average is not 3.25
8 - 8 - 115115
© 2003 Pearson Prentice Hall© 2003 Pearson Prentice Hall
One-Tailed t Test One-Tailed t Test of Mean (of Mean ( Unknown) Unknown)
8 - 8 - 116116
© 2003 Pearson Prentice Hall© 2003 Pearson Prentice Hall
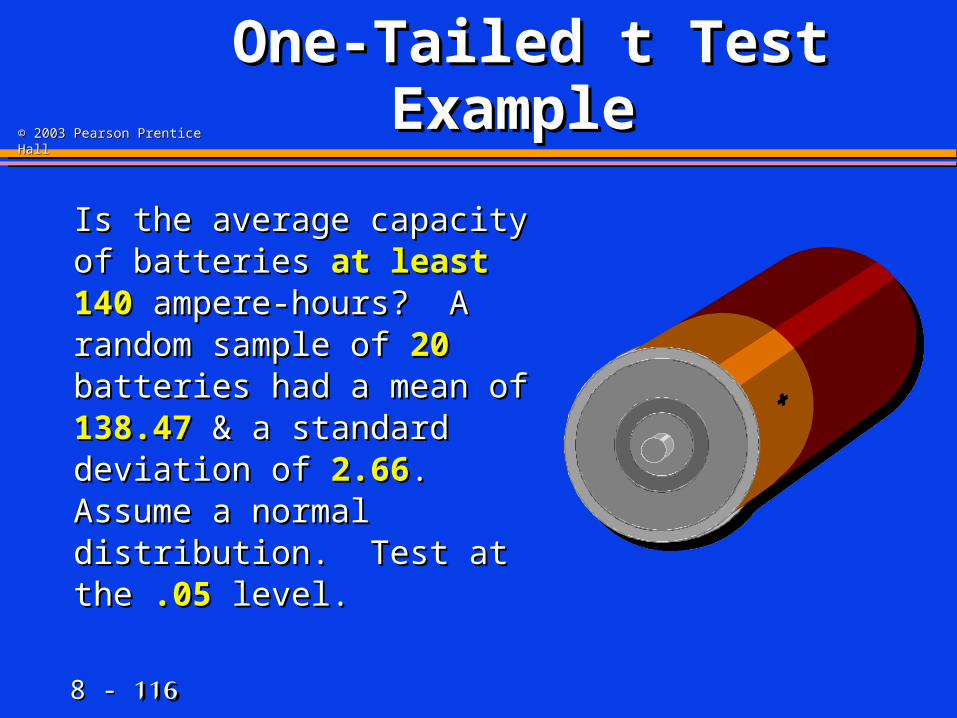
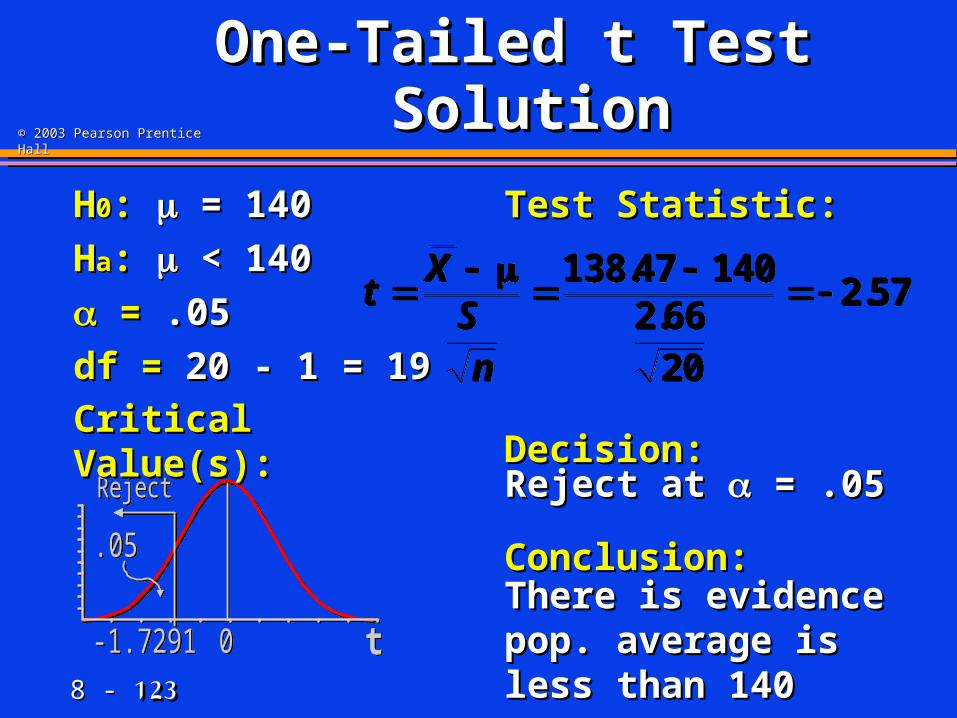
One-Tailed t TestOne-Tailed t TestExample Example
Is the average capacity of Is the average capacity of batteries batteries at least 140 at least 140 ampere-hours? A random ampere-hours? A random sample of sample of 2020 batteries had batteries had a mean of a mean of 138.47138.47 & a & a standard deviation of standard deviation of 2.662.66. . Assume a normal Assume a normal distribution. Test at the distribution. Test at the .05.05 level.level.

8 - 8 - 117117
© 2003 Pearson Prentice Hall© 2003 Pearson Prentice Hall
One-Tailed t Test One-Tailed t Test SolutionSolution
HH00: :
HHaa: :
==
df =df =
Critical Value(s):Critical Value(s):
Test Statistic: Test Statistic:
Decision:Decision:
Conclusion:Conclusion:

8 - 8 - 118118
© 2003 Pearson Prentice Hall© 2003 Pearson Prentice Hall
One-Tailed t Test One-Tailed t Test SolutionSolution
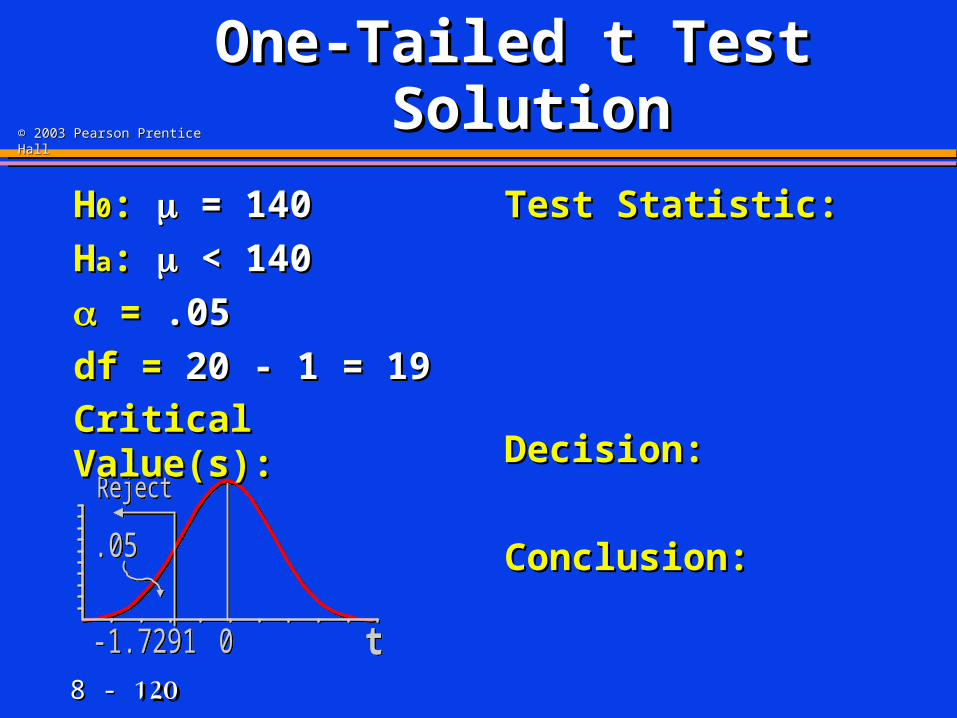
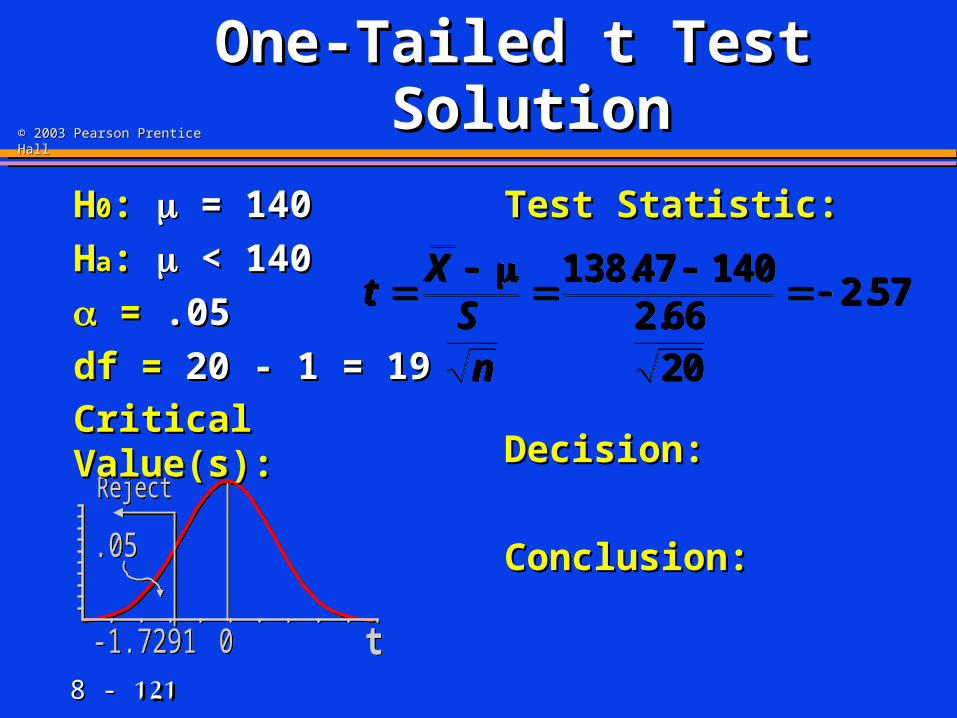
HH00: : = 140 = 140
HHaa: : < 140 < 140
= =
df = df =
Critical Value(s):Critical Value(s):
Test Statistic: Test Statistic:
Decision:Decision:
Conclusion:Conclusion:

8 - 8 - 119119
© 2003 Pearson Prentice Hall© 2003 Pearson Prentice Hall
One-Tailed t Test One-Tailed t Test SolutionSolution
HH00: : = 140 = 140
HHaa: : < 140 < 140
= = .05.05
df = df = 20 - 1 = 1920 - 1 = 19
Critical Value(s):Critical Value(s):
Test Statistic: Test Statistic:
Decision:Decision:
Conclusion:Conclusion:
8 - 8 - 120120
© 2003 Pearson Prentice Hall© 2003 Pearson Prentice Hall
t0-1.7291
.05
Reject
t0-1.7291
.05
Reject
One-Tailed t Test One-Tailed t Test SolutionSolution
HH00: : = 140 = 140
HHaa: : < 140 < 140
= = .05.05
df = df = 20 - 1 = 1920 - 1 = 19
Critical Value(s):Critical Value(s):
Test Statistic: Test Statistic:
Decision:Decision:
Conclusion:Conclusion:
8 - 8 - 121121
© 2003 Pearson Prentice Hall© 2003 Pearson Prentice Hall
t0-1.7291
.05
Reject
t0-1.7291
.05
Reject
One-Tailed t Test One-Tailed t Test SolutionSolution
HH00: : = 140 = 140
HHaa: : < 140 < 140
= = .05.05
df = df = 20 - 1 = 1920 - 1 = 19
Critical Value(s):Critical Value(s):
Test Statistic: Test Statistic:
Decision:Decision:
Conclusion:Conclusion:
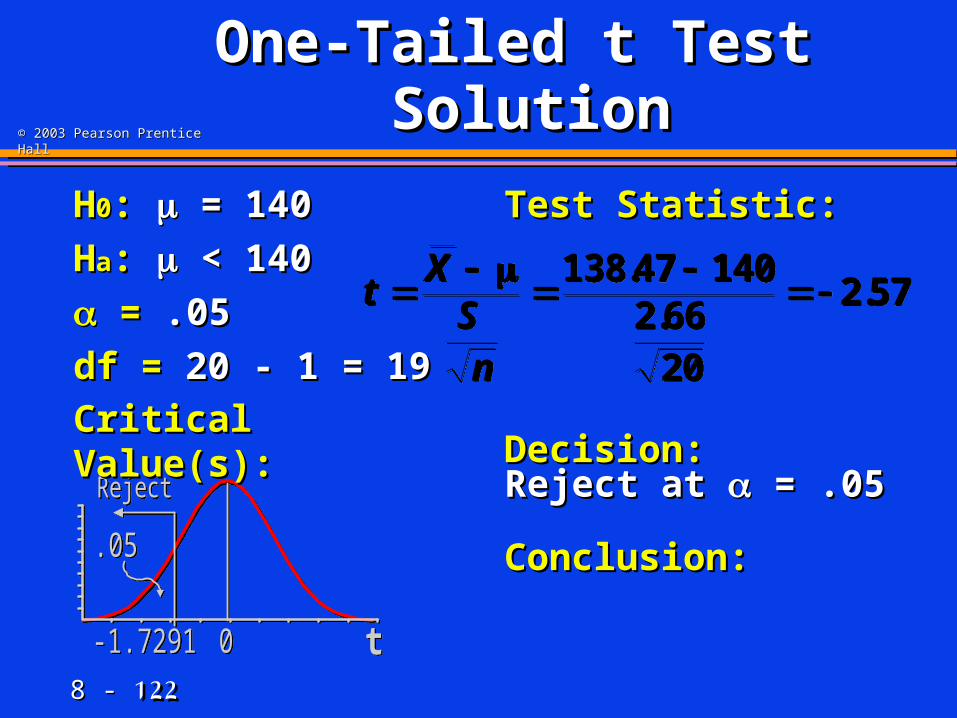
tX
Sn
138 47 140
2 6620
2 57.
..t
XSn
138 47 140
2 6620
2 57.
..
8 - 8 - 122122
© 2003 Pearson Prentice Hall© 2003 Pearson Prentice Hall
t0-1.7291
.05
Reject
t0-1.7291
.05
Reject
One-Tailed t Test One-Tailed t Test SolutionSolution
HH00: : = 140 = 140
HHaa: : < 140 < 140
= = .05.05
df = df = 20 - 1 = 1920 - 1 = 19
Critical Value(s):Critical Value(s):
Test Statistic: Test Statistic:
Decision:Decision:
Conclusion:Conclusion:
tX
Sn
138 47 140
2 6620
2 57.
..t
XSn
138 47 140
2 6620
2 57.
..
Reject at Reject at = .05 = .05
8 - 8 - 123123
© 2003 Pearson Prentice Hall© 2003 Pearson Prentice Hall
t0-1.7291
.05
Reject
t0-1.7291
.05
Reject
One-Tailed t Test One-Tailed t Test SolutionSolution
HH00: : = 140 = 140
HHaa: : < 140 < 140
= = .05.05
df = df = 20 - 1 = 1920 - 1 = 19
Critical Value(s):Critical Value(s):
Test Statistic: Test Statistic:
Decision:Decision:
Conclusion:Conclusion:
tX
Sn
138 47 140
2 6620
2 57.
..t
XSn
138 47 140
2 6620
2 57.
..
Reject at Reject at = .05 = .05
There is evidence pop. There is evidence pop. average is less than 140average is less than 140
8 - 8 - 124124
© 2003 Pearson Prentice Hall© 2003 Pearson Prentice Hall
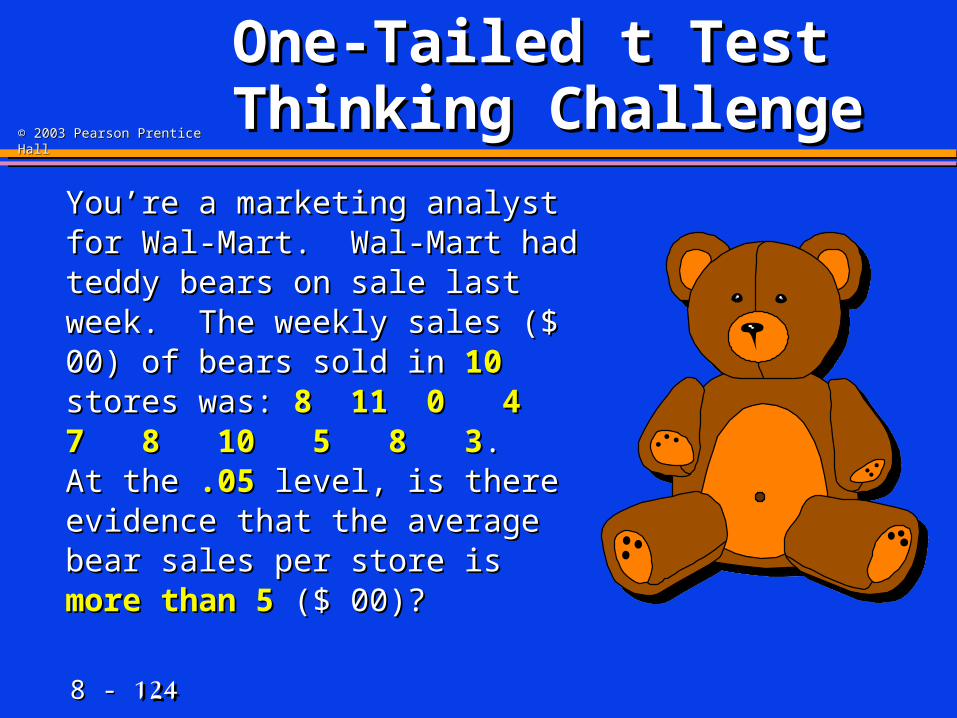
One-Tailed t TestOne-Tailed t Test Thinking Challenge Thinking Challenge
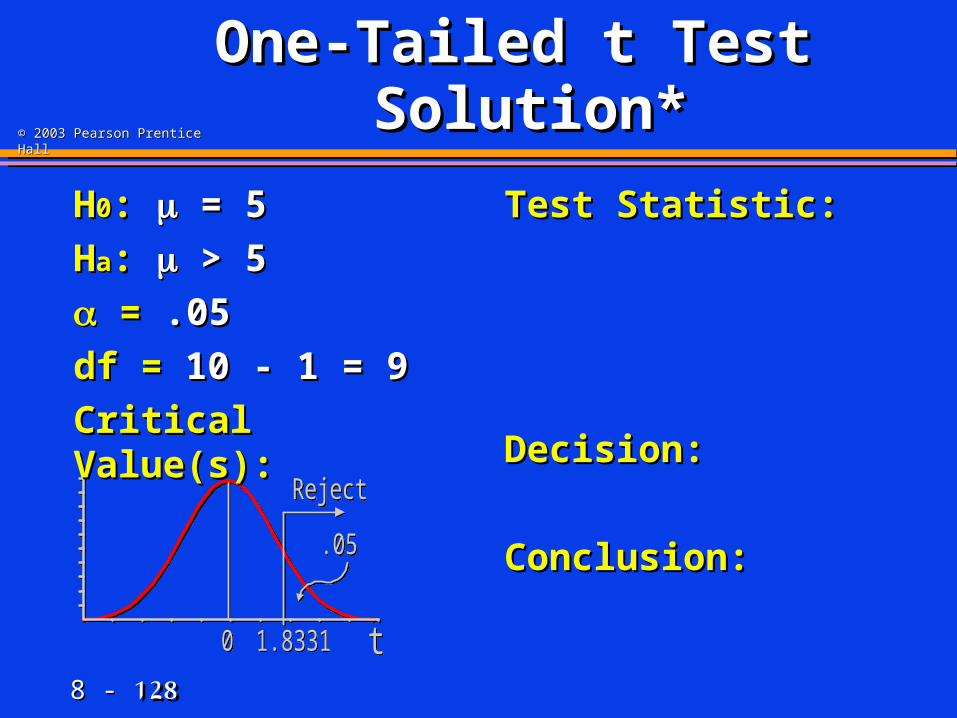
You’re a marketing analyst for You’re a marketing analyst for Wal-Mart. Wal-Mart had teddy Wal-Mart. Wal-Mart had teddy bears on sale last week. The bears on sale last week. The weekly sales ($ 00) of bears weekly sales ($ 00) of bears sold in sold in 1010 stores was: stores was: 8 11 0 8 11 0 4 7 8 10 5 8 34 7 8 10 5 8 3. . At the At the .05.05 level, is there level, is there evidence that the average bear evidence that the average bear sales per store is sales per store is moremore thanthan 5 5 ($ 00)?($ 00)?

8 - 8 - 125125
© 2003 Pearson Prentice Hall© 2003 Pearson Prentice Hall
One-Tailed t Test One-Tailed t Test Solution*Solution*
HH00: :
HHaa: :
= =
df = df =
Critical Value(s):Critical Value(s):
Test Statistic: Test Statistic:
Decision:Decision:
Conclusion:Conclusion:
8 - 8 - 126126
© 2003 Pearson Prentice Hall© 2003 Pearson Prentice Hall
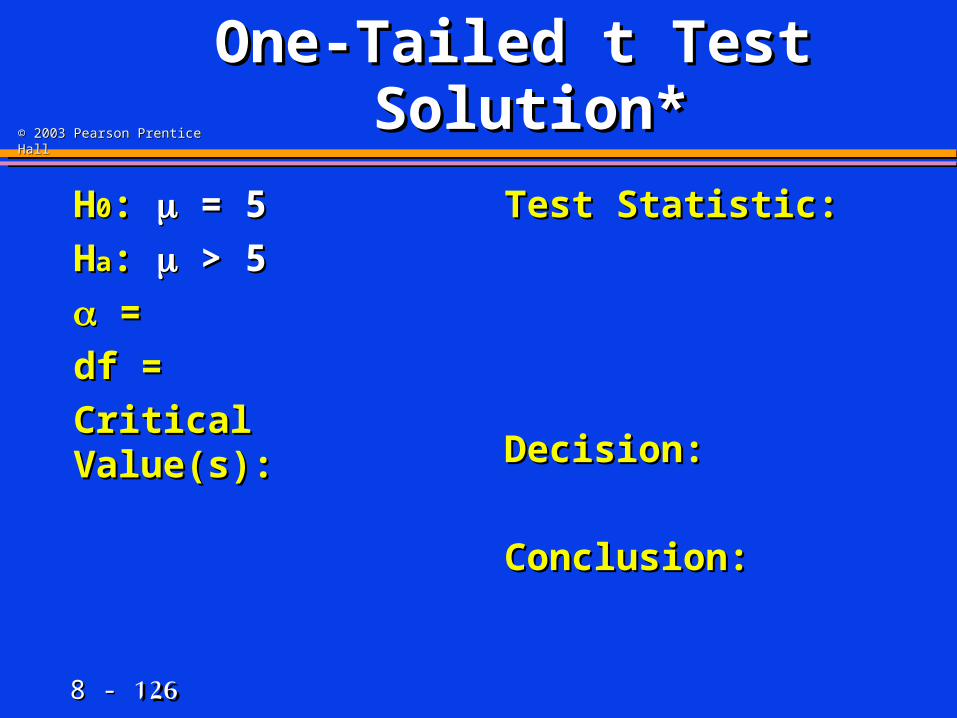
One-Tailed t Test One-Tailed t Test Solution*Solution*
HH00: : = 5 = 5
HHaa: : > 5 > 5
= =
df =df =
Critical Value(s):Critical Value(s):
Test Statistic: Test Statistic:
Decision:Decision:
Conclusion:Conclusion:
8 - 8 - 127127
© 2003 Pearson Prentice Hall© 2003 Pearson Prentice Hall
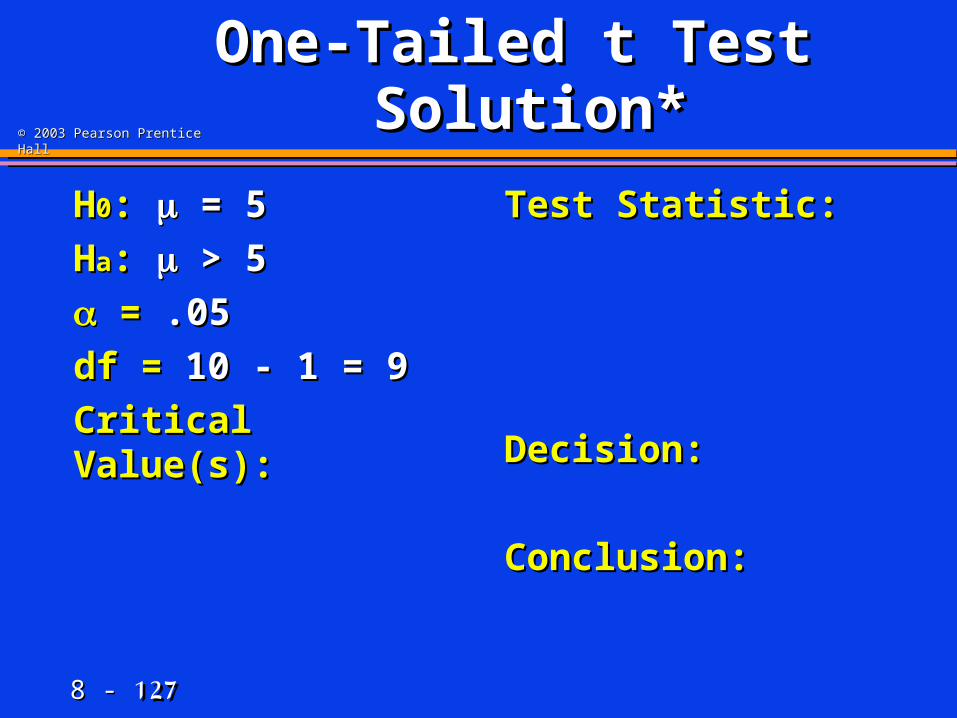
One-Tailed t Test One-Tailed t Test Solution*Solution*
HH00: : = 5 = 5
HHaa: : > 5 > 5
= = .05.05
df = df = 10 - 1 = 910 - 1 = 9
Critical Value(s):Critical Value(s):
Test Statistic: Test Statistic:
Decision:Decision:
Conclusion:Conclusion:
8 - 8 - 128128
© 2003 Pearson Prentice Hall© 2003 Pearson Prentice Hall
t0 1.8331
.05
Reject
t0 1.8331
.05
Reject
One-Tailed t Test One-Tailed t Test Solution*Solution*
HH00: : = 5 = 5
HHaa: : > 5 > 5
= = .05.05
df = df = 10 - 1 = 910 - 1 = 9
Critical Value(s):Critical Value(s):
Test Statistic: Test Statistic:
Decision:Decision:
Conclusion:Conclusion:
8 - 8 - 129129
© 2003 Pearson Prentice Hall© 2003 Pearson Prentice Hall
t0 1.8331
.05
Reject
t0 1.8331
.05
Reject
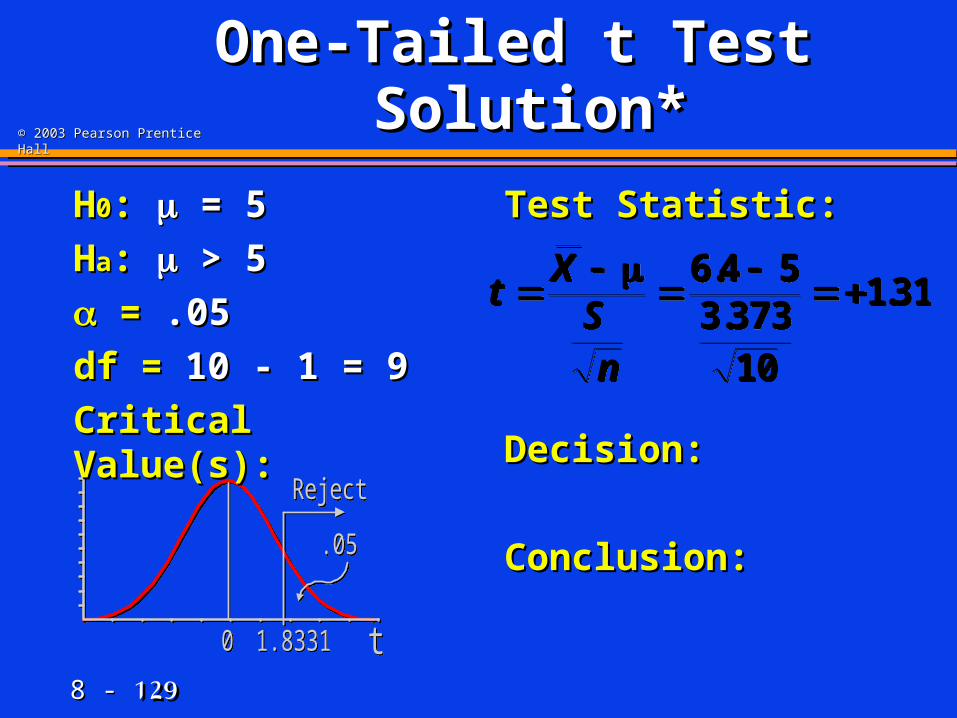
One-Tailed t Test One-Tailed t Test Solution*Solution*
HH00: : = 5 = 5
HHaa: : > 5 > 5
= = .05.05
df = df = 10 - 1 = 910 - 1 = 9
Critical Value(s):Critical Value(s):
Test Statistic: Test Statistic:
Decision:Decision:
Conclusion:Conclusion:
tX
Sn
6 4 5
3 37310
131..
.tX
Sn
6 4 5
3 37310
131..
.
8 - 8 - 130130
© 2003 Pearson Prentice Hall© 2003 Pearson Prentice Hall
t0 1.8331
.05
Reject
t0 1.8331
.05
Reject
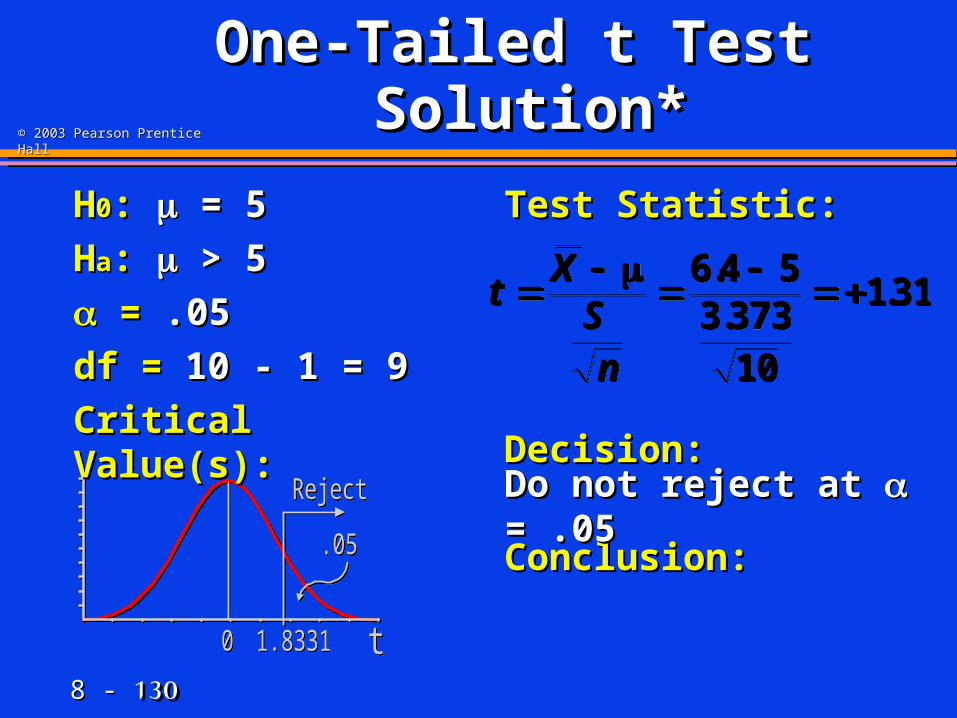
One-Tailed t Test One-Tailed t Test Solution*Solution*
HH00: : = 5 = 5
HHaa: : > 5 > 5
= = .05.05
df = df = 10 - 1 = 910 - 1 = 9
Critical Value(s):Critical Value(s):
Test Statistic: Test Statistic:
Decision:Decision:
Conclusion:Conclusion:
tX
Sn
6 4 5
3 37310
131..
.tX
Sn
6 4 5
3 37310
131..
.
Do not reject at Do not reject at = .05 = .05
8 - 8 - 131131
© 2003 Pearson Prentice Hall© 2003 Pearson Prentice Hall
t0 1.8331
.05
Reject
t0 1.8331
.05
Reject
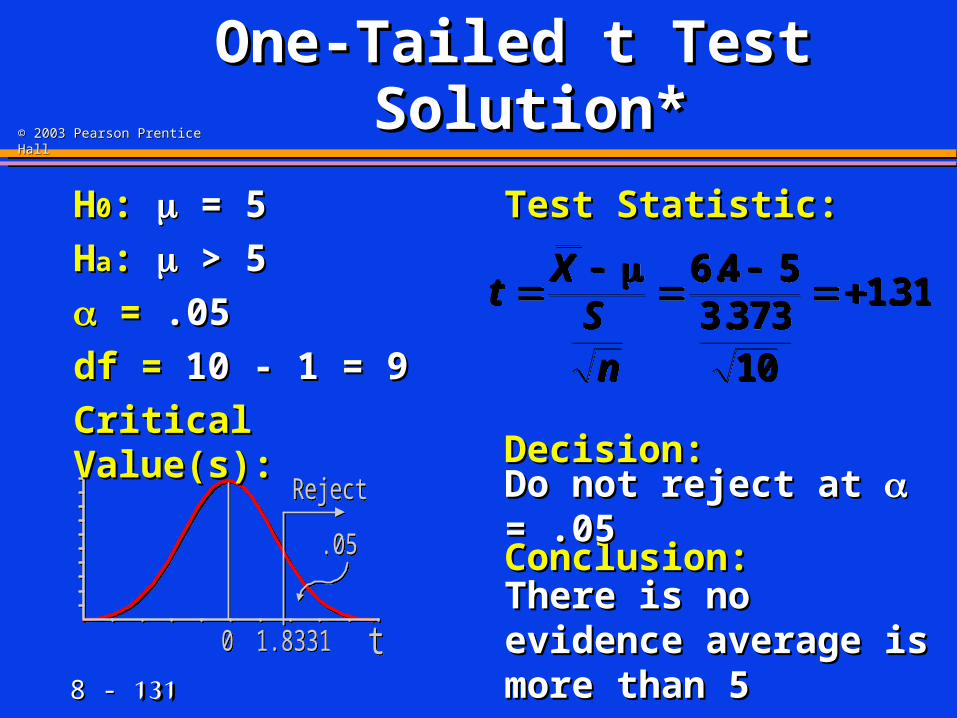
One-Tailed t Test One-Tailed t Test Solution*Solution*
HH00: : = 5 = 5
HHaa: : > 5 > 5
= = .05.05
df = df = 10 - 1 = 910 - 1 = 9
Critical Value(s):Critical Value(s):
Test Statistic: Test Statistic:
Decision:Decision:
Conclusion:Conclusion:
tX
Sn
6 4 5
3 37310
131..
.tX
Sn
6 4 5
3 37310
131..
.
Do not reject at Do not reject at = .05 = .05
There is no evidence There is no evidence average is more than 5average is more than 5
8 - 8 - 132132
© 2003 Pearson Prentice Hall© 2003 Pearson Prentice Hall
One Population One Population TestsTests
OnePopulation
Z Test(1 & 2tail)
t Test(1 & 2tail)
Z Test(1 & 2tail)
Mean Proportion Variance
2 Test(1 & 2tail)
OnePopulation
Z Test(1 & 2tail)
t Test(1 & 2tail)
Z Test(1 & 2tail)
Mean Proportion Variance
2 Test(1 & 2tail)
8 - 8 - 133133
© 2003 Pearson Prentice Hall© 2003 Pearson Prentice Hall
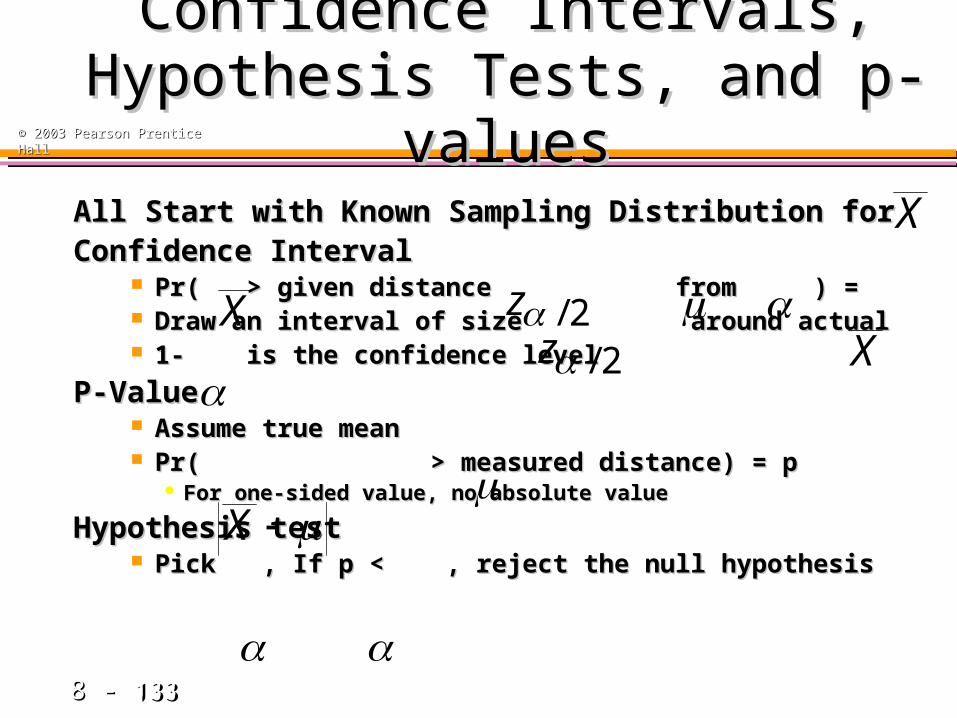
Confidence Intervals, Confidence Intervals, Hypothesis Tests, and p-Hypothesis Tests, and p-
valuesvaluesAll Start with Known Sampling Distribution forAll Start with Known Sampling Distribution forConfidence IntervalConfidence Interval
Pr( > given distance from ) = Pr( > given distance from ) = Draw an interval of size around actualDraw an interval of size around actual 1- is the confidence level1- is the confidence level
P-ValueP-Value Assume true mean Assume true mean Pr( > measured distance) = pPr( > measured distance) = p
For one-sided value, no absolute valueFor one-sided value, no absolute value
Hypothesis testHypothesis test Pick , If p < , reject the null hypothesisPick , If p < , reject the null hypothesis
X
X 2/zX
X
2/z
8 - 8 - 134134
© 2003 Pearson Prentice Hall© 2003 Pearson Prentice Hall
Calculating Type II Calculating Type II Error ProbabilitiesError Probabilities

8 - 8 - 135135
© 2003 Pearson Prentice Hall© 2003 Pearson Prentice Hall
Power of TestPower of Test
1.1. Probability of Rejecting False HProbability of Rejecting False H00
Correct DecisionCorrect Decision
2.2. Designated 1 - Designated 1 -
3.3. Used in Determining Test AdequacyUsed in Determining Test Adequacy
4.4. Affected byAffected by True Value of Population ParameterTrue Value of Population Parameter Significance Level Significance Level Standard Deviation & Sample Size Standard Deviation & Sample Size nn
8 - 8 - 136136
© 2003 Pearson Prentice Hall© 2003 Pearson Prentice Hall
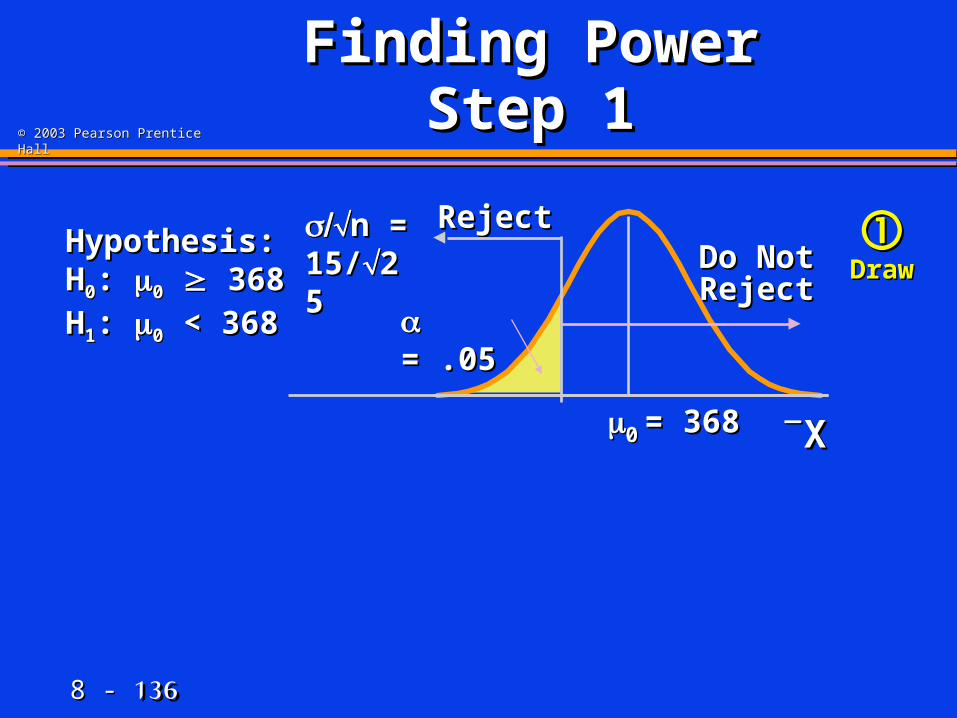
XX00 = 368= 368
RejectRejectDo NotDo NotRejectReject
Finding PowerFinding PowerStep 1Step 1
Hypothesis:Hypothesis:HH00: : 00 368 368
HH11: : 00 < 368 < 368 = .05= .05
n =n =15/15/2525
DrawDraw
8 - 8 - 137137
© 2003 Pearson Prentice Hall© 2003 Pearson Prentice Hall
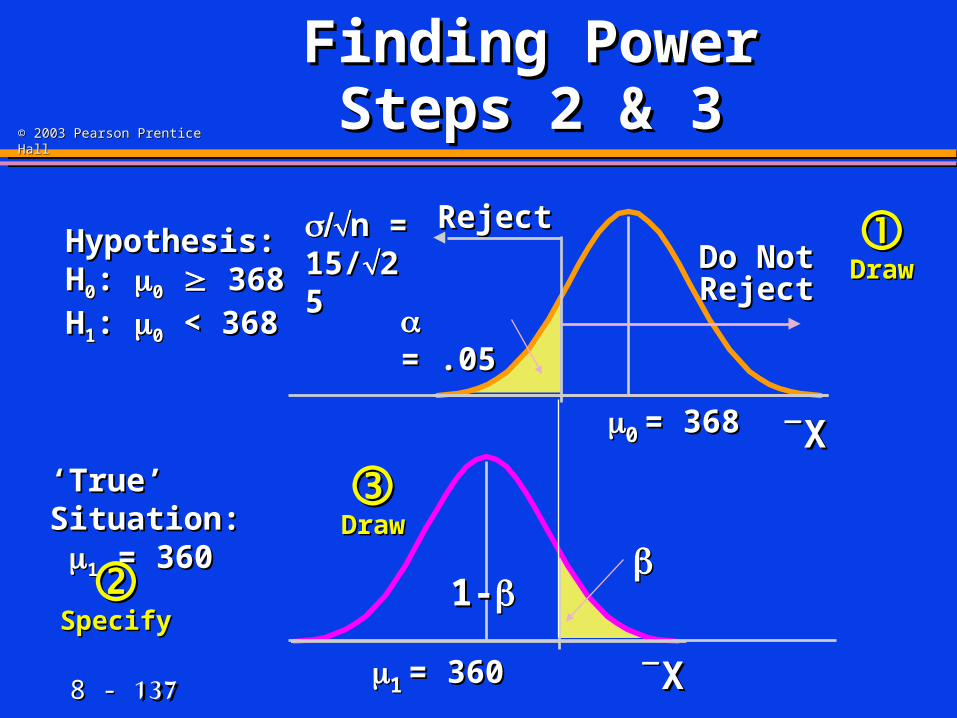
XX11 = 360= 360
XX00 = 368= 368
RejectRejectDo NotDo NotRejectReject
Finding PowerFinding PowerSteps 2 & 3Steps 2 & 3
Hypothesis:Hypothesis:HH00: : 00 368 368
HH11: : 00 < 368 < 368
‘‘True’ Situation:True’ Situation: 11 = 360 = 360
= .05= .05
n =n =15/15/2525
DrawDraw
DrawDraw
SpecifySpecify
1-1-
8 - 8 - 138138
© 2003 Pearson Prentice Hall© 2003 Pearson Prentice Hall
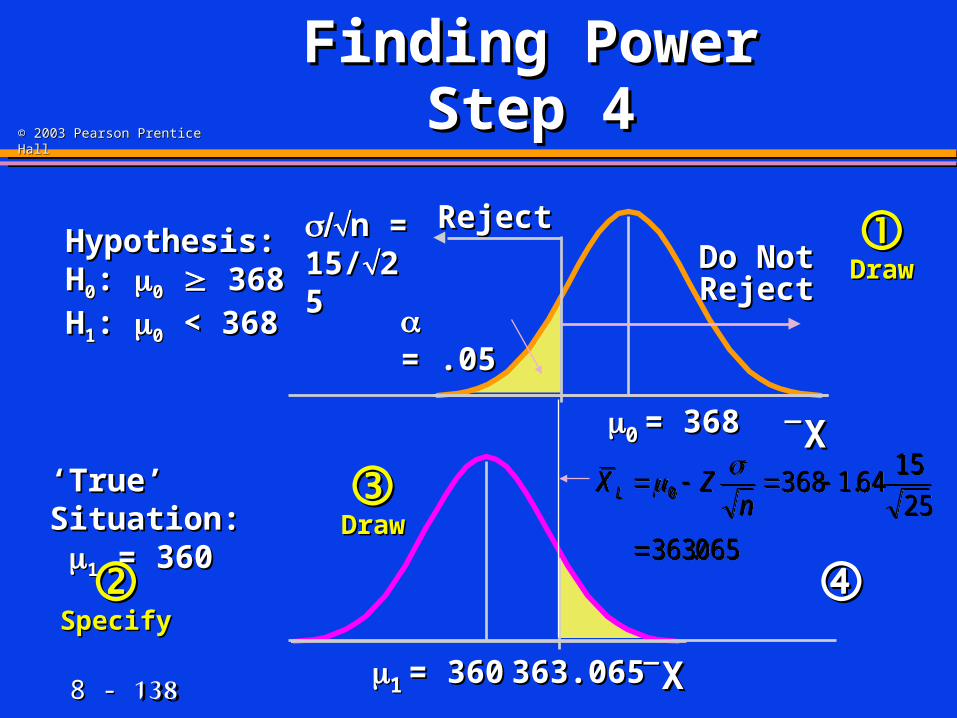
XX11 = 360= 360 363.065363.065
XX00 = 368= 368
RejectRejectDo NotDo NotRejectReject
Finding PowerFinding PowerStep 4Step 4
Hypothesis:Hypothesis:HH00: : 00 368 368
HH11: : 00 < 368 < 368
‘‘True’ Situation:True’ Situation: 11 = 360 = 360
065.363
25
1564.13680
n
ZX L
065.363
25
1564.13680
n
ZX L
= .05= .05
n =n =15/15/2525
DrawDraw
DrawDraw
SpecifySpecify
8 - 8 - 139139
© 2003 Pearson Prentice Hall© 2003 Pearson Prentice Hall
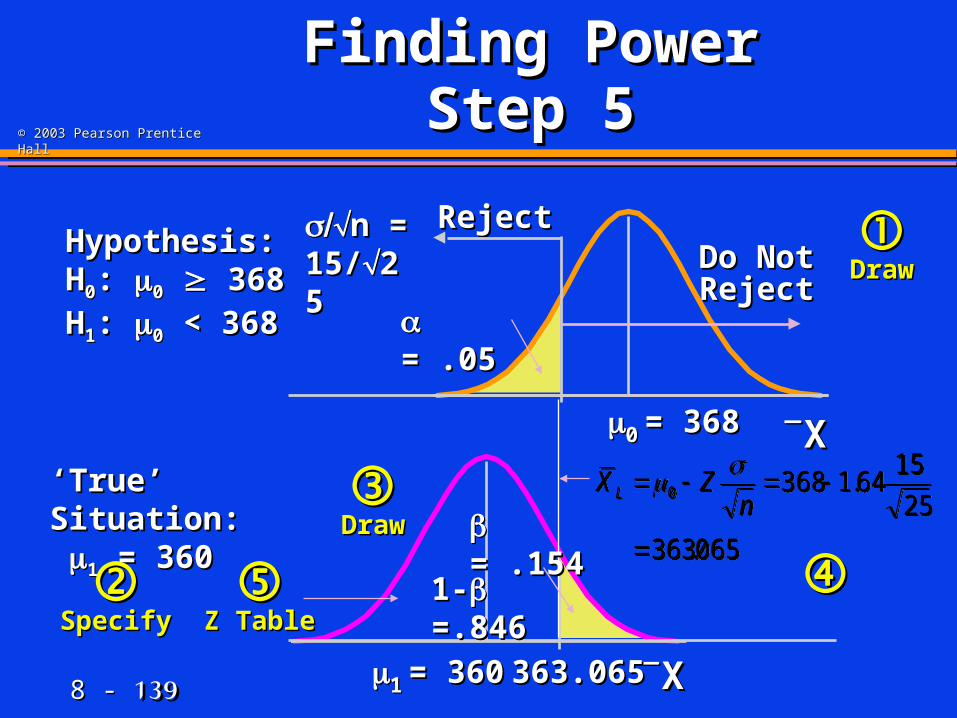
XX11 = 360= 360 363.065363.065
XX00 = 368= 368
RejectRejectDo NotDo NotRejectReject
Finding PowerFinding PowerStep 5Step 5
Hypothesis:Hypothesis:HH00: : 00 368 368
HH11: : 00 < 368 < 368
‘‘True’ Situation:True’ Situation: 11 = 360 = 360
= .05= .05
n =n =15/15/2525
= .154= .154
1-1- =.846 =.846
DrawDraw
DrawDraw
SpecifySpecify
Z TableZ Table
065.363
25
1564.13680
n
ZX L
065.363
25
1564.13680
n
ZX L
8 - 8 - 140140
© 2003 Pearson Prentice Hall© 2003 Pearson Prentice Hall
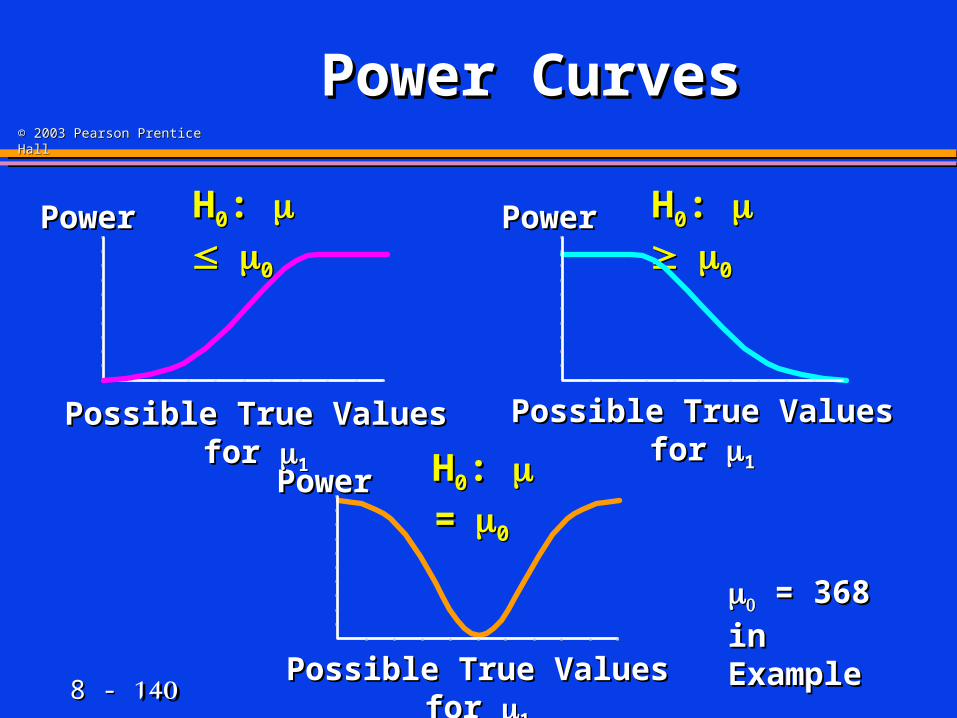
Power CurvesPower Curves
PowerPower PowerPower
PowerPower
Possible True Values for Possible True Values for 11 Possible True Values for Possible True Values for 11
Possible True Values for Possible True Values for 11
HH00: : 00 HH00: : 00
HH00: : = =00
= 368 in = 368 in
ExampleExample
8 - 8 - 141141
© 2003 Pearson Prentice Hall© 2003 Pearson Prentice Hall
ConclusionConclusion
1.1. Distinguished Types of Hypotheses Distinguished Types of Hypotheses
2.2. Described Hypothesis Testing ProcessDescribed Hypothesis Testing Process
3.3. Explained p-Value ConceptExplained p-Value Concept
4.4. Solved Hypothesis Testing Problems Solved Hypothesis Testing Problems Based on a Single SampleBased on a Single Sample
5.5. Explained Power of a TestExplained Power of a Test

End of Chapter
Any blank slides that follow are blank intentionally.