79e4150a1090eca7a0
TRANSCRIPT

ELSEVIER
Extraction of Vegetation Biophysical Parameters by Inversion of the PROSPECT + SAIL Models on Sugar Beet Canopy Reflectance Data. Application to TM and AVIRIS Sensors
S. Jacquemoud,*'** F. Baret,* B. Andrieu,* F. M. Danson, ~ and K. Jaggard**
T h e PROSPECT leaf optical properties and SAIL canopy reflectance models were coupled and inverted using a set of 96 AVIRIS (Airborne Visible~Infrared Imaging Spectrometer) equivalent spectra gathered in afield exper- iment on sugar beet plots expressing a large range in leaf area index, chlorophyll concentration, and soil color. In a first attempt, the model accurately reproduced the spectral reflectance of vegetation, using six variables: chlorophyll a + b concentration (C~), water depth (Cw), leaf mesophyll structure parameter (N), leaf area index (LAI), mean leaf inclination angle (0 O, and hot-spot size parameter (s). The four structural parameters (N, LAI, 01, and s) were poorly estimated, indicating instability in the inversion process; however, the two biochemical parameters (Cab and Cw) were evaluated reasonably well, except over very bright soils. In a second attempt, three of the four structure variables were assigned a fixed value
*Joint Research Centre, Institute for Remote Sensing Applica- tions, Advanced Techniques, Ispra, Italy
t lnstitut National de la Recherche Agronomique, Station de Bioclimatologie, Montfavet, France
*Institut National de la Recherche Agronomique, Station de Bioclimatologie, Thiverval Grignon, France
§ University of Salford, Department of Geography, Salford, United Kingdom
**Brooms Barn Experimental Station, Higham, Bury St. Ed- munds, Suffolk, United Kingdom
,t Permanent affiliation: LAMP / OPGC, Universit6 Blaise Pascal, Aubi~re, France.
Address correspondence to Stephane Jacquemoud, Univ, of Cali- fornia, Dept. of Land, Air, and Water Resources, Davis, CA 95616.
Received 28 June 1994; accepted 24 December 1994.
REMOTE SENS. ENVIRON. 52:163-172 (1995) ©Elsevier Science Inc., 1995 655 Avenue of the Americas, New York, NY 10010
corresponding to the average observed in the experiment. Inversions performed to retrieve the remaining structure variable, leaf area index, and the two biochemical vari- ables showed large improvements in the accuracy of LAI, but slightly poorer performance for Ca~ and Cw. Here again, poor results were obtained with very bright soils. The compensations observed between the LAI and C~ or Cw led us to evaluate the performance of two more- synthetic variables, canopy chlorophyll content or canopy water content; for these the inversions produced reason- able estimates. The application of this approach to Land- sat TM (Thematic Mapper) data provided similar results, both for the spectrum reconstruction capability and for the retrieval of canopy biophysical characteristics.
INTRODUCTION
The retrieval of the Earth's surface properties from remote sensing data is a long-term research goal, given the multiplicity of information sources and the complex- ity of the phenomena brought into play (Verstraete et al., 1994). The last 10 years have been characterized by the development and intensive use of empirical or semiempirical methods to relate simple vegetation indi- ces to single, biophysical characteristics of canopies such as the leaf area index (LAI) or the absorbed fraction of photosynthetically active radiation. These vegetation indices are combinations of the reflectances or radiances
0034-4257 / 95 / 9.50 SSDI 0034-4257(95)00018-V

164 Jacquemoud et al.
observed in several broad wavelength bands. The lim- ited use of physical principles in the construction of these indices has restricted their robustness and porta- bility to targets and conditions similar to those that prevailed during the original experiments. Thus, inver- sion of canopy reflectance models that incorporate cur- rent understanding of the radiative transfer inside cano- pies seems to be an attractive and alternative approach (Myneni and Ross, 1991).
The process of inverting a model means determining those parameters that minimize the differences between the measured and simulated data. In remote sensing studies, such an approach has been applied to infer properties of the atmosphere and terrestrial targets such as soil, vegetation, or water areas. In plant canopy stud- ies, most effort has concentrated on the use of direc- tional reflectance data which were already available. It is very important to choose an appropriate model;for example, the reflectance properties of homogeneous and heterogeneous (row, sparse or mixed crops) canopies are seldom governed by the same equations. Also, some models may be incapable of providing the information which is required about the reflecting surface. Goel (1987) distinguished several types of plant canopy re- flectance model, some of which have been inverted. Thus Goel and Thompson (1984a, b) and Deering et al. (1992) retrieved the LAI and, less accurately, the mean leaf inclination angle by inverting, respectively, the SAIL (Verhoef, 1984; 1985) and TRIM (Goel, 1989) models using directional data. However, to do this, they had to know the leaf reflectance and transmittance, soil reflectance, and the fraction of solar radiation which was diffuse. Otterman (1987) assumed canopy structure and inverted a protrusion model to determine the leaf reflectance for several wavelength bands and zenith view angles. Later, the same author (Otterman, 1990) tried to infer the leaf orientation as well, but found difficulty separating leaf reflectance from leaf orienta- tion or LAI. Pinty et al. (1990; 1991), Kuusk (1991b), and Privette et al. (1994) estimated the leaf optical properties as well as the spatial distribution of scatterers in the canopy by inverting analytical models of bidirec- tional reflectance. All these studies have been performed using data acquired at ground level because such direc- tional measurements cannot be easily collected at the same date by current satellite sensors. Multitemporal data may be used, but this implies that the target does not change from one measurement to another and that corrections for atmospheric disturbances can be applied with great accuracy.
Following these attempts to retrieve surface charac- teristics by inversion of radiative transfer models on directional data, the introduction of high spectral resolu- tion sensors has contributed to the development of similar methods to extract information from reflectance spectra. A spectra matching technique was applied by
Gao and Goetz (1990) with a simple model to the 1.5-1.74/~m region of AVIRIS spectra; these authors asserted that the vegetation spectrum in this wavelength region was driven by liquid water and dry vegetation components. However, this work has not been thor- oughly validated. Schmuck et al. (1993) described the vegetation reflectance with a Kubelka-Munk formula containing chlorophyll a + b and water specific absorp- tion coefficients; this model was used to measure the residues at 1.7/~m, thought to be a signature of the canopy biochemical components. In a theoretical study based on simulated spectra, Jacquemoud (1993) tried to evaluate the use of AVIRIS data for determining canopy biophysical properties of agronomic interest [leaf mesophyll structure (N), chlorophyll a + b concentration (Cab), water depth (Cw), leaf area index (LAI), and mean leaf inclination angle (0t)] by inversion of the PROS- PECT leaf optical properties model (Jacquemoud and Baret, 1990) coupled with the SAIL canopy reflectance model: Chlorophyll and water seemed to be obtained with good accuracy, but it was difficult to separate LAI from Or. Here, again, a validation was needed. Kuusk (1994) was the first to attempt to invert his fast canopy reflectance (FCR) model both on directional and spec- tral data. Results from soybean and corn crops were promising; they offer new prospects to interpret remote sensing measurements acquired by current satellites.
Already, several conclusions can be drawn from these studies. First, inverting a canopy reflectance model on remote sensing data is not easy: operational use of this approach requires a compromise between simple equations that cannot take into account the multiple scattering due to canopy architecture (distortion of the biochemical signal), and complex models whose inver- sion is difficult and time-consuming. Second, the inter- dependence of some parameters prevents them from being extracted separately. Third, with current sensors it is not possible to acquire enough reflectance data to describe the bidirectional and spectral features of plant canopies. Thus, the radiometric information to invert models is often restricted. Finally, measurement of the spectral variation of canopy reflectance at a given time and location is, from a technological point of view, the easiest way to get radiometric information from a satel- lite or airborne platform. Therefore, most of this article will focus on the use of spectral information.
The main aim is to evaluate the possibility of in- fering canopy biophysical variables by inversion of a simple radiative transfer model using canopy reflectance spectra acquired in the field with a high spectral resolu- tion radiometer. Before discussing the scope of the model to provide valuable information on vegetation, the field experiment is described, and the choice of model and of inversion procedure is justified. A basic criticism of the use of high spectral resolution is the large redundancy of data amongst the many narrow,
Inversion of PROSPECT and SAIL Models 165
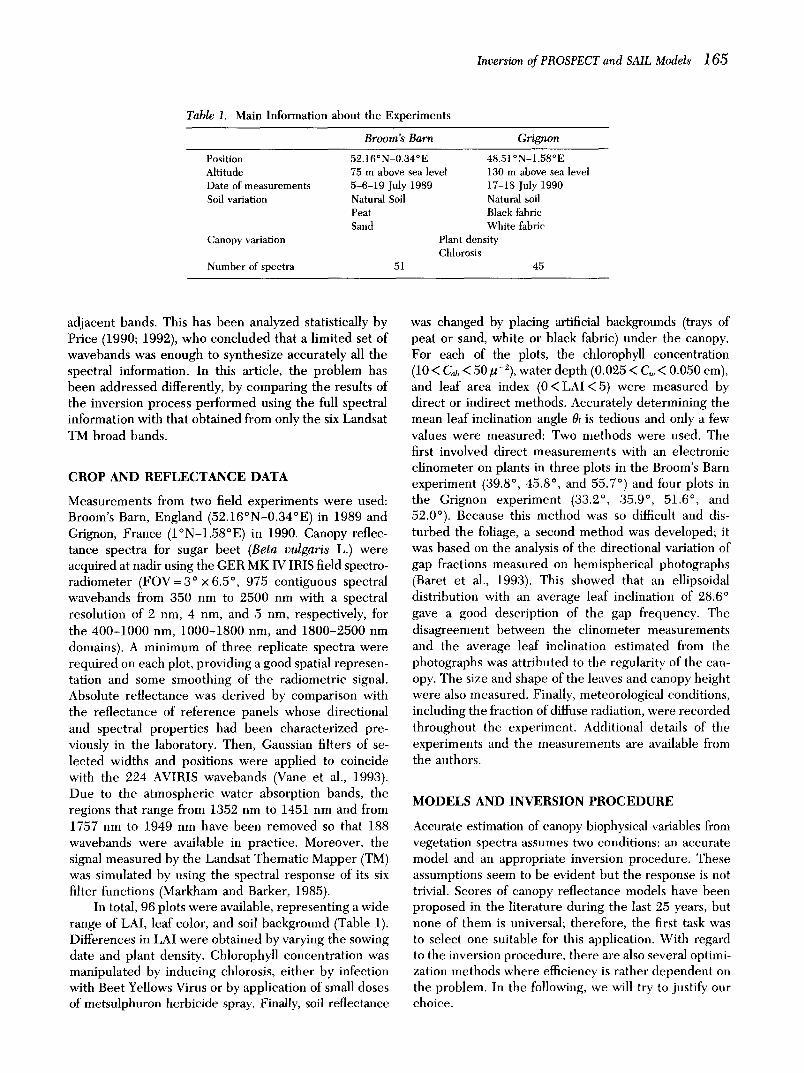
Table 1. Main Information about the Experiments
Broom's Barn Grignon
Position 52.16 ° N-0.34 °E 48.51 ° N-1.58 °E Altitude 75 m above sea level 130 m above sea level Date of measurements 5-6-19 July 1989 17-18 July 1990 Soil variation Natural Soil Natural soil
Peat Black fabric Sand White fabric
Canopy variation Plant density Chlorosis
Number of spectra 51 45
adjacent bands. This has been analyzed statistically by Price (1990; 1992), who concluded that a limited set of wavebands was enough to synthesize accurately all the spectral information. In this article, the problem has been addressed differently, by comparing the results of the inversion process performed using the full spectral information with that obtained from only the six Landsat TM broad bands.
CROP A N D R E F L E C T A N C E DATA
Measurements from two field experiments were used: Broom's Barn, England (52.16°N-0.34°E) in 1989 and Grignon, France ( l °N-1 .58°E) in 1990. Canopy reflec- tance spectra for sugar beet (Beta vulgaris L.) were acquired at nadir using the GER MK IV IRIS field spectro- radiometer (FOV=3 ° x6.5 °, 975 contiguous spectral wavebands from 350 nm to 2500 nm with a spectral resolution of 2 nm, 4 nm, and 5 nm, respectively, for the 400-1000 nm, 1000-1800 nm, and 1800-2500 nm domains). A minimum of three replicate spectra were required on each plot, providing a good spatial represen- tation and some smoothing of the radiometric signal. Absolute reflectance was derived by comparison with the reflectance of reference panels whose directional and spectral properties had been characterized pre- viously in the laboratory. Then, Gaussian filters of se- lected widths and positions were applied to coincide with the 224 AVIRIS wavebands (Vane et al., 1993). Due to the atmospheric water absorption bands, the regions that range from 1352 nm to 1451 nm and from 1757 nm to 1949 nm have been removed so that 188 wavebands were available in practice. Moreover, the signal measured by the Landsat Thematic Mapper (TM) was simulated by using the spectral response of its six filter functions (Markham and Barker, 1985).
In total, 96 plots were available, representing a wide range of LAI, leaf color, and soil background (Table 1). Differences in LAI were obtained by varying the sowing date and plant density. Chlorophyll concentration was manipulated by inducing chlorosis, either by infection with Beet Yellows Virus or by application of small doses of metsulphuron herbicide spray. Finally, soil reflectance
was changed by placing artificial backgrounds (trays of peat or sand, white or black fabric) under the canopy. For each of the plots, the chlorophyll concentration (10 < Cab < 50/~-2), water depth (0.025 < Cw < 0.050 cm), and leaf area index (0< LAI < 5) were measured by direct or indirect methods. Accurately determining the mean leaf inclination angle 0t is tedious and only a few values were measured: Two methods were used. The first involved direct measurements with an electronic clinometer on plants in three plots in the Broom's Barn experiment (39.8 ° , 45.8 ° , and 55.7 ° ) and four plots in the Grignon experiment (33.2 °, 35.9 °, 51.6 °, and 52.0°). Because this method was so difficult and dis- turbed the foliage, a second method was developed; it was based on the analysis of the directional variation of gap fractions measured on hemispherical photographs (Baret et al., 1993). This showed that an ellipsoidal distribution with an average leaf inclination of 28.6 ° gave a good description of the gap frequency. The disagreement between the clinometer measurements and the average leaf inclination estimated from the photographs was attributed to the regularity of the can- opy. The size and shape of the leaves and canopy height were also measured. Finally, meteorological conditions, including the fraction of diffuse radiation, were recorded throughout the experiment. Additional details of the experiments and the measurements are available from the authors.
MODELS AND INVERSION P R O C E D U R E
Accurate estimation of canopy biophysical variables from vegetation spectra assumes two conditions: an accurate model and an appropriate inversion procedure. These assumptions seem to be evident but the response is not trivial. Scores of canopy reflectance models have been proposed in the literature during the last 25 years, but none of them is universal; therefore, the first task was to select one suitable for this application. With regard to the inversion procedure, there are also several optimi- zation methods where efficiency is rather dependent on the problem. In the following, we will try to justify our choice.

166 1acquemoud et al.
The Models The basic model chosen was the PROSPECT + SAIL model described in details by Jacquemoud (1993). In the SAIL model, the canopy is considered as an horizontal, homogeneous, and infinitely extended vegetation layer made up of Lambertian scatterers (leaves) randomly distributed. The azimuth angle of the scatterers is as- sumed to be randomly distributed, while their zenith angle follows an ellipsoidal distribution characterized by a mean leaf inclination angle 01. Although it uses a simple description of canopy structure and a rough approximation of the radiative transfer equation, the SAIL model has already been tested with success on soybean (Goel and Thompson, 1984a,b) and maize (Ma- jor et al., 1992). However, the original SAIL model cannot reproduce properly the behavior of canopy re- flectance, especially in the hot spot, the cone where the solar and viewing directions are close together. In this cone, reflectance is increased, and, to take account of this, the SAIL model was modified by Kuusk (1991a), introducing the hot-spot size parameter (s) defined as s = L / H , where L is the horizontal correlation length that depends on the mean size and shape of the leaves and H is the canopy height. The hot-spot size parameter is approximately 0.5 for sugarbeet crops (Looyen et al., 1991). Leaf reflectance and transmittance were derived from the PROSPECT model (Jacquemoud and Baret, 1990), which idealizes the leaf as a stack of N identical elementary layers defined by their refractive index and an absorption coefficient. For simplicity, only chloro- phyll and water were explicitly taken into account, and they were assumed to be distributed homogeneously in the leaf.
The measurement configuration is defined by the zenith (O0) and azimuth (po) viewing angles, the solar zenith angle (0~), and the fraction of diffuse radiation. The latter can be replaced by the horizontal visibility (VIS), a single parameter which is not wavelength-de- pendent. VIS was inferred from a look-up table built using the 5S model (Tanr6 et al., 1990), where the entry was the fraction of diffuse radiation measured in a few wavebands during the experiments. In brief, the PROS- PECT + SAIL model (Fig. 1) computes canopy reflec- tance spectra from the following parameters:
• Canopy biophysical parameters: chlorophyll a + b concentration C~b (/lg cm-2), water depth C~ (cm), leaf mesophyll structure N, leaf area index LAI, mean leaf inclination angle 0l (o), and hot-spot size parameter s.
• Soil spectral reflectance p~().), which is assumed to be Lambertian.
• External parameters: zenith 00 (°) and azimuth p0 (o) viewing angles, zenith solar angle 0~ (°), and horizontal visibility VIS.
LEAF CHARACTERISTICS
N, Cab, C*
PROSPECT
STRUCTURE LAI,el, s Reflectance
CANOPY REFLECTANCE
MEASUREMENT CHARACTERISTICS
VIEW AND SUN GEOMETRIES DIFFUSE FRACTION
450-2500nm
Figure 1. Schematic representation of the PROS- PECT + SAIL canopy reflectance model.
The effects of C~b, Cw, N, LAI, and Ot on canopy spectral reflectance can be found in Jacquemoud (1993); addi- tional simulations have been performed to test the in- fluence of s on the directional and spectral reflectance. Figure 2a shows a pronounced effect on reflectance as a function of the zenith viewing angle in the principal plane. A variation of the hot-spot size parameter from 0 to 1 induces an increase of the width of the hot spot and also a general increase of the canopy reflectance. Figure 2b shows, for a fixed zenith viewing angle of 0 °, the spectral effects of s: As observed with LAI and the mean leaf angle (Jacquemoud, 1993), the impact of s is particularly important in the near-infrared but also in the other optical domains. At this point, this model can be regarded as a compromise between the exact theory of radiative transfer, which may be too complicated for routine calculations or inverse problems, and simplified equations, which may be too unrealistic.
The Inversion Procedure A model allows the simulation of a physical phenomenon by using mathematical equations, and it should be vali-
Figure 2. Variations of canopy reflectance simulated by the PROSPECT + SAIL model as a function of the hot-spot size parameter: s = 0 (lower line), 0.05, 0.2, 0.33 (dotted line), 0.5, 1 (upper line): a) angle dependency at 804.25 nm; b) wavelength dependency at 0s = 40 ° and (90 = 0 °. The mean set of parameters is: N= 1.5, Cab = 32/tg cm-~, C~ = 0.0255 cm, LAI=3, 01=58 °, and VIS=40 km.
0.8
w O . 7 0
~ 0 . 6
d u.i
~0 .5
0 . 4
804.25 nm
-100 -50 0 50 100 ZENITH VIEWING ANGLE (degrees)
0.5
~0 .4
¢~0.3
~0 .2 Q:
0.1
800 ~00o 1~o 2ooo 2soo WAVELENGTH (nm)

Inversion of PROSPECT and SAIL Models 167
dated by comparing simulation outputs with experimen- tal results. The principles of inversion of high spectral resolution data have been previously detailed by Jacque- moud (1993). In most cases, the complexity of canopy reflectance models prevents an analytical inversion so that numerical methods of optimization are required. As an illustration, consider the model M with p parame- ters, the vector X of explicative variables, and the vector Y of observed variables. We can relate X to Y trough the relation
Y = M(®,X) + e, (1)
where ® is the vector of the p unknown parameters. If n is the number of observations, the inversion procedure consists in determining ® by minimizing the merit func- tion S(®) defined by
i = n
s (®) -- E [Y , - M(®,X,)?. (2) i = 1
This equation is usually nonlinear and is solved by iteration. This may be difficult: Knowledge of the initial parameter set G0 is often essential for the convergence speed of the solution and the validity of the convergence itself. Numerical instability phenomena may lead to local minima, which means that the uniqueness of the solution is never guaranteed. There are several classical optimization techniques such as the quasi-Newton algo- rithm (Gill and Murray, 1972), the Gauss-Marquardt algo- rithm (Marquardt, 1963), or the simplex method (Nelder and Mead, 1965). Recently, new methods based on genetic algorithms have been developed, which, in com- bination with classical algorithms, seem promising for inversion of remote sensing data (Renders et al., 1992). The choice of algorithm depends mainly on the model, the degree of linearity, and the number of input vari- ables to be estimated. Jacquemoud et al. (1994) showed that the quasi-Newton algorithm gave accurate results in most cases and was computationally efficient; in this work it was used via the Numerical Algorithm Group's routine, E04JAF. This routine allows lower and upper limits to be placed on the independent variables to be estimated, and the code needs function evaluations only.
INVERSION ON CROP SPECTRA
The inversion of the PROSPECT + SAIL model consists of determining simultaneously some of all of the canopy biophysical parameters (Ca~, Cw, N, LAI, 0t, and s) from radiometric measurements. The other parameters of the model-measurement configuration, irradiance condi- tions, and, above all, soil optical properties-are as- signed their nominal values. Price (1990) showed that the reflectance spectra of many soils could be described with very few parameters. In the same way, Jacquemoud et al. (1992) modeled the soil bidirectional properties with a small set of parameters. However, because some of the soils used in this study were artificial, it was not
possible to use those results easily. In consequence, in the inversion process the soil background reflectance was considered simply as known. This is a serious but unavoidable limitation for the moment. To avoid physi- cally nonsensical values, the variables to be estimated were constrained within the following ranges which corre- spond to values observed in typical canopies: l<Cab<100 /acm -2, 0.001<Cw<0.1 cm, 1<N<2.5 , 0.1 < LAI < 10, 5 o < 0z < 85 o, and 0 < s < 1. For all inver- sion, the initial guess was [Cab = 32/ag cm-2, Cw = 0.0255 cm, N = 1.5, LAI = 3, Ot = 45 °, and s = 0.5].
Total Inversion
Initially, an attempt was made to retrieve all six canopy biophysical parameters [Cab, Cw, N, LAI, 0t, s] from reflectances observed in the 188 AVIRIS bands. For 88 of the 96 plots the inversion process did converge: Only these results were used thereafter. In terms of reconstruction, the measured spectra were close to the spectra simulated using the PROSPECT + SAIL model with the six estimated variables. The root mean square error (rmse) between actual and simulated reflectances evaluated over all 88 plots and all the wavelengths was 0.0136. When presented as a function of wavelength, it was quite stable and small, always in the range 0.005 and 0.02 (Fig. 3a). The trends of the biases probably correspond to a residual of calibration problems (change in detectors, nonlinearity, etc). In summary, six variables were enough to reconstruct faithfully the canopy reflec- tance spectra measured in these experiments. The large variation in crop states (healthy / chlorotic, sparse / dense canopy) and soil types assures the validity of such an approach. This apart, it is important to be able to infer accurate and quantitative information about the vegeta- tion. Careful analysis of the retrieved variables shows that the four canopy structure parameters [N, LAI, 0t, s] are poorly estimated. In many cases, the fitted values are aberrant and remain at the lower (0l) or upper (N and s) limit imposed at the outset. Better results were obtained for the two parameters which describe leaf biochemical composition, Cab and Cw (Fig. 4 and Table 2).
The same inversion was performed using only the six TM broad bands. From a mathematical point of view, when the number of unknowns is the same as the number of reflectances (six in this case), the problem is not, strictly speaking, an optimization problem; it is rather the search for the solution of six nonlinear simul- taneous equations in six unknowns (Renders et al., 1992). However, results show that the "inversions" converted regularly for 88 plots out of 96. Spectra simulated with the PROSPECT + SAIL model using the retrieved val- ues of the six biophysical variables showed good recon- struction performances with an overall rmse of 0.0212. The residuals had the same features of biases and rmse as the inversion using high spectral resolution data, but

168 Jacquemoudet al.
--0.0
'= L , - . ~ r j ? - ~ -
.... iI
2000 2200 2400 WAVELENGTH (nm)
Figure 3. Comparison between measured and simulated spectra in the 188 AVIRIS bands with the PROSPECT + SAIL model using parameters retrieved from model inver- sion. For each case, the solid and broken lines represent, re- spectively, the biases E(p-p*)n and the rmse [E(p-p*)2/ n)t / 2 (p and p* are respectively the measured and estimated reflectances, n is the number of observations). From the top to the bottom, the spectra correspond to: a) fitting of [Cab, Cw, N, LAI, Ol, s] from the 188 AVIRIS bands; b) fitting of [Cab, Cw, N, LAI, 0t, s] from the six TM bands; c) fitting of [Cab, C~, LAI] from the 188 AVIRIS wavebands with fixed variables [N = 1.225, Ot = 28.6 °, s = 0.33]; d) fitting of [Cab, Cw, LAI] from the 188 AVIRIS wavebands with fixed vari- ables IN = 1.225, 0t = 43.4 °, s = 0.33] for the Broom's Barn ex- periment and [N= 1.225, Ot = 35.3 °, s = 0.33] for the Grignon experiment.
Figure 4. Comparison between measured canopy variables and values estimated through model inversion using the 188 AVIRIS bands: a) fitting of [Cab, Cw, N, LAI, 0z, s]; b) fitting of [Cab, C~, LAI] with fixed variables IN = 1.225, 0z = 28.6 °, s = 0.33]; c) fitting of [Cab, Cw, LAI] with fixed variables IN= 1.225, 0z=43.4 °, s = 0.33] for the Broom's Barn experi- ment and [N= 1.225, 0t=35.3 °, s=0.33] for the Grignon ex- periment. Plus signs, asterisks, and crosses, respectively, cor- respond to natural soils, white, and black backgrounds. Symbols for plots with LAI < 0.5 are inscribed in a circle.
CHLOROPHYLL a+b
~ ~°
40
2O
0 o lO 20 50 40 so
W'ATER LEAF AREA INDEX
0 0.0~ a.02 0.05 004 0,05 0 ~ 2 3 4. 5
80
60
0 10 20 30 40 50
010 . . . . . " ~ , ~
0 , 0 4 ~
0"01
0 0.01 0.02 005 0.04 O05 o 1 2 3 ,¢ 5
.°I 1
0 10 20 3o 40 50 MEASURED VALUES
oo~ ::~++
O'iil # 6 ~ . 4 ,><4-
Jr:? _, ~,,~ i 0 001 002 0o3 0.04 0o5 0 ~ 2 5 4 5 MEASURED VALUES MEASURED VALUES
in an enhanced manner (Fig. 3b). As expected, the four canopy structure variables were poorly estimated. Surprisingly, this was not the case for the two biochemi- cal variables, which had rmse values similar to those calculated using high spectral resolution data (Table 2).
These results suggest unstable inversion processes for the structure variables. Otterman (1990) argued that, because two canopy parameters appear as products in the mathematical expression of the model, they are prevented from being inferred individually: Although structure variables do not appear as a simple product in the formulation of the SAIL model, they are grouped in expressions that define the bidirectional gap fractions observed in canopies. In the same way, Jacquemoud (1993) showed from numerical simulations that, when using only the spectral variation as the source of informa- tion, the variables LAI and 0z were not independent during the inversion process. Additional constraints or information needed to be introduced to stabilize the inversion process. Initially, it may be possible to intro- duce complementary observations made from several viewing and sun configurations. This may also be achieved by assigning fixed values to some of the variables that do not change dramatically from one plot to another, and which have little influence on canopy reflectance. We chose this second option. The following section describes the performance of the inversion process at retrieving only a selection of the six canopy variables.
Partial Inversion
From simulation studies with the PROSPECT+ SAIL model, the leaf structure parameter N, which roughly determines the balance between leaf reflectance and transmittance, has only limited influence on canopy reflectance (Jacquemoud, 1993) because a change in N induces only a small change to the single scattering albedo. In this experiment, N was estimated from inver- sion of the PROSPECT model using reflectance or trans- mittance spectra measurements from individual leaves. Results show that N varied from 1.00 to 1.38 with an average of 1.225. The LAI, Or, and s parameters are not totally independent so that individually they are not inferable unless the others are known: In this experi- ment, the greatest source of variation in canopy reflec- tance was created by differences in plant density, that is, mainly by LAI changes. Further, LAI is one of the most important variables for determining growth and yield. Therefore, standard values were imposed for the leaf orientation and hot-spot size parameter, leaving LAI to be estimated freely.
The hot-spot size parameter is the ratio between mean leaf size and canopy height: Throughout develop- ment, sugar beet canopy height is closely and positively correlated with mean leaf size. Consequently, s can be assumed to be constant. It was assigned its mean value, 0.33, which is in the same range as the value observed by Looyen et al. (1991) for sugar beet crops (s = 0.5).

Inversion of PROSPECT and SAIL Models 169
Table 2. Root Mean Square Errors (rmse) Observed on Five Canopy Biophysical Variables [LAI, Cab (~tg cm-2), Cw (cm), LAI x C~ (~tg cm-2), LAI x Cw (cm)] Retrieved from Inversion of the PROSPECT + SAIL Model on AVIRIS (188 Bands) and TM (Six Bands) Equivalent Reflectances"
Size LAI C,b Cw LAI x Cab LAI x Cw
188 bands 8510) 2.29 10.9 0.0131 50.1 0.0327 780) 2.39 10.6 0.0107 52.3 0.0341 8212) 2.33 11.1 0.0133 50.9 0.0330 75 (3) 2.43 10.8 0.0109 53.2 0.0346
6 bands 88 I°) 2.74 10.8 0.0144 46.1 0.0390 770) 2.92 10.4 0.0118 49.3 0.0417 8412) 2.75 11.0 0.0146 45.9 0.0382 730/ 2.94 10.6 0.0119 49.2 0.0410
188 bands 96 I°t 2.61 19.7 0.0251 38.3 0.0510 81 (11 2.64 16.2 0.0204 41.1 0.0551 82 la 0.68 16.0 0.0231 23.4 0.0222 7001 0.72 12.2 0.0176 25.0 0.0236
6 bands 96/°/ 2.57 16.3 0.0178 33.1 0.0423 780/ 2.63 13.5 0.0140 35.8 0.0458 82 t2/ 0.69 13.6 0.0166 21.0 0.0192 70 (a) 0.74 11.0 0.0124 22.5 0.0206
188 bands 96 (o) 2.54 18.1 0.0234 39.9 0.0460 810/ 2.57 13.7 0.0181 42.3 0.0494 82 (2) 0.75 15.4 0.0223 30.2 0.0233 70 t3) 0.81 10.4 0.0161 32.0 0.0247
6 bands 96 I°l 2.49 15.5 0.0173 32.7 0.0400 810) 2.54 11.7 0.0138 35.1 0.0431 82 t2) 0.73 13.4 0.0166 22.8 0.0206 700) 0.79 9.5 0.0128 24.4 0.0221
Six variables free [Cab, Cw, N, LAI, Or, s]
Three variables free [C~, Cw, LAI] Three variables fixed IN= 1.225, Or* = 28.6 °, s = 0.33]
Three variables free [C~, C~, LAI] Three variables fixed IN= 1.225, Or**, s =0.33]
The population size is presented for a selection of eases: ~°/All plots with suceesful inversion. 0/All plots with successful inversion and LAI > 0.5. /2tAll plots with successful inversion but without a white background. (SIAl1 plots with successful inversion, without a white background, and LAI > 0.5. OP* =43.4 ° and 38.8 ° for AVIRIS data and OP* =35.3 ° and 34.0 ° for TM data, respectively, for the Brooms Barn and Grignon experiments.
The leaf orientat ion parameter is difficult to deter- mine accurately, and, as a result, we had to use an overall mean value. This conflicts with the knowledge that 0t can cause large changes in canopy reflectance, part icularly in the near-infrared. Two independen t mea- surements of 01 were available: a direct c l inometer mea- surement and an est imate der ived from analysis of hemi- spherical photographs. Another way to get information about 01 is to invert the model with 0z as the only unknown. This was done, and only a few of the 96 inversions did not converge: These co r responded to sparse canopies (LAI = 0.15). These failures were attrib- uted to use of inappropria te soil optical proper t ies or to aggregation problems not accounted for by the SAIL model hypotheses. The fit was not as good as in the case of total inversion but the mean rmse, respectively, 0.0288 for AVIRIS data and 0.0200 for TM data, were surprisingly low while measured (Cab, Cw, LAI) and roughly est imated (N, s) canopy variables were used as input parameters . The averages of the fitted 0t (43.4 ° for AVIRIS equivalent data and 38.8 ° for TM equivalent data in the Broom's Barn experiment , 35.3 ° and 34.0 ° in the Grignon experiment) were consistent with the c l inometer results but quite different from those esti- mated by Baret et al. (1993) from hemispherical photog- raphy. This difference arose despite the SAIL and the Poisson models using the same assumptions about the randomness of the leaf position and the azimuth distri- bution. Tests were made on the two 0z evaluations
designated Op and 0P* for the hemispher ical photogra- phy and model inversion estimates, respectively. Thus, in the inversion process one s t ructure parameter (LAI) and the two biochemical parameters (Cab and Cw) were kept free: The o ther three s t ructure variables were assigned fixed values [N= 1.225, 01 ~, s = 0.33] or [N= 1.225, 0/~*, s = 0.33].
Inversions per formed on high spectral resolution data ended regularly. By comparison with total inver- sion, the results obtained both with Op and Op* showed a general increase in the root mean square error (rmse = 0.033) and the biases (Figs. 3c and 3d), particularly in the red edge and in the water absorption zone of the middle infrared. The LAI estimates were better: In detail, Table 2 shows that the main discrepancy oc- cur red where the soil background was very bright (white fabric: p~ -~ 0.8). There are several explanations: First, multiple scattering in this particular situation was much too impor tant to be well accounted for by the SAIL model, even when the soil background was known and fixed. Second, an error in soil reflectance induced large changes in canopy reflectance and, in consequence, in the retr ieved values. For example, al though the directional reflectance propert ies of the white fabric were quasi- Lambert ian, errors due to the nonhorizontal i ty of the fabric were still possible. Similarly, because the contrast be tween the background and leaf reflectances was at its greatest, any error in the structure variables (which

t 70 Jacquemoud et al.
~Z
0 1 O0 200 MEASURED VALUES
L A I * C w o 2 o ~
o.15
0.1G
o 0 5
o 0 0.1 0.2 ~ E A S U R ~ O VALUES
Figure 5. Comparison between measured canopy chloro- phyll (LAI × Cab) and water (LAI x Cw) contents and values estimated through model inversion using the 188 AVIRIS bands. The inversion was performed with [Cab, C~ LAI] to be retrieved and the fixed variables [N= 1.225, Ot = 28.6 °, s = 0.33]. Plus signs, asterisks, and crosses respectively corre- spond to natural soils, white, and black backgrounds. Sym- bols for plots with LAI < 0.5 are inscribed in a circle.
were assumed) would cause a significant change in canopy reflectance and thus in the retrieved values. This problem should be most acute for small to medium LAIs; this was observed (Fig. 4). The estimation of chlorophyll a + b concentration was less accurate than for the total inversion (Table 2). Ignoring the result from white backgrounds, there was an overestimation of Cob that could compensate for the general underesti- mation of LAI. The same general pattern was observed for water depth (Fig. 4). The retrieval of more inaccurate information by the partial inversion process was related to its poorer ability to reconstruct reflectance spectra in the red edge and in the water absorption domains. Compensation between LAI and Cab or C~ can be ex- plained on the basis that, in the visible and the middle infrared regions, an increase in leaf chlorophyll or water contents, as well as an increase in LAI, induces a de- crease in canopy reflectance. This is true for natural and bright soils; however, for black soils an increase in LAI would increase canopy reflectance. These compen- sation features stimulated an investigation of the perfor- mance of "synthetic" canopy variables, such as total canopy chlorophyll content or water content, defined as the product between LAI and Cab or LAI and C~. Using this configuration, total canopy chlorophyll or water contents was estimated with better accuracy than leaf chlorophyll, water content or even LAI alone; this is presented in Figure 5 for 0/~. However, the estimates of these variables over white backgrounds were still very poor (Table 2).
Inversions performed on simulated TM data showed similar results: White soils led to poor estimates of the canopy variables and for the same reasons. For the other backgrounds, on most plots LAI was underestimated; this was a compensation for an overestimation of Cab or
Co:. Table 2 shows that the estimates of the latter vari- ables were even slightly better from the six TM broad bands than from the 188 AVIRIS narrow bands. This surprising result may be explained because much of the high spectral resolution data is redundant, particularly when no account is taken of small absorption features like those which may be induced in the middle infrared by lignin, nitrogen, cellulose, etc. In addition, the extra wavebands may add extra noise or bias which, through the inversion process, produces inaccurate values for the canopy biophysical variables.
DISCUSSION AND CONCLUSION
This study confirmed the theoretical work of Jacque- moud (1993) and showed that the inversion of a canopy reflectance model from a measured vegetation reflec- tance spectrum was possible. In most cases, the inver- sion process converged, and spectra simulated using the retrieved biophysical variables agreed well with measured spectra, having a rmse better than 0,02. Therefore, much of the high resolution spectral informa- tion was redundant. In this experiment, six parameters provided a faithful simulation of the 188 AVIRIS wave- bands. However, our experimental conditions were spe- cific and this obviously restricted the domain of validity of this result.
Although this work was not a real validation of the PROSPECT + SAIL model, that is, the total inversion was unsuccessful when using only a vegetation spectrum acquired at nadir, some of the canopy biophysical vari- ables can be estimated under certain conditions. These can be summarized as follows: The structure parameters (leaf mesophyll structure, leaf area index, mean leaf inclination angle, and hot-spot size parameter) that de- scribe the canopy architecture each affect the canopy spectral reflectance in such a way that several combina- tions of them may produce similar spectra. For this reason, they cannot be inferred simultaneously using only the spectral information, whereas, in theory, this should be possible with directional data; knowledge of one or two structure parameters may make this kind of inversion possible. Conversely, information about the plant's biochemical c o m p o n e n t s - f o r the moment chlo- rophyll a + b concentration and water depth but, in the near future, it may be possible to take into account other components such as lignin, cellulose, nitrogen, e tc . - -seem to be attainable by this method without an explicit description of canopy structure. The best results were obtained when the four structure variables were free in the inversion; this also gave the best agreement between the observed and the simulated spectra. This should give rise to further studies aimed at developing a clearer understanding of the process and to formulate an algorithm that synthesizes the effect of the structure allowing simple fits of the absorption features. When

Inversion of PROSPECT and SAIL Models 1 71
fixed values were assigned to some of the structure variables there was compensation between LAI and Ca~ or Cw. The use of "synthetic" variables, such as the chlorophyll or water contents of the canopy, should minimize these problems.
Inversions performed using all the high spectral resolution information and those using only the six TM broad bands gave similar results for the retrieval of canopy structure or biochemical variables. This con- firmed that much of the high spectral resolution data was redundant and encouraged the extension of such procedures to other sensors such as SPOT-HRV or NOAA-AVHRR by using more simplified models with only a few specific variables. The ability to obtain im- portant canopy biophysical parameters, such as the chlo- rophyll concentration, the water depth, or the leaf area index, using operational broad band sensors should stim- ulate interesting agricultural and environmental studies. This is a new field in remote sensing which deserves to be pursued. The investigation of model inversion using both spectral and directional variations would also help a) in designing sensors which are better suited to moni- tor vegetation and b) in combining data from today's satellites. In that case, account will have to be taken of possible changes in soil background reflectance, which was assumed to be known in this study. This problem needs more studies on the modeling of soil optical properties. Similarly, we did not take into account possi- ble variations of the atmospheric effects on reflectance: These variations are critical when using satellite data. Decoupling the vegetation signal from the soil and atmo- sphere signals will certainly require more than six bands if a priori information is not available.
Can inversion of the model produce valid results? First, inaccuracy of the model in representing the can- opy spectral reflectance may cause errors in the estima- tion of the agronomic parameters. For example, al- though the SAIL model is known to work reasonably well on agricultural areas with homogeneous crops, in the early stages of growth the hypothesis that leaves are distributed at random is certainly not valid. Similarly, it would be inappropriate to invert the SAIL model on forested areas because these do not satisfy the hypothe- ses either. Second, radiometric data inevitably contain errors which affect the accuracy of the inversion. Ren- ders et al. (1992) showed with simulation studies that the addition of noise to reflectance data moved the minimum of the merit function in the parameter space but did not increase the number of local minima. Thus noise linked to the instrument, the conditions of obser- vation, or a bad atmospheric correction may mean that the inversion procedure does not converge to acceptable parameter values. Fortunately, signal-to-noise ratios de- termined on current field spectroradiometers or air- borne imaging spectrometers are generally high enough for inversion to produce meaningful results. It is still
not clear whether atmospheric corrections are accurate enough to allow successful inversion. Third, there is the question of precision of the measured variables; the measurement of the canopy biophysical characteristics will be prone to error. For example, the leaf chlorophyll concentration depends largely on the extraction method, and often the leaf samples are not properly representa- tive of the canopy as a whole: Concentration deviations greater than 5/~g cm -2 can be obtained on the same sample. The type of solvent is also important. There are similar problems with the measurement of LAI and 0t. For example, in the case of sugar beet, 0~ varies during the day as a function of weather conditions.
The speed of convergence can seriously limit the use of inversion of canopy reflectance models on high spectral resolution data. Although the computation time is only a few seconds on high-performance machines (NEC SX-3 of the Centro Svizzero di Calcolo Scien- tifico), it can take longer than is practical when less powerful computers and/or images with several hun- dred thousand pixels have to be used. The increasing capacity of computers for calculation allows one to imag- ine more and more complex models to solve more and more complex phenomena. However, faster computers will not necessarily solve the problem; the inversion theories themselves restrict the investigation of more complex models. Inversions need to be restricted to simple models with few parameters.
Finally, this study highlights two critical and com- plementary problems: The first relates to the difficulty of acquiring enough radiometric information about the target. Bidirectional data are usually gathered over sev- eral days, during which time the vegetation may have changed. Therefore, the use of this data requires knowl- edge about the development of the vegetation during this period. The second problem concerns the choice of approach to be used; these preliminary results suggest that inverting physical radiative transfer models may not provide accurate estimates of canopy biophysical parameters. A compromise has to be investigated be- tween the realism of the model (this generally induces more complexity and more parameters) and its inverti- bility (this usually requires simplicity and very few vari- ables). An alternative approach would necessitate some a priori knowledge about the target (e.g., the species and the type of soil), which could be used to constrain the inversion process.
We are indebted to Dr. Kuusk for the improvement of the FORTRAN code of the SAIL model to take into account the hot-spot effect. Many thanks to J. Clark, J. Eastwood, J. F. Hanocq, T. Malthus, and M. Steven for their support during the field experiments. Computations were carried out at the Centro Svizzero di Calcolo Scientifieo (Manno, Switzerland).

1 72 Jacquemoud et al.
REFERENCES
Baret, F., Andrieu, B., and Steven, M. D. (1993), Gap fre- quency and canopy architecture of sugar beet and wheat crops, Agric. For. Meteorol. 65:261-279.
Deering, D. W., Eck, T. F., and Grier, T. (1992), Shinnery oak bidirectional reflectance properties and canopy model inversion, IEEE Trans. Geosci. Remote Sens. 30(2):339-348.
Gao, B. C., and Goetz, A. F. H. (1990), Column atmospheric water vapor and vegetation liquid water retrievals from Air- borne Imaging Spectrometer data, J. Geophys. Res. 95(D4): 549-3564.3
Gill, P., and Murray, W. (1972), Quasi-Newton methods for unconstrained optimization, J. Inst. Math. Appl. 9:91-108.
Goel, N. S. (1987), Models of vegetation canopy reflectance and their use in estimation of biophysical parameters from reflectance data, Remote Sens. Rev. 3:1-212.
Goel, N. S. (1989), Inversion of canopy reflectance models for estimation of biophysical parameters from reflectance data, in Theory and Applications of Optical Remote Sensing (G. Asrar, Ed.), Wiley-Interscience, New York, pp. 205-250.
Goel, N. S., and Thompson, R. L. (1984a), Inversion of vegeta- tion canopy reflectance models for estimating agronomic variables. IV. Total inversion of the SAIL model, Remote Sens. Environ. 15:237-253.
Goel, N. S., and Thompson, R. L. (1984b), Inversion of vegeta- tion canopy reflectance models for estimating agronomic variables. V. Estimation of leaf area index and average leaf angle using measured canopy reflectances, Remote Sens. Environ. 16:69-85.
Jacquemoud, S. (1993), Inversion of the PROSPECT + SAIL canopy reflectance model from AVIRIS equivalent spectra: theoretical study, Remote Sens. Environ. 44:281-292.
Jacquemoud, S., and Baret, F. (1990), PROSPECT: a model of leaf optical properties spectra. Remote Sens. Environ. 34:75-91.
Jacquemoud, S., Baret, F., and Hanocq, J. F. (1992), Modeling spectral and directional soil reflectance, Remote Sens. Envi- ron. 41:123-132.
Jacquemoud, S., Flasse, S., Verdebout, J., and Schmuck, G. (1994), Comparison of several optimization methods to ex- tract canopy biophysical parameters-application to CAESAR data, in Proc. 6th Int. Symp. Physical Measurements and Signatures in Remote Sensing, Val d'Is~re, France, 17-21 January, CNES, Paris, pp. 291-298.
Kuusk, A. (1991a), The hot spot effect in plant canopy reflec- tance, in Photon-Vegetation Interactions. Application in Op- tical Remote Sensing and Plant Ecology (R. Myneni and J. Ross, Eds.), Springer-Verlag, New York, pp. 139-159.
Kuusk, A. (1991b), Determination of vegetation canopy param- eters from optical measurements, Remote Sens. Environ. 37:207-218.
Kuusk, A. (1994), A multispectral canopy reflectance model, Remote Sens. Environ., forthcoming.
Looyen, W. J., Verhoef, W., Clevers, J. G. P. W., Lamers, J. T., and Boerma, J. (1991), CAESAR: evaluation of the dual- look concept, BCRS-Report 91-10, Delft, The Netherlands, 144 pp.
Major, D. J., Schaalje, G. B., Wiegand, C., and Blad, B. L. (1992), Accuracy and sensitivity analyses of SAIL model-predicted reflectance of maize, Remote Sens. Environ. 41:61-70.
Markham, B. L., and Barker, J. L. (1985), Spectral character- ization of the LANDSAT Thematic Mapper sensors, Int. J. Remote Sens. 6(5):597-716.
Marquardt, D. W. (1963), An algorithm for least-squares esti- mation of nonlinear parameters, J. Soc. Appl. Math. 11(2): 431-441.
Myneni, R. B., and Ross, J. N., Eds. (1991), Photon-Vegetation Interactions: Applications in Optical Remote Sensing and Plant Ecology, Springer-Verlag, New York.
Nelder, J. A., and Mead, R. (1965), A simplex method for function minimization, Computer J. 7:308-313.
Otterman, J. (1987), Inferring spectral reflectances of plant elements by simple inversion of bidirectional reflectance measurements, Remote Sens. Environ. 21:215-228.
Otterman, J. (1990), Inferring parameters for canopies nonuni- form in azimuth by model inversion, Remote Sens. Environ. 33:41-53.
Pinty, B., and Verstraete, M. M. (1991), Extracting information on surface properties from bidirectional reflectance mea- surements, J. Geophys. Res. 96(D2):2865-2874.
Pinty, B., Verstraete, M. M., and Dickinson, R. E. (1990), A physical model of the bidirectional reflectance of vegetation canopies. 2. Inversion and validation. J. Geophys. Res. 95(D8): 11,767-11,775.
Price, J. C. (1990), On the information content of soil reflec- tance spectra, Remote Sens. Environ. 33:113-121.
Price, J. C. (1992), Variability of high spectral resolution crop reflectance spectra, Int. J. Renugte Sens. 13(14):2593-2610.
Privette, J. L., Myneni, R. B., Tucker, C. J., and Emery, W. J. (1994), Invertibility of a 1-D discrete ordinates canopy reflectance model, Remote Sens. Environ. 44:89-105.
Renders, J. M., Flasse, S. P., Verstraete, M. M., and Nordvik, J. P. (1992), A comparative study of optimization methods for the retrieval of quantitative information from satellite data, Commission of the European Communities, Joint Research Centre, EUR 14851 EN, Ispra, Italy, 25 pp.
Schmuck, G., Verdebout, J., Ustin, S. L., Sieber, A. J., and Jacquemoud, S. (1993), Vegetation and biochemical indices retrieved from a multitemporal AVIRIS data set, in Proc. 25th Int. Symp. Remote Sensing and Global Environment Change, Graz, Austria, 4-8 April, pp. 273-281.
TanrC D., Deroo, C., Dahaut, P., et al. (1990), Description of a computer code to simulate the satellite signal in the so- lar spectrum: the 5S code. Int. J. Remote Sens. 11(4):659-668.
Vane, G., Green, R. O., Chrien, T. G., Enmark, H. T., Hansen, E. G., and Porter, W. M. (1993), The Airborne Visible/ Infrared Imaging Spectrometer (AVIRIS), Remote Sens. Environ. 44:127-143.
Verhoef, W. (1984), Light scattering by leaf layers with appli- cation to canopy reflectance modeling: The SAIL model, Remote Sens. Environ. 16:125-141.
Verhoef, W. (1985), Earth observation modeling based on layer scattering matrices, Remote Sens. Environ. 17:165-178.
Verstraete, M. M., Pinty, B., and Myneni, R. (1994), Under- standing the biosphere from space: strategies to exploit remote sensing data, in Proc. 6th Int. Syrup. Physical Mea- surements and Signatures in Remote Sensing, Val d'Is~re, France, 17-21 January, CNES, Paris, pp. 993-1004.