79 value of solar primer - american public power association · 6 value of solar primer researchers...
TRANSCRIPT

Value of Solar Primer

2 Value of Solar Primer
Value of Solar PrimerPrepared by Paul Zummo and Jim Cater for the American Public Power Association
PUBLISHED NOVEMBER 2016 © 2016 American Public Power Associationwww.PublicPower.org
Contact [email protected] or 202.467.2900.
The American Public Power Association prepared this report. However, the views and recommendations of this report should not be assumed to be the policies of APPA or any of its members.
The American Public Power Association represents not-for-profit, communi-ty-owned electric utilities that power homes, businesses and streets in nearly 2,000 towns and cities, serving 48 million Americans. More at www.PublicPower.org.
Public Power Forward is an APPA strategic initiative to help members address technological and regulatory changes reshaping their relationships with customers. APPA provides education and training on relevant issues and new technologies. APPA also develops tools to help members integrate distributed resources, energy efficiency, and demand response into their businesses and operations.

American Public Power Association 3
Introduction
T his primer provides an overview of methods utilities and analysts have used for value of solar (VOS) studies in recent years. It explains why different
studies have produced disparate results, and discusses the pros and cons of adapting a VOS tariff.
Solar photovoltaic (PV) capacity makes up only a small fraction of the nation’s electric generation capacity, but has grown rapidly in recent years, according to data from the En-ergy Information Administration (EIA). In 2014, [1][2]there was approximately 14.9 gigagwatts (GW) of solar capacity — about 6.2 GW distributed solar and 8.8 GW utility scale solar. In 2015, out of total U.S. electric generating capacity of about 1,100 GW, approximately 20 GW was solar — 8.4 GW distributed solar and 11.7 GW utility scale solar.
Although utility-scale solar PV costs nearly as much as conventional resources in some regions, the momentum be-hind solar PV seems to be driven by politics, regulation, and consumer preferences as much as it is by costs. Proponents of solar cite advantages such as no carbon emissions, low maintenance costs, stable pricing, and scalable deployment.
Skeptics point to disadvantages such as high capital costs, low capacity factors, and intermittent weather dependent production.
If solar PV is to become a major source of reliable and affordable electricity for customers, the VOS should be rigor-ously evaluated. Like with any other generation technology, we need to fully understand the costs and benefits of solar PV.
VOS is the determination of compensation for output from a solar facility. The process for determining the VOS consists of identifying, describing, and valuing the quantita-tive and qualitative benefits of solar PV. VOS is often used in relation to net energy metering (NEM), integrated resource planning (IRP), and utility rate making.
This paper provides an overview of the VOS concept, highlights key dimensions, and identifies resources for APPA members who wish to dive deeper into the topic. The paper does not recommend methods for calculating VOS, or to endorse any particular results.

4 Value of Solar Primer
There are two main reasons why utility managers and other energy market participants are interested in VOS. First, a VOS metric can be used to set payments for the output of electricity from customer-installed solar generators, whether through NEM, buy-all sell-all programs, or feed-in tariffs (FIT). Second, VOS calculations can be used to help evalu-ate the economics of solar PV electricity generation for IRP, cost-of-service modeling, and investment decision making.
Setting Compensation for Customer-Installed Generation
Utilities and policymakers usually consider the direct costs that utilities, and hence customers, could avoid — e.g., en-ergy, generation capacity, system losses — when the output from customer-installed solar PV displaces utility produc-tion. However, VOS calculations often include factors other than direct costs avoided, such as environmental attributes. VOS measures and can therefore help mitigate the cost shifting and cross-customer subsidization that often result from deployment of solar PV and other distributed energy resources (DER).
Customer-installed solar and other DERs cause cost shift-ing because DER output displaces utility production and sales. When utility output and sales drop, both revenues and costs decline. When the utility’s volumetric charges exceed the cost per kilowatt hour (kWh) of its directly avoidable costs, revenues will fall by more than costs and the utility will face an unsustainable loss of net revenue unless it raises rates for DER customers and/or shifts costs to non-DER customers. Volumetric charges are traditionally used to recover marginal energy and capacity costs, as well as various embedded costs for grid infrastructure, customer accounting, policy initiatives like energy efficiency and low income programs, and more. Solar projects usually help to avoid marginal energy and generation capacity costs and perhaps some transmission costs, but yield very little or no savings in distribution or other fixed costs. In jurisdictions where carbon emissions are priced though cap-and trade
Why Measure the Value of Solar
mechanisms, taxes, renewable energy credits, or other means, the associated costs represent direct avoided costs.
Utility managers and policymakers who want to manage the cost shifting and cross-customer subsidization associated with customer-installed solar may want to use rigorous VOS techniques to set the compensation for solar output. Even if a utility is not setting a VOS tariff, or using VOS to set its NEM or buy-all sell-all payments, VOS analysis can help the utility understand the magnitude of any cross-customer subsidies inherent in its rate structure.
Resource Planning and Decision Making
VOS is an essential component of the conventional bene-fit-cost analysis used for IRP and investment decision mak-ing. One approach to assessing the relative costs of resource alternatives is to calculate the levelized cost of electricity (LCOE) for each resource, and then compare the LCOEs for various resources to assess which resources display the most favorable cost profiles.1 The LCOE can be expressed in real or nominal dollar terms. The real LCOE can be used to compare resource economics and useful lives.
A potentially more useful VOS metric is the levelized avoided cost of electricity (LACE), which the EIA describes as a “measure of what it would cost the grid to meet the demand that is otherwise displaced by a new generation project.”2 LACE captures the life cycle benefits or value of a resource in terms of utility costs avoided as a result of its deployment. A conventional approach to resource decision
1 According to the Energy Information Administration LCOE “represents the per –kilowatt hour cost (in real dollars) of building and operating a generating plant over an assumed financial life and duty cycle. Key inputs to calculating LCOE include capital costs, fuel costs, fixed and variable op-erations and maintenance (O&M) costs, financing costs, and an assumed utilization rate for each plant type.” See EIA Annual Energy Outlook, August 2016, http://www.eia.gov/forecasts/aeo/pdf/electricity_generation.pdf. It is also important to consider other resource attributes along with LCOE (e.g. dispatchability, environmental impacts, price stability, customer preferences) when comparing resources.
2 Ibid.

American Public Power Association 5
making is to compare the LCOE of a resource to its LACE to assess its stand-alone economics, and then to compare the LCOE and LCAE across different resources.
EIA provides LCOE and LACE calculations in its Annual Energy Outlook. While the solar PV values are for utili-ty-scale projects, the numbers highlight that LACE measures the value of a resource type and is a proxy for a VOS metric that can be used for comparative resource analytics.
VOS analysis is often more comprehensive and consid-ers resource attributes and other factors in addition to the utility’s direct avoided power supply costs. In such cases, the LACE as defined above would represent only a portion of the overall VOS.

6 Value of Solar Primer
Researchers have developed quantitative and qualitative attributes to consider when assessing the VOS.3 While there is overlap among these attributes, the valuation can differ significantly because of the use of different measurement techniques, regional cost differences, varying time horizons, and more. Treatment of the qualitative attributes is subjec-tive. Even when the values for key inputs are similar, the VOS can vary across key stakeholder groups because ben-efits and costs affect different groups in different ways. For example, environmental benefits might appear as benefits for society but not fully so for utility customers who garner only a negligible fraction of the societal benefit.
Composite List of Attributes
Below is a list of seven key attributes — derived from research papers — that should be accounted for in some manner when estimating the VOS. Each attribute is defined and factors that may lead to different valuations are briefly discussed.
Avoided Energy CostsThis attribute represents the costs associated with the production or procurement of energy that the utility avoids when its output is displaced by the output from a solar generator.
n Measurement Avoided energy costs should reflect the production cost or market value of electricity consistent with the location and timing of the solar production. In jurisdictions with transparent, market determined prices — e.g., Regional
Components of Value of Solar
Transmission Organization (RTO) and Independent Sys-tem Operator (ISO) markets — the value should reflect a load-weighted average of the relevant market prices. Even where transparent, hourly prices exist, the availability of accurate time-of-use (TOU) data will differ across utili-ties, causing some to rely on average costs or prices over longer time periods. In jurisdictions without transparent market mechanisms, different methods used to estimate avoided production or procurement costs will likely lead to varying results.
n Regional Differences There could be significant differences in estimated avoid-ed energy costs across broad regions, and sometimes even across congested price zones within particular RTO/ISO control areas.
n Stakeholder Perspective Avoided energy cost is a societal benefit, in the form of actual resource savings, that is realized by the solar customer through reduced payments for electricity output. However, non-solar customers will not realize direct avoided cost benefits, and might even experience increases in average rates and bills if payments from the utility to the solar customer exceed the utility’s actual avoided costs. Non-solar customers may realize indirect benefits from factors like a possible market price suppres-sion effect.
Avoided Generation CapacityThis attribute represents the costs related to generation capacity that the utility avoids when the need for utility supplied capacity is reduced on account of the deployment of solar PV.
n Measurement In jurisdictions with transparent, market-determined prices — e.g., RTO/ISO markets — the unit value for avoided generation capacity cost during critical peak hours can be set at the locational clearing price for comparable utility-scale renewable resources bid into the RTO capacity market. Because of the variability of solar PV, the clearing price may have to been adjusted to ac-
3 See Taylor et. al. ICF Whitepaper 2014: NREL Value of Solar: Program Design and Implementation Considerations. Technical report NREL/TP-6A20-623651, March, 2015, http://www.nrel.gov/docs/fy14osti/62447.pdf; Rocky Mountain Institute, A Review of Solar PV Benefit and Cost Studies, September 2013, http://www.rmi.org/Knowledge-Center%2FLi-brary%2F2013-13_eLabDERCostValue; Brown and Bunyan, Valuation of Distributed Solar: A Qualitative View. The Electricity Journal, 12/2014, Vol. 27, Issue 10; Minnesota Value of Solar Methodology https://www.edockets.state.mn.us/EFiling/edockets/searchDocuments.do?method=-showPoup&documentId=%7b7FF17729-DABA-4B96-B37E-3900B5E0D-38F%7d&documentTitle=20144-98188-01
American Public Power Association 7
count for the fact that the solar facility may not produce at full capacity during the RTO’s critical peak hours, and may not meet the RTO capacity market criteria. These price adjustments can be made through a variety of approaches.
In regions without transparent capacity market pricing, the valuation is subject to even more variation because different methods may be used to estimate the marginal value or cost of generation capacity. One approach for utilities in non-RTO regions is to use long-term internal expansion plan studies and production cost simulations to estimate utility capital, purchased power, and other operating costs without the block of customer-side gener-ation. Another might be to use the responses to RFPs for utility-scale resources as a direct estimate of the contract costs avoided by the utility because of DER output.
n Regional Differences There will likely be differences in estimated generation capacity across regions, and variation across congested price zones in RTO/ISO control areas.
n Stakeholder Perspective Similar to avoided energy cost (see attribute 1).
Avoided Transmission and Distribution CapacityThis attribute represents the costs avoided when a solar project allows for a reduction in, or deferral of, transmission and distribution investments, upgrades, and maintenance.
n Measurement Suggested measurement methods range from relatively simple market-based approaches in RTO/ISO juris-dictions that use locational marginal prices (LMP) to estimate the benefits of relieving transmission conges-tion through use of distributed generation located near the load being served, to other approaches that rely on the use of sophisticated power flow and generation dispatch models.4 Different modeling approaches, with varying input assumptions, can lead to vastly different results. For distribution, there are a variety of more or
less sophisticated and expensive methods to estimate avoided costs and results can vary. Incremental T&D costs may be incurred to accommodate solar PV. For all these reasons, the values assigned to this variable can differ significantly. Generator interconnection studies can be used to estimate the range of potential incremental or avoided T&D costs. For DER, the avoided distribution costs can generally be assumed to be zero, except for PV installations on distribution circuits that are approaching hosting limits.
n Regional Differences T&D costs are most sensitive to topography, customer density, and system architecture — all of which can be influenced by regional circumstances.
n Stakeholder Perspective Similar to avoided energy costs (see attribute 1) in the short run, but if the size and/or configuration of the de-livery system are altered over the longer term as a result of the penetration of solar PV, all customers might realize benefits over time.
Avoided System LossesThis attribute represents the savings to the utility when solar PV located at or near the customer site reduces the electric-ity consumed and also reduces the marginal losses when energy is delivered from utility generators through the T&D system.
n Measurement Measuring avoided system losses requires sophisticated modeling, and data requirements could be significant although LMP data in RTO/ISO markets could be used to approximate loss benefits in some cases. Distribution system loss calculations will depend on the hour-to-hour change in PV output. The diversity of approaches used by different analysts can cause results to vary.
n Regional Differences Losses are fundamentally related to grid architecture and sensitive to topography, density, and system con-figuration. These factors can be influenced by regional differences in the degree of urbanization.4 See Fine et. al., Value of Solar.

8 Value of Solar Primer
Components of Value of Solar
n Stakeholder Perspective Similar to avoided T&D costs (see attribute 3).
Avoided Grid Support Service CostsThis variable represents the costs avoided or incurred by the utility if solar PV leads to a reduction or increase in the need for ancillary services like reactive power, voltage control, regulation, and frequency response.
n Measurement The value of grid support services is system specific and sensitive to grid architecture. RTO/ISO markets may have transparent pricing, but the impact of DERs on the supply and demand for ancillary services may require fairly sophisticated modeling. The total value for this variable will likely be relatively small with little impact on the overall results.
n Regional Differences Similar to T&D costs, reginal factors will have an impact only to the extent that they influence the system architec-ture.
n Stakeholder Perspective Similar to avoided T&D costs (see attribute 3).
Avoided Environmental CostsThis attribute represents the environmental costs avoided, or benefits realized, as a result of displacing utility production with solar facility output. It could include impacts related to avoided carbon dioxide emissions (CO2) and criteria air pollutants (SO2, NOx, PM) as well as environmental factors related to land and water, or any subset of these concerns.
n Measurement Substantial issues related to definitions, attribute identifi-cation, and mechanical measurement arise in estimating environmental benefit values such as the quantity of pol-lutants displaced by solar PV output and the unit value of avoided emissions. Credible approaches to measuring the avoided costs of just CO2 emissions can yield a wide range of results. The American Public Power Associa-
tion — in comments to the Office of Management and Budget — showed how combining the OMB’s range of values for the social cost of carbon with variables like a utility’s generation portfolio mix would yield an extreme range of estimates, from about $10/MWh to well over $1000/MWh.5 And, some would propose values outside of that range.6
n Regional Differences A host of regional factors including resource availability, ambient air and water quality, meteorological conditions, regulatory factors — e.g., internalization of potential CO2 related costs in Regional Greenhouse Gas Initiative (RGGI) states — can have a significant impact on the estimated value of avoided environmental costs. The estimated values can be large enough to dramatically alter the total VOS calculations.
n Stakeholder Perspective Factoring in environmental benefits can cause large dis-parities VOS perceptions between private (i.e., customers and utility) and societal valuations. Perceptions differ of the extent to which global environmental benefits accrue to a utility customer. Customers gain if the estimated value of environmental attributes increases their VOS-based payments.
Avoided Financial RiskThis attribute captures two effects — the value of the fuel price hedge that results when the solar PV output displaces utility production from sources with variable fuel prices; and the possibility that the customer installed generation will lower market prices by reducing electricity demand.
5 Comments of the American Public Power Association on The Technical Support Document, Technical Update of the Social Cost of Carbon for Regu-latory Impact Analysis Under Executive Order Np. 12866, OMB-2013-0007, February 26, 2014.
6 For example, if the price of carbon was set at $30 per ton, then the price of carbon would be $.015 per pound. For a combined cycle plant running at a heat rate of 8000 BTU, a kWh of generation yields 9/10 a pound of CO2. Thus the environmental cost of a kWh from that unit is $.0135 per kWh, or 1.35 cents per kWh.

American Public Power Association 9
n Measurement Conventional financial methods are available to mea-sure price hedging benefits, but they may not be widely accepted, and even when they are, the results can vary widely as the techniques are governed by probability. Fixed price contracts can reduce exposure to volatile wholesale prices, but the VOS is difficult to determine in the abstract, separate from the rest of the utility power supply portfolio. Economic supply and demand analysis can be used to measure the price suppression effects, but the specific modeling techniques and associated input assumptions can vary results. Moreover, the benefits of reduced market demand are likely to be transitory and captured in long-term capacity prices. Over any long-term period, supply and demand will attain equilibrium.
The actions of customers in a single utility are unlikely to depress market prices. In any case, the estimated values for financial risk are likely to be relatively small and with little impact on the overall VOS results.
n Regional Differences There should be no significant regional variation inde-pendent from the portfolio considerations described above.
n Stakeholder Perspective The benefits of avoided financial risk should flow to solar and non-solar customers and society, based on the degree to which each customer group is insulated from market price volatility, and the value that customers place on current and future price certainty and predictability.

10 Value of Solar Primer
Varying definitions, measurements, regional cost characteris-tics, and stakeholder perspectives can all affect the estimated VOS — the results can and do vary widely. Graph I shows the range of estimated VOS results from a survey, published by the Rocky Mountain Institute (RMI), of VOS studies con-ducted by researchers across regions, during 2009 – 2013. The wide range of possible outcomes is apparent from the graph.
An analysis of the underlying values in each report reveals why these studies come to such different conclusions for the VOS. For example, the avoided energy cost benefit was approximately 10 cents per kWh in a Texas study, but less than 3 cents per kWh in an Arizona study. These differing valuations of the energy stem from differences in market structure, power plant efficiency, variable operations and maintenance costs, and other input assumptions. Some studies calculated the energy value over a sample year, while others calculated the levelized cost over 20 years.8 Valua-tions of avoided generation capacity also differed markedly for similar reasons.9 There was more consistency for system loss benefits, T&D capacity, and other categories. The
Case Studies and Range of Outcomes
environmental benefit ranged from 2 to 4 cents per kWh for most studies, although a pair of studies had a zero or close to zero environmental benefit.10
Even utilities with similar total values had different un-derlying attribute values, as shown in Graph 2, representing two studies from the RMI report.
These wide ranging outcomes do not imply that VOS is imprecise or that it cannot be measured, but show that the concept can mean different things to different people. When relying on VOS estimates for ratemaking, business decision making, and setting compensation for solar production,
* Source Rocky Mountain Institute 1:
$0.000
$0.050
$0.100
$0.150
$0.200
$0.250
$0.300
$0.350
$0.400
1 2 3 4 5 6 7 8 9 10 11 12
VO
S $
/kW
h
Study
Graph 1: Estimated Value of Solar
VOS
7 RMI, A Review of Solar PV, pp. 45-57
8 Ibid., p. 25.
9 Ibid., p. 29.
10 Ibid., p. 38. These studies were further separated into those which eval-uated carbon separately, and those which studied all environmental values.
11 Karl R. Rabago, Leslie Libby, Tim Harvey, Benjamin L. Norris, and Thomas E. Hoff, Designing Austin Energy’s Solar Tariff Using a Distributive PV Value Calculation (Austin, TX: Austin Energy, 2013)

American Public Power Association 11
Austin Energy, TexasOnly one electric utility in the U.S. has implemented a VOS tariff – Austin Energy in Texas. Austin Energy implemented the VOS tariff in 2012 after a thorough review of the VOS in its territory.11
n Austin Energy’s VOS tariff is based on an algorithm that incorporates six value components:
n Loss savings: Reduction in line losses by producing power where it is used.
n Energy savings: The offset of wholesale purchases.
n Generation capacity savings: Added capacity to utility resource portfolio from distributed generation.
n Fuel price hedge value: No fuel price uncertainty associated with solar PV.
n Transmission and distribution capacity savings: Reduced peak loading on the T&D system, post-poning the need for capital investments.
0
2
4
6
8
10
12
14
Study 1 Study 2
Cen
ts p
er k
Wh
Graph 2: Comparison of VOS Study Attributes
Energy Losses Gen Cap T&D cap Enviro
n Environmental benefits: Environmental footprint of solar PV is less than that of traditional fossil-fuel generation.12
Clean Power Research worked with Austin to es-tablish a rate based on these attributes.13 The energy component had by far the biggest value in the VOS study, approaching 8 cents per kWh. The environ-mental benefit added 2.5 cents. When everything was added up, the original VOS rate was set just above the residential retail rate of electricity, although subse-quent reviews have led to modifications and a slightly reduced VOS.14
12 Ibid., p. 2.
13 See ibid., p. 3 for a detailed explanation of CPR’s methodology, which incorporated Austin Energy’s hourly nodal pricing and adopting a “PV output weighted nodal price” to capture “the effects of price variations and choice of solar configuration.” PV output weighted nodal price was calculated for the near-term based on the value of energy pro-duced by a solar generator. Near- and long-term (out to 30 years) energy production was based on CPR’s value calculator methodology.
14 For more information about Austin Energy’s VOS implementation, see American Public Power Association, Rate Design for Distributed Generation: Net Metering Alternatives June 2015, 6.

12 Value of Solar Primer
utilities must understand how the values were derived and what they represent.
It is clear from Graph I that VOS estimates may turn out to be lower or higher than the corresponding retail rates that apply to a customer class or the NEM payments that a utility offers its solar PV customers. Therefore, relying on VOS may not mitigate the cost shifting and cross-customer subsidization that might result from DER penetration and NEM programs. This does not undermine the validity of the concept, or any particular result, but reinforces that utilities must be mindful of their reasons for using VOS metrics.
Public Power Case Studies/ Divergent Results
The wide disparity in VOS results stems from different inputs and assumptions as shown by two public power case studies.The divergent results in these two public power studies reflect how dependent VOS is on utility-specific cir-cumstances. Different market structures, energy prices, con-gestion points, and environmental benefits16 lead to marked variations in the VOS. A utility’s purchase power agreement portfolio can also change the VOS, as utilities with “take or pay” purchase power contracts” cannot reduce fixed costs when sales decline, whereas a utility that purchases most of its power on the market might be able to reduce its purchased power costs through distributed PV and derive greater VOS.17
Lincoln Electric System, Nebraska Lincoln Electric System (LES) in Nebraska con-ducted a VOS study15 but has not yet implemented a VOS tariff. The study examined the costs and benefits of distributed solar generation as it affects various components of LES’s locational marginal pricing (LMP)-based cost of serving its load. The cost includes energy, transmission congestion, and marginal transmission losses, as well as environ-mental benefits and distribution system benefits. LES found a significant benefit in terms of reduced energy costs — approximately $35 per MWh, or 3.5 cents per kWh. However, because of the flows of power in the Southwest Power Pool RTO, distrib-uted PV resulted in significant costs to LES due to transmission congestion and marginal transmission losses. Ultimately, LES determined the VOS to be 3.7 cents per kWh, or not quite half the residential retail rate of electricity.
15 See presentation from Scott Benson, Manger, Resource & Transmission Planning for LES, available at https://www.youtube.com/watch?v=GH_3_tEXSH0&feature=youtu.be
16 LES used short-term REC prices to quantify an environmental benefit. REC price was forecast to be $2.00/MWh in 2016, or $.002/kWh. Austin also used REC prices as a basis for their environmental benefit, but higher REC prices led an environmental benefit closer to 2.5 cents per kWh.
17 Mike Taylor, Joyce McLaren, Karlynn Cory, Ted Davidovich, John Sterling, and Miriam Makhyounl, Value of Solar: Program Design and Im-plementation Consideration (NREL/TP-6A20-62361. Golden, CO: National Renewable Energy Laboratory, 2015), 6.
American Public Power Association 13
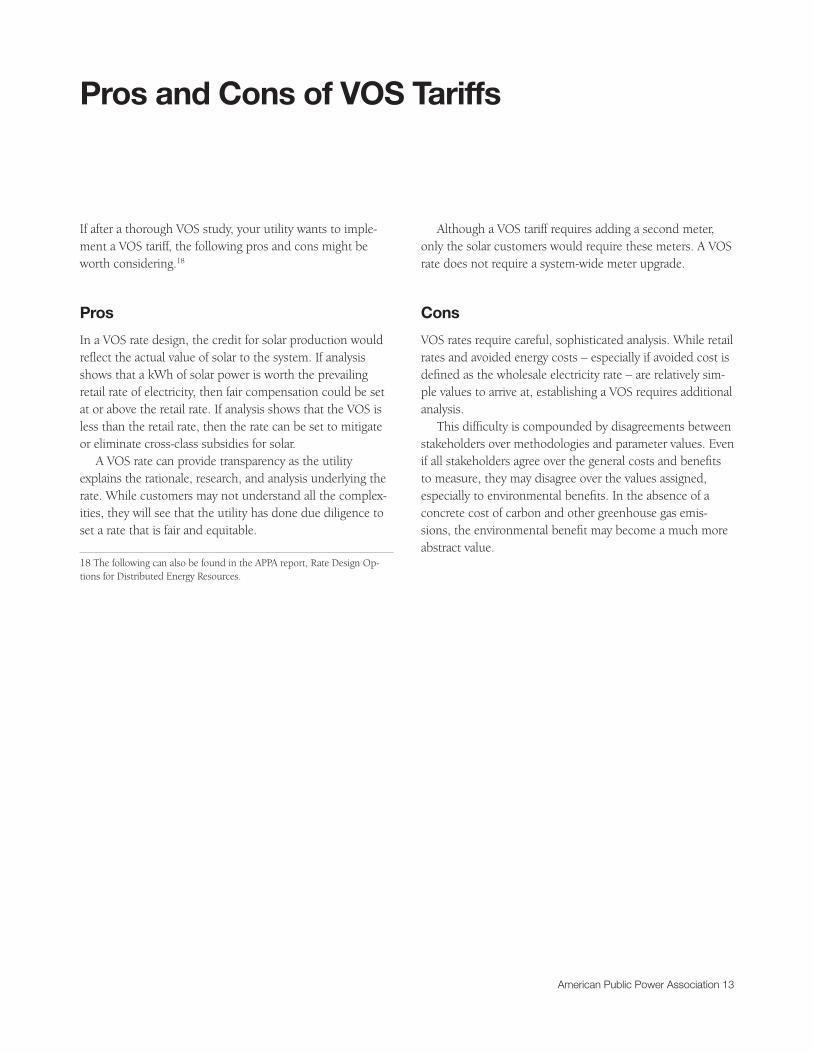
If after a thorough VOS study, your utility wants to imple-ment a VOS tariff, the following pros and cons might be worth considering.18
Pros
In a VOS rate design, the credit for solar production would reflect the actual value of solar to the system. If analysis shows that a kWh of solar power is worth the prevailing retail rate of electricity, then fair compensation could be set at or above the retail rate. If analysis shows that the VOS is less than the retail rate, then the rate can be set to mitigate or eliminate cross-class subsidies for solar.
A VOS rate can provide transparency as the utility explains the rationale, research, and analysis underlying the rate. While customers may not understand all the complex-ities, they will see that the utility has done due diligence to set a rate that is fair and equitable.
Pros and Cons of VOS Tariffs
18 The following can also be found in the APPA report, Rate Design Op-tions for Distributed Energy Resources.
Although a VOS tariff requires adding a second meter, only the solar customers would require these meters. A VOS rate does not require a system-wide meter upgrade.
Cons
VOS rates require careful, sophisticated analysis. While retail rates and avoided energy costs – especially if avoided cost is defined as the wholesale electricity rate – are relatively sim-ple values to arrive at, establishing a VOS requires additional analysis.
This difficulty is compounded by disagreements between stakeholders over methodologies and parameter values. Even if all stakeholders agree over the general costs and benefits to measure, they may disagree over the values assigned, especially to environmental benefits. In the absence of a concrete cost of carbon and other greenhouse gas emis-sions, the environmental benefit may become a much more abstract value.
14 Value of Solar Primer
V OS studies can provide valuable information for analysts and decision makers who need to under-stand the costs and benefits of the sources and
technologies used to produce electricity. Determining the VOS requires the analyst to identify, and quantify where pos-sible, the full list of costs and benefits. This allows for more rigorous investment decision making and helps the utility determine if solar PV customers are subsidized by non-so-lar customers. VOS could help to address the cost shifting through rate design or other means. Utilities must take a structured approach to considering the VOS for customers.
Conclusion


2451 Crystal Drive Suite 1000 Arlington, Virginia 22202-4804
PublicPower.org