789324.pdf
TRANSCRIPT
7/27/2019 789324.pdf
http://slidepdf.com/reader/full/789324pdf 1/9
International Scholarly Research Network ISRN Renewable Energy Volume 2012, Article ID 789324, 8 pagesdoi:10.5402/2012/789324
Research Article An Experimental Study of Vegetable Solar Drying Systems withand without Auxiliary Heat
Abdul Jabbar N. Khalifa,1 Amer M. Al-Dabagh,2 and W. M. Al-Mehemdi2
1 College of Engineering, Nahrain University, P.O. Box 64040, Jadiriya, Baghdad, Iraq 2 Department of Mechanical Engineering, University of Technology, Baghdad, Iraq
Correspondence should be addressed to Abdul Jabbar N. Khalifa, [email protected]
Received 13 April 2012; Accepted 6 June 2012
Academic Editors: S. Li, R. P. Saini, and S. Salter
Copyright © 2012 Abdul Jabbar N. Khalifa et al. This is an open access article distributed under the Creative CommonsAttribution License, which permits unrestricted use, distribution, and reproduction in any medium, provided the original work isproperly cited.
An experimental study is conducted to investigate the performance of a solely solar drying system and a system equipped with anauxiliary heater as a supplement to the solar heat. The performances of both are compared to that of natural drying. Beans andpeas are dehydrated in a system that consists of two flat plate collectors, a blower, and a drying chamber. Tests with four diff erentairflow rates, namely, 0.0383, 0.05104, 0.0638, and 0.07655 m3/s are conducted. Itwas found that the drying time was reduced from56 hours for natural drying to 12–14 hours for solar drying and to 8-9 hours for mixed (solar and auxiliary) drying. The efficiency of the mixed drying system was found to increase by 25% to 40% compared to the solely solar drying. A best fit to the experimentaldata of peas and beans was obtained by six exponential equations for the various systems with a correlation coefficient in the range0.933 and 0.997.
1. Introduction
Using the sun to dry crops and grains is one of the oldest,simplest, and least expensive ways of drying. Natural dryingdoes not involve any cost but it is of many disadvantagessuch as long drying time during which the dried material isexposed to contamination and intrusion of insects androdent leaving low quality dried material. Solar driers areused to lessen drying time and improve—the quality of product. The solar may be supplemented by auxiliary heat
of diff erent types to lessen further the drying time. It is oftendesirable to vary airflow rate through the system during thediff erent stages of drying. Many types of auxiliary heat wereused in the literature as a supplement. O’Donoghue andFuller [1] used a 40-W variable speed fan powered by a PhotoVoltaic unit to deliver 0.139 to 0.055 m3/s of air to a tunneldryer to dehydrate herbs and tomatoes using supplementary heat in the form of electricity and hot water. A structure of adryer using solar energy and heat of geothermal water froma natural field for heating the dryer air was developed by Ivanova and Andonov [2]. A heat pump dryer was designedbyCeytan et al. [3] which was experimentally tested in dryingtropical fruits such as kiwi, avocado, and banana. Eltief et al.
[4] used a solar assisted drying system consisted of dryingchamber, V-groove collectors of, an auxiliary electric heater,and two variable speed centrifugal fans. Zomorodian et al.[5] introduced a rig consisted of six ordinary solar air heaters,an auxiliary electric heating channel, a drying chamber withan electrically rotary discharging valve and an air distributingsystem for paddy drying. Al-Juamily et al. [6] used a dryingcabinet that had a transparent wall on its south side toenhance solar absorption in a system consisted of two solarcollectors and an air blower to dry grapes, apricots, and
beans. Bennamoun and Belhamri [7] used a heater duringperiods of low sunshine to dry onion.
The objective of this work is to investigate the benefit,over natural drying, of using solar drying with and withoutauxiliary heat for drying beans and peas under diff erentairflow rates. Developing correlations that show the relationbetween the moisture content, flow rate, and drying time forthe two systems is also an objective of this investigation.
2. Approach
The drying of materials involves migration of water from theinterior of the material to its surface, followed by removal
7/27/2019 789324.pdf
http://slidepdf.com/reader/full/789324pdf 2/9
2 ISRN Renewable Energy
of water from the surface, which requires an amount of heat equals to the latent heat of evaporation of water. Inmost cases, the heat comes from the air, which is heatedby the solar air collectors in the case of solar drying. Suchequilibrium can be presented by the following equation:
mwhfg = maC p (T oc − T ic). (1)
The collector should deliver a quantity of heat which equalsto
Q = HR (τα)tAC ηC . (2)
The values of ma and AC are selected to accomplish therequired drying conditions. The quantity of moisture evap-orated from the dried material may be calculated from thefollowing relation
mw =mi
M i − M f
1 − M f . (3)
The efficiency of the air collector may be calculated from thefollowing relation
ηC =Qu
HR · AC . (4)
The following relation shows the efficiency of the dryingcabinet:
ηd =P · hfg
(HR · AC +W )t . (5)
For the heater, the efficiency is calculated as follows:
ηh =m · C p · ∆T
I ·V . (6)
The efficiency of the drying system is calculated by multi-plying the efficiencies of the individual components of thesystem.
3. Experimental Setup and Test Procedure
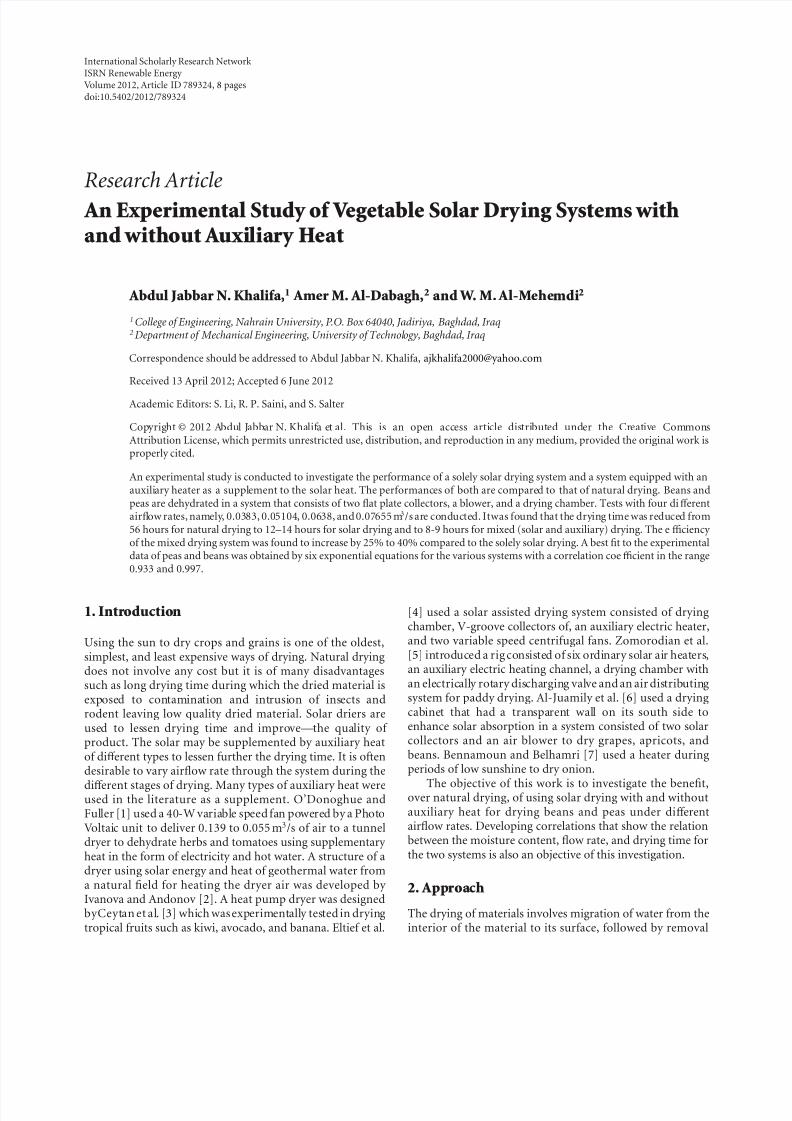
Two identical double-pass air collectors were constructed.The absorber was made from a 60◦ V-groove galvanized steelsheet 1-mm-thick with dimensions of 1.7×0.7 m. Matt black paint was used on the corrugated absorber to increase the
absorptivity to solar radiation. A rock wool sheet was used toinsulate the back and sides of the collector, which had finaldimensions of 1.9×0.9 m asshown in Figure 1. The collectorswere oriented due south at a tilt angle of 45◦. More details onthe performance of the air collectors may be found in Al-Juamily et al. [6].
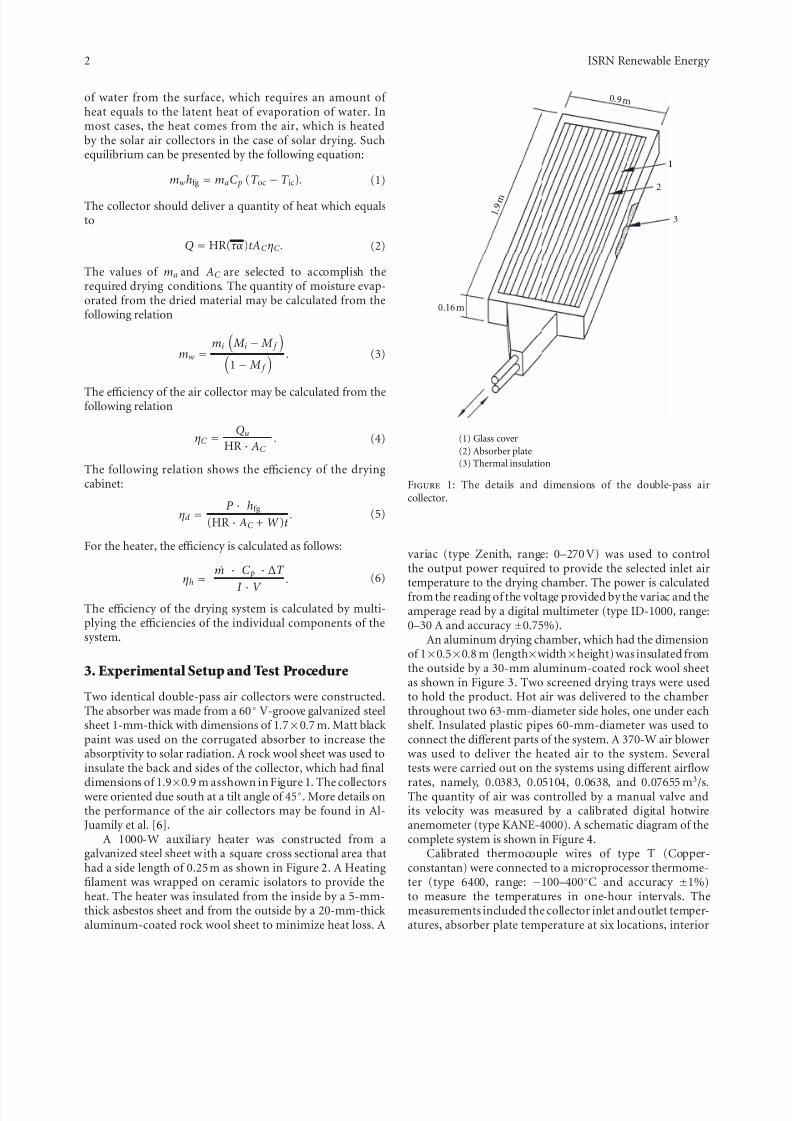
A 1000-W auxiliary heater was constructed from agalvanized steel sheet w ith a square cross sectional area thathad a side length of 0.25 m as shown in Figure 2. A Heatingfilament was wrapped on ceramic isolators to provide theheat. The heater was insulated from the inside by a 5-mm-thick asbestos sheet and from the outside by a 20-mm-thick aluminum-coated rock wool sheet to minimize heat loss. A
1
2
3
(1) Glass cover
(2) Absorber plate
(3) Thermal insulation
1
2
0 .9 m
1 . 9
m
0.16 m
Figure 1: The details and dimensions of the double-pass aircollector.
variac (type Zenith, range: 0–270 V) was used to controlthe output power required to provide the selected inlet airtemperature to the drying chamber. The power is calculatedfrom the reading of the voltage provided by the variac and theamperage read by a digital multimeter (type ID-1000, range:0–30 A and accuracy ±0.75%).
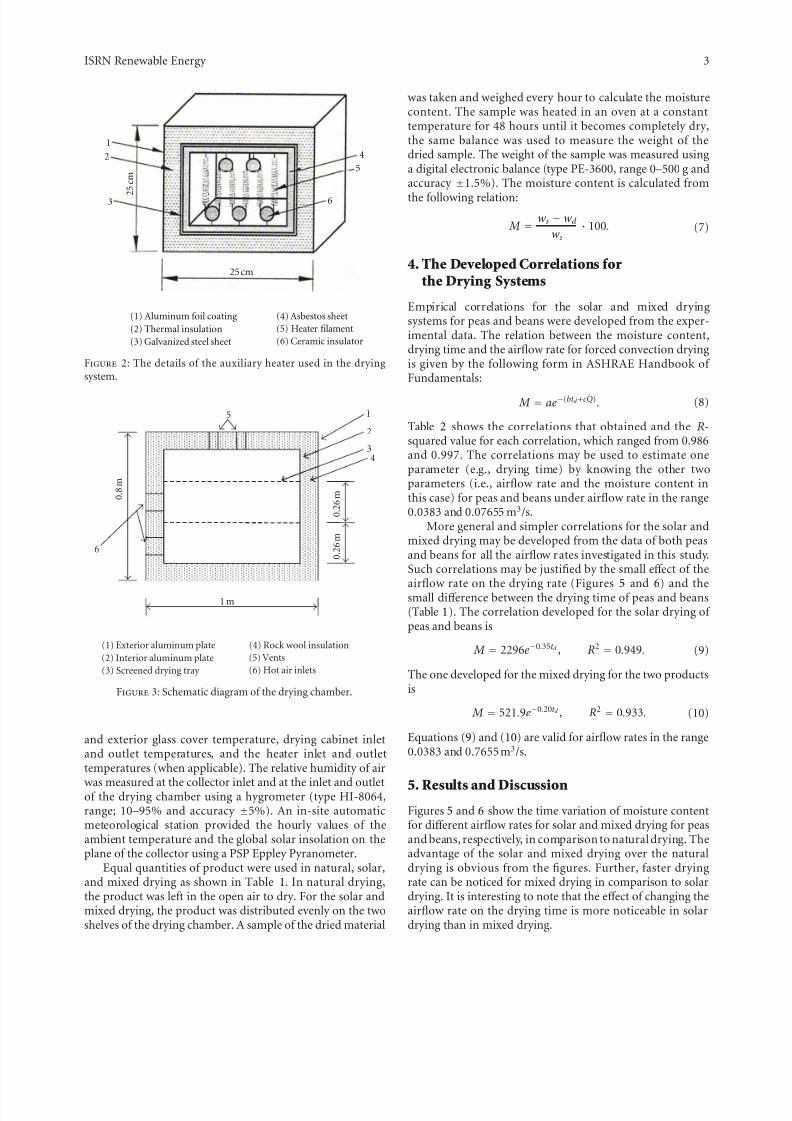
An aluminum drying chamber, which had the dimensionof 1×0.5×0.8 m (length×width×height) was insulated fromthe outside by a 30-mm aluminum-coated rock wool sheetas shown in Figure 3. Two screened drying trays were usedto hold the product. Hot air was delivered to the chamberthroughout two 63-mm-diameter side holes, one under eachshelf. Insulated plastic pipes 60-mm-diameter was used toconnect the diff erent parts of the system. A 370-W air blower
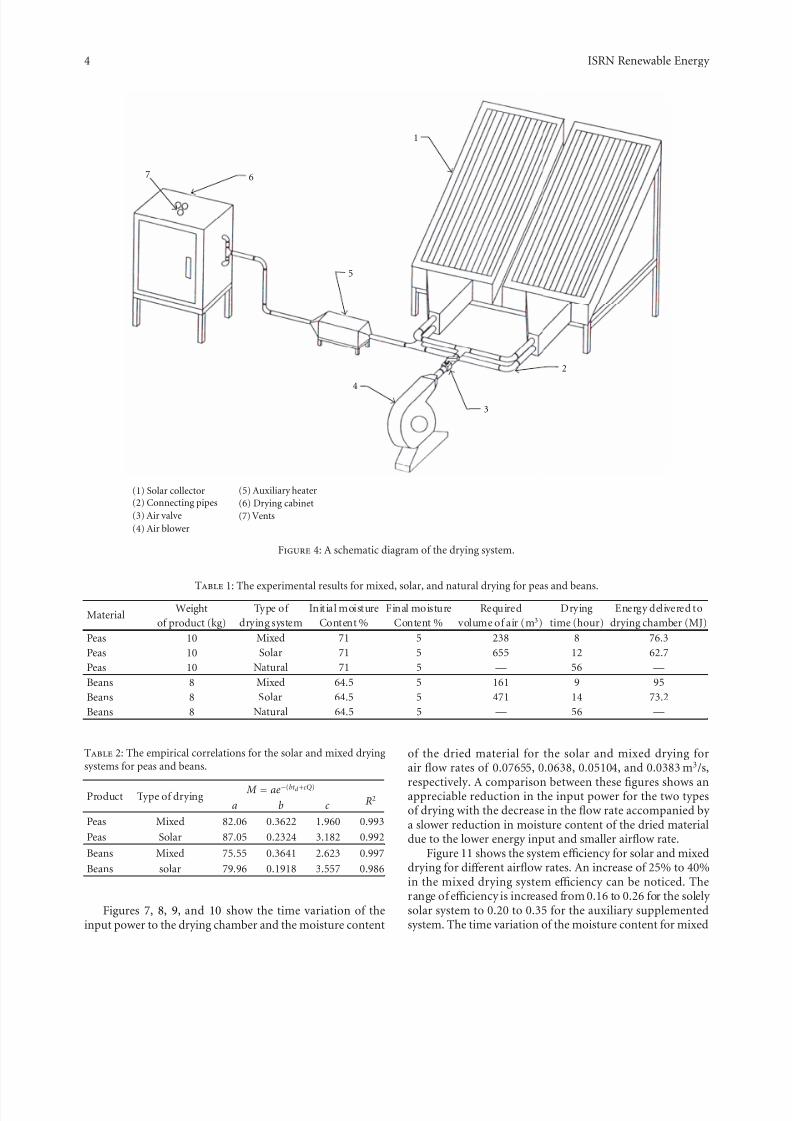
was used to deliver the heated air to the system. Severaltests were carried out on the systems using diff erent airflow rates, namely, 0.0383, 0.05104, 0.0638, and 0.07655 m3/s.The quantity of air was controlled by a manual valve andits velocity was measured by a calibrated digital hotwireanemometer (type KANE-4000). A schematic diagram of thecomplete system is shown in Figure 4.
Calibrated thermocouple wires of type T (Copper-constantan) were connected to a microprocessor thermome-ter (type 6400, range: −100–400◦C and accuracy ±1%)to measure the temperatures in one-hour intervals. Themeasurements included the collector inlet and outlet temper-atures, absorber plate temperature at six locations, interior
7/27/2019 789324.pdf
http://slidepdf.com/reader/full/789324pdf 3/9
ISRN Renewable Energy 3
(1) Aluminum foil coating
(2) Thermal insulation
(3) Galvanized steel sheet
(4) Asbestos sheet
(5) Heater filament
(6) Ceramic insulator
25 cm
1
2
3
4
5
6 2 5
c m
Figure 2: The details of the auxiliary heater used in the drying
system.
5 1
2
3
6
4
(1) Exterior aluminum plate
(2) Interior aluminum plate
(3) Screened drying tray
(4) Rock wool insulation
(5) Vents
(6) Hot air inlets
1 m
0 . 8 m
0 . 2 6 m
0 . 2 6 m
Figure 3: Schematic diagram of the drying chamber.
and exterior glass cover temperature, drying cabinet inlet
and outlet temperatures, and the heater inlet and outlettemperatures (when applicable). The relative humidity of airwas measured at the collector inlet and at the inlet and outletof the drying chamber using a hygrometer (type HI-8064,range; 10–95% and accuracy ±5%). An in-site automaticmeteorological station provided the hourly values of theambient temperature and the global solar insolation on theplane of the collector using a PSP Eppley Pyranometer.
Equal quantities of product were used in natural, solar,and mixed drying as shown in Table 1. In natural drying,the product was left in the open air to dry. For the solar andmixed drying, the product was distributed evenly on the twoshelves of the drying chamber. A sample of the dried material
was taken and weighed every hour to calculate the moisturecontent. The sample was heated in an oven at a constanttemperature for 48 hours until it becomes completely dry,the same balance was used to measure the weight of thedried sample. The weight of the sample was measured usinga digital electronic balance (type PE-3600, range 0–500 g and
accuracy ±
1.5%). The moisture content is calculated fromthe following relation:
M =ws − wd ws
· 100. (7)
4. The Developed Correlations forthe Drying Systems
Empirical correlations for the solar and mixed dryingsystems for peas and beans were developed from the exper-imental data. The relation between the moisture content,drying time and the airflow rate for forced convection dryingis given by the following form in ASHRAE Handbook of
Fundamentals:
M = ae−(bt d +c Q). (8)
Table 2 shows the correlations that obtained and the R-squared value for each correlation, which ranged from 0.986and 0.997. The correlations may be used to estimate oneparameter (e.g., drying time) by knowing the other twoparameters (i.e., airflow rate and the moisture content inthis case) for peas and beans under airflow rate in the range0.0383 and 0.07655 m3/s.
More general and simpler correlations for the solar andmixed drying may be developed from the data of both peasand beans for all the airflow r ates investigated in this study.Such correlations may be justified by the small eff ect of theairflow rate on the drying rate (Figures 5 and 6) and thesmall diff erence between the drying time of peas and beans(Table 1). The correlation developed for the solar drying of peas and beans is
M = 2296e−0.35t d , R2 = 0.949. (9)
The one developed for the mixed drying for the two productsis
M = 521.9e−0.20t d , R2 = 0.933. (10)
Equations (9) and (10) are valid for airflow rates in the range
0.0383 and 0.7655 m3/s.
5. Results and Discussion
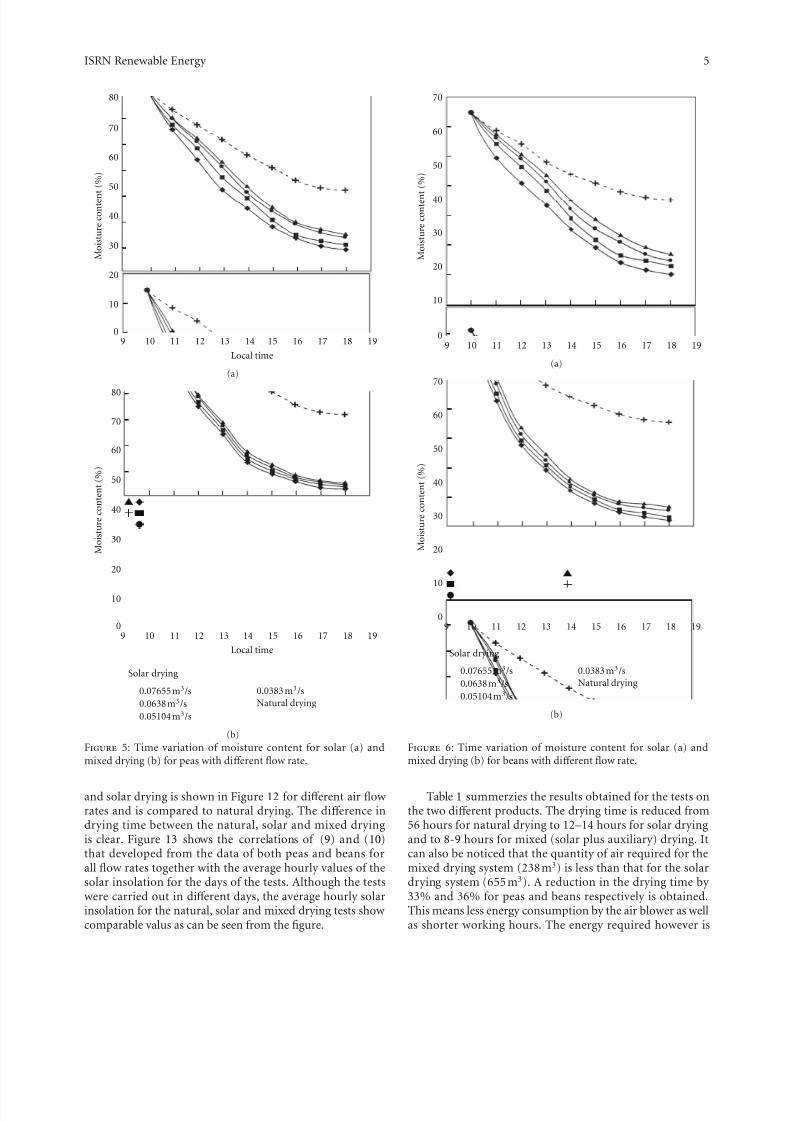
Figures 5 and 6 show the time variation of moisture contentfor diff erent airflow rates for solar and mixed drying for peasand beans, respectively, in comparison to natural drying. Theadvantage of the solar and mixed drying over the naturaldrying is obvious from the figures. Further, faster dryingrate can be noticed for mixed drying in comparison to solardrying. It is interesting to note that the eff ect of changing theairflow rate on the drying time is more noticeable in solardrying than in mixed drying.
7/27/2019 789324.pdf
http://slidepdf.com/reader/full/789324pdf 4/9
4 ISRN Renewable Energy
(1) Solar collector(2) Connecting pipes
(3) Air valve
(4) Air blower
(5) Auxiliary heater
7 6
1
5
4
3
2
(6) Drying cabinet
(7) Vents
7 6
1
5
4
3
2
Figure 4: A schematic diagram of the drying system.
Table 1: The experimental results for mixed, solar, and natural drying for peas and beans.
Material Weight Type of Initial moisture Final moisture Required Drying Energy delivered to
of product (kg) drying system Content % Content % volume of air (m3) time (hour) drying chamber (MJ)
Peas 10 Mixed 71 5 238 8 76.3
Peas 10 Solar 71 5 655 12 62.7
Peas 10 Natural 71 5 — 56 —
Beans 8 Mixed 64.5 5 161 9 95
Beans 8 Solar 64.5 5 471 14 73.2
Beans 8 Natural 64.5 5 — 56 —
Table 2: The empirical correlations for the solar and mixed dryingsystems for peas and beans.
Product Type of drying M = ae−(bt d +cQ)
R2a b c
Peas Mixed 82.06 0.3622 1.960 0.993
Peas Solar 87.05 0.2324 3.182 0.992
Beans Mixed 75.55 0.3641 2.623 0.997
Beans solar 79.96 0.1918 3.557 0.986
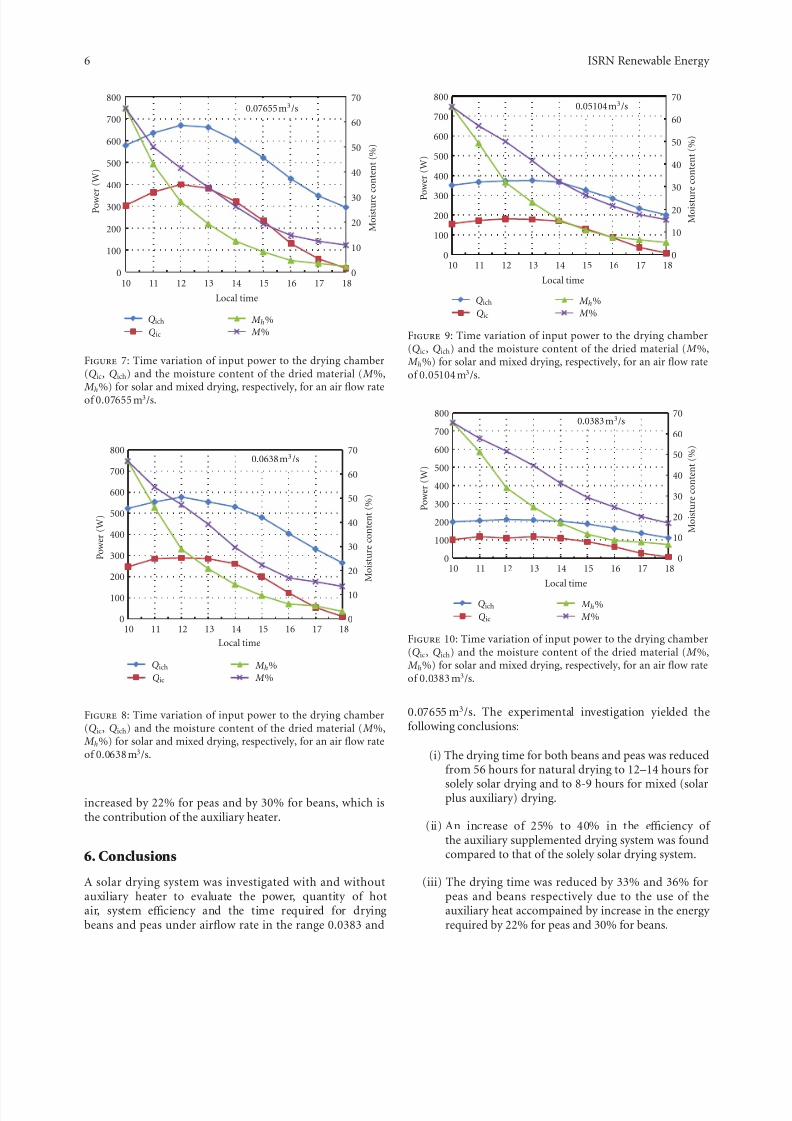
Figures 7, 8, 9, and 10 show the time variation of theinput power to the drying chamber and the moisture content
of the dried material for the solar and mixed drying forair flow rates of 0.07655, 0.0638, 0.05104, and 0.0383 m3/s,respectively. A comparison between these figures shows anappreciable reduction in the input power for the two typesof drying with the decrease in the flow rate accompanied by a slower reduction in moisture content of the dried materialdue to the lower energy input and smaller airflow rate.
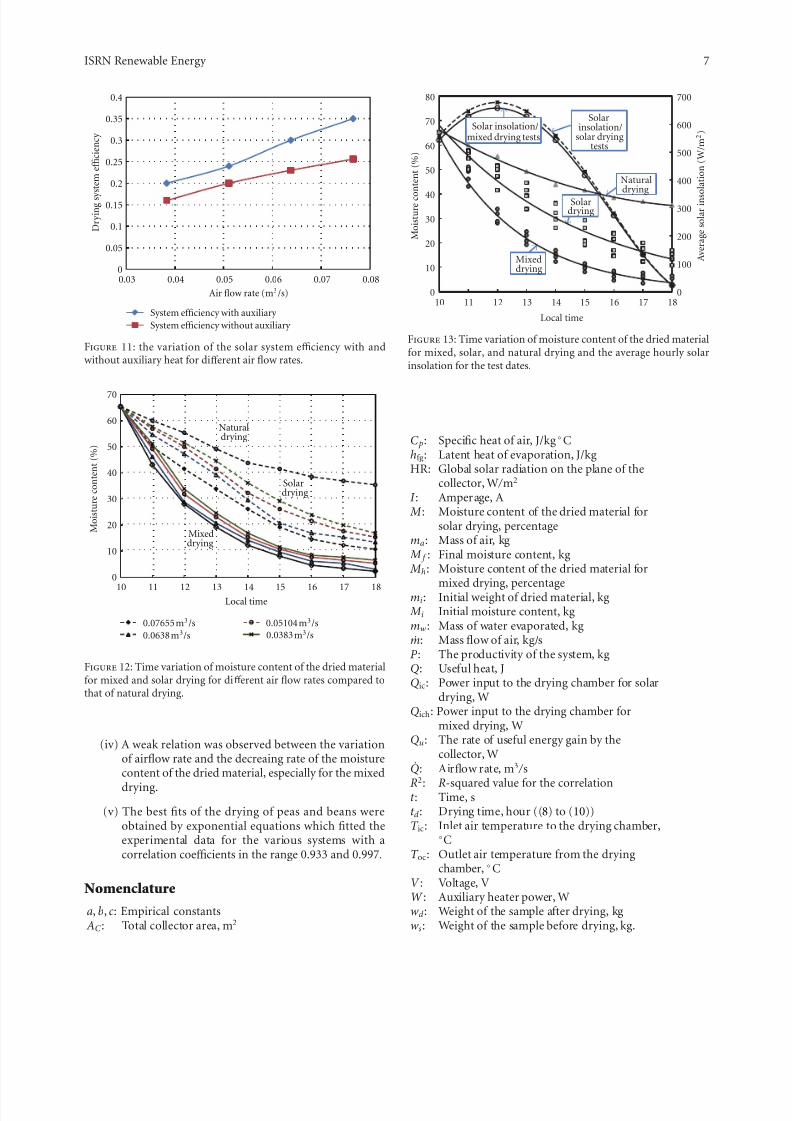
Figure 11 shows the system efficiency for solar and mixeddrying for diff erent airflow rates. An increase of 25% to 40%in the mixed drying system efficiency can be noticed. Therange of efficiency is increased from 0.16 to 0.26 for the solely solar system to 0.20 to 0.35 for the auxiliary supplementedsystem. The time variation of the moisture content for mixed
7/27/2019 789324.pdf
http://slidepdf.com/reader/full/789324pdf 5/9
ISRN Renewable Energy 5
80
70
60
50
40
30
20
10
09 10 11 12 13 14 15 16 17 18 19
Local time
M o i s t u r e c o n t e n t (
% )
(a)
80
70
60
50
40
30
20
10
09 10 11 12 13 14 15 16 17 18 19
Local time
M o i s t u r e c o n t e n t ( % )
Solar drying
0.07655 m3/s
0.0638 m3/s
0.05104 m3/s
0.0383 m3/s
Natural drying
(b)
Figure 5: Time variation of moisture content for solar (a) andmixed drying (b) for peas with diff erent flow rate.
and solar drying is shown in Figure 12 for diff erent air flow rates and is compared to natural drying. The diff erence indrying time between the natural, solar and mixed dryingis clear. Figure 13 shows the correlations of (9) and (10)that developed from the data of both peas and beans forall flow rates together with the average hourly values of thesolar insolation for the days of the tests. Although the testswere carried out in diff erent days, the average hourly solarinsolation for the natural, solar and mixed drying tests show comparable valus as can be seen from the figure.
70
60
50
40
30
20
10
09 10 11 12 13 14 15 16 17 18 19
M o i s t u r e c o n t e n t (
% )
(a)
70
60
50
40
30
20
10
09 10 11 12 13 14 15 16 17 18 19
M o i s t u r e c o n t e n t ( % )
Solar drying
0.07655 m3/s
0.0638 m3/s
0.05104 m3/s
0.0383 m3/sNatural drying
(b)
Figure 6: Time variation of moisture content for solar (a) andmixed drying (b) for beans with diff erent flow rate.
Table 1 summerzies the results obtained for the tests onthe two diff erent products. The drying time is reduced from56 hours for natural drying to 12–14 hours for solar dryingand to 8-9 hours for mixed (solar plus auxiliary) drying. Itcan also be noticed that the quantity of air required for themixed drying system (238 m3) is less than that for the solardrying system (655 m3). A reduction in the drying time by 33% and 36% for peas and beans respectively is obtained.This means less energy consumption by the air blower as wellas shorter working hours. The energy required however is
7/27/2019 789324.pdf
http://slidepdf.com/reader/full/789324pdf 6/9
6 ISRN Renewable Energy
0
10
20
30
40
50
60
70
0
100
200
300
400
500
600
700
800
10 11 12 13 14 15 16 17 18
M o i s t u r e c o
n t e n t ( % )
P o w e r ( W )
Local time
0.07655 m3/s
Qich
Qic
M h%
M %
Figure 7: Time variation of input power to the drying chamber
(Qic, Qich) and the moisture content of the dried material ( M %, M h%) for solar and mixed drying, respectively, for an air flow rateof 0.07655 m3/s.
0
10
20
30
40
50
60
70
0
100
200
300
400
500
600
700
800
10 11 12 13 14 15 16 17 18
M o i s t u r e c o n t e n t ( % )
P o w e r ( W )
Local time
0.0638 m3/s
Qich
Qic
M h%
M %
Figure 8: Time variation of input power to the drying chamber(Qic, Qich) and the moisture content of the dried material ( M %, M h%) for solar and mixed drying, respectively, for an air flow rate
of 0.0638 m3/s.
increased by 22% for peas and by 30% for beans, which isthe contribution of the auxiliary heater.
6. Conclusions
A solar drying system was investigated with and withoutauxiliary heater to evaluate the power, quantity of hotair, system efficiency and the time required for dryingbeans and peas under airflow rate in the range 0.0383 and
0
10
20
30
40
50
60
70
0
100
200
300
400
500
600
700
800
10 11 12 13 14 15 16 17 18
M o i s t u r e
c o n t e n t ( % )
P o w
e r ( W )
Local time
0.05104 m3/s
Qich
Qic
M h%
M %
Figure 9: Time variation of input power to the drying chamber(Qic, Qich) and the moisture content of the dried material ( M %, M h%) for solar and mixed drying, respectively, for an air flow rate
of 0.05104 m3/s.
0
10
20
30
40
50
60
70
0
100
200
300
400
500
600
700
800
10 11 12 13 14 15 16 17 18
M o i s t u r e c o n t e n t ( % )
P o w e r ( W )
Local time
0.0383 m3/s
Qich
Qic
M h%
M %
Figure 10: Time variation of input power to the drying chamber(Qic, Qich) and the moisture content of the dried material ( M %, M h%) for solar and mixed drying, respectively, for an air flow rateof 0.0383 m3/s.
0.07655 m3/s. The experimental investigation yielded thefollowing conclusions:
(i) The drying time for both beans and peas was reducedfrom 56 hours for natural drying to 12–14 hours forsolely solar drying and to 8-9 hours for mixed (solarplus auxiliary) drying.
(ii) An increase of 25% to 40% in the efficiency of the auxiliary supplemented drying system was foundcompared to that of the solely solar drying system.
(iii) The drying time was reduced by 33% and 36% forpeas and beans respectively due to the use of theauxiliary heat accompained by increase in the energy required by 22% for peas and 30% for beans.
7/27/2019 789324.pdf
http://slidepdf.com/reader/full/789324pdf 7/9
ISRN Renewable Energy 7
0
0.05
0.1
0.15
0.2
0.25
0.3
0.35
0.4
0.03 0.04 0.05 0.06 0.07 0.08
D r y i n g s y s t e m e f fi c i e n c y
System efficiency with auxiliary
System efficiency without auxiliary
Air flow rate (m3/s)
Figure 11: the variation of the solar system efficiency with andwithout auxiliary heat for diff erent air flow rates.
0
10
20
30
M o i s t u r e c o n t e n t ( % )
40
50
60
70
10 11 12 13 14
Local time
15 16 17 18
Naturaldrying
Solardrying
Mixeddrying
0.07655 m3/s
0.0638 m3/s
0.05104 m3/s0.0383 m3/s
Figure 12: Time variation of moisture content of the dried materialfor mixed and solar drying for diff erent air flow rates compared tothat of natural drying.
(iv) A weak relation was observed between the variationof airflow rate and the decreaing rate of the moisturecontent of the dried material, especially for the mixeddrying.
(v) The best fits of the drying of peas and beans wereobtained by exponential equations which fitted theexperimental data for the various systems with acorrelation coefficients in the range 0.933 and 0.997.
Nomenclature
a, b, c: Empirical constants AC : Total collector area, m2
0
100
200
300
400
500
600
700
0
10
20
30
40
50
60
70
80
10 11 12 13 14
Local time
15 16 17 18
Naturaldrying
Solardrying
Mixeddrying
Solarinsolation/
solar dryingtests
Solar insolation/mixed drying tests
M o i s t u r e c o n t e n t ( % )
A v e r a g e s o l a r i n s o l a t i o n ( W / m 2 )
Figure 13: Time variation of moisture content of the dried materialfor mixed, solar, and natural drying and the average hourly solarinsolation for the test dates.
C p: Specific heat of air, J/kg ◦Chfg: Latent heat of evaporation, J/kgHR: Global solar radiation on the plane of the
collector, W / m2
I : Amperage, A M : Moisture content of the dried material for
solar drying, percentagema: Mass of air, kg M f : Final moisture content, kg M h: Moisture content of the dried material for
mixed drying, percentagemi: Initial weight of dried material, kg M i Initial moisture content, kgmw: Mass of water evaporated, kgm: Mass flow of air, kg/sP : The productivity of the system, kgQ: Useful heat, JQic: Power input to the drying chamber for solar
drying, WQich: Power input to the drying chamber for
mixed drying, WQu: The rate of useful energy gain by the
collector, WQ: Airflow rate, m3 / sR2: R-squared value for the correlationt : Time, st d : Drying time, hour ((8) to (10))T ic: Inlet air temperature to the drying chamber,
◦CT oc: Outlet air temperature from the drying
chamber, ◦CV : Voltage, VW : Auxiliary heater power, Wwd : Weight of the sample after drying, kgws: Weight of the sample before drying, kg.
7/27/2019 789324.pdf
http://slidepdf.com/reader/full/789324pdf 8/9
8 ISRN Renewable Energy
Greek Symbols
α: Plate absorptance∆T : Temperature diff erence across the heater, ◦CηC : Collector efficiency, percentageηd : Efficiency of drying cabinet, percentageηh: Efficiency of heater, percentageτ : Glass transmittance(τα): Eff ective transmittance-absorptance product.
References
[1] J. O’Donoghue and R. J. Fuller, “Experience with the Australianversion of the Hohenheim solar tunnel dryer,” in Proceedings of the 37th Annual Conference of the Australian and New Zealand Solar Energy Society (Solar ’99), Victoria, Australia, 1999.
[2] D.Ivanova and K. Andonov,“Analytical and experimental study of combined fruit and vegetable dryer,” Energy Conversion and
Management , vol. 42, no. 8, pp. 975–983, 2001.[3] I. Ceytan, M. Aktas, and H. Dogan, “Mathematical modeling
of drying characteristics of tropical fruits,” Applied Thermal Engineering , vol. 27, no. 11-12, pp. 1931–1936, 2007.[4] S. A. Eltief, M. H. Ruslan, and B. Yatim, “Drying chamber
performance of V-groove forced convective solar dryer,” Desali-nation, vol. 209, no. 1-3, pp. 151–155, 2007.
[5] A. Zomorodian, D. Zare, and H. Ghasemkhani, “Optimizationand evaluation of a semi-continuous solar dryer for cereals(Rice, etc),” Desalination, vol. 209, no. 1–3, pp. 129–135, 2007.
[6] K. E. J. Al-Juamily, A. J. N. Khalifa, and T. A. Yassen, “Testing of the performance of a fruit and vegetable solar drying system inIraq,” Desalination, vol. 209, no. 1–3, pp. 163–170, 2007.
[7] L. Bennamoun and A. Belhamri, “Design and simulation of asolar dryer for agriculture products,” Journal of Food Engineer-ing , vol. 59, no. 2-3, pp. 259–266, 2003.

7/27/2019 789324.pdf
http://slidepdf.com/reader/full/789324pdf 9/9
Submit your manuscripts at
http://www.hindawi.com