78 06.,.19 142 further tram rthe calibration and application of five-hole probes _ a __str ocm no2f...
TRANSCRIPT
FOR FURTHER TRAm
rTHE CALIBRATION AND APPLICATION OF FIVE-HOLE PROBES
_ __str A ocm
no2f
Te hn ca ;e o andum I ~ J.s~- 2ie No. -0
u January 18, 1978CZ LContract No. N17-73-C-1418ý
Copy No. /5
The Pennsylvania State University D OC~n rInstitute for Science and EngineeringAPLE RSAC LABORATORY JL317
Post ffic Box30Stae ClleePa. 16801
APPRVED -ORPUMLC RE-LEASE EADISTRIBUTION UNLIMITED
NAVY DEPARTMENT
NAVAL SEA SYSTEMS COMMAND
I 78 06.,.19 142V _n
UNCLASSIFIED
SECURITY CLASSIFICATION OF THI!b PAGE (",en Dtt, Entered)OPAGE READ INSTRUCTIONS
REPORT DOCUMENTATION BEFORE COMPLETING FORM1. REPORT NUMBER ' 2. GOVT ACCESSION NO. 3. RECIPIENT'S CATALOG NUMBER
TM 78-10,#
4. TITLE (and Subtitle) S. TYPE OF REPORT 6 PERIOD COVERED
THE CALIBRATION AND APPLICATION OF FIVE-HOLE Technical Memorandum
PROBES (U) 6. PERFORMING ORG. REPORT NUMBER
7. AUTHOR(s) 8. CONTRACT OR GRANT NUMBE7(s)
A. L. Treaster and-A. M. Yocum N00017-73-C-1418
9. PERFORMING ORGANIZATION NAME AND ADDRESS 10. PROGRAM ELEMENT. PROJECT. TASK
Applied Research Laboratory , AREA & WORK UNIT NUMBERSP. O. Box 30State College, PA 16801 _
II. CONTROLLING OFFICE NAME AND ADDRESS 12. REPORT DATE
Naval Sea Systems Command January 18, 1978Washington, DC 20362 13. NUMBER OF PAGES
14. MONITORING AGENCY NAME & ADDRESS(If different from Controlling Office) 15. SECURITY CLASS. (of this report)
UNCLASSIFIED15a. DECLASSI FICATION/ DOWNGRADING
SCHEDULE
16. DISTRIBUTION STATEME..T (of this Report)
Approved for Public Release. Distribution a-nlimited.
Per NAVSEA - January 31, 1978
17. DISTRIBUTION STATEMENT (of the abstract entered in Block 20, If different from Report)
18. SUPPLEMENTARY NOTES
Presented at 24th International Symposium, Albuquerque, New Mexico
19. KEY WORDS (Continue on reverse side if necesaary and identify by block number)
five-hole probeflow measurementcalibration
20. -%TRACT (Continuo on reverse side If necessary and Identify by block number) .
(U)-In many complex flow fields such as those encountered in turbomachines,the experimental determination of the steady-state, three-dimensionalcharacteristics of the flow field are frequently required. If spacelimitations or other considerations make nulling techniques impractical,five-hole probes in a non-nulling mode can be employed. However, thisapplication requires complete three-dimensional calibration data which --
I.. DDIJA 3 41'(d"TON 0 1 si %O-IE -, r- UNCLASSIFIED
SECURITY CLASSIFICATION OF THIS PAGE NhnData Enterge'"
7- -

UNCLASSIFIED
"St URITY CLASSIFICATION OF THIS PAGEr(,'hen Iata Enter.d)
are not usually supplied by commercial vendors. Presented in this paperare the results of programs to calibrate and employ five-hole probes ofboth angle-tube and prismatic geometries. Included are descriptions of
the calibration technique, typical calibration data, and an accompanyingdiscussion of the application or interpolation procedure. Also documentedare the variations in the calibration data due to Reynolds number and wallproximity effects. Typical measured data are included and, where applicablethese data are validated by comparison with data obtained using other typesof velocity measuring instrumentation.
ACCESSIO;i for
NTIS White Section iDOC Bull Section 0UNANNOUNCED 03JISTIFICATION ............................
S.......................... ... ,...... I...... ..............
By ............................. .DISTRIBOTION/AVAILAIILITY CODES
Dist. AVAIL. and/or SPECIAL
JA
UNCLASSIFIED
SECURITY CLASSIFICATION OF THIS PAGE(*?jen Data Entered)
--------------------------------------------------------- ---..-
-W-
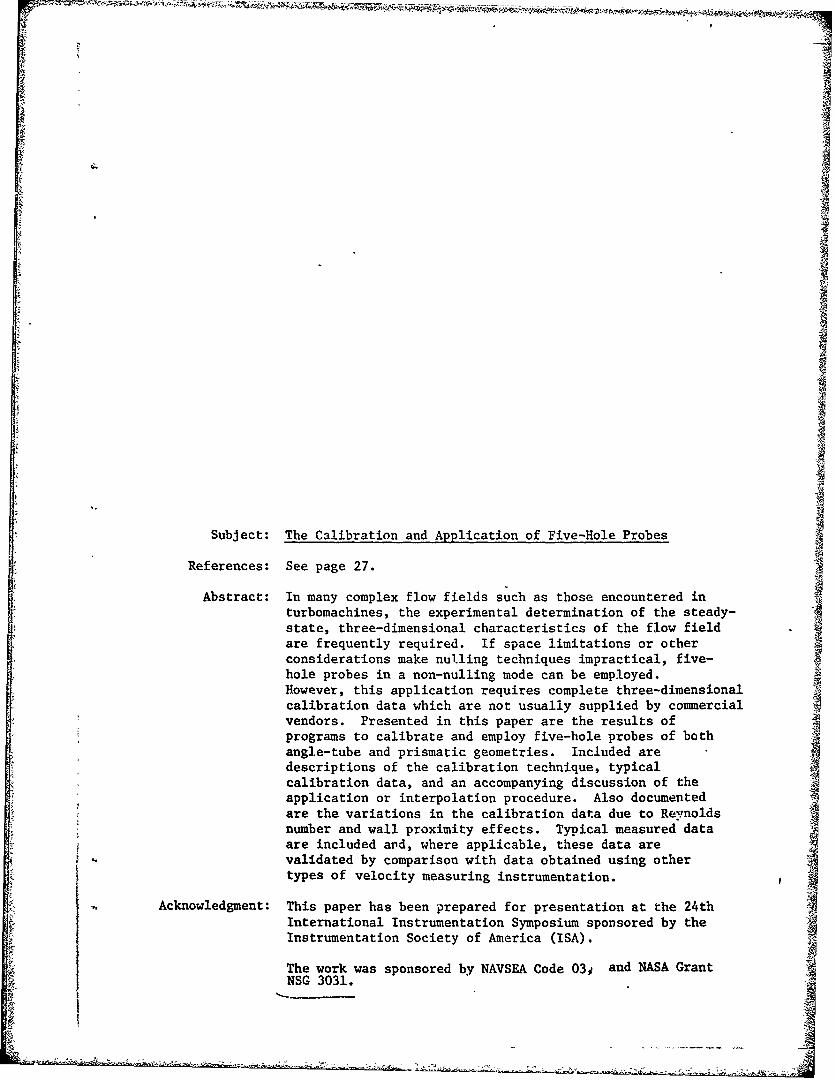
Subject: The Calibration and Application of Five-Hole Probes
References: See page 27.
Abstract: In many complex flow fields such as those encountered inturbomachines, the experimental determination of the steady-state, three-dimensional characteristics of the flow fieldare frequently required. If space limitations or otherconsiderations make nulling techniques impractical, five-hole probes in a non-nulling mode can be employed.However, this application requires complete three-dimensionalcalibration data which are not usually supplied by commercialvendors. Presented in this paper are the results ofprograms to calibrate and employ five-hole probes of bothangle-tube and prismatic geometries. Included aredescriptions of the calibration technique, typicalcalibration data, and an accompanying discussion of theapplication or interpolation procedure. Also documentedare the variations in the calibration data due to Reynoldsnumber and wall proximity effects. Typical measured dataare included and, where applicable, these data arevalidated by comparison with data obtained using othertypes of velocity measuring instrumentation.
Acknowledgment: This paper has been prepared for presentation at the 24thInternational Instrumentation Symposium sponsored by theInstrumentation Society of America (ISA).
The work was sponsored by NAVSEA Code 031 and NASA GrantNSG 3031.

o -
-2- 18 January 1978ALT:AMY:jep
Table of Contents
Abstract ................ ........................ .... . 1
Acknowledgment ...... .... .................... . . ..
List of Figures ..... ......... ......................... . . 3
Nomenclature ........ ................ ..... .*.... 4
INTRODUCTION .................. .............................. 5
PROBE GEOMETRIES ....................................... 7
CALIBRATION ............... ........................ . . . . . 9
Discussion ..... ......... ..... ......................... 9
Apparatus and Procedure .......... ................... .... 11
Results of the Calibrations ........ ................. ... 12
APPLICATION .......... ........................... . 15
THE EFFECTS OF REYNOLDS NUMBER ON THE CALIBRATION DATA ........ ... 19
WALL PROXIMITY EFFECTS ON THE CALIBRATION DATA .... .......... ... 21
EXPERIMENTAL APPLICATION ............ ..................... ... 24
SUMMARY ................. ......................... . . . .. .25
References .................... ............................ ... 27
Appendix A .................. ............................ 28
Figures ..... ........... ............................. . 34
!I
- ~~ ~ ~ 4L~--&~ ~

-3- 18 January 1978ALT:AMY:jep
List of Figures
Figure No. Title Page
1 Geometry of the Angle-Tube Probes ..... ......... 34
2 Geometry of the Prism Probes ....... ........... 35
3 Typical Five-Hole Probe Geometries ... ........ ... 36
4 The Yaw-Pitch Calibration Device ..... ......... 37
5 Water Tunnel Calibration ..... ............. ... 38
6 Calibration Schematic (Open Jet Facility) . . . .. 39
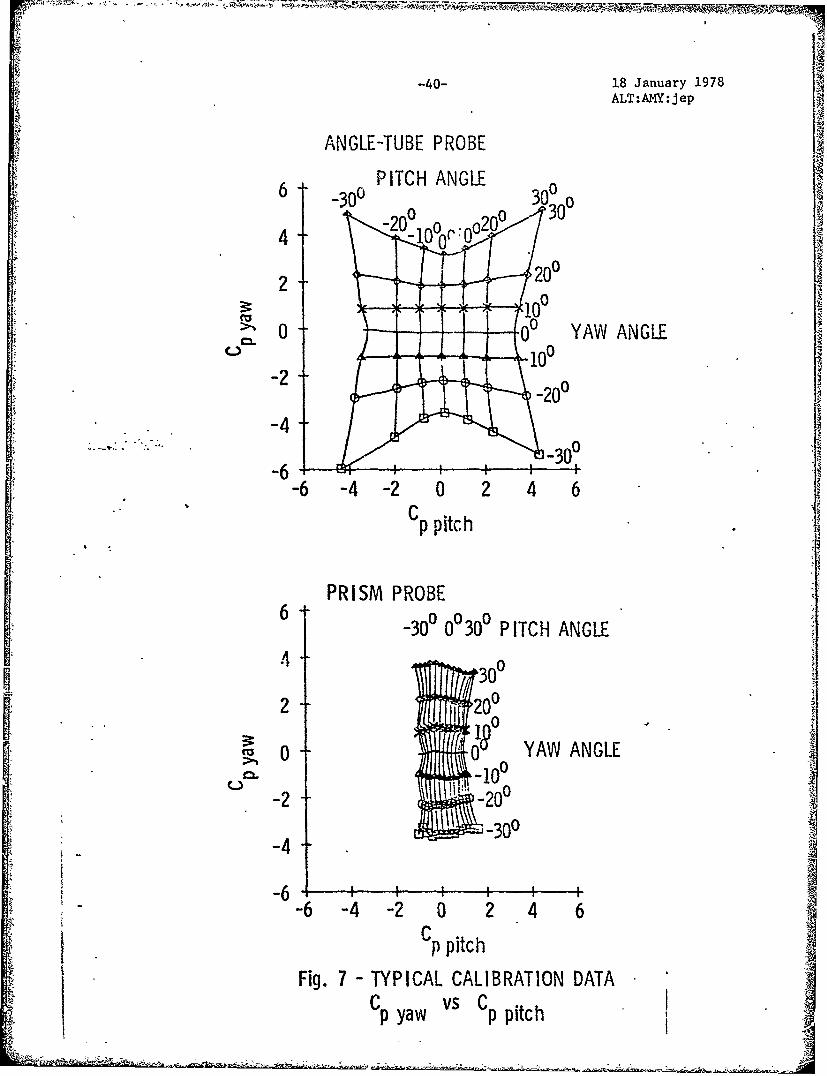
7 Typical Calibration Data Cpyaw vs Cppitch ..... 40
8 Typical Calibration Data CPstatic vs ....... . 41
9 Typical Calibration Data Cptotal vs a ......... ... 42
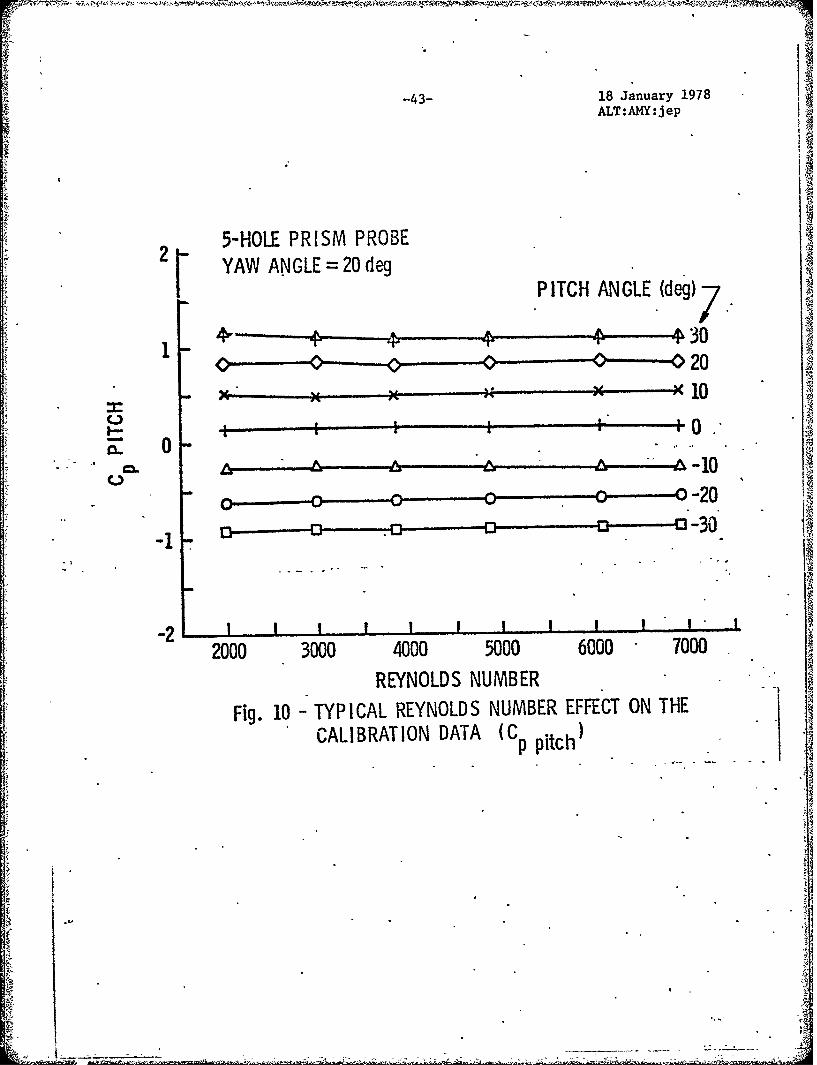
10 Typical Reynolds Number Effects on the CalibrationData (Cppit.h) .... .... ...... . 43
11 Typical Reynolds Number Effects on the CalibrationData (Cpstatic) ...... ... ................... 44
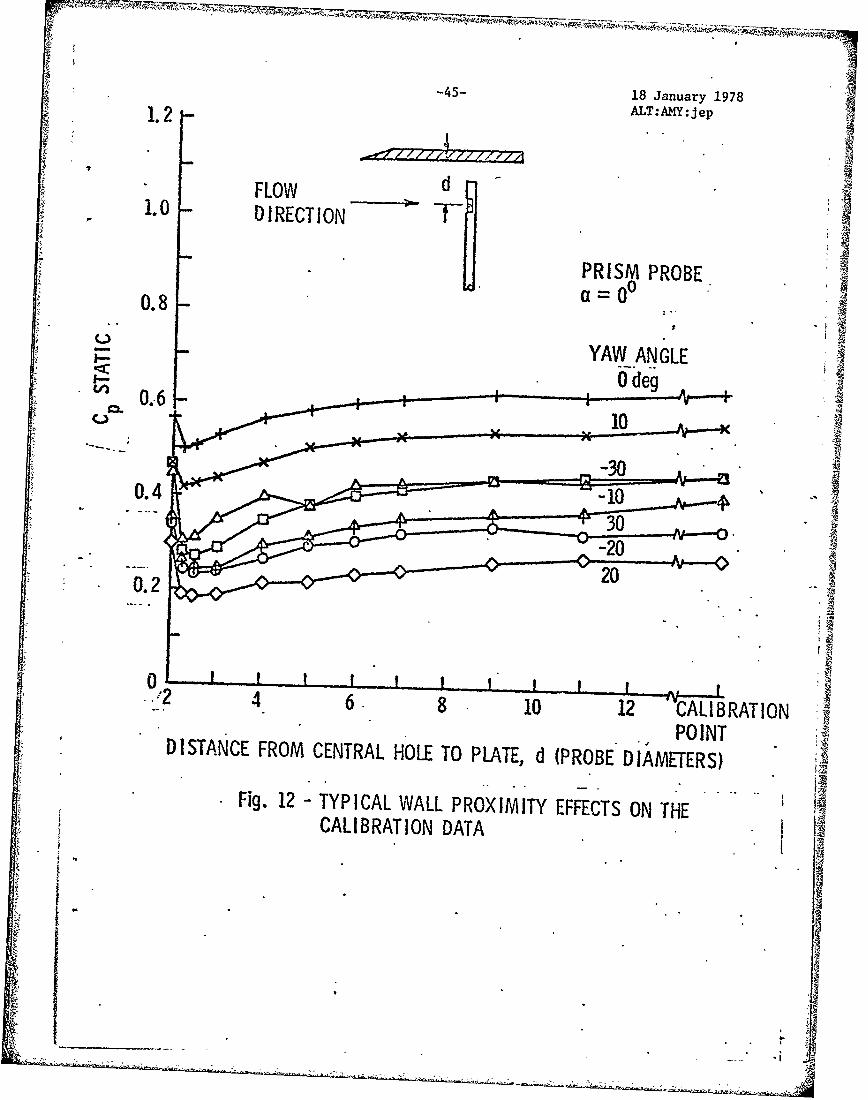
12 Typical Wall Proximity Effects on the CalibrationData ..... ....... ....................... ... 45
13 Typical Wall Proximity Effects on the CalibrationData .............................. 46
14 Typical Wall Proximity Effects on the CalibrationData ... .................... .......... ... 47
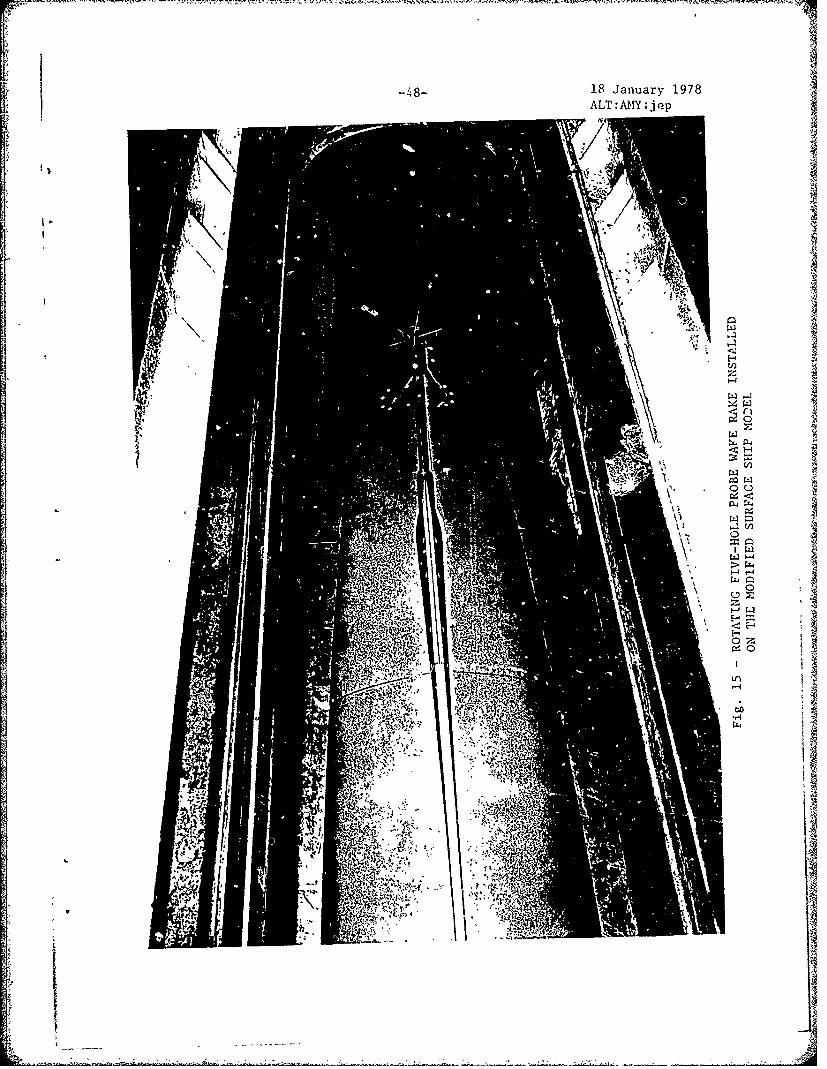
15 Rotating Five-Hole Probe Wake Rake Installed onthe Modified Surface Ship Model .... .......... ... 48
16 Typical Surface Ship Circumferential Wake Survey 49
17 Comparative Boundary Layer Surveys with ThreeTypes of Instriumentation ..... ............. ... 50
18 Comparative Propeller Wake Surveys ........... .. 51
4I,
-4- 18 January 1978ALT:AMY:Jep
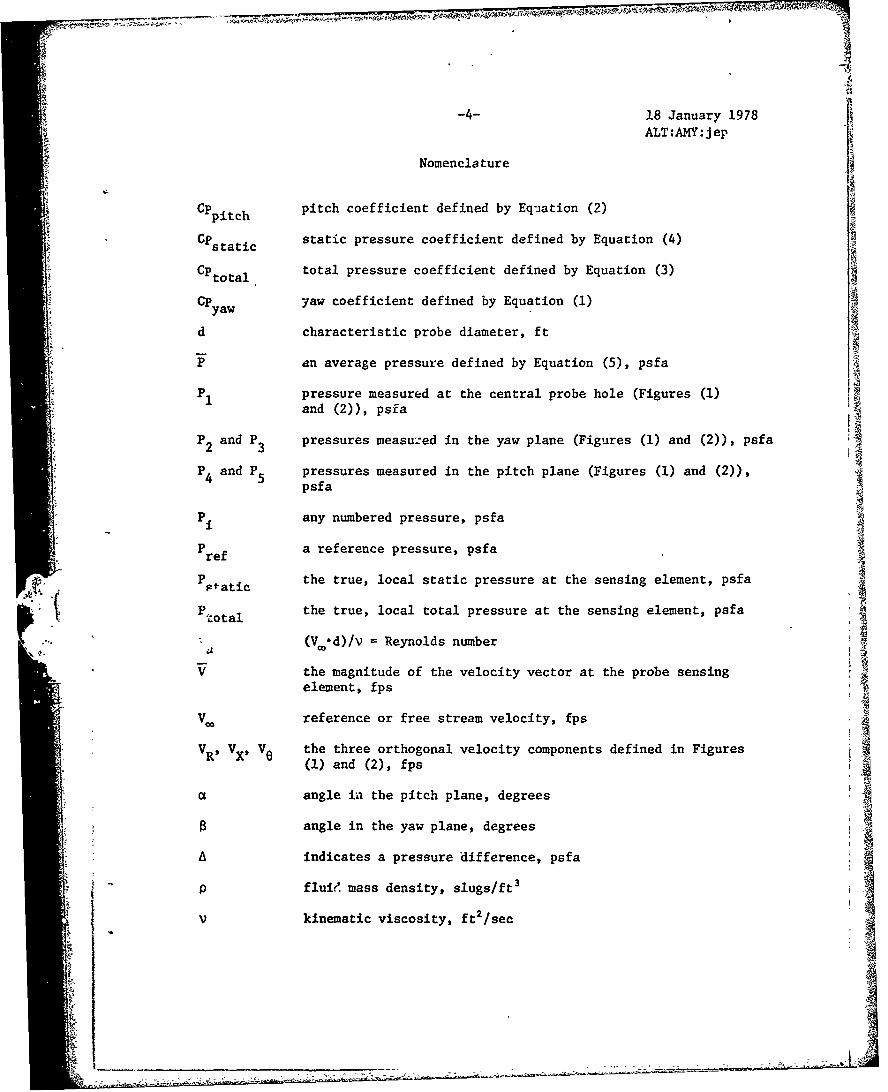
Nomenclature
Cppitch pitch coefficient defined by Equation (2)
CPstatic static pressure coefficient defined by Equation (4)
CP total pressure coefficient defined by Equation (3)total.
CP yaw coefficient defined by Equation (1)yaw
d characteristic probe diameter, ft
P an average pressure defined by Equation (5), psfa
P1 pressure measured at the central probe hole (Figures (1)and (2)), psfa
P2 and P pressures measuzed in the yaw plane (Figures (1) and (2)), psfa2 3
P4 and P5 pressures measured in the pitch plane (Figures (1) and (2)),psfa
Pi any numbered pressure, psfa
Pref a reference pressure, psfa
Pa the true, local static pressure at the sensing element, psfa
Ptotal the true, local total pressure at the sensing element, psfa
(V.,.d)/V Reynolds number
V• the magnitude of the velocity vector at the probe sensingelement, fps
V. reference or free stream velocity, fps
VR, VX, Ve the three orthogonal velocity components defined in Figures
(1) and (2), fps
a angle in the pitch plane, degrees
angle in the yaw plane, degrees
A indicates a pressure difference, psfa
p fluid mass density, slugs/ft 3
V kinematic viscosity, ft 2 /sec

-5- 18 January 1978
kLT:AMY:Jep
INTRODUCTION
In many complex flow fields such as those encountered in turbomachines,
the experimental determination of the steady-state, three-dimensional
characteristics of the flow field are required. If space limitations,
or other considerations, make nulling techniques impractical, five-hole
probes in a non-nulling mode can be employed for measurements in low speed,
incompressible flows. This application requires three-dimensional calibra-
tion data which are not usually supplied by commercial vendors. Thus, the
measurement of these data and the development of an interpolation procedure
to employ these calibration data become the responsibility of the user.
The application of five-hole probes is not new but dates back as far as
Admiral Taylor's work in 1915, Reference [1]. Other work followed; but
Pien, Reference [2], was the first to show theoretically that for a
spherical probe the velocity component in any plane in space can be
obtained independently from three pressure measurements in that plane.
Although this potential flow solution is valid for perfectly formed
spherical probes in inviscid flows of restricted angularity, Pien found
it necessary to obtain experimental calibration data. The initial pro-
gram employing five-hole probes at the Applied Research Laboratory of
The Pennsylvania State University involved the measurement of the three-
dimensional wake in the propeller plane of a surface ship model installed
in the test section of the 48-inch diameter Garfield Thomas Water Tunnel,
References [3] and [4]. Since the probes employed in this study were of
angle-tube and prismatic geometries, the approach of Krause and Dudzinski,
Reference [5], which includes geometric and viscous effects was most appli-
cable. However, this method required extension to enable the measurement of
k -- - - ---- - -i ----..
-6- 18 January 1978ALT:AMY:Iep
the local pressures and the magnitude and direction of the corresponding
velocity at the probe tip.
Because the pt 0;s of the ARL/PSU five-hole probe program were application
oriented, the objectives of the ftve-hole probe phase of the program were
rather pragmatic in nature. Primary objectives were specified in
three areas: (1) calibration: to develcf the necessary hardware and
exnerimental procedures to use existing test facilities for the
ca]ib.:a:on of the five-h,'le probes; (2) analysis: to develop
intpt•'o,. and data reduction procedures which use the calibration
eata a:,,.', measured pressures to define the velocity vector at the
probe tip; and (3) measurement: to survey known and unknown three-
dimensional flow fields.
Discussed in the following pages are the probe design considerations,
the calibration device, the calibration proce:dure, the comparison of
calibration data for different geometries, and the data analysis
techniques employed in the development of the five-hole probe system.
Because calibration data should be independent of measured quantities,
the effects of Reynolds number variations were assessed by calibrating
the prism probes in -:r over Reynolds number range of 2000 to 7000.
The angle-tube probes were calibrateO in water at a Reynolds number [of 20,000 and in air at 8400. Also investigated was the effect of
wall proximity on the calibration characteristics. Both types
of probes have been used in subsequent programs; characteristic results
are included.
-7- 18 January 1978
ALT:AMY:jep
PROBE GEOMETRIES
As the name implies, five-hole probes are characterized by five pressure
sensing holes lying in two perpendicular planes with the line of inter-
section of the two planes paqsing through the central hole. Two
different hole arrangements are diagrammed in Figures (1) and (2)
where the pitch and yaw planes are also identified.
Five hole probes are commercLally available in several configurations;
namely, spheric'±al, conical, prismatic, etc. Five different probes
that have been used at the ARL/PSU are shown in Figure (3). The
primary emphasis in this paper will be placed on the results obtained
wl.ile using the commerciaily available 0.125 inch (0.318 cm) diameter
prism probe and the angle-tube probe. The angle-tube probes were
fabricated at ARL/PSU according to the criteria presented in References
[5] and [6]. The probe tip was made from five pieces of 0.050 inch
(0.127 cm) diameter hypodermic tubing which had an assembled diameter
of 0.150 inch (0.381 cm). The tubes were bonded together with soft
solder. Tangential, epoxy fillets between the tubes were hand formed
to acceptable hydrodynamic contours. A 0.250 inch (0.635 cm) diameter
supporting member of circular cross section was chosen to avoid possible
angle-of-attack errors which may be introduced with a more streamlined
shape. The probe tip was located four support diameters upstream
of this member to avoid support interference effects. The support
was extended four support diameters beyond the tubing to improve
the flow symmetry at the probe tip.
The geometry of the prism probe facilitates its use in turbomachinery
research, since it can be easily inserted through casings and used
-8- 18 January 1978ALT:AMY:Jep
in studies where spatial restrictions are present. The geometryof the angle tube probes has generally limited their use to studies
where the presence of flow boundaries has not been a problem.
I A

-9- 18 January 1978ALT:AMY:Jep
CALIBRATION
Discussion
The five-hole probes employed in this study were used in a fixed
position or rLon-nulling mode. This means that relationships must
be determined between the measured pressures at the five holes and
I°. the true, local total and static pressure or velocity. These desired
relationships are usually expressed as dimensionless pressure coefficients,
which are functions of the flow angularity. Since, when in use,
the flow angles are unknown, relationships between the five measured
probe pressures and the flow direction are also required.
It would be advantageous if the calibration characteristics of a
five-hole probe could be determined by analytical procedures. For
probes of spherical geometry, a potential flow solution can predict
the pressure distribution and the corresponding calibration characteristicsto a reasonable accuracy. However, due to manufacturing inaccuracies
and to operating range and accuracy requirements encountered in
the laboratory or field conditions, calibrations are required for
probes of this simple geometry. For probes of angle-tube or prismatic
geometry, analytical procedures of any type are difficult. These
complex geometries, characterized by abrupt changes in contour,
are subject to viscous effects which are not modeled by current
computational techniques. Thus, the only mathematical consideration
at this stage is how to represent a given probe's response character-
istics to a known flow field.
AlL'

-10- 18 January 1978ALT:AMY:Jep
For operation in the non-nulling mode, it is apparent that the calibration
characteristics must include data that represent pressure differences
in both the pit-n and yaw planes, Figures (1) and (2), as well as
differences between the measured anL the true local total and static
pressures. The pKessure coefficients representing these data must
be defined so that they are independent of velocity and are a function
only of the flow angularity. Krause and Dudzinski [5] found chat
an indicated dynamic pressure formed by the difference between the
indicated total pressure, PI, and the averaged value of the four
indicated static pressures, P2, P3. P4 and P5, was a satisfactory
normalizing parameter. It was demonstrated in Reference [61 that
this normalizing parameter reduced the scatter in the calibration
data as compared to using the true dynamic pressure. This is convenient,
since using the true dynamic pressure would have introduced an unknown
quantity. The four calibration coefficients are defined as follows:
*CP = (P 2-P 3) / (elP) (1)yaw 23 1
Cpitch= (P 4-P )/(PI-P) (2)
SC~~~total I (P-total)PiP 13
Cpstatic P-P static) 1(PI-P) (4)
P'= (P2+Ps+P4+P )/4 (5)
The pitch and yaw planes are illustrated in Figures (1) and (2). Their
-all terms are defined in the nomenclature
-11- 18 January 1978ALT:AMY:Jep
orientation relative to the probe is dependent on the device used
to position the probes during calibration. The "yaw-pitch" device
shown in Figure (4) wae used in a uniform flow field and permitted
first a rotation of the probe about its longitudinal axis; i.e., a
change in yaw anglp, . The probe was then tilted forward or backward
providing a change in pitch angle, a. An alternate approach would
be to use a "pitch-yaw" device which permitted a pitching motion followed
by a yawing motion. Either approach is satisfactory if the user is
consistent in the resolution of the velocity vectors, Figures (1)
and (2). For both calibration and application, the probe's reference
line is defined by some consistent characteristic of the probe's
geometry. In application a reference direction obtained by balancing
P2 with P3 and P4 with P5 is not always meaningful since initially
a known flow direction would be required to telate the balanced condition
to an absolute spatial reference.
Apparatus and Procedure
The previously discussed "yaw-pitch" calibration device, which is
shown installed in the circular test section of the 12-inch diameter
water tunnel, Figure (5), permitted a ±300 rotation in both pitch
and yaw. Because uniform flow fields were available in the 12-inch
diameter water tunnel and an open jet facility, a more complex device
wbich would have maintained the probe tip at a fixed location was
not required. During the calibrations conducted in the open jet
facility, precautions were taken to insure that the probes were located t
in the potential core of the jet. The velocity in the test section
of the water tunnel and in the potential core of the jet, Reference [7],
___ ii
-12- 18 January 1978
ALT;AMY:jep
had been shown by previous studies to be uniform within the accuracy of the
experimental measurements.
A schematic diagram of the instrumentation for the open jet calibrations is
shown in Figure (6). The reference total pressure was measured in the upstream
settling section, and atmospheric pressure was used as the reference static pres-
sure. A similar arrangement was used in the water tunnel calibrations except,
the reference static pressure was recorded by a wall pressure tap in the test
section.
To conduct the calibration of a given probe, the test velocity was maintained at a
constant value. For calibration conducted in the 12.0-inch diameter water tunnel,
the test section pressure was set at a value that was high enough to avoid cavita-
tion at the probe tip. The probe was positioned at one of the predetermined yaw
angles and then moved in prescribed increments through the pitch angle range. At
each oL the calibration points, the seven differential pressures indicated in
Figure (6) were recorded and processed on an IBM 1130 computer. The data reduction
program enabled the calculation of the four previously defined pressure coefficients,
the test section velocity, and the Reynolds number based on the probe tip diameter.
Each probe was calibrated three times; the resulting voltages were repeatable with-
in two percent of the voltage corresponding to the maximum dynamic pressure. The
final calibration characteristics were the mean values of the coefficients computed
from the three individual runs. A statistical analysis of these data based on a
typical probability curve indicated that the 90 percent error of the mean was less
than 2.25 percent of the maximum value of each coefficient.
Results of the Calibrations
A complete set of calibration data for both probe geometries are pre-
sented in Figures (7), (8) and (9), where the graphical data have
been represented by spline curves, Reference [8], passing through

-13- 18 January 1978ALT:AMY:Jep
the individual data points. Shown in Figure (7) are grids of Cpyaw
versus Cppitch, where the nearly horizontal curves are curves
of constant a and the nearly vertical curves are curves of constant
a. Figures (8) and (9) show the variation of CPstatic and CPtotal
with o for constant values of B.
Basically, the calibration data for the two probes are similar; the
differences can be primarily attributed to geometric characteristics.
One difference is indicated by the comparison of the two Cppitch
versus CPya grids, which show that the prism probe has a much smaller
range of Cp values. This reduced range will result in an increasedpitch
sensitivity of the prism probe to small flow variations in the pitch
plane. The velocity component in this plane may, therefore, exhibit
more data scatter.
The smaller range in Cppitch is attributed to the different types of
surfaces on which the holes in the two planes are located. At large
yaw angles, one hole in the yaw plane is approximately aligned with
the rlow and senses pressures near the free-stream total pressure.
The other hole senses a pressure much less than the free-stream static
pressure, due to the acceleration of the flow around the probe.
For the prism probe, however, the holes in the pitch plane have
a different response. At large pitch angles, one hole again
senses a pressure near the free-stream total pressure, whereas
the other hole senses a pressure that is greater
than the free-stream static pressure. This latter pressure may be
higher due to a lower local acceleration and pressure recovery in
the separated flow. Thus, the pressure difference sensed by the holes
in the yaw plane exceed the difference measured by the holes in the
-14- 18 January 1978
ALT:AMY:Jep
pitch plane. The resulting pressure coefficients reflect these
differences.
The other major difference between the response of the two types of
probes is that the Cptti response of the prism probe, Figure (8),
is somewhat skewed'with respect to that of the angle-tube probe.
The central hole of the prism probe is located only two probe diameters
from its tip and is probably subject to complex end-flow effects.
Whereas, the angle-tube probe had an extended support to improve flow
symmetry.
Other repeatable nonsymmetries appearing ii! the data apparently resulted
from the inability to fabricate a symmetric probe. Differences between
the calibratior characteristics of different probes of similar size
and geometry were also observed. These observations emphasize the
need to individually calibrate each probe.
All calibration data were repeatable within the two percent of the
reference dynamic pressure when subjected to recalibration. These
data consistently described the response of a particular probe, and
thus, permit the successful application of the five-hole probes in
a non-nulling mode. 54A
S-15- 18 January 1978ALT:AMY:jep
I APPLICATION
When used in the non-nulling mode of operation, the five-hole probe
provides five pressure measurements via a differential pressure
transducer. These pressures are usually :ecorded relative to some
reference pressure, Pref; i.e.,
i = Pi -Pref (6)
where the subscript "i" refers to the subject pressure. Local total
and static pressure, pitch angle, yaw angle, and the three orthogonal
velocity components can be computed from the probe data and the
measured reference pressure. The interpolation procedures to perform
these calculations have been computer-adapted and rely on the use of
spline curves for all data specification.
The values of a and 8 are calculated from the grid of Cpyaw versus
Cppitch. The values to be determined from the calibration data
are a function of two independent variables, and thus a double
interpolation procedure is required. Using the measured data, Cpyaw 5
and Cpptch can be calculated from Equations (1) and (2). These
experimental coefficients are represented by the "primed" superscripts,iLe.$ a C Individual spline curves arq passed through
CiPyawtch
the Cp versus Cp calibration data for each value of 0. Atyaw pitch
P pitch' the corresponding values of Cpyaw are interpolated from the
spline curves yielding the variation of a versus Cp yaw. This
resulting monotonically increasing function, when evaluated at

-16- 18 January 1978ALT:AMY:Jep
Cp, yields the experimental local flow angle in the yaw plane, 5'.
By interchanging the dependent and independent variables and forming
the functional relationship between a and Cpplc for a constant value
of C' the experimental value of the local pitch angle, a', canPyaw'
be determined.
From a' and V' the experimental value of the static pressure coefficient,
C' is obtained from the second part of the calibration data.
Individual spline curves are passed through the Cp statc versus a
data for each value of 5. At a', the corresponding values of CP.tatic
are interpolated from the spline curves yielding the variation of
CPstatic versus $. When the resulting curve is evaluated at a', the
experimental value of the static pressure coefficient, Cpstatic, results.
The experimental value of the total pressure coefficient, C'total'
is evaluated in the same manner using the third graph of the calibration
data.
When the absolute value of the reference pressure is recorded, the
total and static pressures at the probe tip can be computed from CPtotal
and Cpttic respectively.
Cncttal (I (AP -AP MAPI-P") (7)
l 1
and
-17- 18 January 1978ALT:AMY:Jep
total -ref (8)
M
Thus,
Ptotal =Pref + 1P1 - Ctotal(P-AP) "(9)
In Equation (9), all terms on the right of the equal sign are measured
values except for C' which was determined from the calibrationI Ptotal
data. In a similar manner, the static pressure is computed as
SPstatic = ref + static (10)
By using Bernoulli's equation, the magnitude of the local total velocity
vector is
g =•2 Ptota!_Pstatic-) (i
By proper manipulation of the above equations,V could also be calculateddirectly from C' and C'
rPtotal a Pstatic"
- (2 /P) (AP -PA) (1+q tiC1rtotal)l (12)
:•,•V = 21p)(AP (Z+~statc-C 7j
-18- 18 January 1978ALT:AMY:Jep
When Reynolds number or wall proximity effects are present, they are
included as corrections to the calculated static pressure coefficients.
The manner by which the velocity is resolved is dependent upon the
order of rotation employed during the calibration, i.e., upon the
type of probe holder employed. The two corresponding sets of equations
are presented in Figures (1) and (2) where the spatial orientation
of the velocity vectors are illustrated. A more mathematically rigorous
approach to the velocity resolution is discussed in Appendix A.
£I
}I
41
-19- 18 January 1978ALT:AMY:jep
THE EFFECTS OF REYNOLDS NUMBER ON THE CALIBRATION DATA
Meaningful calibration data should be independent of the measured
quantities. In most five-hole probe applications, velocity is the
primary parameter to be measured; thus, the effect of changes in
Reynolds number, R n, on the calibration data should be evaluated.
To investigate these effects the prism probes were calibrated in the
open jet facility over an R range of 2000 to 7000. The angle-tuben
probes were calibrated in the water tunnel at R =20,000 and in then
open jet facility at R =8400.n
For both types of five-hole probes the total pressure, pitch and yaw
coefficients were essentially uneffected by the Reynolds number variation.
Whereas, a measurable change in the static pressure coefficient was
observed for both probe geometries. Typical results for the prism
probes are shown in Figures (10) and (11). As an example, the effect
of an R variation from 3000 to 7000 at a=30, $=20 is shown to producen
a maximum change in measured static pressure of 5.5 percent of the
dynamic head and a 2.8 percent change in the velocity measurement.
To account for the dependency of the static pressure coefficient on
the Reynolds number, a three parameter calibration in terms of a,
8, and Rn would be necessary. In application, a corresponding iterative
* procedure in terms of the unknown R would be required. These complicationsn
limit the practicality of the probes if they are to be used in studies
characterized by large R variations. However, several approachesn
N are possible: one is to calibrate at the expected Reynolds number,another is to determine correction factors from the calibration data
and to apply these as average values over small Rn ranges. This latter
-20- 18 January 1978
ALT:AMY:jep
approach is justified due to the relatively weak dependence of CPstatic
on R . Both of these approaches are currently being employed.n
I
;gn
$? ._ _ _ _=} -l
-21- 18 January 1978ALT:AMY:Jep
WALL PROXIMITY EFFECTS ON THE CALIBRATION DATA
The experimental investigation of wall proximity effects on the calibration
characteristics of the prism probes was conducted in the presence
of a sharp-edged flat plate that spanned the working area of the open
Jet facility. With the flat p.ate mounted parallel to the flow and
with the measuring station located S.0 inches (12.7 cm) downstream
of the leading edge, the locol boundary-layer thickness was small compared
to the probe diameter. Thus, any chan3es in the calibration cbaracteristics
in the proximity of the plate were attributed to a probe-plate potential
flow interaction as opposed to boundary-layer effects. It sbould
!• be noted that errors in boundary-layer measurements are primarily
a function of the local velocity gradient and the size and spacing
of the holes. This implies that the problem in boundary-layer measure-
ments is one of probe selection and not one of calibration.
Calibrations were conducted at R =7000 for the probe both approachingn
and being withdrawn through the plate. For both installat!ons,
was varied from -30* to +300 at each of the selected measuring points
while maintaining a=00 and a perpendicular probe-plate orientation.
These latter restrictions were necessary; since, with the present
apparatus, it was impossible to change the flow angle, a, without
also altering the orientation of the probe with respect to the plate.
Although the effects caused by a wall may be a function of both a
and B as well as the distance to the wall, the pitch angle could
not be varied without introducing the probe-plate orientation as
"I -an additional variable. Thus, to apply the wall effects data the
-22- 18 January 1978ALT:AMY:Jep
assumption must be made that the probe response is independent of
pitch angle. This assumption appears reasonable frow observations
of the available data. Figures (12) and (14) show that the changes
in calibration data as a function of distance are quite similar for
the various yaw angles tested. This suggests that the wall proximity
effects are primarily a function of distance only. Additional investi-
gations in this area would require an apparatus capable of changing a
whilc maintaining the same probe-like orientation. For calibrations
with the probe approaching the plate, only the static pressure coefficient
was altered, A representative variation of Cp with probe-to-static
plate spacing is shown in Figure (12). For the other configuration in
K which the probe was withdrawn through the plate, all calibration
coefficients were altered within two probe diameters of the plate. These
effects are illustrated by the Cp and Cp data shown inyaw static
Figures (13) and (14), respectively. This observed variation in all
coefficients makes these probes essentially impractical for measurements
when the center hole is within two probe diameters of the wall. Thus, a
limitation of two probe diameters is imp3sed as the probe is withdrawn
through a wall; whereas the probe's geometry imposes a physical limitation
of the same magnitude as the probe approaches a wall.
Restricting the use of the probe to distances greater than two probe
diameters does not eliminate all wall interaction effects. Figures
(12) and (14) show that Cp is still affected at greater distances.
stati
4O • v r
-23- 18 January 1978ALT:AMY:Jep
These effects of the wall, when limited to Cp only, can be incorporatedstaic
in the data reduction program in a similar manner to that used for the
Reynolds number effects.
"I!
is jIi T

-24- 18 January 1978ALT:AMY:jep
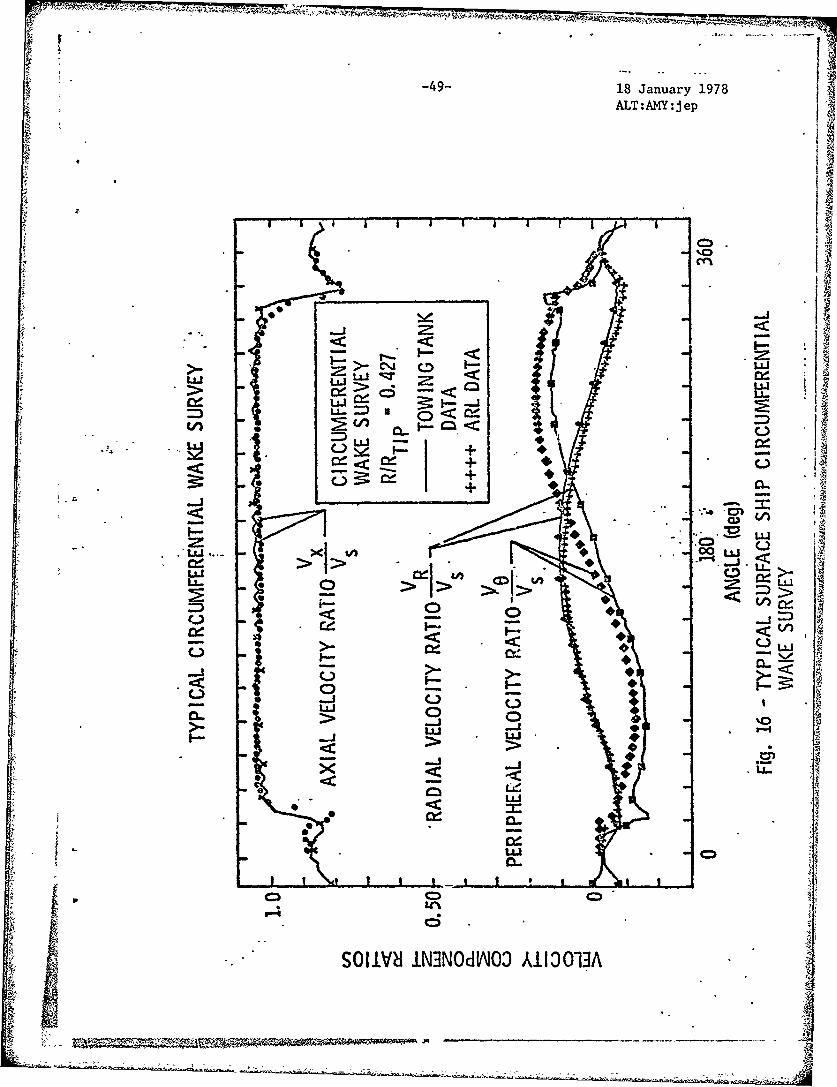
EXPERIMENTAL APPLICATION
As implied by previous statement.., the five-hole probes were first
applied at ARL/PSU to measure the three-dimensional wake occurring
in the propeller plane of a surface ship model. In this case six
individually calibrated angle-tube probes were assembled in a rotating
wake rake as shown in Figure (15). Typical results of a circumferential
survey at one radial position are presented in Figure (16) and compared
with towing tank data obtained using a 0.375 inch (0.952 cm) diameter
spherical five-hole probe.
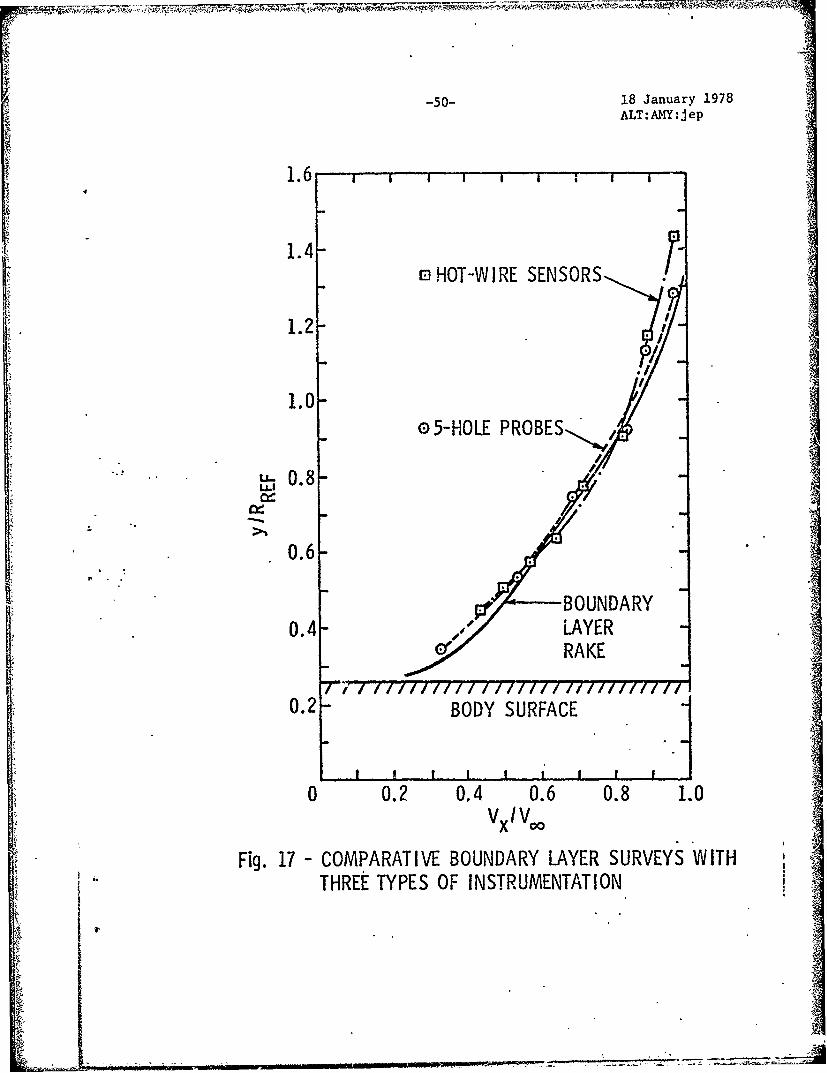
Presented in Figure (17) are the results of boundary layer surveys
conducted in air on an elliptic body of revolution. These surveys
were made with a boundary layer rake, a hot wire sensor, and a 0.125
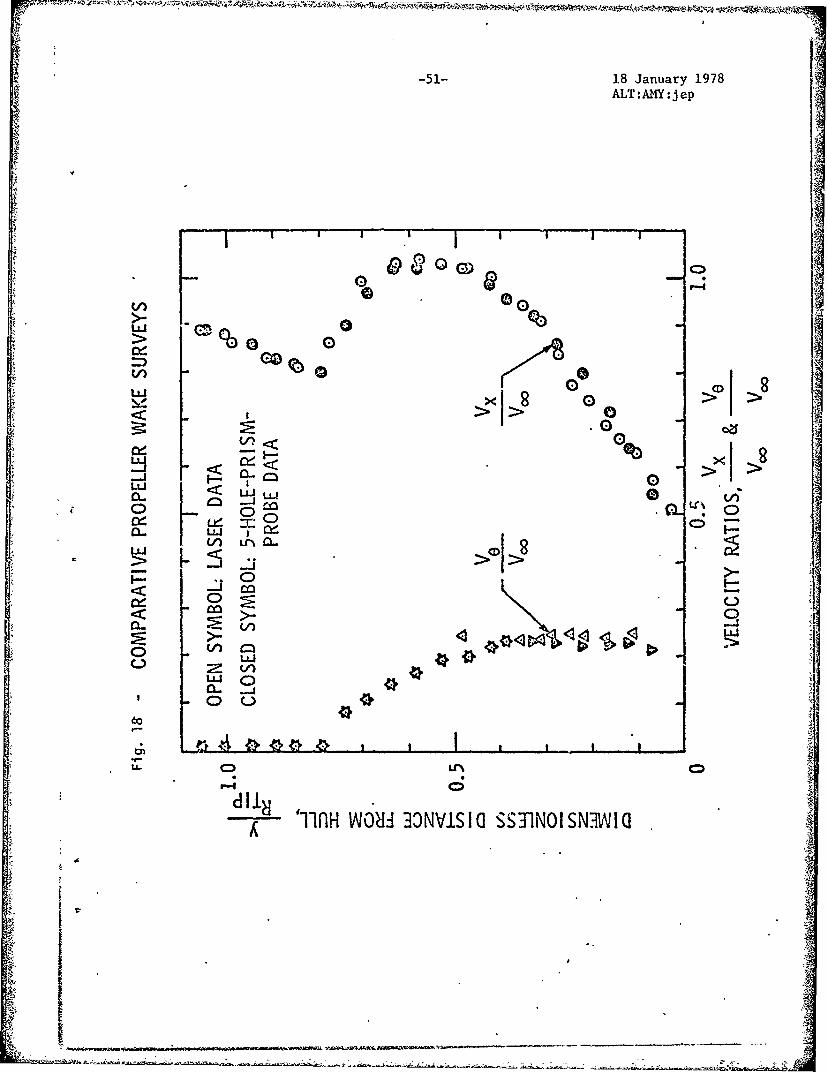
inch (0.318 cm) diameter prism probe. Additional comparative data
are shown in Figure (18), where the flow immediately downstream of
a rotating blade row was surveyed with both a laser doppler velocimeter
and a prism probe.
-25- 18 January 1978ALT:AMY:jep
SUMMARYI
Probes of angle-tube design manufactured at ARL/PSU and commercially
available prism probes were calibrated in the 12-inch diameter Iwater tunnel and the open air jet facility. The probes were
individually mounted in a calibration device which permitted a ±300
variation in both pitch and yaw angle with respect to the known
velocity. The response coefficient measured at each angular
settling, when mathematically connected by spline curves, defined
the calibration grids for each probe.
For calibrations of this type to be meaningful, the calibration data
must be repeatable and independent of the measured quantities. Each
probe was calibrated three times to demonstrate the repeatability
of tbe data and to permit the averaging of the data to further reduce
the minimal data scatter. Additional measurements were conducted
to assess the influence of Reynolds number on the calibration data.
For the range of Reynolds number employed, no effect was measured
on the pitch, yaw, or total pressure coefficients; whereas, the
static pressure coefficient showed sufficient change to cause minor
variations in the magnitude of the calculated velocity vector.
However, average correction factors were incorporated into the data
reduction procedures to account for these variations in the static
pressure coefficients.
Also investigated was the effect of wall proximity on the calibration
data obtained for the prism probe. Calibrations were conducted for
a probe approaching normal to a flat plate that had been aligned parallel
-26- 18 January 1978AAMT:~1(jep
to the reference flow. Only the static pressure coefficient exhibitedsignificant changes. For the probe being withdrawn through the
plate, all calibration coefficients were altered with two probe
diameters of the wall; however, at distances greater than two p:obe
diameters from the wall, only the static pressure coefficient was influenced.
These wall interference corrections were also incorporated in the
final data reduction program which uses a spline curve interpolation
procedure to calculate the three cylindrical velocity components
from the five measured pressures.
The probes have been used to survey the three-dimensional flow fields
in the propeller-planes of surface ships, as well as in the inlet
and exit planes of other rotating blade rows. These results
agreed well with data measured by other types of probes and velocity
measuring instrumentation.
"A
-27- 18 January 1978ALT:AMY:jep
References
[1] Janes, C. E., "Instruments and Methods for Measuring the Flow ofWater Around Ships and Ship Models," David Taylor Model BasinReport 487, March 1948.
[2] Pien, P. C., "Five-Hole Spherical Pitot Tube," Dadid Taylor Model IBasin Report 1229, May 1958.
1 3] Lehman, A. F., "The Garfield Thomas Water Tunnel," ORL TM NOrd16597-56, September 1959.
[4] Treaster, A. L. and Eisenhuth, J. J., "Surface Ship Testing at theGarfield Thomas Water Tunnel," ARL TM 77-212, June 1977.
(5] Krause, L. N. and Dudzonski, T. J., "Flow-Direction Measurementwith Fixed Position Probes in Subsonic Flows over a Range ofReynolds Numbers," NASA TMX-52576, May 1969.
[6] Gettelman, C. C. and Krause, L. N., "Considerations Entering intothe Selection of Probes for Pressure Maasurements in Jet Engines,"ISA Proc. 1, 134-137, 1952.
1] Nilsen, A. W., "Analysis of the Unsteady Pressures in a TurbulentJet," M. S. Thesis in Aercspace Engineering at The PennsylvaniaState University, September 1969.
(8] Davis, R. F., "Spline Curve Fit Functions, Their Derivation and Use,"ORL TM 512.3531-02, July 1968.
[9] Yeh, H. and Abrams, J. I., Mechanics of Solids and Fluids, Vol. 1,Chapter 11, McGraw-Hill Book Co., Inc., 1960.

-28- 18 January 1978ALT:AMY:jep
Appendix A
Vector Resolution
anwrIn this appendix an analytical development of the vector resolution
equations shown in Figures (1) and (2) is presented. The question to be
answered is: What are the R, 0 and X components of a vector V at angles
a and with respect to the local probe axes? From Figures (1) and (2)
it is obvious that this question has two answers which depend on the
definition of the pitch angle a and the yaw angle a. Defined in Figure
(1) is the relationship between a, 0 and V resulting from calibrations
where the first rotation was in the yaw-plane followed by rotation in
the pitch-plane (yaw-pitch mode). The alternate rotational procedure
(pitch-yaw mode) is defined in Figure (2). For either mode of operation
the resulting equations can be developed from the orthogonal transformation
procedure discussed in Reference [10].
Consider any vector V whose components are V1, V2 , V3 in the-' ' ~~~' V3teprmdo
original, or unprimed coordinate system and V1, Vt , V,
rotated coordinate system. It can be shown that the primed components
can be computed from
' f! alV (3-A)
where the aIs are the diretion cosines defined by
"a cosX . (2A)
The symbol (X!,Xj) represents the angle between the positive direction
"of the axes X and X. The vector resolution for data obtained from
,,tak ~

-29- 18 January 1978ALT:AMY:Jep
probes that were calibrated in the yaw-pitch mode will be examined
first.
Vector Resolution for Probes Calibrated in the Yaw-Pitch Mode
Let V be the reference velocity in the positive X direction of the3
original axes system; i.e., VI=0.0; V2=0.0 and V3=V. The first rotation
is a yawing motion about the XI axis of magnitude 8. The goemetry is
illustrated in Figure (IA).
Xl
Figure (lA)
al11 cos (X{,X 1) =cos(O@) =1.0
a21 =cos (X•,XI) =cos(900 ) =0.0
122a3 1 -- c s X , I tcs 9 " .
Sa 2 2 =cos (X•,X 2 ) = cos(83) = cos8 (3A)
: . a32 =cos (X•,X 2 ) = cos (900 +8) = -sin8
a1 3 2cos= cos(90 0) 0.0
a2 3 cos(X',X3 ) = cos(900-8) sin8
a3 3 cos(X',X3 ) = cos8
It
21 2 J
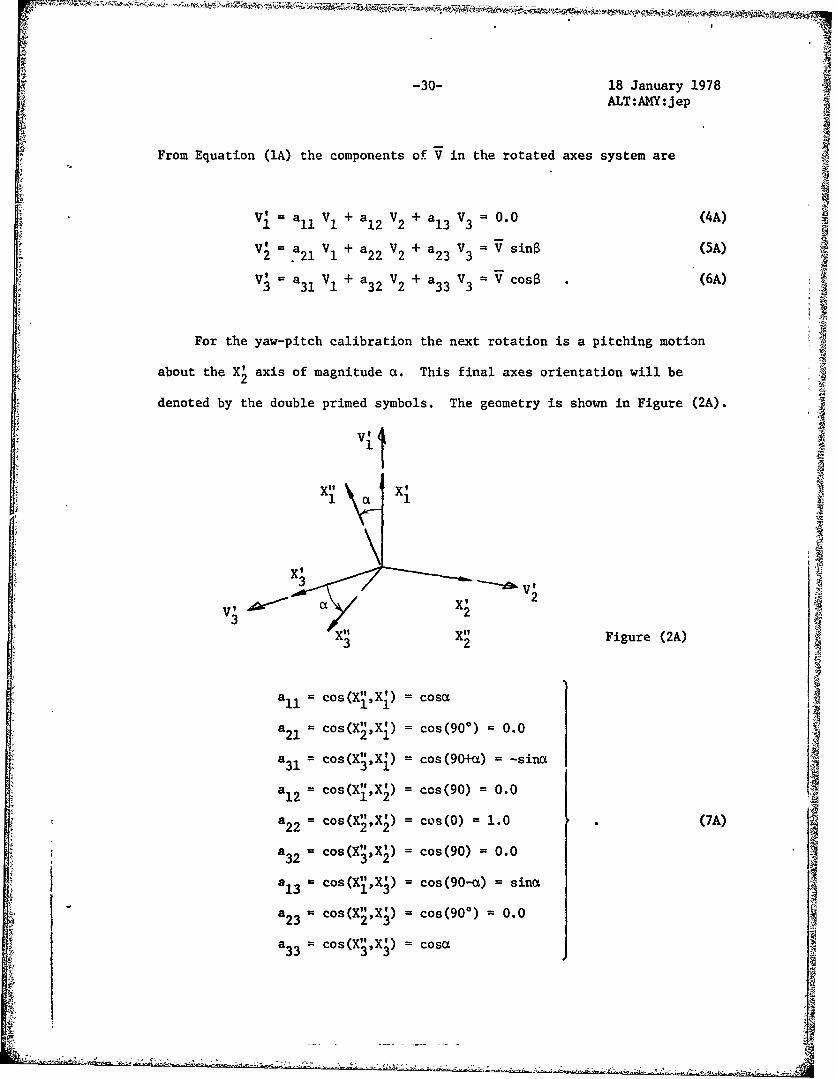
-30- 18 January 1978ALT:AMY:Jep
From Equation (IA) the components of V in the rotated axes system are
V a V1 + a1 2 V2 + a1 3 V3 0.0 (4A)
V a2 1 V + a2 2 V2 + a2 3 V3 Vsin (SA)
V'= a V1 ++a V a + a V cos8 (6A)3 31 322 333
For the yaw-pitch calibration the next rotation is a pitching moti3n
about the X' axis of magnitude a. This final axes orientation will be
denoted by the double primed symbols. The geometry is shown in Figure (2A).
VI
XI1 XI
V2 XFigure (2A)
"11 S = cosFige = cos(
a21 cos("X') = cos(90a ) 0.0Aj
a co (x2,x )a3 1 2cs(X'Xl) = cos(90+-) =-sins
a1 2 cos(Xl,X2) = cos(90) = 0.0~~3 311-
Sa2 2 = cos(X2 ,X2 ) - cos(0) -1.0 . (7A)* 832 cos(X',X ) - cos(90) = 0.0
13 cos(X",X') = cos(90-ct) = sinscos(X'",X)
a2 3 = Cos(x ,x;) = cos(90O) 0.0
a = cos(X3',X) = cosa33

-31- 18 January 1978ALT:AMY:Jep
The components V', V", V3 of the original vector V relative to the
final axes orientation are obtained by combining Equations (4A) through
(7A) via Equation (1A).
V" =a-V' + a V' + a v; V Cosa sina .(8A)1 11 1 12 2 13 3
VIS =a V' +a V2'+ a Vt Vsina (9A)2 21 1 22 2 23 V3'V11 V' + a Vt + a V=VcsBost .(10A)3 31 1 32 2 33 V33 Cosa Cos
In many applications these three velocity components are identified as
follows:
V R V V cosa sina (11A)R 1
V V" V sine (12A)e 2V =V cosa cosa . (13A)x
For surface ship applications VR is positive when directed radially inward
along the longitudinal probe axis; V0 is positive when directed counter-
clockwise when looking upstream; and V is positive in the axial directionx
as shown in Figure- (1) and (2). In Figures (IA) and (2A) the direction
of rotation was chosen so that positive vector components resulted.
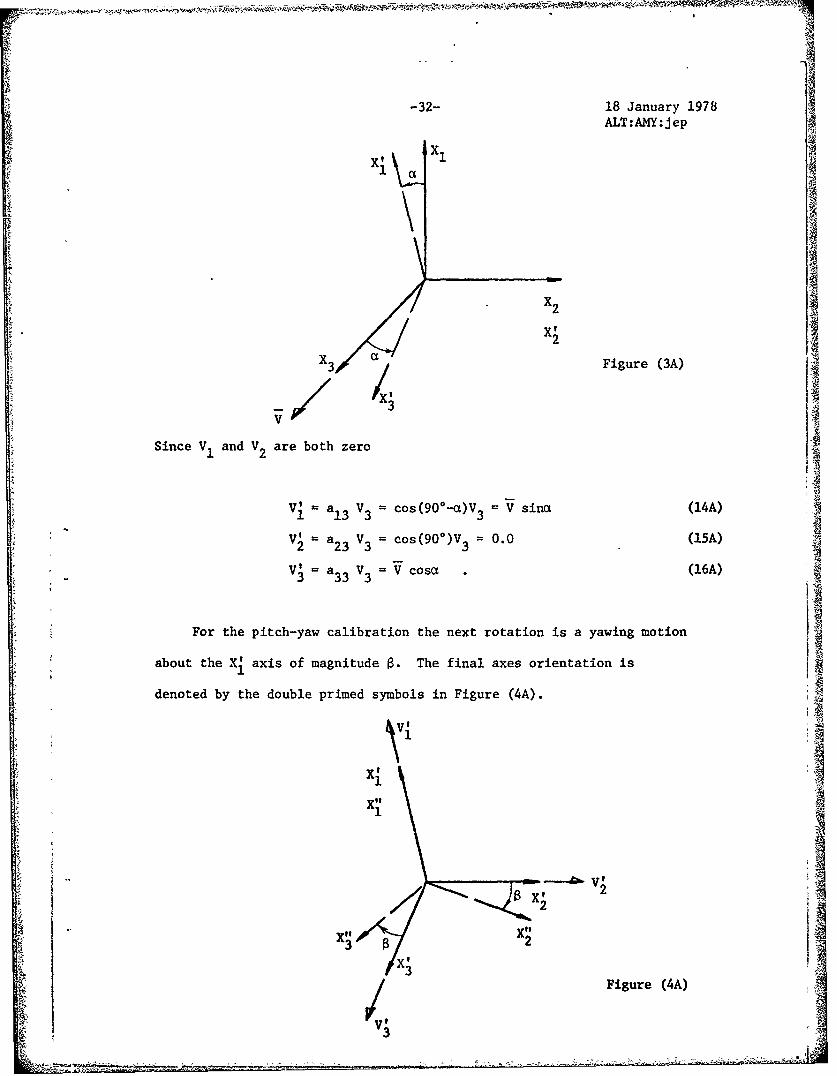
Vector Resolution for Probes Calibrated in the Pitch-Yaw Mode
The previous procedure is continued in this section; only the order
of rotation is changed. The first rotation is a pitching motion about
the X axis of magnitude a. Again, V is the reference velocity which
has V3 as its only nonzero component. The geometry is shown in Figure
(3A).
-32- 18 January 1978ALT:AMY:jep
x3
11 a
XIX2
3/ a, Figure (3A)
XIISince VI and V2 are both zero
1 21
V1' ai 3 V3 cos(90*-c)V3 V sinc (14A)
V a2 3 V3 = cos(90*)V3 0.0 (15A)
V; a 3 3 V3 = V cosa . (16A)
For the pitch-yaw calibration the next rotation is a yawing motion
about the X' axis of magnitude 8. The final axes orientation is
denoted by the double primed symbols in Figure (4A).
\V1
x• v2
K - 2F3 (2
S /•Figure (4A) 3

-33- 18 January ].978ALT:A: jep
a1 = cos(O) = 1.0
a21 cos(90*) = 0.0
a31 cos(90*) 0.0131
a1 2 = cos(900 ) = 0.0
a22 = cos (17A)
a32 cos(90+$) -sine
a13 = cos(90*) = 0.0
a23 cos(90-0) sina
a3 3 cos
As before, the components V V VI" of the original vector VAs omoes 1 2' 3
relative to the final axes orientation are obtained by combining Equations
(14A) through (17A) via Equation (1A).
V"j sinca (18A)
V cosa sine (19A)
V'" = V cosa cos • (20A)3
In more usual terminology
VR V Vsine (21A)
V0 V" Vcosa sinO (22A)
Vx V = V cosaccos8 $ (23A)
Thus, it has been demonstrated that two different sets of data reduction
equations are required by the two calibration procedures.

-34- 18 Jaiaey 1978ALT:AMY:Jep
Fig. 1 -GEOMETRY OF THE ANGLE-TUBE PROBES
VECTOR RESOLUTION r A PROBE.CALIBRATED IN THE YAW-PITCH MODEV V cos3 cosax
V V cosp sina
V = V sin 43
0p
P5
FODRT REFERENCEI
aP~~~LANE ,NLETB
PLANE
4I

-35- 18 January 1978ALT:AMY:Jep
VECTOR RESOLUTION FOR A PROBE
CALIBRATED IN THE PITCH-YAW MODE
V =V cos a cosl3
VR V sina
Vo = V cos a sin p30 V xX 5
42 /,
REE RENCE LINN E
R P
pp
Fig.2 -GEOETRYOF HE RISMPROES4
~V
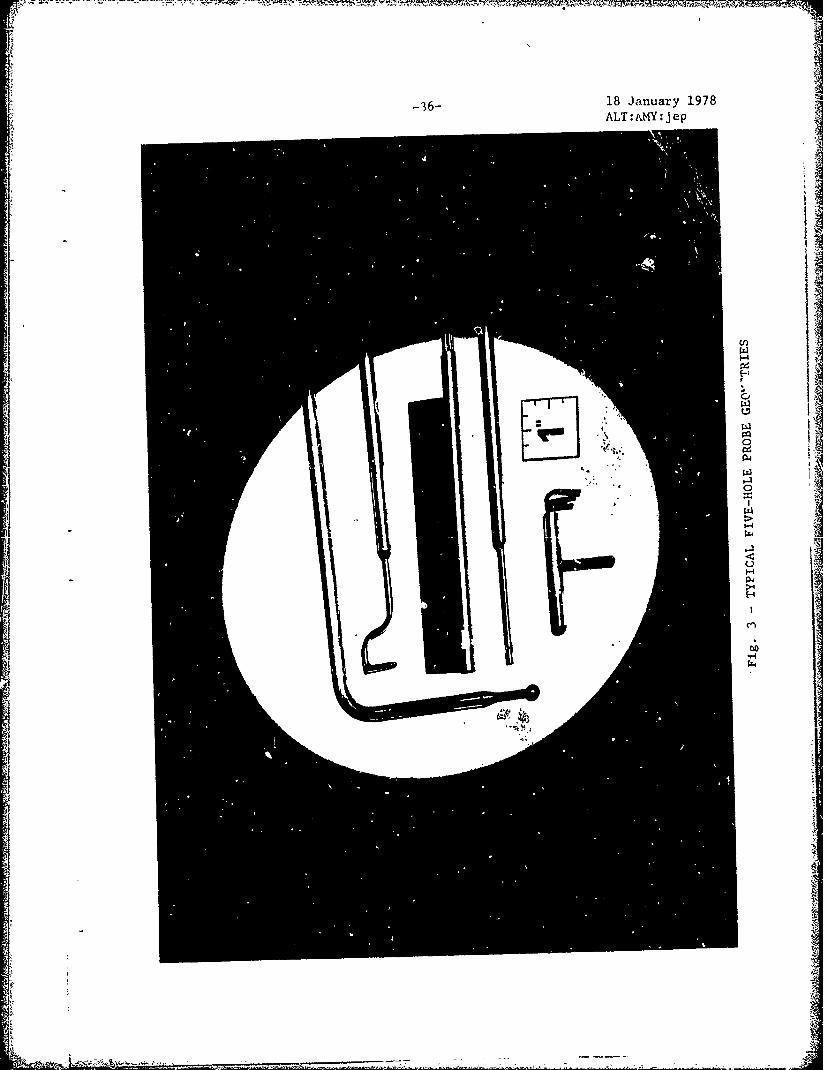
-'36- 18 January 1978ALT:i\MY:jep
co
Ijn
P4
4 T 4
1 ':
I-
!t.

CA
-37- 18 January 1978
ALT: AN: jep
2 - S
Ii t
4P
'4,
'4-
~ 7t.-s'~. ~k
*. 'C' ~ t

I18 January 1978
"4
ALT:AMY:jep
I*1
Iz
H
4-4 I4 t I
H
1 �' IS tt��
I;f11
5'
fFUI
I
1-
I7

-39-. 18 January 19782ALT:AMY:Jep
CD-
0 0C
0 > U0
LU) 0 )
LJL)
LLJ -
vfl4
LLI
LL - -L,- - - w I
-40- 18 January 1978ALT:AMY: jep
ANGLE-TUBE PROBE
PITCH ANGLE_300' o 30 0
2 02 20
0 J100YAANL
-2 qS_~20o
-4
-6 -4 -2 0 2 4 6C pitch
PRISM PROBE J6 -30° 00300 PITCH ANGLE
30~2 20°
0( 0i
i-6 , -, ' I-6 -4 -2 0 2 4 6
S'Fig. 7 - TYPICAL CALIBRATION DATA iPywviC ic- ~ ~ --~ - - --

-41- 18 January 1978
ALT:AMY:jep
SYMBOL 13o -30
1.0 0 -20ANGLE-TUBE PROBE A -10
0.8 + 0x 10
0.6--
. 0.4--
,. 0.2"
0.0-
-02-.
-0.4-30 -20 -10 0 10 20 0
PITCH ANGLE, a (deg)
1.0--,
PRISM PROBE
0.4-
0.2 .4
0.2-
0.0-
-0.2-
-0.4 i ,, i i - i-- - .
K -30 -20 -10 0 10 20 30PITCH ANGLE, a (deg)
Fig. 8- TYPICAL CALIBRATION DATA0p static

-42- 18 January 1978ALT:AMY:jep
SYMBOL $30 -300 -20
ANGLE-TUBE PROBE 0 -100 + 0
Sx 10.20
S~30-1
-2
-3 +
-30 -20 -10 0 10 20 30PITCH ANGLE, a (deg)
0+
." PRISM PROBE
S-2
-3 • , i i I -
-30 -20 -10 0 10 20 30P ITCH ANGLE, a (deg)
Fig. 9 - TYPICAL CALIBRATION DATAC p total vs a,.
-43- 18 January 1978ALT:AMY:jep
2 5-HOLE PRISM PROBEI YAW ANGLE= 20 deg"1. PITCH ANGLE (deg) 7
4- 30
", 020L"x
,10n! 1 .. ... I'0 0 p .• ,, A .. - " -- 10
C-100- -0 o oo- ... 0 o 0-20
•-30
* -1.. .. 0-3.
-2 I I I I2000 3000 4000 5000 6000 7000
REYNOLDS NUMBER
Fig. 10 - TYPICAL REYNOLDS NUMBER EFFECT ON THECALIBRATION DATA (Cp pitch)
I .
p pic
% ... . t__ ... . . . --- ... •A

-44- 18 January 1978ALT:AMY:jep
1.2 PITCH ANGLE (deg)F300 20 5-HOLE PRISM PROBEx 10 YAW ANGLE =20 deg
LO + 0A-10
0 -20o -30
0.8
S0.6
0.4
0.2
2000 3000 4000 5000 6000 7000
REYNOLDS NUMBER
Fig. 11 - TYPICAL REYNOLDS NUMBER EFFECTS ON THECALIBRATION DATA (Cp static)
sa
-45- 18 January 19781.2 ALT:AMY:Jep
77
FLOWd1.0DIRECTION~
PRISM PROBE0.8 00
0.20
03
*4- 6. 8 1012 TASLI BRAT ION
POINTDISTANCE FROM CENTRAL HOLE TO PLATE., d (PROBE DIAMETERS)
Fig. 12 - TYPICAL WALL PROXIMITY EFFECTS ON THECALIBRATION DATA

-46- 18 January 1978ALT:ANY:Jep
FLOWL .
jPRISM PROBEYA ANL4 i 00
.1. 30 deg ~
202
A I -10
-2 -20
.43o-30
POINTD ISTANCE FROM CENTRAL HOLE TO PLATE, di (PROBE D IAMETERS)
Fig. 13 - TYPICAL WALL PROXIMITY EFFECTS ON THECALIBRATION DATA

-47- 18 January 1978ALT: AMY: J ep
1.2SI FLOW
DIRECTION d1.0 IPRISM PROBE
I OI
0.8 1
, YAW ANGLE0Odeg
0.6
C.) S0.4
0.2 I -20
0.2 i 2-
'0 2 4 6 8DISTANCE FROM CENTRAL HOLE
TO PLATE, d (PROBE DIAMETERS)
Fig. 14- TYPICAL WALL PROXIMITY EFFECTS ON THECALIBRATION DATA
I
I"
18 18 January 1978UALT:ANY:jep_
0 L)
f14
0i
IXI0IP
-49- 18 January 1978ALT: AMY: .1ep
A44
LiU LUJ"f LUWL. >U) L
+- 0
+
+ -ltmU
LU...-
0 0:>
-< V)U(~) I.-<
00
CL --.
-jX < 4L
Co
9-4-
SOIIVS1 IN3NOdNAO3 A.l13 013A
-50- 18 January 1978ALT:AMY:Jep
1.6
1.4 -I1HOT-WIRE SENSORS
1.2-•/
1.0-. ,
105-HOLE PROBES..
""0.8.
0.6
BOUNDARY
RAKE
0.2 BODY SURFACE I.. .I ,, ,!, I I I I I
0 0.2 0.4 0.6 0.8 1.0Vx/Voo
Fig. 17 - COMPARATIVE BOUNDARY LAYER SURVEYS WITHTHREE TYPES OF INSTRUMENTATION
-51- 18 January 1978ALT:AMY: j ep
M Got
Qo 0r Lk
>> 0m0
< co
0ru _ I *
SI-HWO VIII S3NlSNi I(
JLdILU lllC-)33VSGST1OS3I
dIIfln WO 30NISI SS1OSN.I

DISTRIBUTION LIST FOR UNLASSIFIED TM 78-10 by A. L. _easter and A. M. Yocum(dated 18 January 1978) A
Commander Command rNaval Sea Systems Command mNaval .urface Weapon CenterDepartment of the Navy Silver Spring, MD 20910Washington, DC 20360 Attn' LibraryAttn: Library (Co No. 10)
Code NSEA-09G32(Copies 1 and 2) Co ander
D vid W. Taylor Naval Ship Res. & Dev. CenterNa.-"l Sea Systems Command epartment of the Navy
-... I; .7. E. Peirce 1 Bethesda, MD 20084Code NSEA-0351 /Attn: W. D. Morgan
(Copy No. 3) Code 154
/(Copy No. 11)Naval Sea Systems Command /Attn: A. R. Paladino avid W. Taylor Naval Ship Res. & Dev. Center
Code NSEA-0371 A tn: R. Cumming
(Copy No. 4)/ Code 1544(Cp No. 12)
Naval Sea Systems CommandAttn: H. Claybourne/ Davy W. Taylor Naval Ship Res. & Dev. Center
Code NSEA-0371 1Attn M. Sevik(Copy No. 5) /( Code 019
Naval Sea Systems CommandAttn: J. G. Juergens / David . Taylor Naval Ship Res. & Dev. Center
Code NSEA-037 Attn: . Brockett 5(Copy No. 6) j de 1544
J (Copy No 14)
CommanderNaval Ship Engineering Centerl' David W. ,ylor Naval Ship Res. & Dev. CenterDepartment: of the Navy Annapolis aboratoryWashington, DC 20360 / Annapolis, 21402Attn: W. L. Louis Att.n: J. G. Stricker
Code 6136B(Copy No. 7) 1 (Copy No. 15)r
Commanding Officer Defense Docume tation CenterNaval Underwater Systems enter 5010 Duke Stree\Newport, RI 02840 ] Cameron Station\Attn: Technical birecto Alexandria, VA 2 314
Code SB3 (Copies 16 - 27)(Copy No. 8) 1Commanding Officer Von Ký.raan Inst. for luid DynamicsNaval Ocean SystemsCen~er Turbomachinery Labora rySan Diego, CA 92152 Rhode-Saint-GeneseAttn: J. W. Hloyt BELGIUM(p Code 2501 Attn: Library(Copy No. 9) (Copy No. 28)
DISTRIBUTION LIST FOR UNCLASSIFIED TM 78-10 by A. L. Treaster and A. M. Yocum(dated 18 January 1978)
Mr. W. Whippen Mr. A. Mitchell
Allis-Chalmers Admiralty Marine Technology EstablishmentBox 712 Teddington, MiddlesexYork, PA 17405 ENGLAND
7 (Copy No. 29) (Copy No. 37)
Dr. G. K. Serovy Dr. J. H. HorlockProfessor Vice ChancellorMechanical Engineering Dept. University of SalfordIowa State University SalfordAmes, Iowa 50010 ENGLAND(Copy No. 30) (Copy No. 38)
U. S. Naval Post Graduate School Netharlands Ship Model BasinMonterey, CA 93940 Haagsteeg 2Attn: Library P. 0. Box 28(Copy No. 31) Wageningen
THE NETHERLANDSWright Patterson Air Force Base Attn: Dr. P. van OossanenDayton, OH 45433 (Copy No. 39.Attn: Dr. William H. Heiser
(Copy No. 32) Mr. H. J. BaiterForschungsbeauftragter Hydroakustik
Dr. A. J. Acosta 8012 Ottobrunn Bei MUnchenProfessor of Mechanical Engineering Postfach 260Div. of Engr. & Applied Science GERMANYCalifornia Institute of Technology (Copy No. 40)Pasadena, CA 01125(Copy No. 33) Dr. R. E. Henderson
The Pennsylvania State UniversityMr. M. 3. Hartmann Applied Research LaboratoryNASA Lewis Research Center Post Office Box 3021000 Brookpark Road State College, PA 16801Cleveland, OH 44135 (Copy No. 41.)(Copy NG 34)
Mr. A. L. TreasterSRC Turbomachinery Laboratory The Pennsylvania State UniversityMadingley Road Appl..ed Research LaboratoryCambridge Post Office Box 30ENGLAND State College, PA 16801kttn: Library (Copy No. 42)(Copy No. 35)
Mr. A. M. YocumHyironautics, Inc. The Pennsylvania State UniversityPindell School Road Applied Research laboratoryLaurel, ND 20810 Post Office Box 30Attn: Library State Coliege, PA 16801(Copy No. 36) (Copy No. 43)
•" i
DISTRIBUTION LIST FOR UNCLASSIFIED TM 78-10 by A. L. Treaster and A. M. Yocum(dated 18 January 1978)
* Garfield Thomas Water Tunnel LibraryI The Pennsylvania State University
Applied Research LaboratoryPost Office Box 30State College, PA 16801(Copy No. 44)
-j•. .