73877829 paper 3 spm 2011 mastery practices (1)
TRANSCRIPT
[1]
PAPER 3
MASTERY PRACTICES
Prepared by: CHEOK BOON CHUAN
C H
E M
I S
T R
Y
S P
M 2
011
Perfect Score SBP 2011
SPM Trial 2011

[2]
OXIDATION & REDUCTION
Rusting of iron
1. [PS] Diagram 2 shows the set-up of apparatus to investigate the effect of other metals X, Y and Z on the rusting of
iron. A mixture of jelly solution, potassium hexacyanoferrate(III) solution and phenolphthalein were used as
medium in each test tube. The observations were recorded after one day.
Test tube Observation
Test tube A
Iron nail coiled with metal X
Test tube B
Iron nail coiled with metal Y
Test tube C
Iron nail coiled with metal Z
Test tube C
Iron nail
Diagram 2
(a) State the inference for the observation in test tube A, B, C and D. [3 marks]
(b) Based on this experiment, explain why there is a difference in the observation between test tube A and B.
[3 marks]
(c) State the hypothesis for the experiment. [3 marks]
(d) Based on this experiment state: [3 marks]
(i) The manipulated variable
(ii) The responding variables
(iii) The constant variables
(e) State the operational definition for the rusting of iron nail. [3 marks]
(f) Based on this experiment classify the metals that can provide sacrificial protection and metal cannot provide
sacrificial protection to iron. [3 marks]
(g) Observation in test tube D is recorded after two days. Compare the observation for the experiment after it left
for one day and two days. Explain your answer. [3 marks]
After one day
After two days

[3]
2. [PERAK] Table 1.1 shows the observations in three test tubes to investigate the effect of other metal on rusting of
iron. A mixture of jelly solution and potassium hexacyanoferrate(III), K3Fe(CN)6 solution were used as medium in
each test tube. The intensity of blue colour in the medium were recorded after one day.
Test tube Observation
Test tube A
Test tube B
Test tube C
Table 1.1
(h) Based on the observations in Table 1.1, write the inferences in Table 1.2. [3 marks]
Test tube Inference
A
B
C
Table 1.2
(i) State the hypothesis for this experiment. [3 marks]
(j) State the variables for this experiment. [3 marks]
(i) The manipulated variable
(ii) The responding variable
(iii) The constant variable
(k) If the experiment is repeated by coiling iron nail with silver. Predict the observation. [3 marks]
(l) Test tube A and test tube B are left for 2 days. Compare the intensity of blue colour of the medium
in test tube A and test tube B. [3 marks]
(m) State the operational definition for the rusting of iron. [3 marks]
(n) Based on this experiment, classify the metals into metals that prevent rusting and metals that speed
up rusting. [3 marks]
[4]
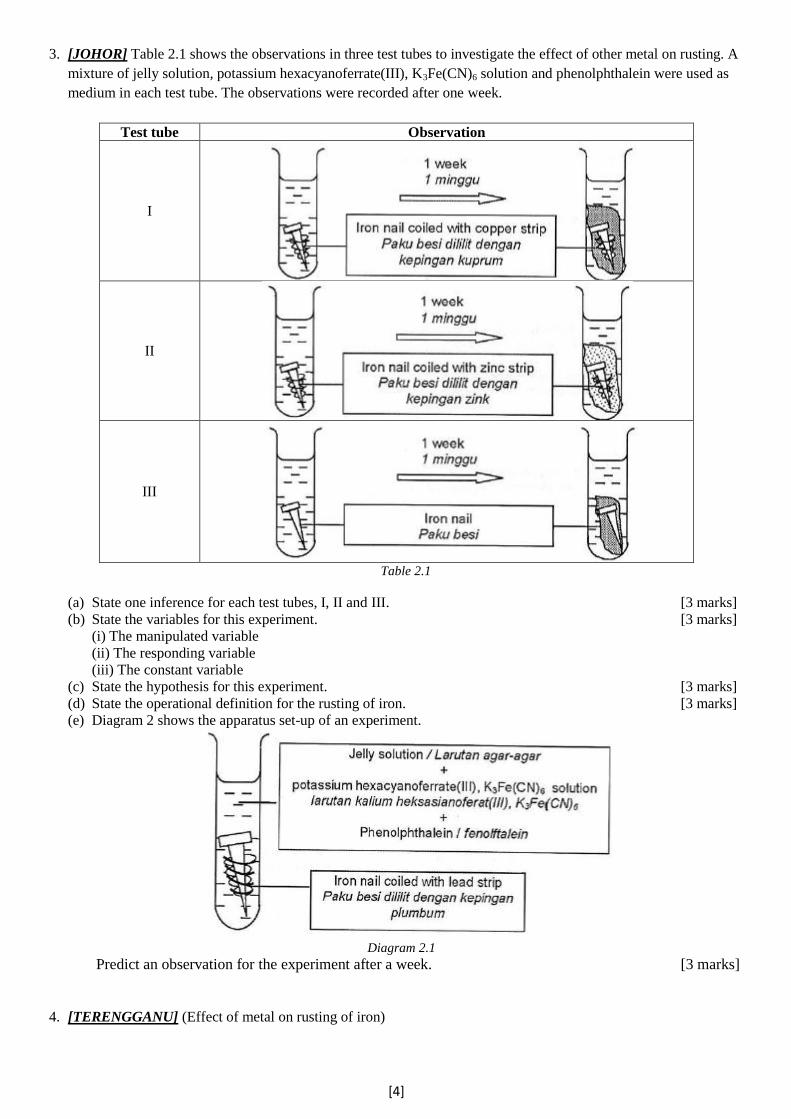
3. [JOHOR] Table 2.1 shows the observations in three test tubes to investigate the effect of other metal on rusting. A
mixture of jelly solution, potassium hexacyanoferrate(III), K3Fe(CN)6 solution and phenolphthalein were used as
medium in each test tube. The observations were recorded after one week.
Test tube Observation
I
II
III
Table 2.1
(a) State one inference for each test tubes, I, II and III. [3 marks]
(b) State the variables for this experiment. [3 marks]
(i) The manipulated variable
(ii) The responding variable
(iii) The constant variable
(c) State the hypothesis for this experiment. [3 marks]
(d) State the operational definition for the rusting of iron. [3 marks]
(e) Diagram 2 shows the apparatus set-up of an experiment.
Diagram 2.1
Predict an observation for the experiment after a week. [3 marks]
4. [TERENGGANU] (Effect of metal on rusting of iron)

[5]
5. [PAHANG] Diagram 5(a) and Diagram 5(b) below shows the apparatus set up to study the effects of metals X and
metal Y on the rusting of iron.
Diagram 5(a) Diagram 5(b)
Referring the information in the diagram above, plan an experiment to investigate the effect of a named X and Y
metals on the rusting of iron. Your planning must include all the following aspects:
(a) Aim of the experiment
(b) All the variables
(c) Hypothesis
(d) List of materials and apparatus
(e) Procedure
(f) Tabulation of data
6. [KELANTAN] The rusting of iron can be affected by the present of other metal that is contact with iron. Table 6
shows the results when metal P and metal Q are in contact with iron.
Metal in contact with iron Results
Metal P Iron does not rust
Metal Q Iron rust Table 6
Referring to the information above, plan a laboratory experiment to investigate the effect of named metals P and Q
on the rusting of iron and arrange the position of metal P, Q and iron in electrochemical series. Your planning must
include all the following aspects:
(a) Aim of the experiment
(b) All the variables
(c) Hypothesis
(d) List of materials and apparatus
(e) Procedure
(f) Tabulation of data

[6]
7. [S’WAK] Diagram 4 shows zinc blocks are placed on the hull of an iron to prevent rusting. However, some metals
in contact with iron can speed up rusting.
Diagram 4
Based on this idea, plan a laboratory experiment to investigate the effect of different metals in contact with iron on
the rusting of iron. You are provided with with potassium hexacyanoferrate(III) solution which turns blue when
iron(II) ions is formed and all other necessary materials and apparatus. Your planning must include all the
following items:
(a) Statement of the problem
(b) All the variables
(c) Statement of the hypothesis
(d) List of substances and apparatus
(e) Procedure of the experiment
(f) Tabulation of data
[7]
The reactivity series of metals towards oxygen
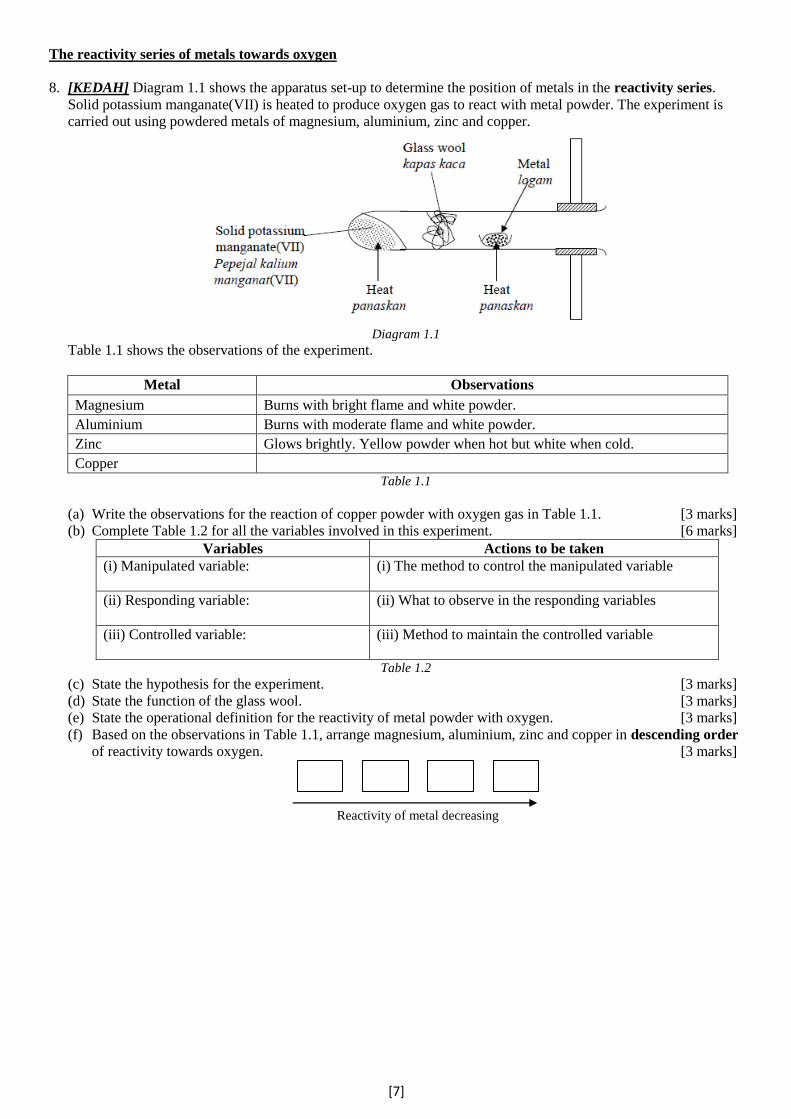
8. [KEDAH] Diagram 1.1 shows the apparatus set-up to determine the position of metals in the reactivity series.
Solid potassium manganate(VII) is heated to produce oxygen gas to react with metal powder. The experiment is
carried out using powdered metals of magnesium, aluminium, zinc and copper.
Diagram 1.1
Table 1.1 shows the observations of the experiment.
Metal Observations
Magnesium Burns with bright flame and white powder.
Aluminium Burns with moderate flame and white powder.
Zinc Glows brightly. Yellow powder when hot but white when cold.
Copper
Table 1.1
(a) Write the observations for the reaction of copper powder with oxygen gas in Table 1.1. [3 marks]
(b) Complete Table 1.2 for all the variables involved in this experiment. [6 marks]
Variables Actions to be taken
(i) Manipulated variable:
(i) The method to control the manipulated variable
(ii) Responding variable:
(ii) What to observe in the responding variables
(iii) Controlled variable:
(iii) Method to maintain the controlled variable
Table 1.2
(c) State the hypothesis for the experiment. [3 marks]
(d) State the function of the glass wool. [3 marks]
(e) State the operational definition for the reactivity of metal powder with oxygen. [3 marks]
(f) Based on the observations in Table 1.1, arrange magnesium, aluminium, zinc and copper in descending order
of reactivity towards oxygen. [3 marks]
Reactivity of metal decreasing

[8]
THERMOCHEMISTRY
1. [PAHANG] An experiment is carried out apparatus to determine the heat of combustion of four alcohols, methanol
(CH3OH), ethanol (C2H5OH), propanol (C3H7OH) and butanol (C4H9OH). The initial mass of spirit lamp
containing alcohol is measured before burning of the alcohol. Then, 200cm3 of water is heated with alcohol in the
spirit lamp until the temperature of water rises by 30°C. The final mass of lamp containing alcohols is measured
again after burning. Diagram 2 shows the set up of apparatus and thermometer reading of water for this experiment.
Diagram 2
(a) Give one inference based on the observation in Diagram 2. [3 marks]
(b) For this experiment, state: [3 marks]
(i) The manipulated variable
(ii) The responding variable
(iii) The constant variable
(c) State one hypothesis for this experiment. [3 marks]
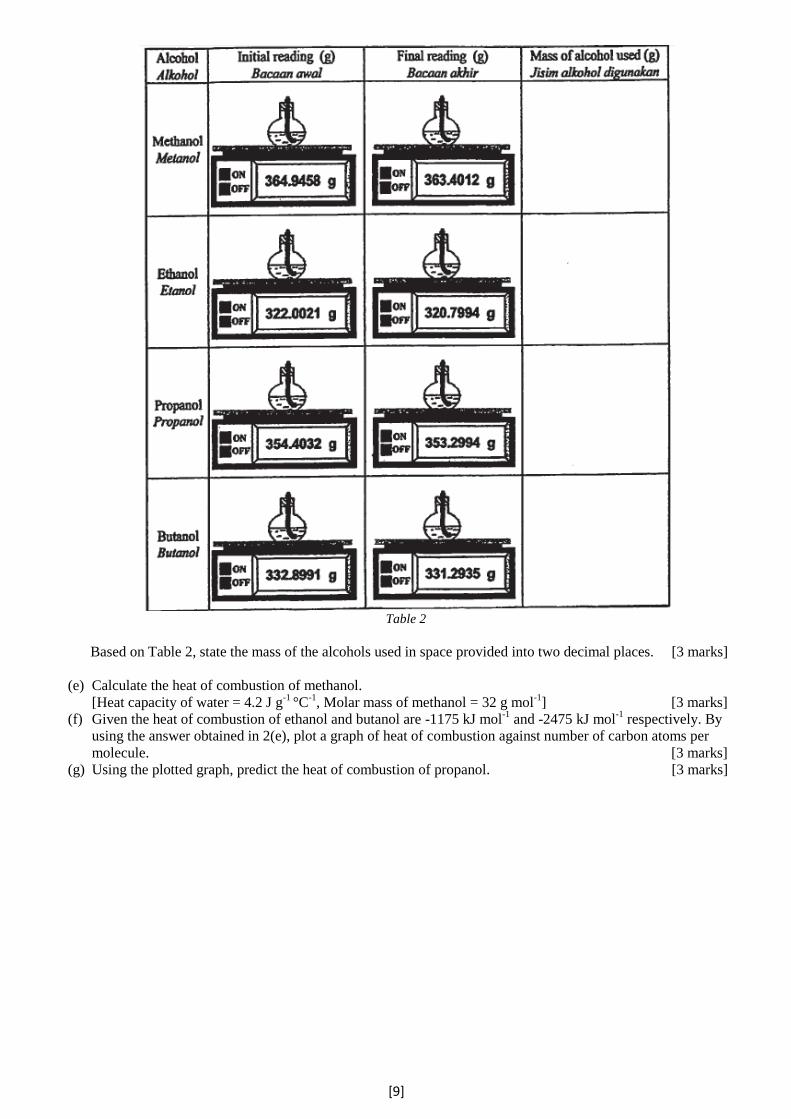
(d) Table 2 shows the initial and final readings of the electric balance of the mass of spirit lamp before burning of
four types of alcohol.
[9]
Table 2
Based on Table 2, state the mass of the alcohols used in space provided into two decimal places. [3 marks]
(e) Calculate the heat of combustion of methanol.
[Heat capacity of water = 4.2 J g-1
°C-1
, Molar mass of methanol = 32 g mol-1
] [3 marks]
(f) Given the heat of combustion of ethanol and butanol are -1175 kJ mol-1
and -2475 kJ mol-1
respectively. By
using the answer obtained in 2(e), plot a graph of heat of combustion against number of carbon atoms per
molecule. [3 marks]
(g) Using the plotted graph, predict the heat of combustion of propanol. [3 marks]

[10]
2. [MELAKA] Diagram 1.1 shows the set-up of apparatus to determine the heat of combustion for alcohols.
Diagram 1.1
Three sets of experiments are carried out to determine the heat of combustion of different types of alcohols.
Diagram 1.2 shows the initial and highest readings of the thermometer in the three sets of experiment.
Set Initial reading Highest thermometer reading
I
II
`

[11]
III
Diagram 1.2
(a) Record the initial temperature readings and the highest thermometer readings in Set I, Set II and Set III at
space provided in Diagram 1.2. [3 marks]
(b) Construct a table to record the initial temperature of water, highest temperature of water and increase in
temperature in Set I, Set II and Set III. [3 marks]
Alcohol Molecular formula Heat of combustion (kJ mol-1
)
Methanol CH3OH -728
Ethanol C2H5OH -1376
Propanol C3H7OH -2016
Butanol C4H9OH
Table 1
(c) State one hypothesis based on Table 1. [3 marks]
(d) Predict the heat of combustion for butanol. [3 marks]
(e) Sketch a graph to show heat of combustion of alcohols in Table 1 against the number of carbon atoms per
molecule. [3 marks]
(f) For this experiment, state: [3 marks]
(i) The manipulated variable
(ii) The responding variable
(iii) The constant variable
Diagram 1.3 shows the energy level for combustion of ethanol.
Diagram 1.3
(g) State three informations from Diagram 1.3. [3 marks]
(h) Thermochemical equations below represent the combustion of propane and ethanol in excess oxygen.
C3H8 + 5 O2 → 3 CO2 + 4 H2O ∆H = -2202 kJ mol-1
C2H5OH + 3 O2 → 2 CO2 + 3 H2O ∆H = -1376 kJ mol-1
Based on the themochemical equations above, state the operational definition for the heat of combustion.
[3 marks]
(i) Alcohol is one example of carbon compounds. Classify the following compounds into hydrocarbons and
non-hydrocarbons. [3 marks]
Propene Butanol Ethanoic acid Methyl ethanoate

[12]
Diagram 1.4 shows set-up of apparatus for two sets of experiment.
Set Set-up of apparatus
I
II
Diagram 1.4
(j) Based on the information in Diagram 1.4, complete the following table.
Set Observation Inference
I 1.
2.
1.
2.
II 1. 1.
3. [TERENGGANU] (Heat of combustion)
4. [SBP] (Heat of combustion)

[13]
5. [PS] Different type of alcohols produces different heat of combustions. When the number of carbon per molecule
of alcohol increases the heat of combustion increases. Table 6 shows the heat of combustion of ethanol, propanol
and butanol.
Alcohol Molecular formula Heat of combustion (kJ mol-1
)
Ethanol C2H5OH -1376
Propanol C3H7OH -2016
Butanol C4H9OH -2678
Table 6
Plan a laboratory experiment to compare the heat of combustion of the alcohols. Your planning must include the
following aspects: (a) Statement of the problem
(b) All the variables
(c) Hypothesis
(d) List of materials and apparatus
(e) Procedure
(f) Tabulation of data
Heat of neutralisation
6. [PERLIS]
Referring to the situation above, plan a laboratory experiment to compare the heat of neutralisation between a
named strong acid with sodium hydroxide solution and heat of neutralisation between a named weak acid
with sodium hydroxide solution. Your planning should include the following aspects:
(a) Statement of problem
(b) All the variables
(c) Hypothesis
(d) List of materials and apparatus
(e) Procedure
(f) Tabulation of data
Heat of displacement
7. [N9] (Heat of displacement)
Neutralisation is a reaction between an acid and an alkali to form salt and water.

[14]
ELECTROCHEMISTRY
Electrolysis
1. [KEDAH] (g) Diagram 1.2 shows the apparatus set-up to construct the Electrochemical Series. The voltage
produced when dipping the copper and magnesium electrodes into the solution is measured. The experiment is
repeated by replacing magnesium with aluminium and zinc.
Diagram 1.2
(i) Copper(II) sulphate solution is an electrolyte. Classify the ions that exist in copper(II) sulphate solution
into cation and anion. [3 marks]
Cation Anion
(ii) Diagram 1.3 shows the readings of three voltmeters each using different metals paired with copper.
Diagram 1.3
Based on Diagram 1.3, record the voltmeter readings in Table 1.3. [3 marks]
Pairs of metals Negative terminal Voltage / V
Cu and Mg Magnesium
Cu and Zn Zinc
Cu and Al Aluminium
Table 1.3
(iii) Based on the voltmeter readings, arrange magnesium, aluminium, zinc and copper in ascending
order of tendency to release electrons. [3 marks]
Tendency to increase electron increases
(iv) The experiment is repeated using the pair of metals : magnesium and zinc. Predict the voltmeter
reading. [3 marks]
2. [SBP] (Effect of types of electrodes on the product formed)

[15]
3. [KELANTAN] A student is carried out three experiments to investigate the electrical conductivity of three
compounds in their molten state. Diagram 3.1 shows the results obtained from the experiment.
Diagram 3.1
(a) State one observation that can be obtained from each experiment. [3 marks]
(b) Based on your observations at (a), state the inference for these experiments. [3 marks]
(c) State the operational definition for the electrical conductivity. [3 marks]
(d) State one hypothesis for this experiment. [3 marks]
(e) State all the variables for this experiment: [3 marks]
(i) The manipulated variable
(ii) The responding variable
(iii) The constant variable
(f) Compounds can be classified into ionic compounds and covalent compounds. Based on the compounds in
Diagram 3.1, complete Table 3 by classifying the compounds into ionic or covalent compounds. [3 marks]
Ionic compound Convalent compound
Table 3
[16]
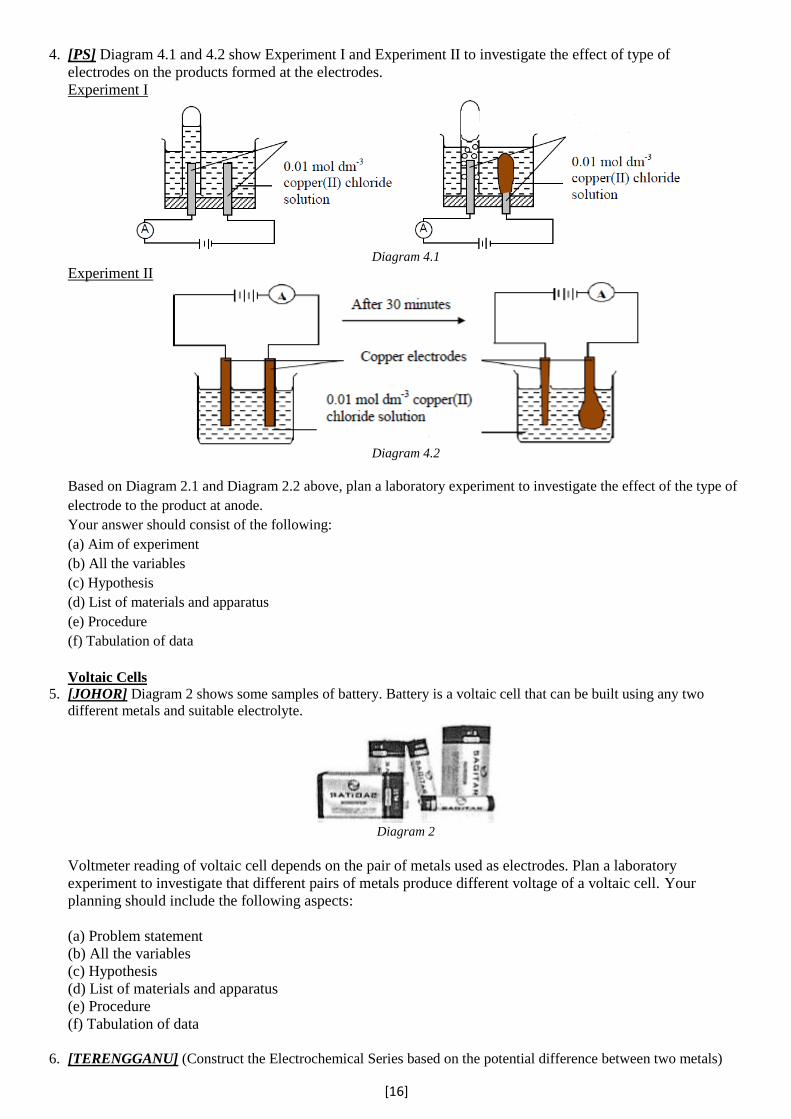
4. [PS] Diagram 4.1 and 4.2 show Experiment I and Experiment II to investigate the effect of type of
electrodes on the products formed at the electrodes.
Experiment I
Diagram 4.1
Experiment II
Diagram 4.2
Based on Diagram 2.1 and Diagram 2.2 above, plan a laboratory experiment to investigate the effect of the type of
electrode to the product at anode.
Your answer should consist of the following:
(a) Aim of experiment
(b) All the variables
(c) Hypothesis
(d) List of materials and apparatus
(e) Procedure
(f) Tabulation of data
Voltaic Cells
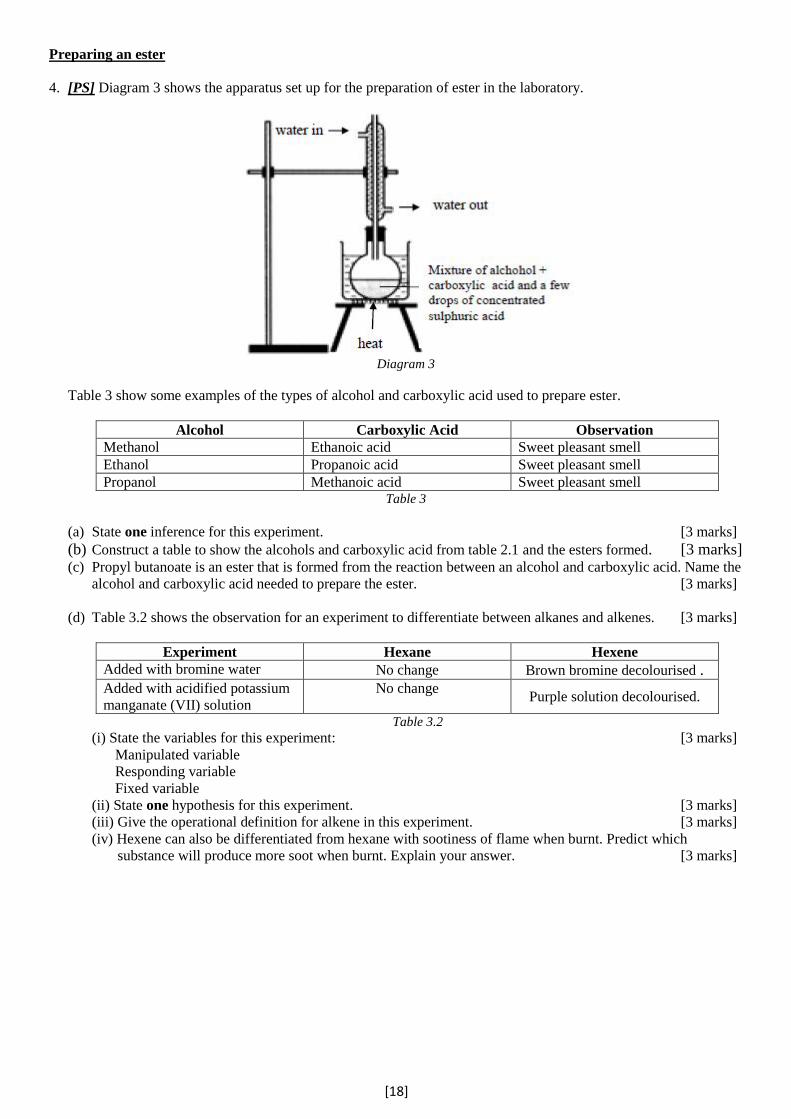
5. [JOHOR] Diagram 2 shows some samples of battery. Battery is a voltaic cell that can be built using any two
different metals and suitable electrolyte.
Diagram 2
Voltmeter reading of voltaic cell depends on the pair of metals used as electrodes. Plan a laboratory
experiment to investigate that different pairs of metals produce different voltage of a voltaic cell. Your
planning should include the following aspects:
(a) Problem statement
(b) All the variables
(c) Hypothesis
(d) List of materials and apparatus
(e) Procedure
(f) Tabulation of data
6. [TERENGGANU] (Construct the Electrochemical Series based on the potential difference between two metals)

[17]
CARBON COMPOUNDS
Differentiate the solutions
1. [PERAK]
Diagram 1 shows the two reagent bottles containing two colourless liquid of carbon compounds P and Q
respectively.
Diagram 1
These two liquids are hexene and ethanoic acid. Using suitable reagent, plan a laboratory experiment to
identify the colourless liquids. Your planning should include the following aspects:
(a) Statement of problem
(b) All the variables
(c) Hypothesis
(d) List of materials and apparatus
(e) Procedure
(f) Tabulation of data
2. [N9] (Differentiate hexane and hexene)
Coagulation of latex
3. [MELAKA]
An acid is used to coagulate the latex while an alkali can prevent the coagulation of latex. Based on this idea, plan
one laboratory experiment to investigate the effect of acid and alkali on the coagulation of latex. Your planning
should include the following aspects:
(a) Statement of problem
(b) All the variables
(c) Hypothesis
(d) List of materials and apparatus
(e) Procedure
(f) Tabulation of data
There are many items around us such as tyres, mattress and gloves are made from rubber. Natural
rubber is obtained from the latex secreted by rubber tree. Latex needs to be turned into a solid for it to
be used in daily purposes.
[18]
Preparing an ester
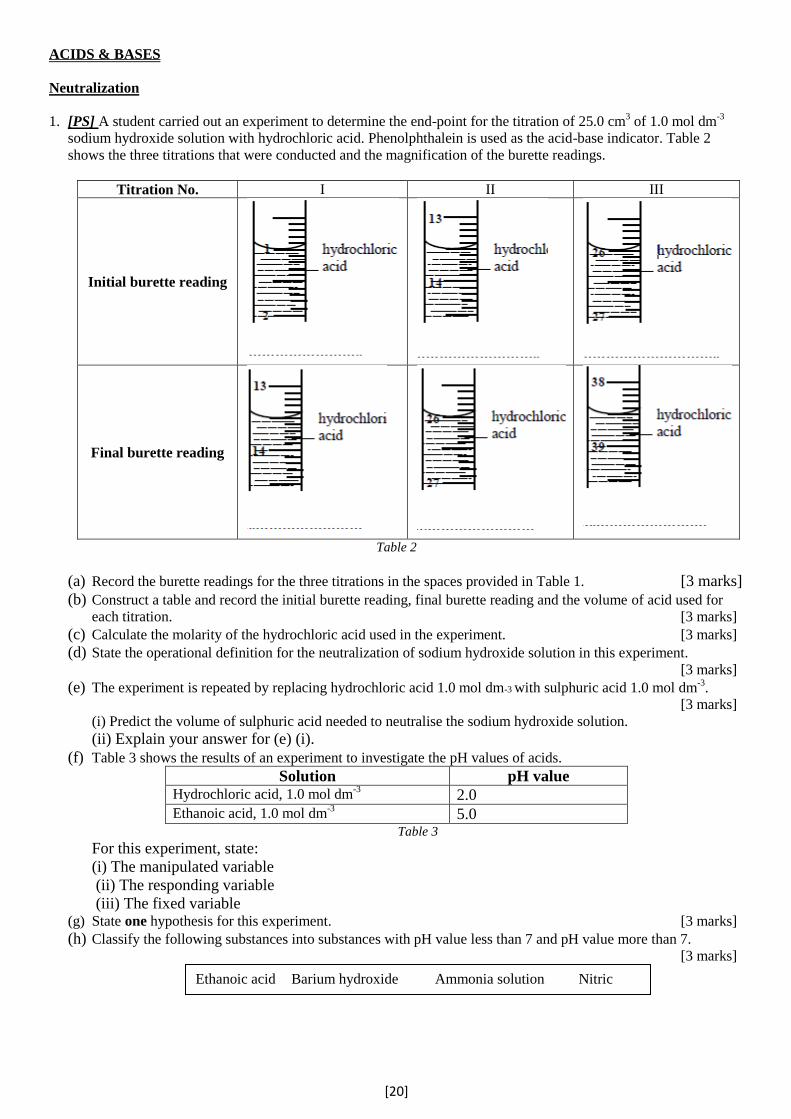
4. [PS] Diagram 3 shows the apparatus set up for the preparation of ester in the laboratory.
Diagram 3
Table 3 show some examples of the types of alcohol and carboxylic acid used to prepare ester.
Alcohol Carboxylic Acid Observation
Methanol Ethanoic acid Sweet pleasant smell
Ethanol Propanoic acid Sweet pleasant smell
Propanol Methanoic acid Sweet pleasant smell Table 3
(a) State one inference for this experiment. [3 marks]
(b) Construct a table to show the alcohols and carboxylic acid from table 2.1 and the esters formed. [3 marks] (c) Propyl butanoate is an ester that is formed from the reaction between an alcohol and carboxylic acid. Name the
alcohol and carboxylic acid needed to prepare the ester. [3 marks]
(d) Table 3.2 shows the observation for an experiment to differentiate between alkanes and alkenes. [3 marks]
Experiment Hexane Hexene
Added with bromine water No change Brown bromine decolourised . Added with acidified potassium
manganate (VII) solution
No change
Purple solution decolourised.
Table 3.2
(i) State the variables for this experiment: [3 marks]
Manipulated variable
Responding variable
Fixed variable
(ii) State one hypothesis for this experiment. [3 marks]
(iii) Give the operational definition for alkene in this experiment. [3 marks]
(iv) Hexene can also be differentiated from hexane with sootiness of flame when burnt. Predict which
substance will produce more soot when burnt. Explain your answer. [3 marks]

[19]
Cleaning agent
5. Diagram 4 shows the set-up of apparatus used to investigate the cleansing action of a cleaning agent on a piece of
cloth stained with oil.
Experiment Apparatus Observation
I
Oil stained remains.
II
Oil stained remains.
Diagram 4
Based on the above diagram, plan one laboratory experiment to compare the effectiveness of cleaning agents A
mad B on cleansing action in hard water. Your planning should include the following aspects:
(a) Aim
(b) All the variables
(c) Statement of the hypothesis
(d) List of substances and apparatus
(e) Procedure of the experiment
(f) Tabulation of data
[20]
ACIDS & BASES
Neutralization
1. [PS] A student carried out an experiment to determine the end-point for the titration of 25.0 cm3 of 1.0 mol dm
-3
sodium hydroxide solution with hydrochloric acid. Phenolphthalein is used as the acid-base indicator. Table 2
shows the three titrations that were conducted and the magnification of the burette readings.
Titration No. I II III
Initial burette reading
Final burette reading
Table 2
(a) Record the burette readings for the three titrations in the spaces provided in Table 1. [3 marks]
(b) Construct a table and record the initial burette reading, final burette reading and the volume of acid used for
each titration. [3 marks] (c) Calculate the molarity of the hydrochloric acid used in the experiment. [3 marks] (d) State the operational definition for the neutralization of sodium hydroxide solution in this experiment.
[3 marks] (e) The experiment is repeated by replacing hydrochloric acid 1.0 mol dm-3 with sulphuric acid 1.0 mol dm
-3.
[3 marks]
(i) Predict the volume of sulphuric acid needed to neutralise the sodium hydroxide solution.
(ii) Explain your answer for (e) (i).
(f) Table 3 shows the results of an experiment to investigate the pH values of acids.
Solution pH value Hydrochloric acid, 1.0 mol dm
-3 2.0 Ethanoic acid, 1.0 mol dm
-3 5.0 Table 3
For this experiment, state:
(i) The manipulated variable
(ii) The responding variable
(iii) The fixed variable (g) State one hypothesis for this experiment. [3 marks]
(h) Classify the following substances into substances with pH value less than 7 and pH value more than 7. [3 marks]
Ethanoic acid Barium hydroxide Ammonia solution Nitric
acid
[21]
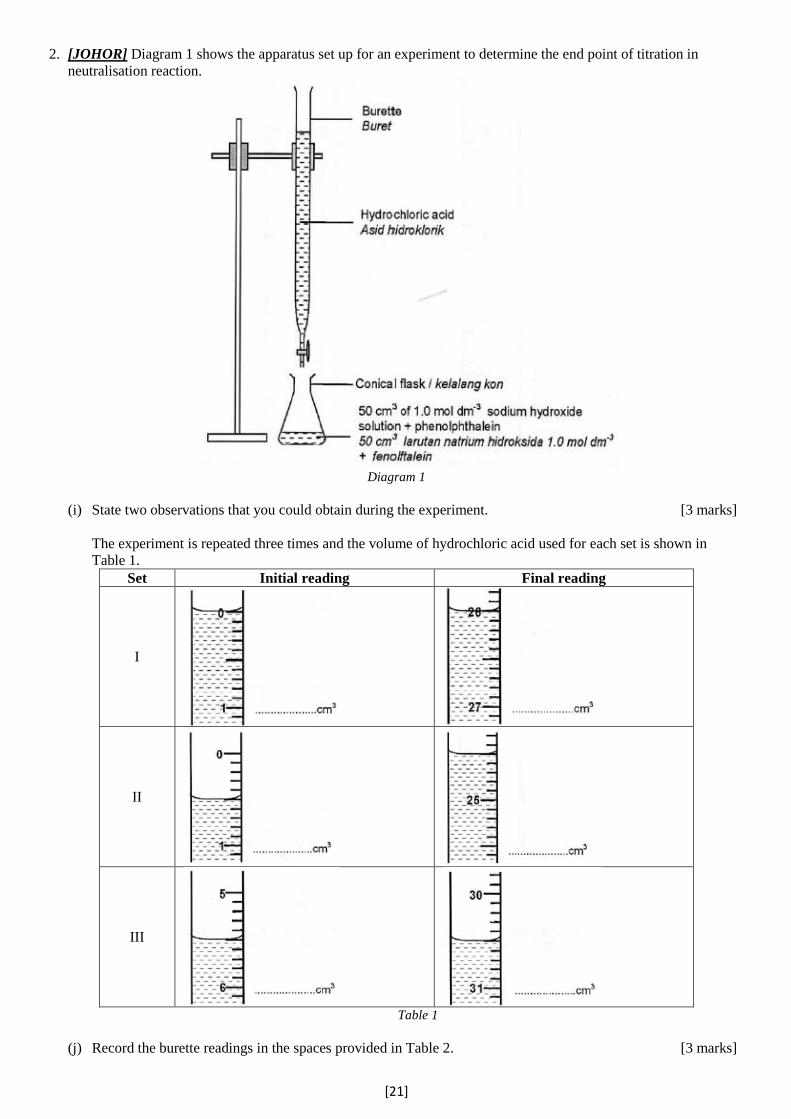
2. [JOHOR] Diagram 1 shows the apparatus set up for an experiment to determine the end point of titration in
neutralisation reaction.
Diagram 1
(i) State two observations that you could obtain during the experiment. [3 marks]
The experiment is repeated three times and the volume of hydrochloric acid used for each set is shown in
Table 1.
Set Initial reading Final reading
I
II
III
Table 1
(j) Record the burette readings in the spaces provided in Table 2. [3 marks]

[22]
(k) Construct a table to record the data from sets I, II and III. The table should include the initial reading, final
reading, and the volume of hydrochloric used in the titration. [3 marks]
(l) The chemical equation for the reaction is shown below:
HCl + NaOH → NaCl + H2O
Calculate the average volume of hydrochloric acid, HCl needed to neutralise 50cm3 of 1.0 mol dm
-3 sodium
hydroxide, NaOH solution. [3 marks]
(m) During the titration process, state the relationship between the concentration hydroxide ion, OH- in sodium
hydroxide, NaOH solution with time until the end point of titration. [3 marks]
(n) Classify the following acids into monoprotic, diprotic and triprotic acid. [3 marks]
Monoprotic acid Diprotic acid Triprotic acid
Concentration & pH value
3. [N9] (Concentration of hydroxide ions & the pH value)
Role of water in showing the properties of acids and bases
4. [KEDAH]
Using the acid given, plan a laboratory experiment to investigate the role of water in showing the properties
of acids. Use distilled water and dry propanone as solvents. Your planning should include the following
aspects:
(a) Problem statement
(b) All the variables
(c) Hypothesis
(d) List of materials and apparatus
(e) Procedure
(f) Tabulation of data
Glacial ethanoic acid, CH3COOH is a dry acid. It only shows acidic properties when
water is added to it.
Hydrochloric acid Sulphuric acid Ethanoic acid Nitric acid Phosphoric acid
[23]
SALTS
Solubility of salts
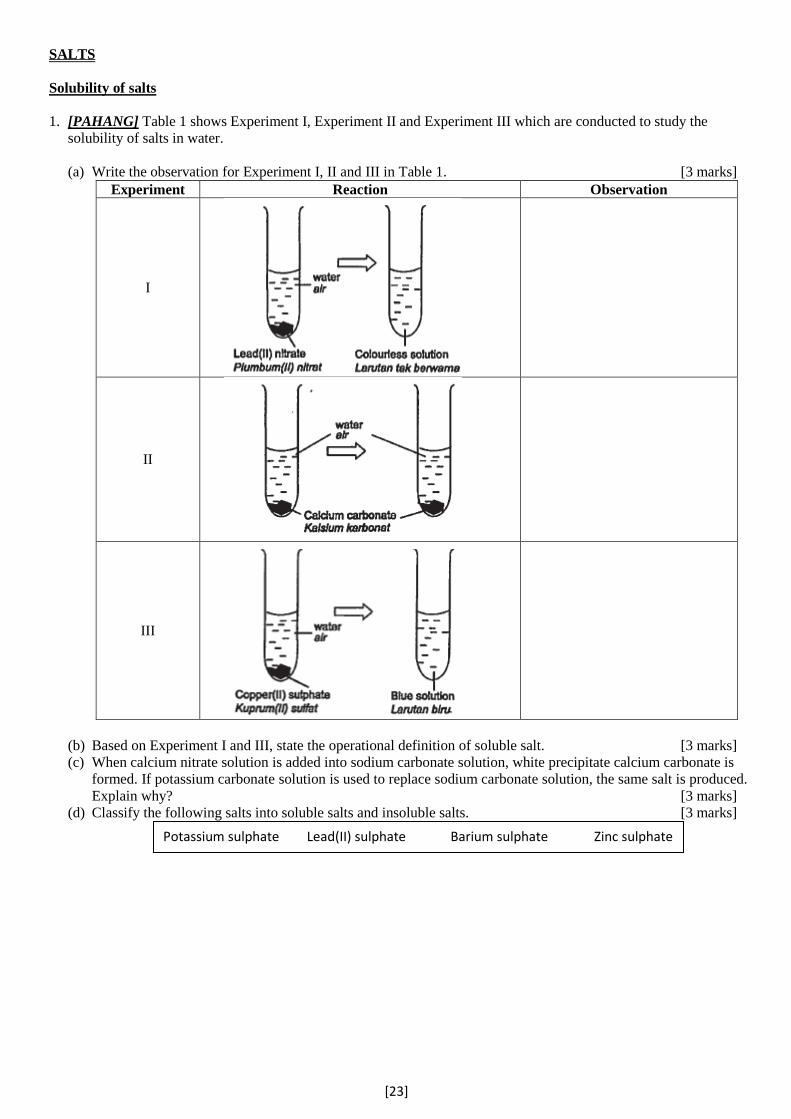
1. [PAHANG] Table 1 shows Experiment I, Experiment II and Experiment III which are conducted to study the
solubility of salts in water.
(a) Write the observation for Experiment I, II and III in Table 1. [3 marks]
Experiment Reaction Observation
I
II
III
(b) Based on Experiment I and III, state the operational definition of soluble salt. [3 marks]
(c) When calcium nitrate solution is added into sodium carbonate solution, white precipitate calcium carbonate is
formed. If potassium carbonate solution is used to replace sodium carbonate solution, the same salt is produced.
Explain why? [3 marks]
(d) Classify the following salts into soluble salts and insoluble salts. [3 marks]
Potassium sulphate Lead(II) sulphate Barium sulphate Zinc sulphate
[24]
Construct the ionic equation
2. [KELANTAN] An experiment was carried out to construct the ionic equation for the precipitation of silver
chloride according the following steps:
I. 5.00 cm3 of 1.0 mol dm
-3 potassium chloride solution was poured into 7 test tubes labelled P, Q, R, S, T, U
and V.
II. 1.00 cm3 of 1.0 mol dm
-3 silver nitrate solution was added to test tube P from burette.
III. Step II was repeated for test tubes Q, R, S, T, U and V using different volumes of silver nitrate solution.
IV. All the test tubes were put in the rack to allow silver chloride precipitate to settle. Height of precipitate
formed is recorded in Table 2.
Test tube P Q R S T U V
Volume of silver nitrate (cm3) 1.00 2.00 3.00 4.00 5.00 6.00 X
Height of precipitate (cm3) 1.0 2.0 3.0 4.0 5.0 5.0 5.0
Table 2
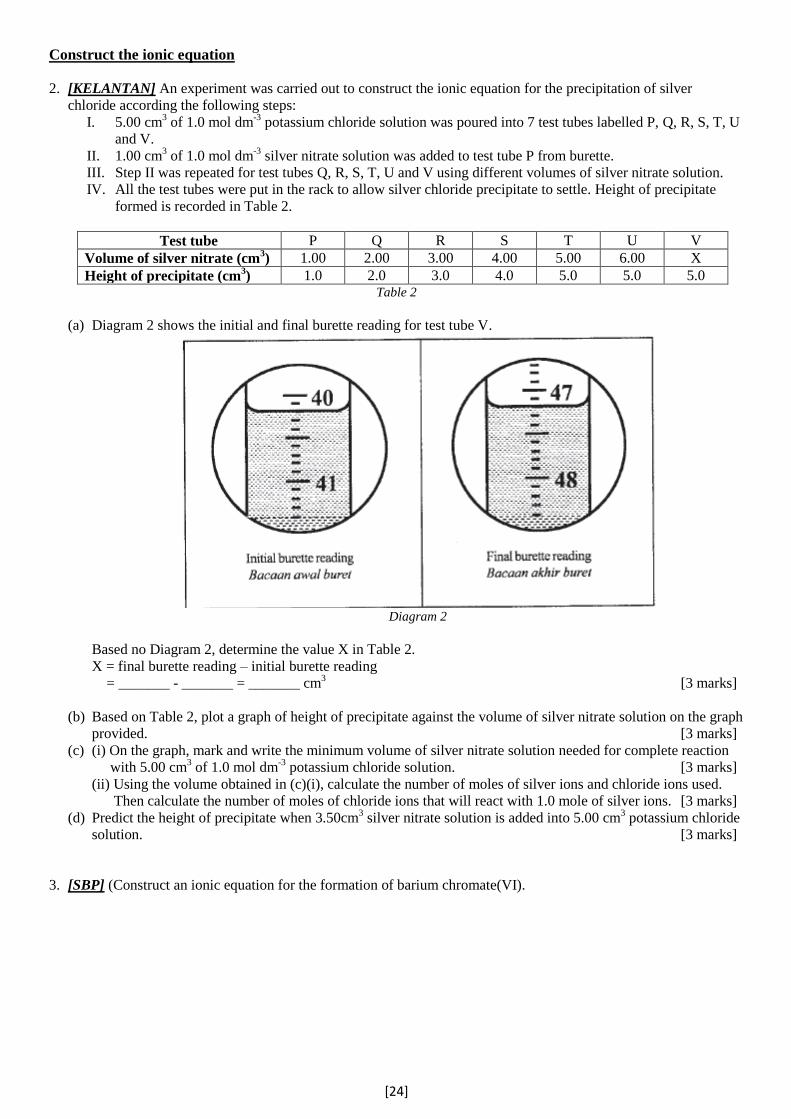
(a) Diagram 2 shows the initial and final burette reading for test tube V.
Diagram 2
Based no Diagram 2, determine the value X in Table 2.
X = final burette reading – initial burette reading
= _______ - _______ = _______ cm3 [3 marks]
(b) Based on Table 2, plot a graph of height of precipitate against the volume of silver nitrate solution on the graph
provided. [3 marks]
(c) (i) On the graph, mark and write the minimum volume of silver nitrate solution needed for complete reaction
with 5.00 cm3 of 1.0 mol dm
-3 potassium chloride solution. [3 marks]
(ii) Using the volume obtained in (c)(i), calculate the number of moles of silver ions and chloride ions used.
Then calculate the number of moles of chloride ions that will react with 1.0 mole of silver ions. [3 marks]
(d) Predict the height of precipitate when 3.50cm3 silver nitrate solution is added into 5.00 cm
3 potassium chloride
solution. [3 marks]
3. [SBP] (Construct an ionic equation for the formation of barium chromate(VI).

[25]
MANUFACTURED SUBSTANCES IN INDUSTRY
Hardness of a metal and its alloy
1. [PERLIS] Diagram 1.1 shows the apparatus set-up used in an experiment to compare the hardness of bronze with
its pure metal, copper. The experiment was carried out according to the following steps:
I. Cellophane tape was used to stick a steel ball bearing onto the copper block.
II. A one-kilogram weight was hung at the height of 50 cm above the ball bearing as shown in Diagram 1.1.
III. The weight was dropped so that it hits the ball bearing.
IV. The diameter of dent formed on the copper block was measured and the reading was recorded.
V. Step I to Step IV were repeated by replacing the copper block with bronze block.
Diagram 1.1
Diameter = _________mm Diameter = _________mm
Diagram 1.2
(a) Measure the diameter of dents and record the readings in the spaces provided. [3 marks]
(b) Construct a table to record the diameter of dent formed on each copper block and bronze block. [3 marks]
(c) (i) State one observation that can be obtained from this experiment. [3 marks]
(ii) What is your inference based on your answer in (c)(i). [3 marks]
(d) For this experiment, state: [3 marks]
(i) The manipulated variable
(ii) The responding variable
(iii) The fixed variable
(e) State the hypothesis for the experiment. [3 marks]
(f) Based on Diagram 1.1 and Diagram 1.2, state the operational definition for the hardness of alloy. [3 marks]
(g) The experiment is repeated by dropping one-kilogram weight at the height of 30cm. Predict the diameter of
dent on copper block. [3 marks]
(h) The following is a list of substances:
Classify these substances into alloy and pure metal. [3 marks]
(i) Steel takes a longer time to corrode compared to iron. Explain. [3 marks]
Antimony Bronze Copper Brass Pewter Tin

[26]
2. [PS] Diagram 1.1 shows the set-up of apparatus for an experiment to compare the hardness of a metal and its alloy.
Diagram 1.1
A steel ball bearing is taped onto the material X block using cellophane tape. A weight of 1 kilogram is dropped at
a height of 50 cm to hit the ball bearing. The diameter of the dent made on the material X block is measured. The
experiment is repeated by replacing material X block with material Y block.
Table 2.1 shows the view of the dents made on the material X and Y.
Experiment Material X Material Y
I
Diameter: _________
Diameter: _________
II
Diameter: _________
Diameter: _________
III
Diameter: _________
Diameter: _________
Table 2.1
[27]
(a) (i) Using a ruler, measure the diameters of the dents made on material X and Y. Record all the diameters of the
dents in Table 2.1. [3 marks]
(ii) Construct a table to record the diameters of the dents and average diameter on material X and material Y.
[3 marks]
(b) State one observation that can be obtained from this experiment. [3 marks]
(c) Based on the average diameter of the dents on material X and Y, state the inference that can be make.
[3 marks]
(d) State the operational definition for the hardness of alloy. [3 marks]
(e) Explain why there is difference in diameter of dents on material X and Y. [3 marks]
(f) Suggest a suitable material for X and Y. [3 marks]
(g) State the hypothesis for this experiment. [3 marks]
(h) Complete Table 2.2 based on the experiment. [3 marks]
Variables Actions to be taken
(i) Manipulated variable:
(i) The method to control the manipulated variable
(ii) Responding variable:
(ii) What to observe in the responding variables
(iii) Controlled variable:
(iii) Method to maintain the controlled variable
Table 2.2
[28]
PERIODIC TABLE OF ELEMENTS
Reactivity of Group 17 elements
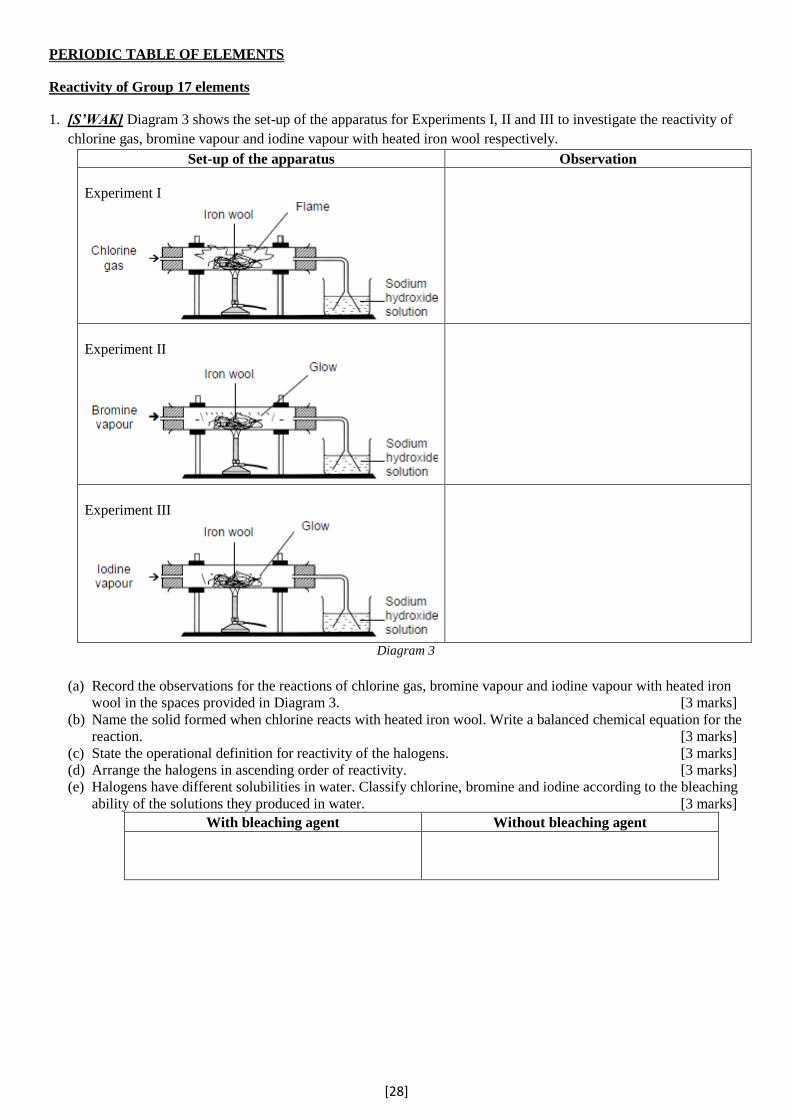
1. [S’WAK] Diagram 3 shows the set-up of the apparatus for Experiments I, II and III to investigate the reactivity of
chlorine gas, bromine vapour and iodine vapour with heated iron wool respectively.
Set-up of the apparatus Observation
Experiment I
Experiment II
Experiment III
Diagram 3
(a) Record the observations for the reactions of chlorine gas, bromine vapour and iodine vapour with heated iron
wool in the spaces provided in Diagram 3. [3 marks]
(b) Name the solid formed when chlorine reacts with heated iron wool. Write a balanced chemical equation for the
reaction. [3 marks]
(c) State the operational definition for reactivity of the halogens. [3 marks]
(d) Arrange the halogens in ascending order of reactivity. [3 marks]
(e) Halogens have different solubilities in water. Classify chlorine, bromine and iodine according to the bleaching
ability of the solutions they produced in water. [3 marks]
With bleaching agent Without bleaching agent
[29]
RATE OF REACTION
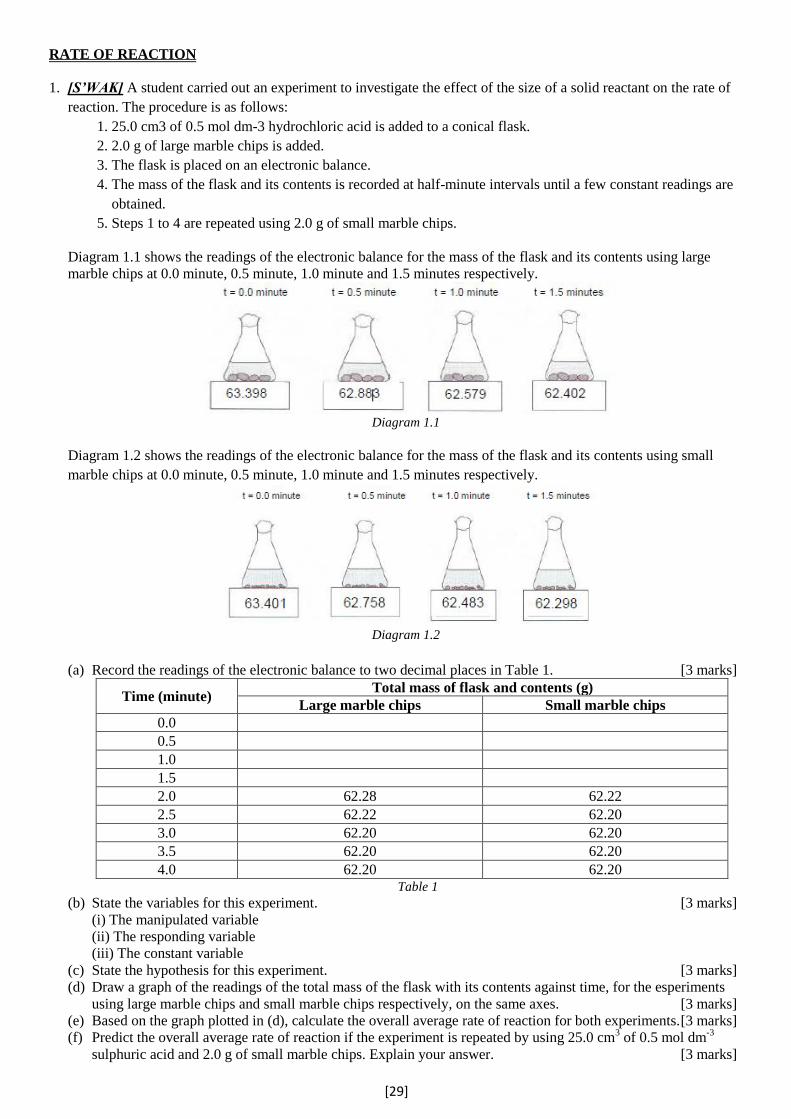
1. [S’WAK] A student carried out an experiment to investigate the effect of the size of a solid reactant on the rate of
reaction. The procedure is as follows:
1. 25.0 cm3 of 0.5 mol dm-3 hydrochloric acid is added to a conical flask.
2. 2.0 g of large marble chips is added.
3. The flask is placed on an electronic balance.
4. The mass of the flask and its contents is recorded at half-minute intervals until a few constant readings are
obtained.
5. Steps 1 to 4 are repeated using 2.0 g of small marble chips.
Diagram 1.1 shows the readings of the electronic balance for the mass of the flask and its contents using large
marble chips at 0.0 minute, 0.5 minute, 1.0 minute and 1.5 minutes respectively.
Diagram 1.1
Diagram 1.2 shows the readings of the electronic balance for the mass of the flask and its contents using small
marble chips at 0.0 minute, 0.5 minute, 1.0 minute and 1.5 minutes respectively.
Diagram 1.2
(a) Record the readings of the electronic balance to two decimal places in Table 1. [3 marks]
Time (minute) Total mass of flask and contents (g)
Large marble chips Small marble chips
0.0
0.5
1.0
1.5
2.0 62.28 62.22
2.5 62.22 62.20
3.0 62.20 62.20
3.5 62.20 62.20
4.0 62.20 62.20 Table 1
(b) State the variables for this experiment. [3 marks]
(i) The manipulated variable
(ii) The responding variable
(iii) The constant variable
(c) State the hypothesis for this experiment. [3 marks]
(d) Draw a graph of the readings of the total mass of the flask with its contents against time, for the esperiments
using large marble chips and small marble chips respectively, on the same axes. [3 marks]
(e) Based on the graph plotted in (d), calculate the overall average rate of reaction for both experiments. [3 marks]
(f) Predict the overall average rate of reaction if the experiment is repeated by using 25.0 cm3 of 0.5 mol dm
-3
sulphuric acid and 2.0 g of small marble chips. Explain your answer. [3 marks]
[30]
CHEMICAL FORMULA & EQUATIONS
Empirical formula
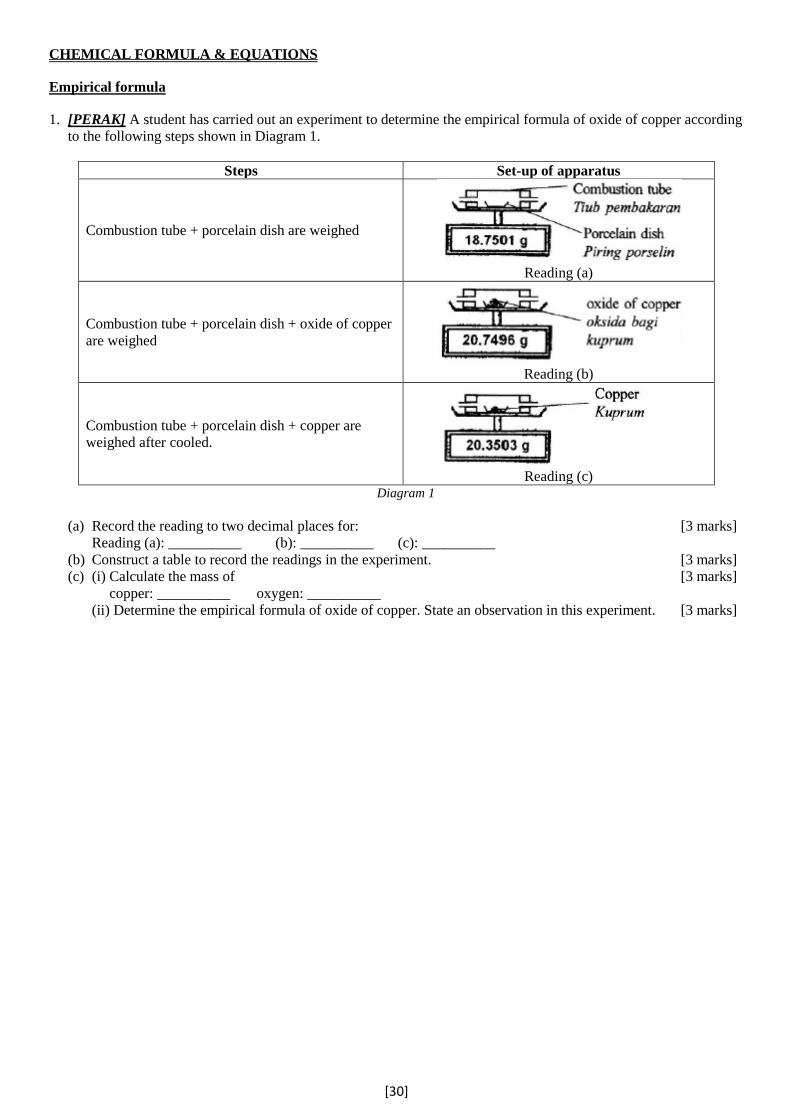
1. [PERAK] A student has carried out an experiment to determine the empirical formula of oxide of copper according
to the following steps shown in Diagram 1.
Steps Set-up of apparatus
Combustion tube + porcelain dish are weighed
Reading (a)
Combustion tube + porcelain dish + oxide of copper
are weighed
Reading (b)
Combustion tube + porcelain dish + copper are
weighed after cooled.
Reading (c)
Diagram 1
(a) Record the reading to two decimal places for: [3 marks]
Reading (a): __________ (b): __________ (c): __________
(b) Construct a table to record the readings in the experiment. [3 marks]
(c) (i) Calculate the mass of [3 marks]
copper: __________ oxygen: __________
(ii) Determine the empirical formula of oxide of copper. State an observation in this experiment. [3 marks]