7372 fish pass design
DESCRIPTION
Fish PassTRANSCRIPT

7/21/2019 7372 Fish Pass Design
http://slidepdf.com/reader/full/7372-fish-pass-design 1/56
(210–VI–NEH, August 2007)
TechnicalSupplement 14N
Fish Passage and Screening Design

7/21/2019 7372 Fish Pass Design
http://slidepdf.com/reader/full/7372-fish-pass-design 2/56
Part 654
National Engineering Handbook
Fish Passage and Screening DesignTechnical Supplement 14N
(210–VI–NEH, August 2007)
Advisory Note
Techniques and approaches contained in this handbook are not all-inclusive, nor universally applicable. Designing
stream restorations requires appropriate training and experience, especially to identify conditions where various
approaches, tools, and techniques are most applicable, as well as their limitations for design. Note also that prod-
uct names are included only to show type and availability and do not constitute endorsement for their specific use.
Issued August 2007
Cover photo: Restoring fish migration may require culverts and other
water conveyances to be redesigned or replaced.

7/21/2019 7372 Fish Pass Design
http://slidepdf.com/reader/full/7372-fish-pass-design 3/56
(210–VI–NEH, August 2007) TS14N–i
Contents
TechnicalSupplement 14N
Fish Passage and Screening Design
Introduction TS14N–1
Passage barrier and screening overview ................................................... TS14N–1
Federal and state authority and regulations .............................................. TS14N–2
Biological design considerations TS14N–2
Migration type ............................................................................................... TS14N–3
Migration schedule ....................................................................................... TS14N–4
Physical characteristics and capabilities ................................................... TS14N–4
Warm-water and cold-water species .......................................................... TS14N–5
Body type and size ........................................................................................ TS14N–5
Swimming and leaping capabilities ............................................................ TS14N–5
Behavioral responses ................................................................................... TS14N–6Life cycle histories and physical characteristics information ................. TS14N–9
Incorporating biology into design TS14N–9
Velocity ........................................................................................................... TS14N–9
Depth ............................................................................................................ TS14N–10
Jump height and pool length ..................................................................... TS14N–10
Behavioral attractors TS14N–10
Fish passage and screening design TS14N–11
Site assessment ........................................................................................... TS14N–12
Hydrologic analysis overview ................................................................... TS14N–12
Hydrologic analysis for gaged streams .................................................... TS14N–13
Hydrologic analysis for ungaged streams ................................................ TS14N–13
Hydraulic analyses overview ..................................................................... TS14N–13
Hydraulic models ........................................................................................ TS14N–14
Concrete fishways and ladders TS14N–14
General overview ........................................................................................ TS14N–14
Weirs, orifices and gates (flow controls) ................................................. TS14N–16
Concrete ladder pools ................................................................................ TS14N–19
Entrance and attractors ............................................................................. TS14N–21
Exit ............................................................................................................... TS14N–22
Rock fishways.............................................................................................. TS14N–22
Roughened channel fishways TS14N–26
Engineered channel .................................................................................... TS14N–26
Denil ............................................................................................................. TS14N–26
Alaska Steeppass ........................................................................................ TS14N–28
Culvert modification and design ............................................................... TS14N–28
Tide gates and floodgates TS14N–37
Fishway operation and maintenance ....................................................... TS14N–39

7/21/2019 7372 Fish Pass Design
http://slidepdf.com/reader/full/7372-fish-pass-design 4/56
Part 654
National Engineering Handbook
Fish Passage and Screening DesignTechnical Supplement 14N
TS14N–ii (210–VI–NEH, August 2007)
Fish screen design ...................................................................................... TS14N–40
Screen design approach ............................................................................. TS14N–44
Bypass design TS14N–46
Maintenance and operation ....................................................................... TS14N–47
Example problem: Preliminary design for fish passage ......................... TS14N–47
Tables Table TS14N–1 Examples of diadromous life histories and TS14N–3species
Table TS14N–2 Examples of potamodromous life histories TS14N–3and species
Table TS14N–3 Example of maximum swimming speeds and TS14N–6maximum jumping heights for selected adultsalmonids
Table TS14N–4 Relative swimming speeds of average-sized TS14N–7adult fish
Table TS14N–5 Relative swimming speeds of young fish TS14N–8
Table TS14N–6 Jump height coefficient TS14N–20
Table TS14N–7 Incipient motion thresholds for rock sizes TS14N–25
Table TS14N–8 Maximum lengths for no-slope culverts TS14N–33
Table TS14N–9 Examples of screen materials for fry-sized TS14N–45salmonids <60mm (minimum 27% open area)
Table TS14N–10 Steelhead swimming design criteria TS14N–48

7/21/2019 7372 Fish Pass Design
http://slidepdf.com/reader/full/7372-fish-pass-design 5/56
TS14N–ii(210–VI–NEH, August 2007)
Part 654
National Engineering Handbook
Fish Passage and Screening DesignTechnical Supplement 14N
Figures Figure TS14N–1 Fish body types TS14N–5
Figure TS14N–2 Fish passage design process TS14N–11
Figure TS14N–3 2-year, 2-day duration design discharge TS14N–12
Figure TS14N–4 Plan view of a generalized concrete ladder TS14N–15fish passage facility
Figure TS14N–5 Cross section and profile views of a pool and TS14N–17weir/orifice fishway
Figure TS14N–6 Plan and end views of a vertical slot fishway TS14N–18
Figure TS14N–7 Weir schematic TS14N–18
Figure TS14N–8 Orifice (gate) schematic TS14N–18
Figure TS14N–9 Plunging and streaming flow TS14N–19
Figure TS14N–10 D number parameters for evaluating hydraulic TS14N–19 jump geometry of a vertical drop spillway
Figure TS14N–11 Plan view of a generalized roughened rock TS14N–23channel/rock ladder fishway
Figure TS14N–12 Boulder weir (plan view) TS14N–23
Figure TS14N–13 Boulder weir cross section TS14N–23
Figure TS14N–14 Boulder step-pool profile TS14N–24
Figure TS14N–15 North Dam on the Red River of the North TS14N–27(ND) before and after construction of anengineered channel fishway
Figure TS14N–16 Site photo and schematic of a common TS14N–27Denil fishway
Figure TS14N–17 Site photo and schematic of an Alaska Steep- TS14N–28
pass fishway
Figure TS14N–18 A significantly perched culvert TS14N–29
Figure TS14N–19 Series of channel spanning weirs used to TS14N–29step-up water surface and raise outlet pool toculvert lip
Figure TS14N–20 Common baffle styles for round and box TS14N–30culverts

7/21/2019 7372 Fish Pass Design
http://slidepdf.com/reader/full/7372-fish-pass-design 6/56
TS14N–iv (210–VI–NEH, August 2007)
Part 654
National Engineering Handbook
Fish Passage and Screening DesignTechnical Supplement 14N
Figure TS14N–21 Round, corrugated metal culvert retrofitted TS14N–30with corner baffles to improve fish passage
Figure TS14N–22 General flowchart of the culvert design TS14N–31 process
Figure TS14N–23 No-slope option culvert schematic TS14N–32
Figure TS14N–24 Undersized perched culvert replaced with TS14N–34arger pipe designed using stream simulationoption
Figure TS14N–25 Low (<4%) and high (>4%) bed slope stream TS14N–35simulation culvert design schematics)
Figure TS14N–26 Hydraulic design option culvert schematic TS14N–36
Figure TS14N–27 Improved fish passage TS14N–38
Figure TS14N–28 Self-regulating tide gate TS14N–39
Figure TS14N–29 Potential fish screen configurations and TS14N–40locations
Figure TS14N–30 Vertical fixed plate screen TS14N–42
Figure TS14N–31 Vertical traveling screen TS14N–42
Figure TS14N–32 Rotary drum screen TS14N–43
Figure TS14N–33 Pump intake screens TS14N–43
Figure TS14N–34 Infiltration gallery TS14N–44
Figure TS14N–35 Fish screen wire and mesh configurations TS14N–45
Figure TS14N–36 Sweeping and approach velocities TS14N–45

7/21/2019 7372 Fish Pass Design
http://slidepdf.com/reader/full/7372-fish-pass-design 7/56
(210–VI–NEH, August 2007) TS14N–1
TechnicalSupplement 14N
Fish Passage and Screening Designs
Introduction
Fish passage and screen facility design is often a
significant component in stream restoration and water
resource management. A wide variety of issues often
arise regarding passage and screening design, depend-
ing on the project region and species of interest. This
technical supplement provides an overview of fish pas-
sage and screening design approaches that incorporate
biological considerations into the hydraulics of com-
monly used structures; guidance on site assessment
and operations and maintenance (O&M) of fishways
and screens; an overview of assessment and design
approaches for fishways and screens, ladders, cul-
verts, tidegates, and floodgates; and finally, an exampledesign is presented.
Passage barrier and screening overview
Fish migration is a natural, usually seasonal life cycle
function, as fish move in large numbers from one
habitat type to another to spawn, feed, grow, or seek
refuge from predators. Federal and state regulations
often require mitigation for passage barriers and water
intakes or diversions that entrain fish. As a result, the
timing, duration, and frequency of fish migrations must
be accounted for when planning and implementingwater resource projects within a watershed.
Passage barriers are primarily a problem for fish try-
ing to move upstream in an estuary, river, or stream.
Both natural and manmade barriers occur within river
and stream systems. Natural physical barriers include
features such as waterfalls, cascades, and large rapids.
Common manmade physical barriers include dams,
diversions, culverts, weirs, and grade control and sill
structures. Chemical and biological barriers also ex-
ist in many rivers across the United States, including
water quality (temperature) and predation from non-
native species. Virtually all manmade barriers impede
fish passage, limit natural migration patterns, regulate
population dynamics, and fragment diverse habitats.
Physical fish barriers are classified by water velocity,
water depth, and barrier height. The magnitude of a
fish passage impediment can generally be classified as:
• partial—impassable to some species or certain
age classes all or most of the time
• temporary—impassable during some times to
all or most species and/or age classes (during
low-flow conditions)• complete—impassable to all fish at all times
Some situations present difficult conditions under
which passage for all fish species and size classes
cannot be provided 100 percent of the time. However,
typical design modifications for fish passage barrier
mitigation include the following:
• culvert removal, modification, or replacement
• channel modification
• structural fish passage features (concrete or
metal ladders and chutes)
• natural-type fish passage design (rock riffles,
rock aprons, step-pool rock ladders)
• dam or barrier removal or modification
In addition to fish barriers, fish entrainment into water
diversions or pump intake structures also affects
natural migration patterns—primarily for downstream
movement, but sometimes for upstream movement.
Typically, fish screens are used to prevent adult and ju-
venile fish entrainment or attraction into manmade di-
version structures or other features (power or sewage
treatment plant outfalls). Typical types of surface and
subsurface diversion structures requiring fish screens
include municipal and irrigation water intakes, irriga-
tion diversions, and pump stations. Protecting fish
from entrainment at these structures may be achieved
through the use of the following features:
• physical barriers and screens
• behavioral guidance to direct swimming direction
• capture and release systems
This technical supplement provides general design
guidance for three types of fish passage features: con-
crete fishways, step-pool rock ladders, and roughened
channels (engineered channel, Denil, and Alaskan
Steeppass). Additionally, approaches are described for
modifying or replacing existing culverts to improve
or provide fish passage. Considerations for tide gates
and floodgates are also presented. Finally, screen
design guidance addressing active and passive screen-
ing approaches for gravity and pumped diversions is
presented.

7/21/2019 7372 Fish Pass Design
http://slidepdf.com/reader/full/7372-fish-pass-design 8/56
Part 654
National Engineering Handbook
Fish Passage and Screening DesignTechnical Supplement 14N
TS14N–2 (210–VI–NEH, August 2007)
Federal and state authority andregulations
Federal and state regulations require fish passage and
protection from fish entrainment under several author-
ities that require water resource project developers to
mitigate for impacts to fisheries resources. For ex-
ample, under the Endangered Species Act (ESA) it is
illegal to knowingly take a fish that is listed as threat-
ened or endangered. The ESA and other Federal and
state laws may require that a design provides passage
upstream of barriers and prevents entrainment into
diversion structures or pump intakes. The following
sections provide an overview of passage and screening
design criteria often promulgated in Federal and state
regulations. Designers should contact local authorities
and experts to determine if species, season, or region-
specific passage and screening criteria are emphasized
in the project area.
Several authorities and regulations require the imple-
mentation of fish passage and screening projects.
In many parts of the United States, fish passage and
screening projects are undertaken to protect ESA-list-
ed species and state species of concern and enhance
their habitat. The National Oceanic and Atmospheric
Administration National Marine Fisheries Service
(NOAA Fisheries Service), U.S. Fish and WildlifeService (USFWS), and state game and fish agencies are
excellent contacts for legal requirements and technical
criteria. Generally, projects that are authorized, fund-
ed, or carried out by the U.S. Department of Agricul-
ture (USDA) Natural Resources Conservation Service
(NRCS) are subject to ESA Section 7 consultation
unless they clearly have no effect on listed resources.
When the project is likely to affect listed fish (even if
the effects are completely beneficial), the project de-
signer must comply with technical criteria from NOAA
Fisheries Service or USFWS when designing fishways
or screening facilities to expedite the consultation
process and increase the likelihood of project success.However, in all projects, NRCS personnel should strive
to design fishways and screens that protect all aquatic
resources and provide private landowners with work-
able solutions. More information on permits, process,
and regulatory requirements is provided in NEH654.13.
Biological design considerations
The design of a fish passage or screening project
begins with identifying the current or historical dis-
tribution and migratory patterns of fish species in
the project area. Target species can be those listed as
threatened or endangered under the ESA and/or state
species of concern, other native species, or aggres-
sive nonnative species tagged for potential exclusion
(species to be isolated at a sorting facility in a fish
passage). The project design should be based on the
physical limitations of the weakest species requiring
passage and accommodating the smallest size within
that species, wherever feasible, based on stream con-
ditions (Washington Department of Fish and Wildlife(WDFW) 2000a). These physical limitations are usually
based on biological data and characteristics and are
then used to develop the design criteria for fish pas-
sage and screening structures (Bates 1992).
The following planning sequence and biological char-
acteristics are often evaluated when developing design
criteria for a fish passage or screen project:
Step 1 Identify the target species for fish pas-
sage or screening.
Step 2 Determine the migratory timing and life
history stage at migration.
Step 3 Determine the physical limitations on fish
passage (swimming speed, jumping ability).
Step 4 Identify the environmental attractors
and stressors (flow volumes, flow velocity, water
temperature, seasonal timing).
Step 5 Identify any relevant behavioral char-
acteristics of the target species that could affect
fish passage (water temperature preferences and
avoidances).
Many fish species must migrate to satisfy their habitatrequirements for foraging, resting, rearing, and spawn-
ing. Additionally, many resident freshwater species
commonly move several miles within freshwater
systems on a daily or monthly basis for feeding or shel-
tering purposes. Migrating or moving fish are vulner-
able to injury and mortality if normal movement pat-
terns are blocked or impeded by constructed barriers.
They are also more susceptible to injury as they try to
negotiate manmade barriers. If fish passage is impeded

7/21/2019 7372 Fish Pass Design
http://slidepdf.com/reader/full/7372-fish-pass-design 9/56
TS14N–3(210–VI–NEH, August 2007)
Part 654
National Engineering Handbook
Fish Passage and Screening DesignTechnical Supplement 14N
during spawning migrations, impacts on population
can be severe and include decreased egg size and
abundance, decreased redd excavation success, andoutright mortality (Rainey 1991).
Migration type
Migratory life history strategies vary widely and in-
clude bidirectional migrations between marine and
freshwater environments (diadromy), or solely within
freshwater environments (potamodromy). Most major
migrations occur for reproduction (spawning) pur-
poses (anadromous and catadromous fishes), althoughlarge-scale movements also occur seasonally as fish
exploit food resources along inland rivers, estuar-
ies, and coastlines. Fish migration categories and
strategies are briefly described in tables TS14N–1 and
TS14N–2.
Category Description/life history strategy Species
Anadromous Species that incubate and hatch in freshwater, migrate
to saltwater as juveniles to grow, and return to fresh-
water as adults to spawn
Alewife; striped bass; Atlantic,
coho, pink, chum, sockeye, and
Chinook salmon; steelhead,
cutthroat, and bull trout; dolly
varden; sturgeon; American
shad; perch; Atlantic herring;
sea and Pacific lamprey
Catadromous Species that hatch in saltwater, migrate to freshwater
as juveniles to grow, and return to saltwater to spawn
American eel
Amphidromous Species that move between fresh and saltwater during
some part of life cycle, but not for breeding
Sawfish, gobies, other tropical
fishes
Table TS14N–1 Examples of diadromous life histories and species
Category Description/life history strategy Species
Adfluvial Species that hatch in rivers or streams, migrate to lakes
as juveniles to grow and return to rivers or streams to
spawn
Bull trout, cutthroat trout,
kokanee, smelt, suckers
Fluvial Species that live in the flowing waters of rivers or
streams, but migrate between rivers and tributaries for
breeding, feeding, or sheltering
Bull trout, cutthroat trout,
brown trout, rainbow trout,
Arctic grayling, sturgeon,
paddlefish, pike
Table TS14N–2 Examples of potamodromous life histories and species

7/21/2019 7372 Fish Pass Design
http://slidepdf.com/reader/full/7372-fish-pass-design 10/56
Part 654
National Engineering Handbook
Fish Passage and Screening DesignTechnical Supplement 14N
TS14N–4 (210–VI–NEH, August 2007)
Migration schedule
Migration timing is tied to species life stage (spawn-ing), time of day (foraging or predatory migrations),
changes in water temperature, increases in flow rates,
or changes in flow direction (tides). In addition, migra-
tions can occur hourly, daily, monthly, and seasonally in
fish populations across the United States and Caribbean
area. Providing uninterrupted passage or continuous
operational screening is often very difficult, and it is
likely that any given project will have short periods of
inoperation or down time. However, project designers
should develop fish passage and screening approaches
that provide the best level of protection for sensitive
life histories and important migratory periods and that
have the greatest effect on population health and sus-
tainability.
Since migration timing and frequency of movement
vary among species and watersheds, knowledge of the
specific behavior of the target species is necessary for
development of fish passage and screening criteria. Dif-
ferent species or age classes may migrate at different
times of the year; multiple hydrologic analyses may be
needed to determine the controlling hydraulic require-
ments at any particular site. Movements may occur
both upstream and downstream.
Generally, anadromous adult salmon and steelhead
spawning migrations occur during a distinct season
(fall, winter, spring, or summer). Juvenile salmon rear-
ing in freshwater migrate first in the spring as fry and
later in the summer and early fall as fingerlings or parr,
searching out different habitats as they grow (WDFW
1999). The largest movement of anadromous salmonids
occurs in the spring, as juveniles transition (smolt)
from their freshwater rearing areas into the productive
ocean environment where they will grow to adulthood.
Anadromous fish on the Atlantic coast primarily make
spawning runs in the spring, and adults reproduce in
estuarine or freshwater stream habitats. Conversely,catadromous American eels of the eastern coast of the
United States live in freshwater streams and lakes for
up to 5 years before they journey to the Sargasso Sea
of the Atlantic Ocean near Bermuda to spawn. Juvenile
eels spend about a year in the ocean before returning to
freshwater where they grow to adulthood.
Freshwater migrations occur for spawning and forag-
ing purposes. A study of warm-water fish in Arkansas
shows bidirectional movement in streams and is not
influenced by season (Warren and Pardew 1998).
Redhorses, carpsuckers, catfish, muskellunge, wall-eye, and northern pike migrate along the Fox River
in Illinois virtually year-round for foraging purposes,
but only between May and July for spawning (Illinois
Department of Natural Resources 2000). Young (1994)
found that brown trout in south-central Wyoming
moved more than 60 miles during the spawning season
between mainstem rivers and adjoining tributaries.
Studies by Young (1996) and Colyer et al. (2005) sug-
gest that salmonids often undertake lengthy daily and
seasonal migrations to exploit feeding areas, seek
refuge or resting cover, and colonize new habitats. In
addition to longitudinal (main channel) migrations,
movements may occur laterally between the mainchannel and side channels, emergent wetlands, or
backwaters. For example, some species such as north-
ern pike spawn in side channels, oxbows, and flood
plain ponds adjacent to large river systems.
Physical characteristics and capabilities
In any given stream system, juveniles and/or adults
may be present during different times of the year and
most likely have different swimming abilities and pas-
sage requirements. Consequently, design of fish pas-
sages and screens should incorporate available infor-mation on the specific physical capabilities of target
species. These physical characteristics and capabilities
vary depending on the species and life stages present,
but will likely include fish body type and size, swim-
ming ability, impact resistance, and leaping ability.
Generally, physical characteristics and swimming capa-
bilities become the biological basis for engineering de-
sign criteria in a fish passage or screening project. For
example, fish passage features designed for salmonids
consider the swimming capabilities of migrating adult
fish headed for spawning areas. Swim speed (burst andsustained) and distance, minimum swim depths, maxi-
mum jump/drop height, and pool approach depths are
critical in providing upstream navigation for spawners.
For fish screens, downstream migration of juvenile
salmonids focuses more on body size, sweeping veloci-
ties, orientation to flow, and cross-sectional streamflow
patterns to prevent unwanted entrainment and im-
pingement on the structure.

7/21/2019 7372 Fish Pass Design
http://slidepdf.com/reader/full/7372-fish-pass-design 11/56
TS14N–5(210–VI–NEH, August 2007)
Part 654
National Engineering Handbook
Fish Passage and Screening DesignTechnical Supplement 14N
Warm-water and cold-water species
The physical form and capabilities of a given speciesare products of evolutionary and behavioral adapta-
tions to its physical and biological environment. The
most basic distinction between fish species is their ad-
aptation to water temperatures, and swimming perfor-
mance can be directly affected by thermal conditions.
Most fish are ectotherms, meaning that their body tem-
perature is mainly regulated by their external environ-
ment. Consequently, water temperature is one of the
most important physical factors affecting the behavior,
physiology, and distribution of fish (Great Lakes In-
formation Network 2004). Fish are often classified as
either cold-water or warm-water species. Cold-water
fish such as trout and salmon generally require temper-atures below 70 degrees Fahrenheit, while warm-water
species like bass and catfish thrive in temperatures
primarily above 70 degrees Fahrenheit.
Body type and size
Body shapes and size of fish and aquatic organisms
at maturity are often adapted to the flow regimes and
general physical attributes of their respective habitats
(Food and Agriculture Organization of the United Na-
tions 2002). For example, fish in fast-flowing reaches
of higher gradient streams often have torpedo-shapedbodies that offer lower flow resistance (steelhead,
rainbow trout). Conversely, high-backed fish (carp
and razorback suckers) colonize rivers with more
gentle currents or deeper average depths (fig. TS14N–1
(Schua and Schua 1970)). Body size at a given age is
especially important in screen design. Some fish spe-
cies are very small shortly after hatching and are more
susceptible to entrainment into surface diversions or
pumping stations. Likewise, the adults of many species
of fish never grow to more than 4 to 6 inches and are
similarly in danger of being entrained into pumps or
canals. Small-bodied or weak-swimming fish are sus-ceptible to being impinged on fish screens where they
will eventually die or fall victim to predators.
Swimming and leaping capabilities
The swimming speeds and jumping capabilities of a
fish are adaptations to stream morphology, flow char-
acteristics, and migratory life history. The swimming
and jumping characteristics of a fish are defined as:
Burst (darting) speed—highest swimming speeds; en-
durance less than 20 seconds; ends in extreme fatigue
Sustained speed—low swimming speeds; maintained
for extended time periods with little to no fatigue
Cruising speed—intermediate swimming speeds; en-
durance 20 seconds to 200 minutes; ends in fatigue
Jumping height—a function of swimming speed and
water depth, jumping height is the maximum height
obtained by a specific species and age of fish. Older
and larger fish have greater maximum jumping heights,
although some species have no jumping abilities at any
age.
Figure TS14N–1 Fish body types

7/21/2019 7372 Fish Pass Design
http://slidepdf.com/reader/full/7372-fish-pass-design 12/56
Part 654
National Engineering Handbook
Fish Passage and Screening DesignTechnical Supplement 14N
TS14N–6 (210–VI–NEH, August 2007)
The swimming speeds and maximum jumping heights
have been researched in controlled settings and docu-
mented for many fish species, with particular empha-sis on salmonids. Table TS14N–3 lists the known maxi-
mum swimming speeds and maximum jumping heights
for adult salmonid species (Bjornn and Reiser 1991).
Salmonids are strong swimmers and leapers (Tillinger
and Stein 1996) (table TS14N–4 ((modified from Bell
1990)) especially in comparison to warm-water spe-
cies and other migratory species. However, although
salmon and steelhead are famous for their swimming
and leaping abilities, their physical prowess steadily
weakens as they swim further and further into fresh-
water habitats. Many fish species cannot or will not
jump over obstructions; shad and herring can beblocked by a structure only 1 foot high (USFWS 2004).
Likewise, although chum and pink salmon are power-
ful swimmers, their leaping abilities are somewhat
limited, and few individuals will attempt to negotiate
vertical leaps much greater than 1 foot (Orsborn 1985).
All of these factors should be considered when design-
ing fishways, road crossings, or roughened channels.
Fish size and stage of development also affect swim-
ming capabilities. Juvenile and smaller fish do not
swim as strongly as healthy adults of the same species
(table TS14N–5 (modified from Bell 1990)), so slower
velocities should be considered in the design of fish
passage and screening projects (Tillinger and Stein
1996). Projects in settings with a variety of fish spe-
cies of differing body sizes and swimming capabilities
can pose especially challenging design requirements.
However, if the fishway or screen passes or protects
the smallest or weakest swimming fish, it is likely thatother fish seeking passage at the same time or when
streamflow is higher will find adequate passage condi-
tions or be protected from entrainment into diversions
or pumps.
Behavioral responses
Understanding the behavioral response of a species
to stimuli enables the development of fish attractors
and detractors for fish passage and screening projects.
Attractors and detractors may take the form of shade,
light, fishway water velocity, relative volume of fish-way attraction flow to streamflow, temperature, sound,
and shoreline or overhead movements. Fishway com-
position can be a very important factor determining
success or failure. For example, some fish (shad) are
hesitant to swim through a submerged orifice, instead
preferring flow that is directed through a vertical slot
or over a weir. Excessive turbulence at a fishway en-
trance may confuse or restrict target species, and the
orientation of a fish ladder’s entrance to the adjacent
stream channel is of the utmost importance. Many fish
move up a river system by capitalizing on lower veloci-
ties along the bankline boundary layer. Conversely,
juvenile emigrants are usually found moving down-stream in the fastest flowing portion of the channel,
within 1 foot of the surface.
Salmonid
species
Sustainedspeed
Cruisingspeed
Burstspeed
Maximum jump height
ft/s m/s ft/s m/s ft/s m/s ft m
Steelhead 4.6 1.40 13.7 4.18 26.5 8.08 11.2 3.4
Chinook 3.4 1.04 10.8 3.29 22.4 6.83 7.8 2.4
Coho 3.4 1.04 10.6 3.23 21.5 6.55 7.2 2.2
Cutthroat 2.0 0.61 6.4 1.95 13.5 4.11 2.8 0.9
Chum 1.6 0.49 5.2 1.58 10.6 3.23 1.7 0.5
Sockeye 3.2 0.98 10.2 3.11 20.6 6.28 6.9 2.1
Table TS14N–3 Example of maximum swimming speeds and maximum jumping heights for selected adult salmonids

7/21/2019 7372 Fish Pass Design
http://slidepdf.com/reader/full/7372-fish-pass-design 13/56
TS14N–7(210–VI–NEH, August 2007)
Part 654
National Engineering Handbook
Fish Passage and Screening DesignTechnical Supplement 14N
Table TS14N–4 Relative swimming speeds of average-sized adult fish
0 4 8 12 16 20
Velocity (ft/s)
Relative swimming speeds of adult fish
24 28
Cruising speed
Sustained speed
Darting speed
32 36
Chinook
Coho
Sockeye
Steelhead (2–2.7 ft)
Cutthroat
Brown trout
Grayling
Whitefish
Shad (12–14 in)
Herring (6–11 in)
Anchovy
Carp
Goldfish (4–8 in)
Suckers
Cod (1.8 ft)
Mackerel (13–15 in)
Plaice (2.4–10 in)
Alewives (2.5–3 in)
Mullet (9.5 in)
Stickleback (4 in)
Lamprey
Eel (2 ft)
Eel (3 ft)
Eel (5 ft)
Eel (8 ft)

7/21/2019 7372 Fish Pass Design
http://slidepdf.com/reader/full/7372-fish-pass-design 14/56
Part 654
National Engineering Handbook
Fish Passage and Screening DesignTechnical Supplement 14N
TS14N–8 (210–VI–NEH, August 2007)
Table TS14N–5 Relative swimming speeds of young fish
0 .5 1.0 1.5 2.0 2.5
Velocity (ft/s)
Relative swimming speeds of young fish
3.0 3.5
Cruising speed
Sustained speedDarting speed
4.0 5.04.5
Coho (2 in)
Coho (3.5 in)
Coho (4.75 in)
Sockeye (5 in)
Brook trout (3–5 in)
Grayling (2–4 in)
American shad (1–3 in)
Herring larvae (.4–8 in)
Striped bass(.5 in)
Striped bass (1 in)
Striped bass (2 in)
Striped bass (5 in)
Mullet (.5–2.75 in)
Glass eels (2 in)
Elvers (4 in)
Spot (.5–2.75 in)
Pinfish (.5–2.75 in)

7/21/2019 7372 Fish Pass Design
http://slidepdf.com/reader/full/7372-fish-pass-design 15/56
TS14N–9(210–VI–NEH, August 2007)
Part 654
National Engineering Handbook
Fish Passage and Screening DesignTechnical Supplement 14N
Ambient environmental conditions also greatly af-
fect the migratory habits of fish. For many species,
spawning migrations may be triggered by changes inwater temperature. For example, Lower Columbia
River white sturgeon spawn when water temperatures
are between 48 degrees and 63 degrees Fahrenheit
(Wydoski and Whitney 2003) and may be delayed or
prevented when water temperatures are unsuitable
(Fresh et al. 1999). Light can be used as an artificial
guidance stimulus, repelling fish at higher intensities
and attracting them at lower intensities (Bell 1990).
Life cycle histories and physicalcharacteristics information
Further information on various aspects of life cycle
history and physical characteristics for a variety of fish
may be found at the following Web sites:
http://www.nwrc.usgs.gov/publications/
specindex.htm
http://www.fishbase.org
Incorporating biology into design
Much is known about the physical capabilities and be-havioral tendencies of many fish species. The design of
fishways and screens should incorporate these physi-
cal characteristics and capabilities of targeted spe-
cies. Swimming and leaping information for many fish
species is not available. Designers should use recorded
data from similar species with comparable swimming
and behavioral characteristics.
Fish passage and screening facilities should not
impose artificial conditions that exceed the natural
locomotive abilities of fish or adversely affect their
behavioral response to a given stimulus. The followingsection provides a few useful rules of thumb regarding
biological requirements and capabilities, hydraulics,
and fish passage and screen design. Additional qualita-
tive and quantitative criteria are described later in this
technical supplement for fishways and screens.
Velocity
Velocities within a fish passage structure should beless than the sustained swimming capability for each
species in long uniform sections and less than burst
swimming ability over short distances (Katopodis
1991). Fish that are forced to swim through a structure
with bursts or sustained cruising speeds will suffer
stress from fatigue. If adult or juvenile migratory fish
are unduly fatigued by a fishway, their ability to sur-
vive and complete life history requirements may be
significantly diminished. Resting alcoves or cover must
be provided if velocities within a fish passage structure
exceed the swimming capabilities of the target species
for long distances. Velocity breaks and shadows using
boulders or large wood can be used to provide rest-ing areas in roughened channels or fishways that are
designed to mimic natural stream conditions. Species’
velocity criteria would then be applied to flow areas
between constructed resting areas.
For adult salmonid passage through a culvert, NOAA
Fisheries Service (2000) recommends average calcu-
lated velocities of 6.0 feet per second for distances
of less than 60 feet, 4.0 feet per second for distances
between 100 and 200 feet, and 2.0 feet per second for
distances greater than 300 feet. Recent studies found
that warm-water fish passage through culverts lessthan 30 feet in length was reduced substantially at ve-
locities over 1.3 feet per second (Warren and Pardew
1998). Conversely, salmonids are expected to sustain
this velocity for more than 300 feet. Knowledge of the
swimming abilities of target species is a vital element
of the design process.
Fish screen designs must account for approach veloci-
ties in the forebay of the structure and sweep veloci-
ties along the face of the screen. Approach velocity is
velocity perpendicular to the screen that may trap or
impinge a fish against a screen. Physical contact with a
screen face causes various injuries, and studies of fishbiomechanics have been used to set hydraulic criteria
for approach velocities (Pearce and Lee 1991). Sweep
velocity is the velocity parallel to the face of the
screen that sweeps fish along its face and into a bypass
that will take them back to a river or other water body.
For juvenile salmonids, NOAA Fisheries Service (2000)
and WDFW (2000a) recommend an approach velocity
of 0.4 feet per second in rivers and streams, and 0.33
feet per second in lakes and reservoirs. Sweeping ve-

7/21/2019 7372 Fish Pass Design
http://slidepdf.com/reader/full/7372-fish-pass-design 16/56
Part 654
National Engineering Handbook
Fish Passage and Screening DesignTechnical Supplement 14N
TS14N–10 (210–VI–NEH, August 2007)
locity should always be greater than approach velocity,
regardless of screen location in a river, lake, or other
body of water.
Depth
Minimum low-flow depths within fishways should be
maintained to accommodate fish size, swimming abili-
ties, and behavioral responses. For pool style fishways
or channel-spanning structures, WDFW (2000a) recom-
mends a maximum head differential of 12 inches for
most adult salmonids, 6 inches for juvenile salmonids,
and 3 inches for grayling. These depths are difficult to
attain in many culvert crossings on small headwater
streams at baseflow, so culvert size, shape, composi-tion, and installation techniques become important
factors that regulate passage.
Minimum operating depth at screening facilities de-
pends on the type of screen and site hydraulics. How-
ever, a good rule of thumb to protect juvenile or small-
bodied fish is to provide a minimum of 2.5 square feet
of submerged screen for every cubic foot per second
of flow diverted through it.
Jump height and pool length
The jumping heights of target species must be identi-
fied when designing a fish passage structure using
stepped pools or weirs. These typically include a
maximum vertical height, and the jump pool length
and depth needed to allow the fish to generate enough
speed to clear the barrier. In addition, pool spacing
and configuration must satisfy resting requirements
of all target species. The WDFW (2003) has developed
the following r ecommendations for salmonid passage
structures based on the species’ swimming and leaping
capabilities:
• Entrance jump (maximum vertical height)
into a fish passage project should be no great-
er than 1 foot for salmon and steelhead adults
and 6 inches for adult trout, kokanee salmon,
and steelhead juveniles. These jump heights
should also be considered as maxima when a
series of jumps and pools are required.
• Jump pool (where entrance jumps are
planned) must be at least 1.5 times the jump
height or at least 2 feet deep to account for
resting requirements of salmonid species.
Traditionally, fish passage projects have been designed
based primarily on the capabilities of jumping species
(salmonids) and only recently have nonjumping fish
been considered (Peake et al. 1997). Chute ladders or
roughened channels (rapid/pools or riffle/pools) with-
out discrete drops can provide adequate fish passage
for nonjumping target species.
Behavioral attractors
Many fish passage structures use high velocity attrac-tion flow at or near their entrances. This practice is
based on behaviors observed in salmonids. Migratory
salmon and steelhead tend to assume upstream migra-
tion paths by “cueing-in” on higher velocity currents.
A fishway entrance can be designed as a constriction
to increase velocities compared to surrounding flow
conditions, guiding fish into the structure based on
their natural behaviors in finding upstream migration
paths. When gravity flow through a passage structure
decreases, auxiliary pumps may be required to supply
high velocity attraction flow near fishway entrances.
Alternative behavioral attractors, including entrancesize, light, and acoustics are being explored in many
areas of the Pacific Northwest. For example, recent
studies show that salmonid species will select smaller,
well-lit entrances over larger, darker ones (Oregon
Department of Fish and Wildlife 2004).
Predation
Predation is a common problem at many fish pas-
sage and fish screen facilities. Avian predation most
often occurs along screening structures, where birds
can either land or wade near the fish screen, or diveunderwater and prey on disoriented fish at the bypass
pipe exit. Birds are also known to prey on groups of
fish stacked up at the entrance to a fishway. Piscine
or mammalian (seals and river otters) predation oc-
curs wherever fish are in pools near the entrance to a
fishway, along the face of screens, or bypass outlets
downstream of a fish screen. Fish behavioral char-
acteristics must be incorporated into screen and fish
passage designs so that pooling and holding areas
for predators are not adjacent to critical areas such

7/21/2019 7372 Fish Pass Design
http://slidepdf.com/reader/full/7372-fish-pass-design 17/56
TS14N–11(210–VI–NEH, August 2007)
Part 654
National Engineering Handbook
Fish Passage and Screening DesignTechnical Supplement 14N
as fishway entrances or bypass outlets. For example,
fishway entrances or bypass pipes can be located in
areas where site morphology and hydraulics discour-age target species to rest due to higher velocities,
inadequate cover, or unsuitable depth. Avian predation
can be reduced by providing overhead cover or vegeta-
tion above the entrance to a fishway or outlet from a
fish screen. Designers should take great care to mini-
mize and mitigate avian, piscine (predatory fish), and
mammalian predation in any sector of a fish screen or
passage project where the target species is likely to
congregate for any period of time. Care should also be
taken to avoid excessive fatigue or disorientation of
target species as they transit a passage or screen proj-
ect because physical impairment can lead to higher
predation rates.
Several resources are available to designers regarding
fish passage and screen history, design, and research.
Examples of fish passage projects and design criteria
can be found at the following Web sites:
http://wdfw.wa.gov/hab/engineer/habeng.htm
http://www.fws.gov/fisheries/fwma/fishpassage/
http://www.nwfsc.noaa.gov/research/divisions/
fed/fishpassage.cfm
http://swr.nmfs.noaa.gov/hcd/expert.htm
Examples of fish screen projects and design criteria
can be found at the following Web sites:
http://wdfw.wa.gov/hab/engineer/habeng.
htm#dwnstrm
http://swr.nmfs.noaa.gov/hcd/fishscrn.htm
http://swr.nmfs.noaa.gov/hcd/pumpcrit.pdf
Fish passage and screening
design
As described in previous sections, the fish passage and
screening design process often begins by collecting all
available information for the species of interest per-
taining to migration patterns, life history requirements,
and swimming and leaping capabilities. An assess-
ment of physical conditions and site suitability usu-
ally occurs concurrent with an evaluation of relevant
biological factors for the target species. Fish passage
Figure TS14N–2 Fish passage design process
Fish passage design process
Operations, maintenance, and monitoring
Site assessment
• survey and mapping
• biological characterization
• hydraulics
• geomorphology, geology
Initial design
• biological assessment• general biologic design criteria
• hydrologic analysis
• hydraulic analysis of existing conditions
• geomorphic and sediment considerations
• identify permit requirements
Fish passage design alternatives
• biological design criteria (specific)
• hydraulic analysis of alternatives
• preliminary design
• cost estimates
Final fish passage design
• finalize biologic design criteria
• revise hydraulics
• design
• cost estimates
• plans and specifications
• permit application
• construction contracting
design typically includes a site assessment including
site survey, geologic and geomorphic characteriza-
tion, hydrologic and hydraulic analyses, and structuraldesign (fig. TS14N–2).

7/21/2019 7372 Fish Pass Design
http://slidepdf.com/reader/full/7372-fish-pass-design 18/56
Part 654
National Engineering Handbook
Fish Passage and Screening DesignTechnical Supplement 14N
TS14N–12 (210–VI–NEH, August 2007)
Site assessment
Site assessments are addressed in detail in NEH654.03.This section focuses on site assessments that are more
specific to fish passage issues. The site assessment
should include topographic and hydrographic surveys
of the passage barrier and stream channel upstream
and downstream of the barrier. Whenever possible,
collect historic photos of the site, and interview near-
by residents for their perspective on the area. Accurate
contour and infrastructure (dams, diversions) as-builts
are essential for developing plans. Geomorphic as-
sessment is necessary to characterize stream behavior
and substrate conditions. In addition, depending on
site conditions and proposed structures, geologic and
geotechnical consultation may be necessary to charac-terize the soils, foundation, and river alluvium com-
position. Fish habitat characterization should also be
performed to evaluate migration patterns, holding pool
areas, and environmental conditions that will affect
fish migration and use of the fish passage feature. The
information developed in the site assessment is the
foundation for developing topographic, geomorphic,
edaphic, and biological criteria in final engineering
designs.
Hydrologic analysis overview
The first step in the engineering design is the hydro-
logic analysis. Typically, designs require defining the
range of high and low discharges the fish passage facil-
ity will operate within. Hydrologic analysis must con-
sider the period of interest when migration occurs and
when statistical analyses for streams with gage data
typically include flood frequency and flow-duration
investigations. Hydrologic information for ungaged
streams may be based on regional regression equa-
tions, correlation analyses to similar, adjacent gaged
streams, or runoff modeling. However, synthesizing
streamflow data should only be undertaken in smallerwatersheds of about 50 square miles or less.
Hydrologic analyses are used to describe streamflow
timing, magnitude, frequency, and duration during the
migration period of interest. Ultimately, this informa-
tion will identify the operating conditions under which
the fish passage or screening facility will function.
Regional guidelines from local fish and wildlife agen-
cies provide suggestions regarding fish passage and
typically identify design discharge analysis methods.
For instance, NOAA Fisheries Service (2000) recom-
mends that for streams where streamflow data areavailable, the high fish passage design flow for adult
salmonids should be the 1 percent annual exceed-
ance flow (This is not the 100-year storm.). For adult
passage at low flows, NOAA Fisheries Service recom-
mends using the 50 percent annual exceedance flow or
3 cubic feet per second (whichever is greater), and for
juveniles, the 95 percent annual exceedance flow or 1
cubic foot per second (whichever is greater). Similarly,
a design flow guideline used for fish passage projects
in Alaska identifies the 2-year, 2-day duration flood
using log-Pearson Type III for high-flow passage de-
sign criteria. Figure TS14N–3 shows a conceptual unit
hydrograph for the 2-year, 2-day duration flood analy-sis method (Alaska Department of Transportation and
Alaska Department of Fish and Game 2001).
Fish migration upstream may be limited during peak
flow events, although migration patterns vary across
species. Many fish migrate during spring or winter run-
off events, sometimes following high-flow freshets or
influxes of freshwater that affect water quality (salin-
ity, turbidity, temperature). In the Pacific Northwest,
winter steelhead and spring chinook spawning migra-
tions overlap flood seasons, while coho and sockeye
migrate at much lower flows in the fall. It is therefore
important to understand both the flood and baseflow
characteristics, if migration for the species of interest
occurs during these periods.
Figure TS14N–3 2-year, 2-day duration design discharge
R a t i o
o f d i s c h a r g e t o
i n s t a n t a n t e o u s p e a
k
Days before and after peak discharge
Dimensionless hydrograph for small watershed with limited storage
-5
0
0.2
0.4
0.6
0.8
1
1.2
-4 -3 -2 -1 0 1 2 3 4 5
Q2 peak
Q2, 2–day

7/21/2019 7372 Fish Pass Design
http://slidepdf.com/reader/full/7372-fish-pass-design 19/56
TS14N–13(210–VI–NEH, August 2007)
Part 654
National Engineering Handbook
Fish Passage and Screening DesignTechnical Supplement 14N
Hydrologic analysis for gaged streams
Hydrologic analysis techniques for characterizing flowduring a specific period of interest or season usually
involves flow-duration analysis of gage station data.
Flood frequency recurrence analysis is typically per-
formed using the guidelines in U.S. Water Resources
Council (WRC), 1981, Guidelines for Determining
Flood Flow Frequency, Bulletin #17B. Developing a
flood frequency curve provides the designer with an
estimate of flood magnitude and recurrence intervals
for use in determining the size, configuration, and
orientation of a fish passage facility. Computing flow
duration is essential in determining the performance
of a passage or screening structure across its opera-tional range of flows. Flow-duration analysis is often
performed by using daily average flow (or other peri-
ods such as 3-day, 5-day, or weekly) during the period
of interest. A more detailed description of flow dura-
tion analyses is provided in NEH654.05.
Hydrologic analysis for ungaged streams
Often, gages are not sufficiently close to a project site
or located within the same river system. Several meth-
ods are available to the designer for determining the
magnitude and recurrence interval of seasonal highflows in ungaged watersheds. These include regional
regression equations, discharge correlation to adjacent
gaged streams, or development of hydrologic rainfall-
runoff models.
The U.S. Geological Survey (USGS) has regional
regression equations for estimating flood events based
on watershed area, annual precipitation, and regional
variables. Regression equations have been developed
for many states and can usually be obtained from state
USGS offices. Typically, the regression curves are in
the form identified in equation TS14N–1. Q aA Px
b c= (eq. TS14N–1)
where:
Qx = x-year peak flood discharge (10-yr flood)
a = regression constant related to basin
parameters
A = watershed area
b = regression exponent related to basin
parameters
P = annual precipitation
c = regression exponent related to rainfall
characteristics and annual recurrence event
The designer can also use transfer techniques to
estimate flow characteristics at a project location in
an ungaged stream, using the results of an analysis
of streamflow data at an adjacent, gaged location.
In addition, a variety of mathematical and computer
hydrologic modeling systems (HEC–HMS, WinTR–20,
and ArcHydro) are available to aid the designer. De-
pending on the hydrologic model, either single event
peak flow or continuous multiple event modeling can
be performed. The use of regional regression, transfer
techniques, and hydrologic modeling are described in
NEH654.05.
Hydraulic analyses overview
Hydraulic analyses are performed to evaluate flow
conditions through a fish passage or screening struc-
ture. Typically, hydraulic design is an iterative process
that balances available water and flow rates with site
conditions and limitations, biological design criteria,
and evaluation of a variety of potential hydraulic flow
control structures. The following is a general overview
in the approach for performing hydraulic analyses
of a fish passage feature. Further description of fish
screens is provided at the end of this section.
The first step in a hydraulic analysis is to characterize
streamflow and morphology. Important data elements
that are necessary to characterize the project site
include flow patterns, velocity and depth, fish migra-
tion paths and holding pool locations, identification
of potential sediment scour and deposition zones, and
forebay and tailwater conditions. This information
is essential in aiding a designer in selecting the ap-
propriate location and design configuration of the fish
passage facility. Field measurements and surveys are
needed, particularly to determine low-flow characteris-tics, site geometry, and local topography.
Once stream conditions are characterized, potential
fish passage design alternatives can be developed and
evaluated. Fish entrances, ladders, and exits typically
use flow control structures such as weirs, gates, and
orifices. Two of the most critical pieces of hydraulic
information in the design of a fish passage facility
are flow circulation patterns above, below, and adja-
cent to the fishway site and water surface elevations

7/21/2019 7372 Fish Pass Design
http://slidepdf.com/reader/full/7372-fish-pass-design 20/56
Part 654
National Engineering Handbook
Fish Passage and Screening DesignTechnical Supplement 14N
TS14N–14 (210–VI–NEH, August 2007)
across the range of operating flows identified in the
hydrologic analysis. The following section describes
models available for hydraulic analysis of streamconditions and basic equations used for design of
hydraulic design of weirs, gates and orifices. A more
detailed description of hydraulic analyses is provided
in NEH654.06.
Hydraulic models
The current standard for evaluating stream hydraulics
is to develop a computer hydraulic model. Several
models (such as HEC–RAS) are available for predict-
ing water surface elevations, forebay and tailwater
conditions, flow and diversion characteristics, andsite velocities and depths (NEH654.06). Hydraulic
analysis and design is an iterative process, balancing
the various criteria and design requirements of the
project. Therefore, the designer should perform sepa-
rate calculations of composite flow profiles due to the
complex nature of the hydraulic structures associated
with fish passage facilities.
Evaluating existing hydraulic conditions will provide
the designer with forebay and tailwater curves used
in setting the preliminary invert elevations for the fish
passage entrance and exit areas. Both tailwater andforebay rating curves are required for a wide range of
flows (if available) for fishway design. The difference
between upstream and downstream water surface el-
evations at the entrance and exit is the total change in
head that the feature must be designed for. Structural
head is a major determinant in how much flow will
likely be diverted into the fishway. Completing stream
hydraulics analyses and determining the range of op-
erational flows for a passage facility begin the design
of the actual fishway.
Concrete fishways and ladders
Fishways and ladders provide migrating fish with
upstream passage around or through fish passage bar-
riers. The general function of a fish passage facility is
to attract fish into the structure and step them up the
gradient created by the barrier to a point upstream,
where they exit the ladder into the river and resume
migration. The following section contains criteria,
equations, and schematics related to designing con-
crete fishways and ladders (fig. TS14N–4).
General overview
Fishways and ladders are constructed in many differ-
ent configurations from a range of materials. Common
variations include:
• excavated, earthen channels artificially rough-
ened with large rocks
• seminatural channels equipped with stair-
stepped resting pools held in place with rocks,
logs, or stoplogs
• concrete and/or metal structures that slow
water velocity enough to provide upstream pas-
sage
These structures are designed to function across a
range of flows and are often built at fish passage barri-
ers with excessive drops or velocities. Many fishways
and ladders in common use today are pool-forming
structures.
Pool-forming fishways are usually constructed with
concrete, metal, or dimensional lumber and can be
designed to take all, or part, of the total streamflow.
Partial-flow fishways are more difficult to design than
full-flow fishways constructed across the entire chan-
nel. To divert only a portion of the flow, a water con-
trol structure must be included at the top (the fishway
exit from a fish’s viewpoint), that provides a perma-
nent, relatively maintenance free water supply into the
fishway. Pool and weir or orifice fishways are often de-
signed with stoplogs or gates to allow adjustments to
pool depth according to streamflow. Although fishways
are usually more difficult to maintain proper move-
ment of bed load and debris, they can be installed on
gradients up to 10 percent.
Pool-forming fishways function similarly to natural
step-pools formed by logs, rocks, or bedrock outcrops
along natural stream reaches. Flows down a relatively
steep channel can be governed by weirs, slots, or other
restrictions that hold back part of the flow and cre-
ate resting pools. Since fish are supplied resting pools
along the fishway, structural length is generally not a
concern.

7/21/2019 7372 Fish Pass Design
http://slidepdf.com/reader/full/7372-fish-pass-design 21/56
TS14N–15(210–VI–NEH, August 2007)
Part 654
National Engineering Handbook
Fish Passage and Screening DesignTechnical Supplement 14N
Figure TS14N–4 Plan view of a generalized concrete ladder fish passage facility
Longitudinal profile Cross sectionQhf
Qlf
Concrete ladder
Entrance
Diversion dam
Exit
Irrigation diversion
Flow control gate
Flow direction
Qhf
Single weir Compositeweir
Weir withorfice
Vertical slot
Qlf

7/21/2019 7372 Fish Pass Design
http://slidepdf.com/reader/full/7372-fish-pass-design 22/56
Part 654
National Engineering Handbook
Fish Passage and Screening DesignTechnical Supplement 14N
TS14N–16 (210–VI–NEH, August 2007)
Two common pool-forming fishways are pool and
weir/orifice. Commonly referred to as fish ladders,
the resting pool depth in these structures is set by theheight of channel-spanning weirs or headwalls (fig.
TS14N–5 modified from Orsborn (1985)). Water flows
over the top of a weir (pool and weir), or through a
submerged orifice (pool and orifice), depending on
flow rate. These structures are designed for fish that
are able to jump over obstacles (pool and weir), or for
nonleaping fishes, through submerged orifices at low
flows. Water generally flows directly from pool to pool
(rather than in a zigzag direction) to minimize energy
expenditures on migrating fish. Pool and weir/orifice
fishways can take many forms, but are generally useful
at gradients up to 10 percent.
For juvenile and small-bodied adults, pools should
be spaced no further than 15 feet with a drop of no
more than 9 inches across pools. Pool spacing can be
increased to 20 feet and head differential to 12 inches
for adult fish.
Another type of fish ladder is a vertical slot. These
structures are usually a rectangular channel made of
concrete or metal in which a series of regularly spaced
metal or concrete panels are installed perpendicular to
the flow (fig. TS14N–6 modified from Orsborn (1985)).
Each panel has a narrow slot from top to bottom and
is designed to work with low velocities. Water spills
from chamber to chamber through vertical slots, and
pools are formed as the flowing water is backed up
at each slot opening. Pool depth and velocity in each
chamber are determined by slot width and the quantity
of water flowing down the fishway. Although vertical
slot fishways can be designed to pass a wide variety of
fish species over a significant flow range, they are less
passable for fish that tend to follow or cling to walls or
jump over weirs. The pools of a vertical slot fishway
are hydraulically complex and do not supply resting
areas as tranquil as a pool and weir/orifice ladder.
Consequently, these structures must be set at a lowgradient to pass weak-swimming fish, although they
will pass strong swimming fish at relative steep slopes.
The vertical slot fish ladder transports bed material ef-
ficiently, but is susceptible to debris blockages at each
of the vertical slots.
Weirs, orifices and gates (flow controls)
Weirs, orifices, and gates are found throughout fish passage design features. The following section de-scribes general equations and resources for evaluatingflow through weirs, orifices, and gates. Specific bio-logical considerations for the main components of thefish passage feature including the entrance, ladder, andexit follow in the next section.
General weir flow and orifice flow equations are typi-cally in the form of equations TS14N–2 and TS14N–3and are illustrated in figures TS14N–7 and TS14N–8,respectively. Many references provide additional in-formation and ranges of discharge coefficients for the
many types of weirs, orifices, gates, and flow condi-tions. Although orifice and gate equations are derivedfrom the same general equation, the current fish pas-sage design practice is to include orifices with weirs.
A few of the references listed below provide theoryand calculations for weir and orifice flow. In addition,example solutions to weir and orifice flow equationsare found at the end of this technical supplement.
• U.S. Department of Interior, Bureau of Recla-mation Water Measurement Manual, 2001
http://www.usbr.gov/pmts/hydraulics_lab/pubs/
wmm/wmm.html
• U.S. Department of Interior, Bureau of Recla-mation Design of Small Canal Structures, 1978
http://www.usbr.gov/pmts/hydraulics_lab/pubs/
manuals/SmallCanals.pdf
• International Institute for Land Reclamationand Improvement, Discharge MeasurementStructures, 1978
• ISCO Open Channel Flow Measurement Hand-book, 1989 (Grant and Dawson 1989)
Equation TS14N–2 is the general form of a weir equa-tion and can be used to estimate discharge, given wa-
ter surface elevation and weir height, or back-calculatewater surface elevations by rearranging the equationto solve for head on the weir (fig. TS14N–7).
Q C LHd= 1 5. (eq. TS14N–2)
where:Q = flow rate (ft3 /s)C
d= coefficient of discharge
L = weir length (ft)H = head above the weir crest (not including veloc-
ity head) (ft)

7/21/2019 7372 Fish Pass Design
http://slidepdf.com/reader/full/7372-fish-pass-design 23/56
TS14N–17(210–VI–NEH, August 2007)
Part 654
National Engineering Handbook
Fish Passage and Screening DesignTechnical Supplement 14N
Figure TS14N–5 Cross section and profile views of a pool and weir/orifice fishway
Wc
d=pool depth
Oh=orifice height
Baffle wall
B=pool width
dw
=depth over weir H
p=head
between pools
L=equals length
Slope
Crest profile
Flow
θ
θ=Orifice baffle wall angle
Cross section
Profile
Ow=orificewidth
Wc=weir crest length
X

7/21/2019 7372 Fish Pass Design
http://slidepdf.com/reader/full/7372-fish-pass-design 24/56
Part 654
National Engineering Handbook
Fish Passage and Screening DesignTechnical Supplement 14N
TS14N–18 (210–VI–NEH, August 2007)
Flow
L=pool
length
Ws=widthof slot
d=depthof pool
B=pool width
Hf=Heightfloor sill
Plan view
End view
Figure TS14N–6 Plan and end views of a vertical slotfishway
Figure TS14N–7 Weir schematic
L
Water surface
H
Side view Front view
Figure TS14N–8 Orifice (gate) schematic
A o-area of openingWater surface
∆h
Side view Front view
Once the discharge or water surface elevations are
determined, a back check should be performed, using
equation TS14N–3, to ensure that velocity over theweir does not exceed the burst swimming speed of the
target fish.
V Q
L Hweir =
0 67. (TS14N–3)
where:
V = velocity (ft/s)
Equation TS14N–4 is the general form of an orifice
equation and can be used to estimate discharge, given
water surface elevation and orifice dimensions (fig.
TS14N–8).
Q kA g ho= ( )20 5∆ . (eq. TS14N–4)
where:Q = flow rate (ft3 /s)
k = flow coefficient (function of opening size and
shape)
A o = area of opening (ft2)
g = acceleration due to gravity (ft/s2)
∆h = head differential (ft)
Again, once the discharge or water surface elevations
are determined, a back check should be performed,
using equation TS14N–5, to ensure that velocity over
the weir does not exceed burst swimming speed of the
target fish.
V Q
A o= (eq. TS14N–5)

7/21/2019 7372 Fish Pass Design
http://slidepdf.com/reader/full/7372-fish-pass-design 25/56
TS14N–19(210–VI–NEH, August 2007)
Part 654
National Engineering Handbook
Fish Passage and Screening DesignTechnical Supplement 14N
Figure TS14N–10 D number parameters for evaluating hydraulic jump geometry of a vertical drop spillway
Aerated
h
q C
B
A
D=q 2
gh3
y p
y2
Ld L j
yl
yo
Figure TS14N–9 Plunging and streaming flow
Plunging flow Streaming flow
Orifice
Concrete ladder pools
A final step in designing a concrete ladder system isto evaluate pool size. Pool volume should provideadequate capacity and depth to dissipate hydraulicenergy, maintain stable flow, provide room for fish toaccelerate and jump, and space to meet fish run capac-ity. Hydraulic capacity provides adequate energy dis-sipation so that stable, plunging flow occurs throughthe pool. If the pool is undersized, flow instabilitiescan occur in the form of surges, water fluctuations, orheavy turbulence. Pool size and shape should be con-figured so that fish have adequate room to accelerateand burst through openings or leap over weirs. Finally,fish capacity may be a consideration where fish runs
are large enough to potentially overload the system. An overloaded fish ladder forces fish to hold in a queueuntil the structure can be passed. Overloaded fishwayscan cause significant adverse delays and should beminimized as part of the design process.
The hydraulic analysis for determining pool designconfiguration involves a detailed assessment of hy-
draulic jump characteristics. Ideally, the downstreamweir is established at a height and length from theupstream weir, so that the hydraulic drop has plungingflow conditions with a fully submerged jump and nostreaming flow conditions (fig. TS14N–9 (Bates 1992)).
Chow (1959) provides a method for evaluating hydrau-lic jump characteristics of a vertical drop (fig. TS14N–10). The general approach is to first evaluate theunsubmerged jump condition (eqs. TS14N–6 throughTS14N–13), and then set the downstream weir at aheight and length that forces a submerged hydraulic
jump. For fish passage design, the jump is submerged
by establishing the downstream weir height above thesequent depth (y2). Downstream weir location is then
set a distance beyond the drop and hydraulic jumplengths (L
d+L
j) to develop plunging flow.

7/21/2019 7372 Fish Pass Design
http://slidepdf.com/reader/full/7372-fish-pass-design 26/56
Part 654
National Engineering Handbook
Fish Passage and Screening DesignTechnical Supplement 14N
TS14N–20 (210–VI–NEH, August 2007)
The drop number (D) is determined using equationTS14N–6.
D q gh
=2
3 (eq. TS14N–6)
where:D = drop number, dimensionlessq = unit discharge (ft2 /s)g = gravitational constant (ft/s2)
h = drop height (ft)
Once the drop number is determined, equations
TS14N–7, TS14N–8, and TS14N–9 are used to evaluate
initial jump height (y1), final jump height (y
2), and drop
length (Ld).
y hD1 0 4250 54= . . (eq. TS14N–7)
y hD20 271 66= . . (eq. TS14N–8)
L hDd = 4 3 0 27. . (eq. TS14N–9)
The final step is to determine the jump length (L j) us-
ing equations TS14N–10 through TS14N–13 (Krochin
1961).
y
yFr 2
1120 5 1 8 1= + −
. (eq. TS14N–10)
Fr V
gy
11
1
= (eq. TS14N–11)
V Q
Ly1
1
= (eq. TS14N–12)
L y j = β 2 (eq. TS14N–13)
where:
Fr = Froude number, dimensionless
V 1 = velocity at the start of the jump (ft/s)
Q = discharge (ft3 /s)
L = weir length (ft)β = jump length coefficient
The jump height coefficient can be determined through
empirical values shown in table TS14N–6 (Department
of Interior Bureau of Reclamation 1984).
The next step in design is checking to ensure that the
weir system is not washed out with streaming type
flows and that the plunging flow condition exists (fig.
TS14N–9) (Bates 1992; Rajaratnum, Katopodis, and
Lodewyk 1988). Rajaratnum developed techniques for
evaluating plunging and streaming flows using the
following scaling equations. For plunging flows, the
dimensionless discharge (Q*) is approximately 0.61.
Equation TS14N–14 is solved for the dimensionless
discharge of plunging flow.
gL h* =
2 3 (eq. TS14N–14)
where:
Q* = dimensionless discharge
Q = discharge (ft3 /s)
g = gravitational acceleration (ft/s2)
L = length of weir (ft)
h = head across weir (ft)
Another approach to determine weir flow character-
istics is to check the streaming flow condition. For
streaming flows, equation TS14N–15 is used to deter-mine the dimensionless discharge. If the streaming
flow condition exists, modifications to weir and pool
configurations are recommended to force plunging
flow conditions and provide satisfactory fish passage
hydraulics.
gSL h* =
2 3 (eq. TS14N–15)
where:
S = slope (ft/ft)
The dimensionless discharge is equal to,
QL
h
pool* .= 0 5 (eq. TS14N–16)
where:
L pool
= length of pool (ft)
h = depth of streaming flow, similar to head
above weir
Table TS14N–6 Jump height coefficient
Channel
slopeFr ≥ 4 4 ≥ Fr ≥ 3 3 ≥ Fr ≥ 2 2 ≥ Fr ≥ 1
0.00 6.15 5.54 4.99 4.49
0.05 5.20 4.68 4.21 3.79
0.10 4.40 3.96 3.56 3.21
0.15 3.85 3.46 3.12 2.81
0.20 3.40 3.06 2.75 2.48
0.25 3.00 2.70 2.43 2.19

7/21/2019 7372 Fish Pass Design
http://slidepdf.com/reader/full/7372-fish-pass-design 27/56
TS14N–21(210–VI–NEH, August 2007)
Part 654
National Engineering Handbook
Fish Passage and Screening DesignTechnical Supplement 14N
A final design check is to evaluate pool volume based
on energy dissipation criteria for the target species.
Excessive turbulence and bubble formation can physically fatigue, injure, or disorient fish transiting
a passage structure. Bates (1992) and WDFW (2003)
suggest using the energy dissipation factor (EDF),
(eq. TS14N–17), to estimate forces acting on fish in a
ladder pool. EDF values greater than 4 foot-pounds
per cubic feet per second for salmon and steelhead
and 3 foot-pounds per cubic feet per second for shad
(Larinier 1990) indicate adverse hydraulics in a ladder
pool. Equation TS14N–17 can be applied to evaluate
energy dissipation in pools less than 10 feet long, with
an average width (for the calculation only) limited by
a 4:1 side expansion from the weir opening, and pool
depth at least 3h and sufficiently deep to submerge anyhydraulic jump (Chow 1959).
EDFQh
V =
γ (eq. TS14N–17)
Energy dissipation factor (ft-lb/ft3 /s)
where:
V = volume of the pool (ft3)
γ = unit weight of water (62.4 lb/ft3)
Q = discharge, ft3 /s, through openings or over weirs
h = head (ft)
Entrance and attractors
Fish passage entrance design is a critical element of
any fishway. The primary design goal is to site and
configure the entrance so that it attracts fish into the
passage channel by mimicking the hydraulics and
morphology of natural analogs (waterfalls, cascades,
log overpours). Traditionally, migrating fish seek and
swim towards or alongside stream lines of higher
velocity. Consequently, a fishway entrance must con-
sider natural migration patterns along the river, as well
as turbulence, velocity patterns, and dead spots that
distract fish from entrance attraction flows. Designersshould also account for holding patterns and migra-
tion routes, such as along the bankline of the river,
and place the fish passage entrance proximate to these
features. Field observations should include mapping
flow patterns and velocity vectors to help identify
and prioritize entrance locations. Dam spillways and
penstocks significantly influence hydraulic velocity
fields and affect the performance of the fish passage
entrance. In these settings, it is critical that the fish-
way entrance focuses flow into a jet of higher velocity
water that cleanly penetrates the tailwater and attracts
fish (Bates 1992).
Fish passage entrances can be overflow weirs, orifices,
or vertical slots. Ultimately, fishway entrance design is
a balance between attraction velocity and maximum
head for the fish to swim against, while also account-
ing for behavioral and migration patterns. Additional
fish attractors, including auxiliary flows and pumped
jets of water, are included in some fish passage fea-
tures. However, these hydraulic features can also
distract fish from entering the passage facility at the
right location. Designers should be aware of both at-
tractors and distractions near fish passage entrances
and ensure that all distractions are eliminated from
the entrance area. The following are useful criteria forfishway entrance location and hydraulics:
• The fishway entrance should be at the up-
stream-most point of fish passage adjacent
to a barrier. Do not place fish passage facility
entrances in turbulent areas.
• Provide adequate trashracks.
• Align low-flow entrances perpendicular to
tailwater flow.
• Align high-flow entrances 30 degrees down-
stream off perpendicular to tailwater flow to
help with flow penetration.
• Attraction velocities should be from 4 to 8
feet per second, preferably closer to 8 feet per
second.
• Cross velocities should not exceed 2 feet per
second.
• Auxiliary water velocities should be between
0.5 and 1.0 feet per second when pumped into
the entrance chamber of a fishway.
• Approach flow should be parallel to the axis
of the fishway entrance or at least no greaterthan 30 percent to the axis of the main cur-
rent.
• Design and build fishway entrances to provide
access across changing water surface eleva-
tions such as the tailrace of a hydropower
facility or the low- and high-flow elevations of
a natural stream.
7/21/2019 7372 Fish Pass Design
http://slidepdf.com/reader/full/7372-fish-pass-design 28/56
Part 654
National Engineering Handbook
Fish Passage and Screening DesignTechnical Supplement 14N
TS14N–22 (210–VI–NEH, August 2007)
Exit
The primary design considerations for the fish passageexit are headwater and flow diversion control, mainte-
nance of diversion design discharges during fluctuat-
ing headwater conditions, protection from debris, and
alignment with migration pathways to ensure that fish
find their way upstream from the passage barrier. It is
also important to locate the exit far enough upstream
from the crest of the dam so that fatigued or disori-
ented fish do not fall back downstream. Typically, fish
need to acclimatize and orient themselves to the river
after traveling through the fish passage facility.
Oftentimes, the fishway exit is also used to divert and
regulate streamflow into the passage structure. Gates,stoplogs, tilting weirs, and other combinations of slots
and orifices are often used as flow control devices. The
following list provides useful considerations for fish-
way exit conditions:
• Place exits away from spillways, powerhouse
intakes, or other hydraulic structures that
pose risk of harm to target species.
• Place exits in areas of positive flow to avoid
stagnant, low-quality water.
• Design and build exits with adequate
trashracks.
• Include adequate structural freeboard into a
fishway exit to protect it from flood damage.
• Build the fishway exit so that it can be dewa-
tered for maintenance and inspection.
• The length of the exit channel upstream
should be a minimum of two standard ladder
pools.
Rock fishways
The use of rock weirs and step-pools as fish passage
features is a viable option in stream systems with large
cobble to boulder channel beds. Use of rock emulates
natural step-pool sequences, cascades, riffles, rock
aprons, and log sills that fish naturally migrate past.
They are typically more visually appealing than con-
crete and, in some cases, may be more cost effective
(fig. TS14N–11).
Rock ladders have the same general features (en-
trance, ladder, and exit area) as concrete ladders, and
many of the equations that are applied to designingconcrete ladders can also be used to evaluate rock
ladder performance. However, additional analyses
are required to account for increased energy losses
and turbulence induced from the uneven shape and
placement of boulder and cobble materials. Hydraulic
models should be developed to evaluate water sur-
face profiles through rock ladders, especially when
no structures are included to control flow rates into
the fish passage channel, entrance, and exit areas.
Flow control structures can be incorporated into the
design to limit the amount of flow diverted into the
fish passage channel. If not, the rock fishways must
be designed to withstand a range of flows throughoutthe year, rather than diversions made only during fish
migration seasons. A flow control structure may be
necessary to protect the rock ladder from flood flows
and provide adequate head to diversion facilities at
low-flow conditions.
Much of the information available for designing
step-pool features is related to studies performed on
boulder and rock grade control weirs. These types
of designs can be adapted to meet biological design
criteria for fish passage. A rock ladder has three main
components: a boulder, rock or cobble weir; scour or
plunge pool; and tailwater area (fig. TS14N–12).
Boulder and rock weirs
Special design and analysis considerations are re-
quired when evaluating flow conditions over rock-
weirs, boulder sills, and along step-pool sequences.
Figure TS14N–12 is a schematic of the general ele-
ments associated with a boulder weir-step-pool.
Compared to standard weirs, rock weirs significantly
influence turbulence, resistance, energy losses, and
water surface elevations. Although empirical equations
for standard smooth-crested weirs are good as a first
approximation, several modifications are required tomore accurately evaluate flow hydraulics in boulder
weirs.
Evaluating a boulder weir incorporates hydraulic the-
ory associated with weir length modifications and flow
contractions. Weir length is determined by measuring
and adding together incremental distances between
the boulders (fig. TS14N–13) and adjusting for each of

7/21/2019 7372 Fish Pass Design
http://slidepdf.com/reader/full/7372-fish-pass-design 29/56
TS14N–23(210–VI–NEH, August 2007)
Part 654
National Engineering Handbook
Fish Passage and Screening DesignTechnical Supplement 14N
Figure TS14N–11 Plan view of a generalized roughened rock channel/rock ladder fishway
Qhf
Qlf
Entrance
Exit
Diversion dam
Flow direction
Flow direction
Rock ladder
Irrigation diversion
Longitudal profile
Cross section
Qhf
Qlf
Figure TS14N–12 Boulder weir (plan view)
Boulder weir-step pool
Plan view
Figure TS14N–13 Boulder weir cross section
L1
N1
N2
N3
N4
L2
Qlf

7/21/2019 7372 Fish Pass Design
http://slidepdf.com/reader/full/7372-fish-pass-design 30/56
Part 654
National Engineering Handbook
Fish Passage and Screening DesignTechnical Supplement 14N
TS14N–24 (210–VI–NEH, August 2007)
the side wall contractions. The basic weir equation is
then modified using equation TS14N–18 (Chow 1959).
Q C L NH Hd ii
N
= −( )
∑ 0 1 1 5. .
(eq. TS14N–18)
where:
Li = incremental widths (ft)
N = number of contraction sides
Boulder pools
The next step in evaluating boulder and rock weirs
is to determine scour depth below the drop (fig.
TS14N–14). Scour depth determination should be done
for the highest design discharge expected at the site
location. As an initial estimate, scour depth below thebed of the channel should be equal to the drop height
from the water surface to the bed surface along the
tailwater area. Several scour equations are available,
although the most appropriate are plunge scour func-
tions for vertical drop structures. Equation TS14N–19
(Jager 1939 in Simons and Senturk 1992) is derived
from empirical analyses of scour downstream from
grade control structures.
Y h q
Y
Ds
d=
6 0 25 0 5
90
1
3∆ . . (eq. TS14N–19)
where:
Y s = depth of scour (m)
Y d
= downstream depth of flow (m)
q = unit discharge (m3 /m-s)
D90
= sediment diameter with 90 percent of material
finer (mm)
∆h = difference in head between upstream water
surface and downstream water surface (m)
Step-pool length is the final geometric element evalu-
ated in designing a rock pool feature. Pool length
and volume in boulder weirs is directly related to theEDF described in the previous section (eq. TS14N–17)
and has a similar effect on fish passage success. Pool
length equations from the previous section should be
used as a first estimate. A second method to estimate
pool length involves examining natural step-pool ge-
ometry and spacing in the same river system. The goal
in designing a step-pool feature is to allow the fully
turbulent flow jet to dissipate. Comiti (2003) reports
a range of step-pool lengths based on head, channel
slope, and scour depth listed in equations TS14N–20
and TS14N–21. Ratios in natural systems for pool drop
to scour depth typically range between 1.0 and 2.0 for
slopes greater 15 percent. However, as the slope flat-tens (less than 15%), step lengths to scour hole depth
ratios typically begin to approach 3.0.
For slopes between
0 05 0 50. .< <h
L (eq. TS14N–20)
The drop to scour ratio is
1 0 1 3 0. .< + <Y
h
s (eq. TS14N–21)
Rock sizingThe final design element for step-pool rock ladders
is substrate sizing. Overall, the rock along the ladder
must be designed to withstand the entire range of flow
conditions. Designers should identify a safety range
based on the accuracy of the design hydrology, hy-
draulics, and other site conditions and apply this range
to subsequent rock size estimates. The primary design
elements requiring rock sizing are the weir structure,
plunge pool scour apron, and tailwater area.
Typically, rock weirs are comprised of boulders with
interstitial cobbles. The boulder and rock features
must be sized to withstand the highest expected flow
event and provide openings and passage paths for
fish during the migration period. Forces acting on the
boulder and cobble rock on the weir crest include
drag, lift, weight, and frictional resistance. Structural
rock remains stable and in place, as long as weight
and frictional resistance are greater than drag and lift
forces. Equation TS14N–22 can be used to estimate
minimum rock diameter on a boulder weir crest for
fully turbulent flow over a rough horizontal surface,
Figure TS14N–14 Boulder step-pool profile
Y dY a
Sb
Lstep
h

7/21/2019 7372 Fish Pass Design
http://slidepdf.com/reader/full/7372-fish-pass-design 31/56
TS14N–25(210–VI–NEH, August 2007)
Part 654
National Engineering Handbook
Fish Passage and Screening DesignTechnical Supplement 14N
with completely submerged rock and similar sub-
mergence along both faces of a weir. The major dif-
ficulties in using equation TS14N–22 are estimatingthe friction slope and verifying the assumption that
similar submergence occurs on all sides of the rock.
Friction slope is difficult to determine over a drop, but
an estimate can be made using equation TS14N–9 for
drop length. A general rule of thumb is that the rock
size should be greater than the drop height. Another
general criterion is that the final step-pool at the down-
stream end of a sequence should have a buried armor
layer along the entire length of the step that is simi-
larly sized to the weir and toe protection material.
DH S
G
f
smin
.=
( )( )
−( )
18 0 67
1 (eq. TS14N–22)
where:
Dmin
= minimum boulder median diameter (ft)
H = depth of flow over weir (ft)
Sf = friction slope (ft/ft)
Gs = specific gravity of rock (~ 2.65)
Rock size required along a weir crest can be deter-
mined using equation TS14N–23 when velocity acting
on the weir structure is known (a function of crest
height and the drop into a scour hole area). In addi-
tion, velocity (V 1) can be compared to the rock sizes
shown in table TS14N–7 for guidance (Fischenich2000). Designers are encouraged to perform more
thorough calculations that refine friction slope and en-
ergy losses across the boulder weir and evaluate other
factors affecting rock stability (countersinking rock to
resist hydraulic forces).
Sizing rock for toe protection along the scour hole
across the downstream face of a weir is largely done
according to previously described methods. Rockdiameter can be estimated using equation TS14N–23
(Department of Interior Bureau of Reclamation 1984;
USACE 1994f) and table TS14N–7. In areas subject to
toe scour, the resultant vector should be used with
horizontal and vertical velocity components. In a
step-pool sequence with a flat tailwater bed slope, the
horizontal velocity (V weir
) can be used. If the channel
bed between the scour hole and next weir drop is not
flat, the resultant vector should be used to size the bed
material in the sloped tailwater area.
As a first approximation, the D50
can be assumed to
be one to two times the size of the drop height of thestructure. The velocity (V
1) can be approximated us-
ing equations TS14N–24 and TS14N–25 and equation
TS14N–3 to estimate the weir velocity (V weir
) in the
horizontal plane. Equation TS14N–26 is used to specify
the size gradation of riprap and stone for weir and
scour hole protection areas.
D V
501
2
2 57=
.
(eq. TS14N–23)
where:
D50
= median diameter (in)
V 1 = velocity (ft/s)
V V V weir y12 2= + (eq. TS14N–24)
V g h y = 2 ∆ (eq. TS14N–25)
1 7 2 785
15
. .< <D
D
(eq. TS14N–26)
Exposed bed material in the tailwater area of each
weir pool should be sized using weir velocity (V x) and
equation TS14N–3 solved for the horizontal plane. This
element of the boulder pool sequence provides pro-
tection for the upstream approach of the next down-stream weir.
Rock sizing calculations are addressed in more detail
in NEH654 TS14C, and grade stabilization structures
are described in NEH654 TS14G.
Class nameMediandiameter(in)
Critical velocity(ft/s)
Large boulder >40 19
Medium boulder >20 14
Small boulder >10 10
Large cobble >5 7
Small cobble >2.5 5
Very coarse gravel >1.25 3
Table TS14N–7 Incipient motion thresholds for rocksizes

7/21/2019 7372 Fish Pass Design
http://slidepdf.com/reader/full/7372-fish-pass-design 32/56
Part 654
National Engineering Handbook
Fish Passage and Screening DesignTechnical Supplement 14N
TS14N–26 (210–VI–NEH, August 2007)
Roughened channel fishways
Roughened channel fishways function similarly to
steep, boulder-strewn, cascading stream reaches.
These chutes or flumes contain roughness elements
to break up streamflow and reduce water velocity.
Roughened channels, unlike pool-forming fishways,
do not create deep pools where fish can stop to rest
before jumping or swimming to the next step. Instead,
target species must use prolonged or sustained swim-
ming speed to transit the entire length of the structure,
with minimal or no resting. This same concept makes
a baffled culvert more passable than a corrugated
metal pipe which, in turn, is more passable than any
smooth pipe (see description of culverts in next sec-tion). Roughened channels must be designed with
careful consideration for the swimming capabilities
of target species, and overall fishway length should be
kept to the minimum possible for prevailing site condi-
tions.
Engineered channel
An engineered channel is a roughened waterway that
is an excavated earthen channel or a natural stream
channel lined with a series of boulders that are prop-
erly sized and placed for site streamflow and gradient.
Roughness elements, commonly boulders or concrete
blocks, are anchored in place where streamflows are
high or gradients are steep. At slopes up to about 5
percent, roughness elements can be embedded into a
cobble and gravel streambed; for slopes between five
and 9 percent, they must be anchored into a concrete
channel subgrade. Strategic placement and anchor-
ing of rocks or concrete blocks into modified natural
stream channels can significantly improve passage
conditions. Maximum engineered channel length
depends on the swimming abilities of the target fish.
A boulder and rock weir fishway (or fish ladder) isrequired if site conditions dictate a long engineered
channel that likely exceeds the known swimming abili-
ties of the target species.
Engineered, steepened channels are designed to
survive very high flows, are easily maintained, and
cost less to build than concrete fishways. Guidance
for designing these fishways can be found in previous
chapters. There are no standard empirical methods to
predict passage using this informal method, so they
cannot be built with gradients as steep as roughened-
channel fishways. However, the geometry of natural
analogs in the same stream system (cascades or bed-rock chutes) can provide designers with insight into
structural limitations at a given project site.
Engineered channels have been successfully used in
some Midwestern states to pass warm-water fishes
such as redhorse, walleye, northern pike, and various
minnow and sucker species. Commonly referred to
as rock ramps, these structures have been in use for
several years to provide fish passage at low head dams
(fig. TS14N–15). Rock ramp fishways can also provide
additional protection against undermining from toe
scour caused by water spilling over the face of a dam.
Denil
Made from wood, steel, and/or concrete, a Denil
fishway is a rectangular channel fitted with a series
of symmetrical, closely spaced baffles that redirect
flowing water and allow fish to swim around or over
a barrier (fig. TS14N–16). The figure on right is modi-
fied from Powers et al. (1985). Baffles placed on the
floor or walls of the relatively steep, (10 to 25% slope)
rectangular flume reduce mean flow velocities to
ranges negotiated by migratory fish. Denil laddersgenerally do not have resting areas, although pools
can be included in the design to provide resting areas
or velocity reductions. Further, switchbacks can be
added to minimize the footprint of the structure. When
small-bodied or weaker swimming fish are targeted
for passage, Denil ladders can be built at a shallower
slope with smaller baffles, or closer baffle spacing, to
minimize physiological exertion.
Many different Denil fishway designs are presently in
use. The most common, the plane baffle or standard
Denil fish ladder, is composed of baffles angled up
from the floor at 45 degrees and spaced between 2 and4 feet. Standard Denil ladders are commonly applied at
slopes between 15 and 20 percent. Another frequently
seen approach uses herringbone-patterned baffles
made of thin steel attached only to the bottom of the
flume; the two sides of the channel remain smooth. Al-
though the width of this design is generally not limited,
the maximum applicable slope is about 15 percent.
All Denil ladder applications are susceptible to dam-
age from debris, as well as debris accumulation. They

7/21/2019 7372 Fish Pass Design
http://slidepdf.com/reader/full/7372-fish-pass-design 33/56
TS14N–27(210–VI–NEH, August 2007)
Part 654
National Engineering Handbook
Fish Passage and Screening DesignTechnical Supplement 14N
Figure TS14N–15 (a) North Dam on the Red River of the North (ND) before construction; (b) after construction of anengineered channel fishway
Figure TS14N–16 (a) Site photo; (b) schematic of a common Denil fishway
3.0
1.75
0.5
3.5
2.0
Flow
45º
Cross section Proflile
1.0
(a) (b)
(a) (b)
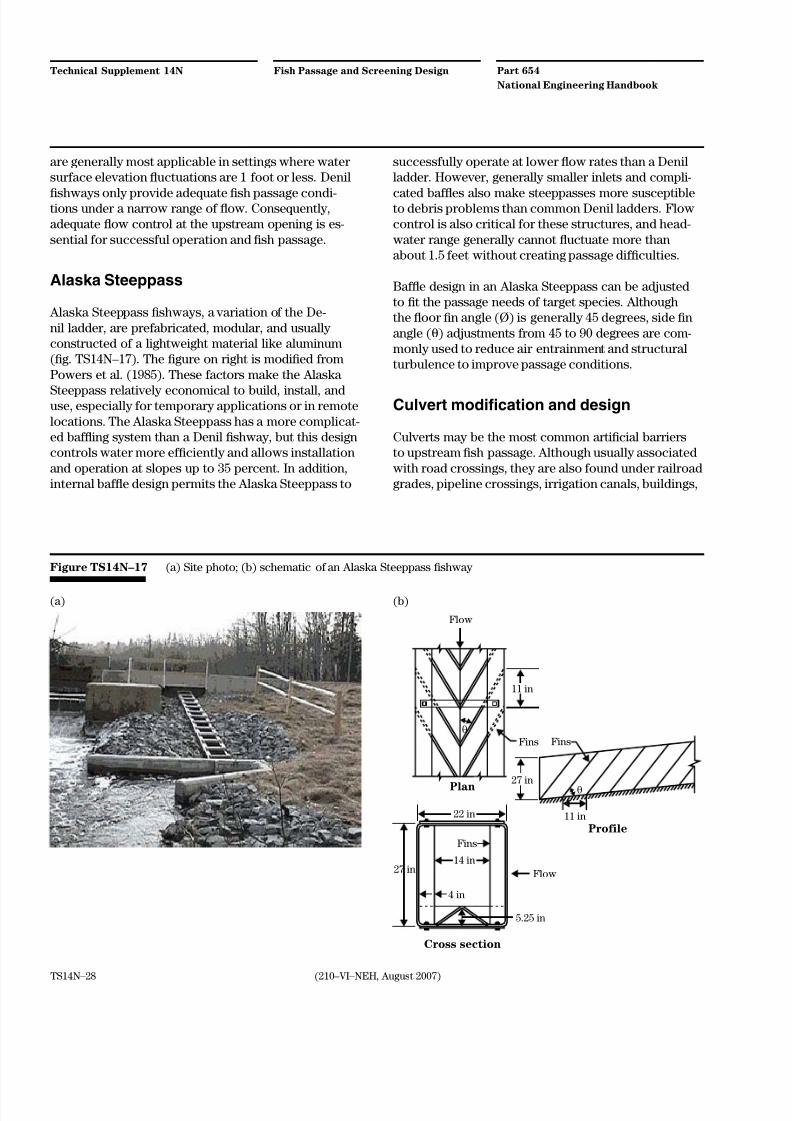
7/21/2019 7372 Fish Pass Design
http://slidepdf.com/reader/full/7372-fish-pass-design 34/56
Part 654
National Engineering Handbook
Fish Passage and Screening DesignTechnical Supplement 14N
TS14N–28 (210–VI–NEH, August 2007)
are generally most applicable in settings where water
surface elevation fluctuations are 1 foot or less. Denil
fishways only provide adequate fish passage condi-tions under a narrow range of flow. Consequently,
adequate flow control at the upstream opening is es-
sential for successful operation and fish passage.
Alaska Steeppass
Alaska Steeppass fishways, a variation of the De-
nil ladder, are prefabricated, modular, and usually
constructed of a lightweight material like aluminum
(fig. TS14N–17). The figure on right is modified from
Powers et al. (1985). These factors make the Alaska
Steeppass relatively economical to build, install, anduse, especially for temporary applications or in remote
locations. The Alaska Steeppass has a more complicat-
ed baffling system than a Denil fishway, but this design
controls water more efficiently and allows installation
and operation at slopes up to 35 percent. In addition,
internal baffle design permits the Alaska Steeppass to
successfully operate at lower flow rates than a Denil
ladder. However, generally smaller inlets and compli-
cated baffles also make steeppasses more susceptibleto debris problems than common Denil ladders. Flow
control is also critical for these structures, and head-
water range generally cannot fluctuate more than
about 1.5 feet without creating passage difficulties.
Baffle design in an Alaska Steeppass can be adjusted
to fit the passage needs of target species. Although
the floor fin angle (Ø) is generally 45 degrees, side fin
angle (θ) adjustments from 45 to 90 degrees are com-
monly used to reduce air entrainment and structural
turbulence to improve passage conditions.
Culvert modification and design
Culverts may be the most common artificial barriers
to upstream fish passage. Although usually associated
with road crossings, they are also found under railroad
grades, pipeline crossings, irrigation canals, buildings,
Figure TS14N–17 (a) Site photo; (b) schematic of an Alaska Steeppass fishway
Flow
11 in
11 in
Profile
Plan
Cross section
27 in
22 in
14 in
4 in
27 inFlow
5.25 in
Fins
Fins
Fins
θ
θ
(a) (b)

7/21/2019 7372 Fish Pass Design
http://slidepdf.com/reader/full/7372-fish-pass-design 35/56
TS14N–29(210–VI–NEH, August 2007)
Part 654
National Engineering Handbook
Fish Passage and Screening DesignTechnical Supplement 14N
and parking lots. Culverts are usually round, rect-
angular, elliptical, flat-bottomed, or bottomless, and
are often made from steel, concrete, or plastic (PVC, ABS). Their interiors can be relatively smooth, but are
often roughened by streambed substrate and/or corru-
gations. Culverts create fish barriers in one or more of
the following ways:
• high velocities or sudden velocity changes at
the inlet or outlet or inside the culvert barrel
• inadequate flow depth in the culvert barrel dur-
ing critical migration periods
• excessive length without adequate resting areas
• significant drop at the culvert outlet
• debris accumulation at the culvert inlet, outlet,
or inside its barrel
• excessive turbulence inside the culvert or at its
outlet or inlet
This section on modifying or installing culverts to
provide fish passage relies heavily on results of fish
passage studies, field applications, and information
published by a team of engineers and biologists from
the Washington State Department of Fish and Wildlife.
Their work, Design of Road Culverts for Fish Passage
(WDFW 2003), is commonly cited in fish passage regu-lations and studies across the United States. The fol-
lowing sections provide a general overview of options
for designing, installing, or modifying new or existing
culverts for fish passage.
Modifications to existing culverts
Generally, an unblocked culvert with an outfall greater
than 0.8 foot, diameter 50 percent of bankfull chan-
nel width or less, and slope greater than 1 percent
should be considered as at least a partial barrier to
migratory fish. Short of replacement, culverts can be
modified in a number of ways to improve fish passage.
For example, perched culverts are usually undersizedand relatively steep, and over time, the channel bed
often drops, leaving the outlet lip many inches or feet
above the water surface elevation of the downstream
pool (fig. TS14N–18). If site conditions allow, fish pas-
sage at a perched culvert can be improved by raising
the culvert outlet pool water surface elevation with a
channel-spanning structure or series of structures (fig.
TS14N–19).
Figure TS14N–18 A significantly perched culvert ( Photocourtesy of Dick Quinn, USFWS,
Newton, MA)
Figure TS14N–19 Series of channel spanning weirs usedto step up water surface and raiseoutlet pool to culvert lip

7/21/2019 7372 Fish Pass Design
http://slidepdf.com/reader/full/7372-fish-pass-design 36/56
Part 654
National Engineering Handbook
Fish Passage and Screening DesignTechnical Supplement 14N
TS14N–30 (210–VI–NEH, August 2007)
Excessive velocity and shallow-flow depths also im-
pede fish passage in existing culverts—this condition
is especially common in concrete box culverts. Retro-fitting a culvert with baffles may improve fish passage
across a range of flows, but only where site conditions
allow. Placing baffles within a culvert may reduce
capacity of the culvert by an unacceptable amount.
Baffles are a series of features that increase hydraulic
roughness inside the barrel of a culvert (fig. TS14N–20
(modified from WDFW (2003); variables shown are
defined in their appendix D)). Unlike hydraulic control
structures (weirs), which independently reduce veloci-
ties, baffles work together to reduce the average cross-
sectional velocity throughout the length of a culvert.
Installing baffles into a culvert should only be consid-ered as a temporary solution to improve fish passage.
Adding baffles reduces hydraulic capacity, generally
increases the risk of failure from flooding conditions,
and makes culverts more prone to capture debris
and bed load. Baffled culverts require maintenance,
so the barrel diameter should allow at least 5 feet of
headroom for crews to safely work inside. Proper and
frequent maintenance of culvert baffles is essential
to ensure that a modification made in the name of
improving fish passage does not result in poorer condi-
tions than existed prior to the retrofit.
Installing baffles alters the hydraulics of a culvert and
requires a good knowledge of the flow characteristics
of the subject stream. Baffles installed near the inlet ofa culvert should be placed at least one culvert diam-
eter downstream at a height that will ensure subcriti-
cal flow at high discharges. Baffle systems like those
shown in figure TS14N–20 should only be installed in
culverts with slopes no greater than 3.5 percent. Cor-
ner baffles are generally used in culverts with slopes
between 1.0 and 2.5 percent and are intended to pro-
vide wall roughness, while minimizing debris blockage
potential (fig. TS14N–21). Notch baffles can be applied
in culverts with slopes between 2.5 and 3.5 percent,
but are designed to function as weirs at slopes greater
than 3.5 percent.
Culvert replacement or installation
Replacing existing culverts or installing new road
crossings can challenge the engineer and fisheries
biologist: a hydraulically efficient culvert often poses
a barrier to fish passage because of the inherent hy-
draulic differences between supercritical and subcriti-
cal flow. Standard culvert hydraulic and structural
analyses apply. Fish passage requires more data to
be considered. However, the three replacement and
installation options described provide approaches that
often balance resource constraints and needs in an
economical manner. Still, culverts may not always pro-
vide adequate fish passage, and other more invasive
L
L
Z1
AngledNotch
Z2
Z0
D
Z
Corner
Figure TS14N–20 Common baffle styles for round andbox culverts
Figure TS14N–21 Round, corrugated metal culvertretrofitted with corner baffles toimprove fish passage

7/21/2019 7372 Fish Pass Design
http://slidepdf.com/reader/full/7372-fish-pass-design 37/56
TS14N–31(210–VI–NEH, August 2007)
Part 654
National Engineering Handbook
Fish Passage and Screening DesignTechnical Supplement 14N
and expensive options such as rerouting a waterway
or building a bridge may require consideration. Road
abandonment can be an option if a culvert barrier tofish passage is along a poorly maintained and/or un-
used road.
The no-slope, stream simulation, and hydraulic design
approaches to culvert replacement and installation are
a mixture of standard methods and new advances in
fish-friendly culvert design. The no-slope and stream
simulation options are favored over the hydraulic de-
sign approach, but project and site-specific conditions
will affect which method and outcome is selected. An
overview flowchart of culvert criteria and a general
design process is presented in figure TS14N–22 (modi-
fied from WDFW (2003)).
No-slope option
The no-slope design approach is founded in the as-
sumption that a sufficiently large culvert installed at
grade will allow the natural movement of bed load
and formation of a stable bed inside the culvert bar-
rel. Maintaining sediment transport continuity and the preservation of a natural channel bed inside the cul-
vert usually provides excellent fish passage conditions
across a range of flows. A no-slope culvert is defined
by the following characteristics:
• width equal to or greater than the average
bankfull channel width where the culvert meets
the channel bed
• relatively flat gradient
• downstream invert is countersunk into the
channel bed by a minimum of 20 percent of the
culvert diameter (or rise, for noncircular cul- verts)
• upstream invert is countersunk into the chan-
nel bed by a maximum of 40 percent of the
culvert diameter (or rise)
Figure TS14N–22 General flowchart of the culvert design process
No slope Hydraulic
WcB=Wch
Zero slope
L × channel slope<.2D
Countersink
Check inlet
bed stability
WcB=1.2 Wch+ 2 ft
Slope up to
1.25 × channel slope
Countersink
Specify bed,
downstream
control
Culvert length
Fish
Fish passage design flow
Maximum velocity:
• size
• slope• roughness
Set elevation:
• countersink at low flow
• match tailwater at high flow
Correct channel profile
Check flood capacity
Final designOr other option
Stream simulation
WcB= Width of culvert bed
Wch= Bankful width of channel
L = Length of culvert
D
= Diameter of culvert

7/21/2019 7372 Fish Pass Design
http://slidepdf.com/reader/full/7372-fish-pass-design 38/56
Part 654
National Engineering Handbook
Fish Passage and Screening DesignTechnical Supplement 14N
TS14N–32 (210–VI–NEH, August 2007)
• upstream and downstream geomorphic insta-
bility (headcuts) is addressed
• adequate flood capacity exists
No-slope culverts are usually constructed where chan-
nel gradient is 3 percent or less, and culvert lengths
are short to moderately long. This approach requires
minimal engineering and surveying, although the fol-
lowing information is mandatory:
• average bankfull width of the undisturbed
channel (new installations and replacements)
• average channel slope (measured along the
thalweg for 20 channel widths upstream and
downstream of the site, especially if a perchedculvert is being replaced)
• elevation of the natural channel bed at the
outlet of an existing culvert (for replacements
only)
• evaluation of headcut potential immediately
upstream of the crossing (for installations and
replacements)
• measures to protect culvert fill during floods
(riprap abutments or concrete wingwalls)
A no-slope culvert can be almost any shape; however,
the streambed at the site must be relatively flat be-
cause the culvert itself will be laid level with at least
20 percent of the culvert height countersunk at the
outlet and with no more than 40 percent embedded
at the inlet (fig. TS14N–23 (modified from WDFW
(2003)). For circular pipes, height is the diameter; for
noncircular (box, pipe arch, elliptical, or bottomless)
culverts, it is the rise.
The diameter (circular pipe) or span (noncircular
pipe) must be a minimum of 1.25 times the average
bankfull width. The average bankfull channel shouldbe derived from three width measurements taken in
naturally straight channel reaches, within 20 chan-
nel widths upstream and downstream of the crossing
or nearest hydraulic control. If an existing culvert is
being replaced, it is important that all stream measure-
ments (slope, width) are collected in reaches isolated
from any hydraulic or geomorphic influences attribut-
able to the culvert or other unique channel constric-
tions. Often, impassable culverts cause the channel
to become wider at the inlet or outlet or to become
incised at the outlet. Further, geomorphic changes
can occur many bankfull channel widths upstream or
downstream from a culvert until the system attainsan equilibrium state or encounters a stable hydraulic
control (boulder debris flow, bedrock outcrop, chan-
nel-spanning dam).
For a given span, box culvert height can be vari-
able, but a pipe arch or elliptical culvert has only
one height. Also, for a given height, a box culvert has
greater hydraulic capacity than either a pipe arch or
a round pipe. Pipe arches may have the least amount
of flow capacity and should be used only for severe
restrictions on fill height. A corrugated steel pipe is the
most commonly used culvert for the no-slope option
because they are less expensive and easier to install
than a box culvert and have more capacity than a pipe
arch or an elliptical culvert. Finally, under the no-slope
option, the acceptable culvert length becomes shorter
as the channel becomes steeper, especially for pipe
arches (table TS14N–8 (developed by Mark Schuller,
NRCS WA)).
Most common round and elliptical culverts are made
from corrugated steel. Larger culverts with wider and
deeper corrugations produce more flow resistance
(friction) and result in slower average water velocities
through the culvert. Slower velocities provide betterfish passage conditions and tend to balance sediment
transport by retaining bed materials within the barrel.
Therefore, for fish passage purposes, bigger, counter-
sunk culverts are always better. As a rule of thumb,
WDFW (2003) suggests that 36 inches should be the
minimum diameter for culverts in fish-bearing streams
less than 30 inches wide.
Figure TS14N–23 No-slope option culvert schematic
3. Downstream countersink 20 percent of rise
2. Culvert bed width equal to channel bed width
1. Culvert level
Therefore limited to S × L less than or equal to 0.2D
4. Upstream countersink of rise maximum

7/21/2019 7372 Fish Pass Design
http://slidepdf.com/reader/full/7372-fish-pass-design 39/56
TS14N–33(210–VI–NEH, August 2007)
Part 654
National Engineering Handbook
Fish Passage and Screening DesignTechnical Supplement 14N
Single, large, noncircular culverts are preferred over
multiple smaller pipes at fill-limited sites because they
provide better fish passage, minimize debris accumu-lations, and are less apt to fail during flood events.
A good rule of thumb for any culvert replacement or
installation is to design the road crossing so that the
outlet velocity is no more than 25 percent greater than
what would have occurred at any given flow without
a culvert in place. In addition, erosion and deposition
upstream of the culvert can be minimized by designing
for less than 1 foot of head loss during a 10-year flood
event. This guideline minimizes backwater effects
upslope of the culvert inlet and decreases downstream
scour caused by head buildup at the inlet and resultant
high velocity outflow at the culvert outlet (fire-hose
effect).
Oversizing a culvert for high flows will improve debris
passage and allow for easier maintenance inside the
barrel. Care should be taken to armor the upstream
and downstream abutments of a newly installed or
replaced culvert. Finally, additional overflow culvertsor hardened dips in the road prism may be necessary
in watersheds that experience significantly high flows
from episodic climatologic events (rain on melting
snow or hurricane-driven rainfall).
Stream simulation option
As the name implies, the stream simulation approach
is used to create or maintain natural stream processes
within the barrel of a culvert. Stream simulation is
based on the assumption that, if fish can easily swim
through a natural channel, they should be able to swim
through a manmade channel that simulates the natural
channel. Generally, stream simulation culverts are bestapplied under the following circumstances:
Table TS14N–8 Maximum lengths for no-slope culverts
Maximum culvert length (ft) hannel slope 2 in= 0 2 1. / / H c
where:
CW = channel bed width (bankfull: ordinary high water: active channel width) (in)
H = (1.25)(CW) = diameter of round pipe or rise of pipe arch (in)
RP = round pipe diameter (in)
PA = pipe arch rise (in)
Note: Shaded areas are culverts at least 40 feet long (typical two-lane road)
Channel and culvert widths
Culvert length per channel slope
(corrugated metal)
Round pipe Pipe arch
CW RP PA 1% 2% 3% 4% 1% 2% 3% 4%
24 30 35×24 50 25 17 13 40 20 13 10
36 45 46×36 75 38 25 19 60 30 20 15
48 60 60×46 100 50 33 25 77 38 26 19
60 75 81×59 125 63 42 31 98 49 33 25
72 90 95×67 150 75 50 38 112 56 37 28
84 105 112×75 175 88 58 44 125 63 42 31
96 120 128×83 200 100 67 50 138 69 46 35
108 135 137×87 225 113 75 56 145 73 48 36
120 150 142×91 250 125 83 63 152 76 51 38

7/21/2019 7372 Fish Pass Design
http://slidepdf.com/reader/full/7372-fish-pass-design 40/56
Part 654
National Engineering Handbook
Fish Passage and Screening DesignTechnical Supplement 14N
TS14N–34 (210–VI–NEH, August 2007)
• complex installations in moderate to high gra-
dient channels
• longer culverts in narrow stream valleys
• culvert bed slopes that will be no more than
125 percent of the upstream channel slope
• locations where passage is required for all spe-
cies (including those for which no swimming or
leaping performance data exist)
• locations where ecological connectivity is of
high importance or where terrestrial animals
are forced to cross the road surface
Applying the stream simulation approach requires
a working knowledge of the stability (both verticaland horizontal) of a prospective work site. The target
stream channel must be stable within a range that can
be accommodated by the planned culvert. Channels
suitable for stream simulation culverts must be in equi-
librium, meaning that the quantity and size of sediment
delivered to the reach is roughly equivalent to the
quantity and size transported out. The target stream
channel must be stable within a range that can be ac-
commodated by the planned culvert, and knowledge
of vertical channel stability is essential. If the down-
stream channel is likely to degrade, the new culvert
must be countersunk deep enough to accommodate
any base level changes. Additionally, downstream
grade controls are necessary to ensure further degra-
dation will not lead to a perched culvert. Conversely,
if the reach is susceptible to aggradation, the culvert
must be sized to accommodate any bed-material
buildup until competent streamflows occur to trans-
port accreted sediments. If the degree of aggradation
or degradation is unknown, additional baseline data
collection or alternative crossings (bridges or large
bottomless arches) should be strongly considered.
Stream simulation culverts are sized wider than the
active channel and filled with a mix of bed materialthat will promote natural sediment transport dynamics
through the road crossing (fig. TS14N–24). Stream sim-
ulation culverts are most often applied at slopes be-
tween 3 percent and 6 percent, although installations
have occurred in gradients up to 8 percent (WDFW
2003). This method requires the largest culverts of
all approaches described (minimum of 6 ft wide) and
involves either placing a bottomless arch (precast
concrete, structural steel plate) over the entire width
of the channel or countersinking an oversized round
culvert or flat-bottomed pipe (pipe arch, precast con-
crete). The most basic stream simulation culvert is abottomless arch placed over an undisturbed natural
channel, allowing the streambed to remain intact and
decreasing chances of geomorphic instability.
Round, corrugated metal or concrete box culverts are
preferred over pipe arches. A round pipe with a diam-
eter roughly equal to a given pipe arch span affords a
greater fill depth for the same bed and crown eleva-
tions, thus providing a vertical erosion buffer before
the pipe bottom is exposed. Costs are very similar, but
assembly and installation of a round pipe is easier than
for a similarly sized pipe arch. Regardless of which
culvert shape is used, it must be sufficiently wide andembedded deep enough (30 to 50% of culvert height)
to allow natural stream processes (scour, deposition,
and thalweg migration) to occur within the enclosed
channel.
Properly embedding a stream simulation culvert raises
the stream channel to the widest part of the pipe and
creates deeper fill which can withstand greater verti-
cal and lateral channel adjustments. The channel bed
within a stream simulation culvert should not exceed
Figure TS14N–24 Undersized perched culvert (left) re- placed with larger pipe designed usingstream simulation option

7/21/2019 7372 Fish Pass Design
http://slidepdf.com/reader/full/7372-fish-pass-design 41/56
TS14N–35(210–VI–NEH, August 2007)
Part 654
National Engineering Handbook
Fish Passage and Screening DesignTechnical Supplement 14N
a slope ratio of 1.25, defined as culvert slope divided
by channel slope. Slope ratios greater than 1.25 require
use of the hydraulic design method.
Stream simulation method culverts are sized according
to the desired culvert bed width. Culvert bed width is
the width of the bed inside the culvert, once the cul-
vert is embedded in the channel (Wcb
), where:
W ftcb = +1 2 2. (bankfull width) (eq. TS14N–27)
Notes:
Circular pipe embedded 30 percent,
culvert diameter = 1.1(Wcb)
Circular pipe embedded 50 percent,
culvert diameter = 1.0(Wcb)Concrete box embedded 30 to 50 percent,
culvert span = 1.0(Wcb)
The preceding equation should be adhered to unless
compelling evidence indicates otherwise. Deviations
could lead to significant consequences, including inlet
contraction scour, and smaller culverts will increase
the chance of adverse outcomes over the design life
of the crossing. If the stream is confined in a relatively
narrow, stable channel, it may be possible to drop the
2-foot constant from the preceding equation. However,
designing for the widest possible culvert helps ensure
that terrestrial wildlife, such as turtles, small furbear-ers, and even deer, are also able to cross under the
road.
Bed configuration within the culvert barrel should be
based on channel composition in reaches adjacent to
the crossing. Figure TS14N–25 illustrates two design
scenarios for culvert bed composition at slopes less
than and greater than about 4 percent. The 4 percent
threshold is based on observations that indicate chan-
nels and culverts in streams with an energy gradient of
4 percent or less tend to have mobile beds at frequent
intervals (WDFW 2003). Streams with gradients higher
than 4 percent tend to have larger substrates arranged
in step-pools or cascades where bed load mobility is
limited except at very high flows.
The major difference between the two scenarios
depicted in figure TS14N–25 (modified from WDFW
2003) concerns substrate composition and arrange-
ment inside the culvert barrel. Culvert beds in streams
with bed slopes shallower than 4 percent should be
composed of native channel material with bands of
larger rock to control grade and channel shape. Rock
bands should be composed of well-graded rock one
to two times D100 (the largest bed particle). The crestof each rock band should be dipped in the middle to
direct the thalweg, and bands should be spaced at the
lesser of five times channel width or as necessary to
provide a vertical difference across adjacent crests
no greater than 0.8 feet. Bands should never be closer
than two channel widths or 25 feet (whichever is less)
from either the inlet or outlet of the culvert.
Culvert beds in streams with bed slopes greater than
4 percent should be composed of native or engineered
material arranged as a monolithic structure where
the largest particles are in contact with each other.
Figure TS14N–25 Low (<4%) and high (>4%) bed slopestream simulation culvert designschematics (Note that culvert slope issimilar to streambed slope)
Well-graded rock bands(D=1 to 2 times bed D100)to control initial shape
Culvert bed width=1.2 channel bed width+2 ft
Bed slope < 4.0%
30−50 percentof culvert rise
Well-graded homogeneousnative streambed sediment mix
Culvert bed width=1.2 channel bed width+2 ft
Bed slope > 4.0%
30−50 percentof culvert rise
Well-graded homogeneousnative streambed sediment mix
Step-pool profile

7/21/2019 7372 Fish Pass Design
http://slidepdf.com/reader/full/7372-fish-pass-design 42/56
Part 654
National Engineering Handbook
Fish Passage and Screening DesignTechnical Supplement 14N
TS14N–36 (210–VI–NEH, August 2007)
This approach forms a network of continuous support
along the whole length of the culvert and depth of the
fill. No grade control within the barrel of the culvert isneeded since channel beds at these gradients are very
coarse and stable.
Stream simulation design culverts are easiest to install
where channel slope and bed material match culvert
slope and bed material. Difficulties often arise as the
slope ratio approaches 1.25, and the designer must pay
special attention to the sizing and arrangement of fill
materials inside the culvert barrel. Under these cir-
cumstances, the designer should adhere to the follow-
ing data collection, analysis, design, and construction
protocol:
• Stringent assessment of site suitability includ-
ing:
— slope
— channel geometry
— channel stability and geomorphic trajectory
— pebble count and subsurface sediment sam-
pling
— hydraulic characteristics of design flows and
depths
• Design sequence
— culvert bed mix composition
— use reference reach, incipient motion, or
paleohydraulic analyses
— intended bed gradation and configuration
(rock bands or homogeneous mix of native
material)
— transitions to adjacent upstream and down-
stream channel reaches
• Construction
— Ensure completed project complies with
design drawings by producing as-built draw-
ings.
Hydraulic design option
Historically, the hydraulic design option (fig. TS14N–26
(modified from WDFW 2003)) has been the standard
engineering method for designing fish passage at
culverts. This design method requires knowledge of
the swimming ability, migration timing, and size of the
target species. Design criteria are usually based on the
swimming abilities or size of the weakest species offish, where known, and usually include rigorous engi-
neering and hydrologic calculations where site-specific
data are unavailable or of inadequate duration. These
culverts are often the most susceptible to future lon-
gevity, function, and maintenance problems because
they are generally smaller than culverts designed by
either the no-slope or stream simulation options. De-
signers should strive to keep culverts designed under
this approach as short as possible because passage
criteria are usually based on the fish’s prolonged swim-
ming speed.
A general design sequence for developing a hydraulicdesign culvert is:
Step 1 Determine culvert length based on road
fill geometry.
Step 2 Determine target species, sizes, migration
timing, and swimming capabilities to calculate
maximum barrel velocities and lengths.
Step 3 Determine design flows at which criteria
from step 2 must be satisfied. For example, WDFW
(2003) suggests using the 10-percent exceedance
flow for adult salmonids of a target species as the
high design flow. For adult passage at low flows,NOAA Fisheries Service (2000) recommends using
the 50 percent annual exceedance flow or 3 cubic
feet per second (whichever is greater), and for
juveniles, the 95 percent annual exceedance flow
or 1 cubic foot per second (whichever is greater).
Figure TS14N–26 Hydraulic design option culvert
schematic
Countersink20 percent of culvertrise (minimum)
Native streambedsediment mix(as habitat)
4Wch (<25 ft)
Culvert width, slope and roughness determinedby parameters based on fish and hydrology

7/21/2019 7372 Fish Pass Design
http://slidepdf.com/reader/full/7372-fish-pass-design 43/56
TS14N–37(210–VI–NEH, August 2007)
Part 654
National Engineering Handbook
Fish Passage and Screening DesignTechnical Supplement 14N
Step 4 Select culvert size, shape, roughness, and
slope that satisfy barrel velocity criteria.
Step 5 Calculate or model hydraulics within theselected culvert to ensure that flow is subcritical
throughout design flow range for fish passage.
Step 6 Determine channel backwater elevation
at culvert outlet throughout design flow range for
fish passage.
Step 7 Set culvert elevation so that low and high
design flows for channel backwater are at least as
high as the water surface in the culvert.
Step 8 Verify that selected culvert will provide
adequate flood-flow capacity.
Step 9 If necessary, adjust channel profile to
match needed culvert elevation.
The hydraulic design process might include iterations
between steps 4 and 9 to arrive at the final design
option that simultaneously considers the hydraulic
effects of culvert size, slope, and configuration against
the physiological requirements of migratory fish. A
hydraulic design culvert should be countersunk at
least 20 percent at the outlet and set at a shallow
grade (<1%). Although stream substrates can settle
out inside the culvert barrel, they are often removed
by subsequent high flows. Finally, low-flow hydrau-lics within culvert corrugations should be considered
where passage is essential for small-bodied or weak
swimming fish.
Some useful hydraulic design analysis tools and refer-
ence literature are available on the Internet. FishXing
(fish crossing) is a system of software and learning
resources specifically aimed at the issue of fish pas-
sage within culverts. This software (including docu-
mentation) downloads an annotated bibliography of
fish passage through culverts, and additional topical
resources can be accessed at:
http://www.stream.fs.fed.us/fishxing/
Tide gates and floodgates
Tide gates and floodgates are usually a pipe or cul-
vert outfitted with a gate (flap) on the outlet end that
allows water to flow in only one direction. They are
usually incorporated into earthen dikes and, in many
cases, include pump stations. Floodgates operate in
nontidal areas to prevent floodwaters from backing
up into smaller tributary streams or drainage ditches.
Tide gates are designed to keep saltwater out of ag-
ricultural fields, drainage ditches, and freshwater
streams that flow into estuary and coastal areas. For
both structures, as long as positive head remains on
the upstream side, the flap remains open and allows
water to drain. When the receiving water body rises(for a floodgate), or when the tide comes in (for a tide
gate), the outlet flap shuts and prevents saltwater or
floodwater from entering the culvert. Pumps may be
necessary to move water over the dike.
Flaps (gates) can be actuated manually, mechanically,
electrically, or (for most flaps) by the difference in
head pressure across the culvert or pipe. Flaps can be
any shape and are usually hinged to either the top or
the side of the culvert outlet. Older gates are usually
composed of heavy steel that do not open very wide
or remain open for extended periods. These factors
significantly diminish passage conditions for migratory
fish. In recent years, fish passage has been improved
by replacing heavy steel flaps with lightweight alumi-
num or plastic flaps (fig. TS14N–27). Aluminum and
plastic tide and floodgates are attractive to landowners
because they open under much lower head differen-
tials, pass debris easier, and have greater conveyance
capacity.
Most dikes associated with floodgates and tide gates
are constructed high enough to hold back drainage
until stage in the receiving water begins to drop and
the flap once again opens. In coastal and estuarinesettings, dike height depends on tidal elevation where
the dike crosses over at the tide gate—the higher the
tidal elevation, the lower the dike. Generally, a flap
opens and drains the freshwater twice in a 24-hour
period. For both tide gates and floodgates, suspended
sediment, floating debris, and bed load tend to settle to
the bottom of the channel when the upstream drainage
is backwatered by a closed flap. When the flap opens
again, some, but not all, of this material is carried
through the culvert and downstream. Consequently, all

7/21/2019 7372 Fish Pass Design
http://slidepdf.com/reader/full/7372-fish-pass-design 44/56
Part 654
National Engineering Handbook
Fish Passage and Screening DesignTechnical Supplement 14N
TS14N–38 (210–VI–NEH, August 2007)
of these channels require periodic dredging and some
form of debris removal.
Generally, a channel reach affected by periodic tide
gate or floodgate closures provides marginal fish habi-
tat. Woody riparian vegetation is difficult to establish
and maintain along these channel reaches because of
frequent inundation by salt and freshwater. In addi-
tion, adjacent landowners discourage brush and tree
growth that could plug the gates with woody debris.
A branch that becomes wedged in the flap can al-
low saltwater to move far up the freshwater channel,
damaging crops and affecting municipal and livestock
water supplies. If a floodgate fails, acres of farmland,
as well as flood plain infrastructure, can be damaged.
However, the negative impacts to fish and wildlife maybe minimal.
Estuarine tide gates can cause long-term negative im-
pacts to fish and wildlife, not when they fail, but while
they are functioning as designed. Estuaries are by far
the most biologically productive ecosystem in the
world and are defined as marine areas partly enclosed
by land (a bay) that receive freshwater runoff from up-
lands. When this outlet is restricted, freshwater mixes
with trapped saltwater and creates an area interme-
diate between freshwater and saltwater (brackish).
Estuaries are critically important nurseries for juvenile
marine fish, as well as numerous invertebrates such as
crabs, lobsters, clams, and oysters. The yearly death
and regeneration of marine plants, coupled with a
constant flushing of detritus and other materials fromincoming streams, forms the basis of this estuarine
food web. In addition to the rich production of marine
plants and animals, an entire community of terres-
trial predators and herbivores, including waterfowl,
shorebirds, raptors, furbearers, and marine mammals,
creates a productive, diverse ecosystem.
Tide gates can be partial or complete barriers to migra-
tory fish passage. However, their greatest negative im-
pacts are related to the severe ecological changes they
cause to the estuary. Tide gates and their associated
dikes are often set well below the high-tide line. Con-
sequently, they create a distinct demarcation betweenfreshwater uplands and saltwater intertidal habitat,
destroying the gradual change between freshwater and
marine habitats. Plants and invertebrates found only
in estuarine environments disappear and salt marshes
are replaced with well-drained uplands that are usu-
ally managed for agricultural crops or pasture. Salt
marshes on the outside of the dikes become mud flats.
Shallow beaches, formed and maintained by the high-
est tides and conditioned by long exposures to air and
freshwater precipitation, become uplands. Further,
tide gates allow mixing of freshwater and saltwater
only twice per day, rather than 24 hours per day.
Figure TS14N–27 Improved fish passage
(a) Two 1,800-lb steel tide gate flaps created a partial pas-sage barrier for several fish species and age groups.
(b) Two 100-lb aluminum replacement flaps provide moreefficient fish passage.
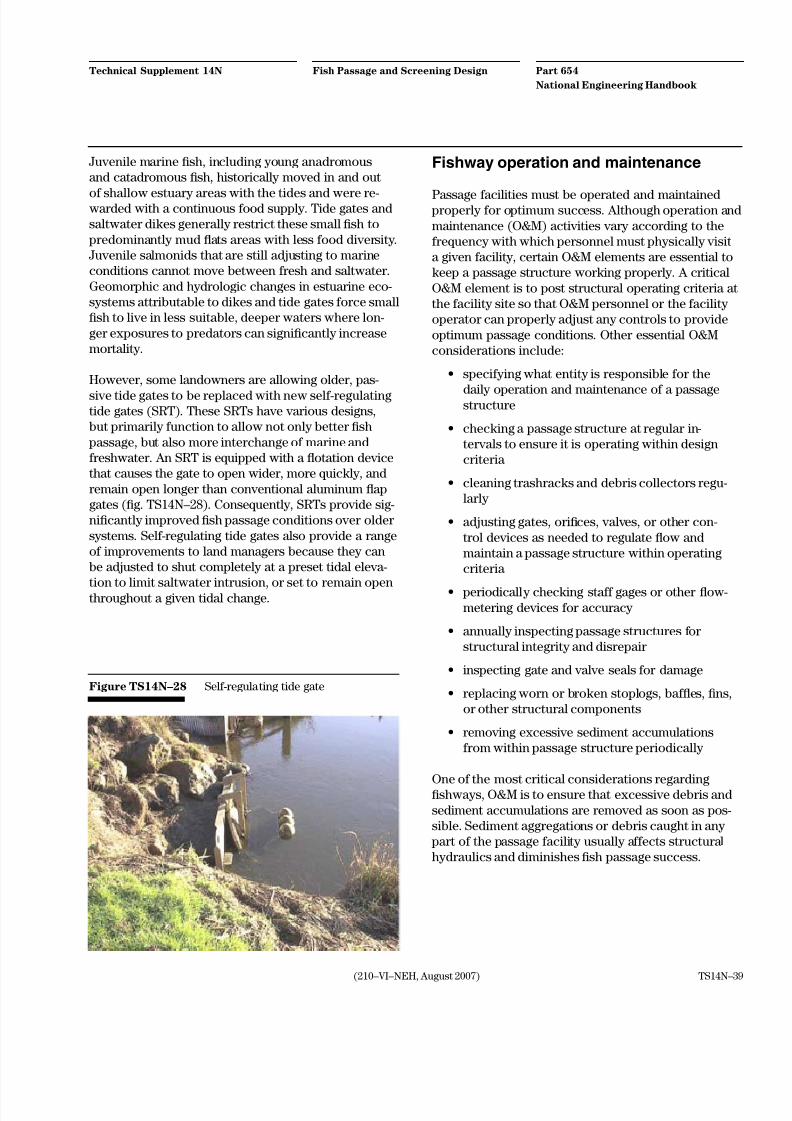
7/21/2019 7372 Fish Pass Design
http://slidepdf.com/reader/full/7372-fish-pass-design 45/56
TS14N–39(210–VI–NEH, August 2007)
Part 654
National Engineering Handbook
Fish Passage and Screening DesignTechnical Supplement 14N
Juvenile marine fish, including young anadromous
and catadromous fish, historically moved in and out
of shallow estuary areas with the tides and were re-warded with a continuous food supply. Tide gates and
saltwater dikes generally restrict these small fish to
predominantly mud flats areas with less food diversity.
Juvenile salmonids that are still adjusting to marine
conditions cannot move between fresh and saltwater.
Geomorphic and hydrologic changes in estuarine eco-
systems attributable to dikes and tide gates force small
fish to live in less suitable, deeper waters where lon-
ger exposures to predators can significantly increase
mortality.
However, some landowners are allowing older, pas-
sive tide gates to be replaced with new self-regulatingtide gates (SRT). These SRTs have various designs,
but primarily function to allow not only better fish
passage, but also more interchange of marine and
freshwater. An SRT is equipped with a flotation device
that causes the gate to open wider, more quickly, and
remain open longer than conventional aluminum flap
gates (fig. TS14N–28). Consequently, SRTs provide sig-
nificantly improved fish passage conditions over older
systems. Self-regulating tide gates also provide a range
of improvements to land managers because they can
be adjusted to shut completely at a preset tidal eleva-
tion to limit saltwater intrusion, or set to remain open
throughout a given tidal change.
Fishway operation and maintenance
Passage facilities must be operated and maintained properly for optimum success. Although operation and
maintenance (O&M) activities vary according to the
frequency with which personnel must physically visit
a given facility, certain O&M elements are essential to
keep a passage structure working properly. A critical
O&M element is to post structural operating criteria at
the facility site so that O&M personnel or the facility
operator can properly adjust any controls to provide
optimum passage conditions. Other essential O&M
considerations include:
• specifying what entity is responsible for the
daily operation and maintenance of a passagestructure
• checking a passage structure at regular in-
tervals to ensure it is operating within design
criteria
• cleaning trashracks and debris collectors regu-
larly
• adjusting gates, orifices, valves, or other con-
trol devices as needed to regulate flow and
maintain a passage structure within operating
criteria
• periodically checking staff gages or other flow-metering devices for accuracy
• annually inspecting passage structures for
structural integrity and disrepair
• inspecting gate and valve seals for damage
• replacing worn or broken stoplogs, baffles, fins,
or other structural components
• removing excessive sediment accumulations
from within passage structure periodically
One of the most critical considerations regardingfishways, O&M is to ensure that excessive debris and
sediment accumulations are removed as soon as pos-
sible. Sediment aggregations or debris caught in any
part of the passage facility usually affects structural
hydraulics and diminishes fish passage success.
Figure TS14N–28 Self-regulating tide gate

7/21/2019 7372 Fish Pass Design
http://slidepdf.com/reader/full/7372-fish-pass-design 46/56
Part 654
National Engineering Handbook
Fish Passage and Screening DesignTechnical Supplement 14N
TS14N–40 (210–VI–NEH, August 2007)
Fish screen design
Fish screens preclude adult and juvenile fish fromentering flow diversion structures, pump intakes,
diversion channels, pipes, or penstocks. Although
most screening facilities are designed to exclude
juvenile fish from entrainment into diversions, pumps,
or penstocks, adult screens can be constructed for the
same reasons or to discourage false attraction into
dead-end watercourses. Fish screens are often located
at the inlet of a gravity diversion or attached directly
to pump intakes. Most gravity diversion screens are
configured with a bypass system to direct fish back to
their stream of origin, especially if the screening struc-
ture is any distance down a diversion canal or ditch
(fig. TS14N–29).
Fish screen biological design criteria
Fish screens are designed to limit mortality and injury
to fish, while precluding entry into a water diversion
structure or pump intake. Considerations required
when designing a fish screen include (adapted from
Nordlund 1997).
• preventing physical contact with the screen
• eliminating impingement onto the screen
• eliminating entrainment through the screen
mesh
• maximizing bypass design to conduct fish
quickly back to their stream of origin
• minimizing predation in the screen forebay,
bypass pipe, and outfall
• managing for debris accumulations in bypass
pipes, head gates, or trashracks
• minimizing excessive delay of fish due to poor
hydraulic guidance conditions
Biological design criteria and site considerations are
necessary when identifying appropriate screen loca-
tion, type, and design. Required criteria include the
Figure TS14N–29 Potential fish screen configurations and locations
Concrete ladder
Diversion dam
Irrigation diversion
Flow direction
Inlet screen location
Bypass screen location
Bypass/return channel

7/21/2019 7372 Fish Pass Design
http://slidepdf.com/reader/full/7372-fish-pass-design 47/56
TS14N–41(210–VI–NEH, August 2007)
Part 654
National Engineering Handbook
Fish Passage and Screening DesignTechnical Supplement 14N
swimming and leaping capabilities of target speciesand any site-specific attractors and distractions that
may affect screen function. Screen hydraulics thatinfluence swimming capabilities of juvenile fish aresweeping and approach velocities, water tempera-tures, body size, swim durations, and dissolved oxygenlevels. Behavioral characteristics that affect juvenilemigration can vary considerably and may includedesire to move downstream and reluctance to entersmall bypasses. These considerations and criteriashould guide biologists and designers throughout thescreen design process. Once biological design criteriaare identified, a designer should evaluate several hy-draulic characteristics of the diversion to evaluate the
potential for fish entrainment or attraction.
Certain aspects of fish screen design criteria are nowwell understood for some species (such as maximumapproach velocity, sweeping velocities, and minimummesh opening), but data for many species are lacking.Further, years of operation and research on generalscreen types has produced a set of useful design guide-lines. For example, NOAA Fisheries Service (1995) hasdeveloped fish screening criteria for salmonids andsuggests the following criteria for protecting juveniles:
• Approach velocity should be no more than 0.40feet per second for active screens and 0.20 feet
per second for passive screens. Active screens
are juvenile fish screens equipped with auto-matic cleaning systems. Passive screens haveno cleaning mechanisms. Approach velocity isflow diversion rate divided by effective screenarea, where effective screen area is equal tomaximum flow diversion divided by allowableapproach velocity.
• For rotating drum screens, submergenceshould not exceed 85 percent nor be less than65 percent of the screen diameter. Submer-gence greater than 85 percent significantlyincreases the possibility fish will be entrainedover the screen and the chance fish will be
impinged without entrainment. Submergingrotating screens less than 65 percent reducesself-cleaning capabilities.
• Screens longer than 6 feet should be angled,with sweeping velocity greater than approach
velocity. Optimal sweeping velocities are be-tween 0.8 and 3 feet per second.
• All screens should be designed to provide uni-form flow across the screen surface.
Fish screen typesSeveral types of fish screens are available to the de-
signer. Each functions under different flow conditionsand diversion configurations and require varying op-eration and maintenance requirements. The followingsections describe most of the typical fish screens inuse today (Nordlund 1997).
Vertical fixed plate screen—The vertical fixed platescreen is a perforated metal plate acting as a physicalbarrier with no moving or mechanical parts. It can beused for domestic industrial water supply and agricul-tural irrigation diversions and can be placed along thebank of a river, thereby eliminating the need for a by-
pass channel. This screen type requires manual clean-
ing and debris removal, and many designs incorporatean accessible trash rack in front of the screen (WDFW2000b). Design of the structure should include practi-cal considerations for debris removal and cleaningoperations (fig. TS14N–30 (WDFW 2000b)). In additionto the standard vertical alignment, these screens canbe angled upstream, downstream, inclined, or declinedas needed to fit site geometry and design hydraulics.
Vertical traveling screen— A vertical traveling screenis similar to the vertical fixed plate screen, except thatthe screen media rotates on a conveyor that automati-cally cleans the structure by moving debris down-stream into a ditch or canal (fig. TS14N–31 (WDFW2000b)). Vertical traveling screens are commonly usedfor pump intakes and can be installed in deep water.These screens require a power source (electric hook-up, solar panels, paddlewheel) to rotate the screenand function properly. Vertical traveling screens canreduce the amount of manual maintenance and screencleaning required at a facility, but these screens aremore difficult to install and properly seal than fixedscreen designs. Originally, panel or belt-type travel-ing screens were designed for debris management at
pump stations. Although outfitting traveling panelswith adequate screen media will protect fish fromentrainment, designers should provide detailed design
specifications wherever these screens are planned forinstallation and operation (WDFW 2000b).
Rotary drum screens—Rotary drum screens are veryeffective in screening juvenile fish and are perhaps
the most common screening technology in use across
the Pacific Northwest (fig. TS14N–32 (WDFW 2000b)).
Rotary screens are usually installed at gravity diver-
sions and have been applied singularly or in multiples
in canals sized for diversion rates from a few to thou-

7/21/2019 7372 Fish Pass Design
http://slidepdf.com/reader/full/7372-fish-pass-design 48/56
Part 654
National Engineering Handbook
Fish Passage and Screening DesignTechnical Supplement 14N
TS14N–42 (210–VI–NEH, August 2007)
Figure TS14N–31 Vertical traveling screen
S c r e e n t
r a v e l
Driver mechanism
Jet spraynozzlesystem
Chain drive
Walkway
Screen panels(baskets)
Debristrough
Motor
F l o w F lo w
Figure TS14N–30 Vertical fixed plate screen
Flow
Plan
Trashrack
Fish bypass pipe to river
Screen
Flow
Flow
Section
W.S.
Screen panel
Baffle panel
Headwall
Walkway
W.S.
Brushtrolley
Brushassembly

7/21/2019 7372 Fish Pass Design
http://slidepdf.com/reader/full/7372-fish-pass-design 49/56
TS14N–43(210–VI–NEH, August 2007)
Part 654
National Engineering Handbook
Fish Passage and Screening DesignTechnical Supplement 14N
Figure TS14N–32 Rotary drum screen
Electric motor and gear reducer enclosure
Drum internalframework
Seal(frame toconcrete)Solid end plate
both ends
Seals -ends and bottom(frame to mesh)
Pier
Screen mesh Frame
Flow
Flow
Isometric view
R o t a t i on
sands of cubic feet per second. These screens are com- prised of a rotating cylinder with a mesh surface. As
the cylinder rotates, it carries debris over the screenwhere it washes or falls off the backside of the screeninto a diversion canal or ditch.
Rotary screens generally have less cleaning andmaintenance requirements than a fixed or moving
vertical plate screen, but side and bottom seals mustbe regularly inspected and replaced to ensure a fishtight facility. Each rotary drum is driven by a motor ormechanized propulsion system (commonly, a paddlewheel, turned by the flowing water), so an adjacent
power supply is necessary. Drum seals, drive motors,bearings, and gears often wear out, so long-term main-
tenance and equipment costs can be a factor. Rotarydrum screens only operate under a relatively narrowrange of water surface fluctuations, so site hydraulicsmust be well defined prior to selecting this design op-tion (WDFW 2000b).
Pump intake screens—Pump intake screens aredesigned to protect fish from being sucked into theend of an intake pipe. Pump screens are generally
designed as box or cylindrical chamber composed ofwire mesh (fig. TS14N–33). These screens are usu-
ally fully submerged and are cleaned with an air jetor hydraulic flushing system. Pump screens are usedin a wide range of applications from small irrigation
pump diversions to large scale domestic and industrialwater supply intakes. A primary disadvantage of pumpscreen installations is that the system is completelysubmerged (making it harder to inspect or repair),backflush systems may not always operate as intend-ed, and expensive cleaning and maintenance routinesmay be required.
Numerous manufacturers offer off-the-shelf pumpintake screens for applications where intakes are
sized for 5 cubic feet per second or less. As with otherscreening facilities, pump screens should be designedto minimize the potential for fish impingement andinjury on screen media while pumps are operating.
Infiltration galleries—Infiltration galleries can beused as a natural approach to pump or diversionintake design. Water infiltrates riverbed substrate,which acts as the fish screen, into a system of perfo-
Figure TS14N–33 Pump intake screens
Cylindrical intake

7/21/2019 7372 Fish Pass Design
http://slidepdf.com/reader/full/7372-fish-pass-design 50/56
Part 654
National Engineering Handbook
Fish Passage and Screening DesignTechnical Supplement 14N
TS14N–44 (210–VI–NEH, August 2007)
rated pipe (fig. TS14N–34 (WDFW 2000b)). Infiltration
galleries can be used for both pump and gravity diver-
sions and have been installed for domestic, industrial,and agricultural water supplies. The key to installing
an infiltration gallery is properly locating the system
at a stable river section with no deposition of fines
and sands to clog the filter fabric around the infiltra-
tion pipes. Typically, these locations are along higher
gradient riffles or in deep pools that scour frequently.
In general, infiltration galleries have higher failure
risks because of clogging from debris and sediment.
Further, clogged systems can incur high maintenance
costs and require invasive instream construction meth-
ods to uncover system components buried beneath
river substrates.
Several additional screen types are available to the
designer and include modified horizontal plate and in-
clined plane configurations. The reader is encouraged
to consult WDFW (2000b) at the following Web site for
additional details and design criteria:
http://wdfw.wa.gov/hab/ahg/screen51.pdf
Screen design approach
When designing a screen, the primary objectives are tomeet diversion requirements; minimize trapping, injury
and harm to fish; and minimize cost, maintenance and
repair. The size of the screen is ultimately a function
of diversion requirements, screen opening size, and
fish swimming capabilities. The following section de-
scribes a simplistic approach for screen design.
Screen mesh sizing
Screen mesh size is the opening in the screen face ma-
terial (fig. TS14N–35). Screen openings can be round,
square, rectangular, or any combination thereof. A
variety of screen mesh materials are available to the
designer and regional or local criteria may be devel-oped for target species. The designer should consult
local fish and wildlife agency for more information.
Screen media should be smaller than the smallest
life stage of the smallest target species present at the
project site. An example of screen mesh size require-
ments based on testing results for screen openings
for fry-sized salmonids adopted by NOAA Fisheries is
presented in table TS14N–9. These openings represent
the minimum screen opening dimension in the narrow-
est direction (Nordlund 1997; WDFW 2000b).
A primary screen parameter in evaluating screendesign is the relationship between screen mesh size
(A opening
) and the overall area of the screen (A screen
). For
the purposes of this handbook, the ratio between the
screen mesh size and the overall screen area is called
the screen size ratio (eq. TS14N–28 (WDFW 2000b)).
Screen size ratio varies depending on the type of
screen materials specified for the project and target
species.
A A
A
openings
screen
% = (TS14N–28)
Fish screen sizing (length and height)The next step in designing the screen is determining
the overall size (area) needed for the screen. The over-
all size is a function of the necessary flow diversion
rate, screen size ratio, approach and sweeping veloci-
ties, and head losses through the screen. The general
size of the screen is determined using the following
steps.
Infiltration gallery
Figure TS14N–34 Infiltration gallery

7/21/2019 7372 Fish Pass Design
http://slidepdf.com/reader/full/7372-fish-pass-design 51/56
TS14N–45(210–VI–NEH, August 2007)
Part 654
National Engineering Handbook
Fish Passage and Screening DesignTechnical Supplement 14N
Table TS14N–9 Examples of screen materials forfry-sized salmonids <60mm (minimum27% open area)
Woven wire screen 3/32 in = 0.09375 in = 2.38 mm
Perforated plate screen 3/32 in = 0.09375 in = 2.38 mm
Profile bar screen 0.0689 in = 1.75 mm
Figure TS14N–35 Fish screen wire and mesh configura-tions
Woven wire mesh
Perforated plate
Profile wire
Profile wire
Backing bar
Figure TS14N–36 Sweeping and approach velocities
Flow
Drumscreens
Fish bypass
V a
V s
V a: Approach velocity
V s : Sweeping velocity
V : True water velocity
V
θ
Step 1 Determining velocities
Approach velocity is the velocity perpendicu-
lar to the screen that can impinge fish upon thescreen and injure or kill the fish. Sweep velocity
is the velocity parallel to the screen that sweeps
fish off the face of the screen and directs them
into the bypass structure. Approach and sweep-
ing velocities are dependent upon diversion flow
rate and the angle of fish screen alignment (fig.
TS14N–36 (WDFW 2000b)). The sweeping veloc-
ity should always exceed the approach velocity so
that fish are swept off the face of the screen. For
lateral diversions on the riverbank, the approach
velocity is negligible, whereas screens in bypass
channels must be placed at an angle along the
channel to ensure that sweeping velocity is largerthan approach velocity (eqs. TS14N–29 through
TS14N–31). In short, screens must be designed for
orientations that ensure sweep velocity is larger
than approach velocity.
1 < V
V
sweep
approach
(eq. TS14N–29)
V V sweep = cosθ (eq. TS14N–30)
V V approach = sinθ
(eq. TS14N–31)

7/21/2019 7372 Fish Pass Design
http://slidepdf.com/reader/full/7372-fish-pass-design 52/56
Part 654
National Engineering Handbook
Fish Passage and Screening DesignTechnical Supplement 14N
TS14N–46 (210–VI–NEH, August 2007)
where:
V = channel velocity (ft/s)
V sweep = lateral velocity along the face of thescreen (ft/s)
V approach = velocity along the approach angle, per-
pendicular velocity normal to the face of
the screen (ft/s)
θ = angle between the direction of channel
flow and the screen (approach velocity
and the sweep velocity)
Step 2 Screen dimensions
The next step is to determine the area of screen
opening to meet diversion requirements. This is an
iterative process, whereby the designer estimates
the area of the screen that will provide adequateflow into the diversion. Head losses are calcu-
lated and the area estimate is revised until the
flow-diversion rate criteria are met. Final screen
height and length are determined at the end of an
iterative process to calculate flow diversion and
required screen opening (eqs. TS14N–32 through
TS14N–34).
The equation for flow through an orifice is the iterative
design analysis.
Q CA g hscreen= ( )20 5∆ .
(eq. TS14N–32)
Head loss (∆h) can be estimated using the following
equation.
∆hg
Q
CA screen
=
1
2
2
(eq. TS14N–33)
where:
Q = diversion discharge (ft3 /s)
g = gravitational acceleration (ft/s2)
C = loss coefficient for fine-meshed screens
(0.6 for fine-meshed screens (Colorado
School of Mines 2004))
A screen
= estimated screen area to meet diversion
requirements
A xyA screen = % (eq. TS14N–34)
where:
x = length of screen required to meet diversion
requirements (ft)
y = height of screen, plus head losses, required to
meet diversion requirements (ft)
Bypass design
A fish bypass system is a flow route to transport both juvenile and adult fish from the face of a screen back
to a river. Fish screens placed directly in or on the
banks of a river require no bypass system. Bypass
routes should transport fish back into a river or stream
as quickly as possible, without injury or increased
chance of mortality from predation. Major components
of a fish bypass system include the entrance, transport
conduit, and outfall or exit. Major design consider-
ations for each of these components are summarized.
Bypass entrance
• Orient bypass entrances at the downstreamterminus of a screen face.
• Include additional entrances if sweeping veloci-
ties will not move fish to one within 60 seconds
of encountering the screen face.
• Entrance flow into the bypass system should
always be 10 percent greater than the true wa-
ter velocity approaching it. In screen sites with
complicated or uncertain hydraulics, design
bypass entrance flow to be 25 percent greater
than approaching true water velocity.
• Bypass entrances should extend from the floorto the canal water surface and be a minimum
of 18 inches wide (for diversions greater than 3
ft3 /s) or 12 inches wide (for diversions less than
3 ft3 /s). These widths allow schooling fish to
move through without delay.
Bypass conduit
• All surfaces and joints should be smooth to
reduce the risk of injury to fish.
• Maximum velocity should not exceed 30 feet
per second with no hydraulic jumps. Optimum
pipe velocity is around 6 to 12 feet per second.
• Flow inside the conduit should never be pres-
surized.
• Avoid extreme bends, and ensure that the ratio
of bypass pipe centerline radius of curvature to
pipe diameter (R/D) is greater than or equal to
5. Greater R/D may be required for supercritical
pipe velocities.

7/21/2019 7372 Fish Pass Design
http://slidepdf.com/reader/full/7372-fish-pass-design 53/56
TS14N–47(210–VI–NEH, August 2007)
Part 654
National Engineering Handbook
Fish Passage and Screening DesignTechnical Supplement 14N
• Size bypass conduit to minimize debris block-
age, sediment deposition, and facilitate clean-
ing. Pipe diameter should be 24 inches orgreater, but never less than 10 inches. Equip
pipes longer than 150 feet with access valves.
• Never include closure valves inside a bypass
pipe.
• Minimum depth of free surface flow should be
at least 40 percent of bypass pipe diameter.
Bypass outfall
• Locate bypass exit where ambient river veloc-
ity is greater than 4 feet per second.
• Select an outfall location free of eddies andreverse flow to minimize predation. Require
predator control systems where necessary.
• Ensure that outfall configuration will not direct
fish into the river bottom.
• Design the exit so that the impact velocity of
the outfall nappe or jet will not exceed 25 feet
per second.
Maintenance and operation
Fish screens require periodic maintenance and clean-ing to keep the diversion operational and the screen
functioning properly. Trash racks, mechanical sweeper
arms, manual cleaning, hydraulic flow jets and air-
burst features, backwash systems, and paddle wheels
are used to keep the screen debris free. The designer
should include either a mechanical debris removal
feature or maintenance personnel for clearing the fish
screen as part of a long-term operation and mainte-
nance plan.
Example problem: Preliminary design forfish passage
An irrigation district has been informed by a local fish
and wildlife agency that a 10-foot-high concrete diver-
sion dam is a fish passage barrier. The recommenda-
tion to the district is to modify the structure to provide
passage for Upper Columbia steelhead that migrate
and spawn between January and May each year. The
preferred plan is to use a historical overflow channel
to construct a permanent, stable, natural-type step-
pool rock ladder around the diversion to provide fish
passage. The plan is to construct a series of 10 boulder
weirs along the fish passage channel which is approxi-mately 200 feet long (20 ft spacing). The channel will
be slightly wider than the weir length.
An analysis of hydrology and hydraulics of the river
and diversion dam provided stage discharge relation-
ship information and helped identify the Qhf
, Qavg, and
Qhf
design discharges for the fish passage channel.
Fish passage will be provided for all design flow condi-
tions. They are:
Qhf
= 100 ft3 /s
Qavg
= 30 ft3 /s
Qlf = 15 ft3 /s
The first step in sizing the weir features is to determine
the general geometry. This is an iterative process. For
the high-flow condition (Qhf
) the weir invert elevation
is set such that there is 2 feet of head (H) on the fish
passage diversion inlet (passage exit). Using equation
TS14N–18, the length of the weir is back calculated.
Q C L NH Hd i
i
N
= −( )
∑ 0 1 1 5. .
where:
Li = incremental widths (ft)N = number of contraction sides (2)
H = head on weir (2 ft)
Cd = coefficient of discharge
= 3.1
English units
100 3 1 0 1 2 2 21 5
ft /s ft ft3 =
− ( )( )( ) ( ). .
.ft
sL
L = 12 ft
For the low-flow condition (Qlf ), the minimum amount
of head (H) on the weirs is selected as 0.7 feet per
guidance on depth requirements for steelhead. The
configuration of the boulder weirs is similar to figure
TS14N–13.
15 3 1 0 1 4 0 7 0 71 5
ft /s ft3 =
− ( )( )( ) ( ). . . ] .
.ft
sL ft
L ≈ 7 ft

7/21/2019 7372 Fish Pass Design
http://slidepdf.com/reader/full/7372-fish-pass-design 54/56
Part 654
National Engineering Handbook
Fish Passage and Screening DesignTechnical Supplement 14N
TS14N–48 (210–VI–NEH, August 2007)
The total low-flow (Qlf ) weir length is on the order of 7
feet for two openings and four contraction walls.
The next step, using equation TS14N–3, is to check the
weir velocity.
V Q
L Hweir =
0 67.where:
V = velocity (ft/s)
L = weir length
V weir hf − =( )( )( )
=100
12 0 67 26 2
ft /s
ft ft ft/s
3
..
V weir hf − = ( ) ( )( ) =15 ft /s
7 ft 7 ft5 ft/s
3
0 674
. ..
Velocities for the (Qhf
) and (Qlf ) are checked against
the swimming abilities of steelhead and are well within
range for the fish (table TS14N–10). The channel veloc-
ity is near the steelhead sustained swim speed, which
indicates that there is room for design modification,
if needed, including narrowing the flow channels and
raising water surface and drop heights.
The next step, using equation TS14N–19, is to estimate
the scour depth below the downstream bed at the toeof the rock weir. Note that the equation uses metric
units.
Y h q Y
Ds
d=
6 0 25 0 5
90
1
3∆ . .
where:
Y s
= depth of scour (m)
Y d = downstream depth of flow (m) = 2 ft = 0.6 mq = unit discharge (m3 /m–s = 100 ft3 /s/12 ft = 8.3
ft2 /s = 0.8 m2 /s)
D90
= sediment diameter with 90% of material finer
(mm = assumed 6-in material = 152.4 mm)
∆h = difference in head between upstream water
surface and downstream water surface includ-
ing velocity (m = 1 ft = 0.3 m)
Y s = ( ) ( )
= =6 0 3 0 80 6
152 40 6 2 0
0 25 0 5
1
3. .
.
.. .
. . m ft
The next step, using equations TS14N–20 and
TS14N–21, is to check the assumed step length anddrop to scour ratio to see if they are similar to those
found in natural systems.
For slopes between 0 05 0 50. .< <h
L
0 051
200 50. .< <
ft
ft
Check, spacing could be moved
closer together and shorten reach
overall.
The drop to scour ratio is 1 0 1 3 0. .< + <Y
h
s
1 0 1 3 0. .< + <2.0 ft
1 ft
Check.
The final steps are sizing the rock material for the
weir crest, scour hole toe protection, and downstream
tailwater area.
The weir and scour velocity (V 1) is determined using
equations TS14N–25 and TS14N–24.
V g h y = 2 ∆
V y = ( )( ) =2 32 2 1 8 0. .ft/s ft ft/s
V V V weir y1
2 2= +
V 12 2
6 2 8 0 10 1= ( ) + ( ) =. . .ft/s ft/s ft/s
Evaluating table TS14N–10 and equation TS14N–23
indicates that the rock size on the weir should be
approximately 1 to 2 feet in diameter. These values
compare well with the general rule that the rock size
Species
Sustained
speed
Cruising
speed
Burst
speed
Maximum
jump height
ft/s m/s ft/s m/s ft/s m/s ft m
Steelhead 4.6 1.40 13.7 4.18 26.5 8.08 11.2 3.4
Table TS14N–10 Steelhead swimming design criteria

7/21/2019 7372 Fish Pass Design
http://slidepdf.com/reader/full/7372-fish-pass-design 55/56
TS14N–49(210–VI–NEH, August 2007)
Part 654
National Engineering Handbook
Fish Passage and Screening DesignTechnical Supplement 14N
should be larger than the drop height of 1 foot. A selec-
tion of 2-foot-diameter material for weir and scour
pool area protection is recommended. In addition, thissize material should also be laid as a subsurface armor
layer along the entire length of the furthest down-
stream step and tailwater area to provide a keystone
grade control feature for the entire channel.
D V
501
2
2 57=
.
D50
210 1
2 5715 4=
=.
..
ft/s ft
The final rock size estimate is for the bed material
along the tailwater area using equation TS14N–3
in conjunction with a modified version of equation
TS14N–23 and cross-checking with table TS14N–10. All
approaches indicate that the tailout material should
be composed of large cobbles greater than 5 inches in
diameter. The following approach is appropriate if the
downstream tailwater area has a flat bed slope; other-
wise, the resultant velocity vector including the verti-
cal direction must be used.
V weir =
( )( )( )
=100
12 0 67 2
6 2
.
. ft/s
D50
26 2
2 575 8 0 5=
= =
.
.. .
ft/s in ft

7/21/2019 7372 Fish Pass Design
http://slidepdf.com/reader/full/7372-fish-pass-design 56/56