7355347 valuation ratios
TRANSCRIPT

7/29/2019 7355347 Valuation Ratios
http://slidepdf.com/reader/full/7355347-valuation-ratios 1/136
Integrated Financial Management Oct 24, 20081
Financial Statement Analysis for Modeling

7/29/2019 7355347 Valuation Ratios
http://slidepdf.com/reader/full/7355347-valuation-ratios 2/136
Integrated Financial Management Oct 24, 20082
Financial Statement Analysis Contents
• Overview and objective of financial statement analysis
• Review and Re-formatting Statements for Financial Model
Income Statement – EBITDA and NOPLAT
Cash Flow Statement - Free Cash Flow and Equity Cash Flow
• Financial ratio analysis
Management Performance
Valuation
Credit Analysis
Financial Model Drivers
• Reference
Financial Ratio Calculations
Discussion of Economic Profit

7/29/2019 7355347 Valuation Ratios
http://slidepdf.com/reader/full/7355347-valuation-ratios 3/136
Integrated Financial Management Oct 24, 20083
Financial Statement Analysis - Introduction
• Corporate models involve making a projection of the financial statements
of a company or a segment of a company.
• You should be comfortable in reading various different financial
statements to be effective at financial modeling and financial analysis.
• Financial statement analysis is also important in:
Assessing management performance of a company and whether projections of improvement or sustainability are reasonable.
Assessing the value of a company from historic performance.
Assessing the reasonableness of financial projections provided by acompany or the validity of earnings projections
Assessing whether the financial structure of a company is of investment grade quality

7/29/2019 7355347 Valuation Ratios
http://slidepdf.com/reader/full/7355347-valuation-ratios 4/136
Integrated Financial Management Oct 24, 20084
Objectives of Financial Statement Analysis
• Financial Statement Analysis is Like Detective Work – How can we use
information in financial statements to make assessments of various issue:
How can we quickly review the income statement, balance sheetand cash flow statement to determine how the stock market value of a company compares to inherent value.
How can we look the financial statements and assess risksassociated with a company and whether the company has sufficientcash flow to pay off debt.
Finance and valuation are about projecting the future -- how canfinancial statement analysis be used in making projections.
The problem in any financial analysis and valuation is thatmeasuring risk is very difficult

7/29/2019 7355347 Valuation Ratios
http://slidepdf.com/reader/full/7355347-valuation-ratios 5/136
Integrated Financial Management Oct 24, 20085
Financial Statement Analysis and Financial Projections
• In corporate models, financial performance is measured and value is assessed
with various financial ratios. Some of the uses of financial ratios in assessing
corporate models include:
Relate financial ratios to economic drivers in making financial forecasts
Use financial ratios to determine whether management is generating
economic profit – compute ROIC and growth to examine sustainability.
Evaluate the sustainability of economic profit over the long-term in financialmodels – attempt to gather 10 years of data to find trends.
Assess the potential for growth in economic profit – ROIC less WACC
Value the equity of the company relative to the stock price
Review the credit quality of the firm with financial ratios

7/29/2019 7355347 Valuation Ratios
http://slidepdf.com/reader/full/7355347-valuation-ratios 6/136
Integrated Financial Management Oct 24, 20086
Double Counting and Judgments in Financial Ratio Analysis
• In analyzing financial statements judgments must be made in computing key datasuch as EBITDA and in developing financial ratios.
• Examples
Other Income in or out of EBITDA
If not in EBITDA, then mush add non-consolidated subsidiarycompanies
Exploration Expenses taken out of EBITDA
Make consistent between companies with different accounting policies
Goodwill (ROIC without goodwill)
Minority Interest (Include or exclude income and balance)
Total in EBITDA, must account for minority interest in financing of totalEBITA
Deferred Debit Amortization
• A key principle is that the financial data and the financial ratios are consistent andlogical – work through simple examples

7/29/2019 7355347 Valuation Ratios
http://slidepdf.com/reader/full/7355347-valuation-ratios 7/136Integrated Financial Management Oct 24, 20087
Income Statement

7/29/2019 7355347 Valuation Ratios
http://slidepdf.com/reader/full/7355347-valuation-ratios 8/136Integrated Financial Management Oct 24, 20088
Income Statement
• Review trends in EBITDA, EBIT, EBT and Net Income and explain what ishappening to the company
• EBITDA includes operating earnings and other income, but it does not includeforeign exchange gains or losses, minority interest, extraordinary income or interest income.
EBITDA is a rough proxy for free cash flow
EBITDA is not generally shown on Income Statement
Potential Adjustments for items such as exploration expense
Compare EBIT to Net Assets and Net Capital
• Ratio of EBITDA to Revenues should be shown for historic and projected periods
• EBITDA is related to un-levered cash flow while Net Income and EPS are after leverage
• NOPLAT is computed by EBIT less adjusted taxes, where taxes are computedthrough adjusting income taxes.

7/29/2019 7355347 Valuation Ratios
http://slidepdf.com/reader/full/7355347-valuation-ratios 9/136Integrated Financial Management Oct 24, 20089
Problems with EBITDA
• EBITDA is useful in its simplicity, and can be a good reference for
comparison of debt and value, but it has weaknesses:
EBIT is more important than DA
In credit analysis, EBITDA works better for low rated credits than
high rated credits. (Moody’s)EBITDA is a better measure for companies with long-lived assets
EBITDA can be manipulated through accounting policies (operatingexpenses versus capital expenditures)
EBITDA ignores changes in working capital, does not consider required re-investment, says nothing about the quality of earnings,and it ignores unique attributes of industries.

7/29/2019 7355347 Valuation Ratios
http://slidepdf.com/reader/full/7355347-valuation-ratios 10/136Integrated Financial Management Oct 24, 200810
Simplified Income Statement
• Sales- COGS
• = Gross Margin- SG&A- Other Expenses
• + Other Income
•= EBITDA
• - Depreciation and Amortization
• = EBIT
• - Interest Expense (income)
• = EBT- Income Taxes
• - Minority Interest
• = Net Income
NOPLAT = EBIT x (1-tax rate)
NOPLAT = Net Income + Interest Expense x (1-tax)
There is a debate about how to handle
other income from non-consolidated
subsidiary companies.
One school of thought (McKinsey) is that
they should be valued separately sincethey will have different cost of capital etc.
In this case, do not include in EBITDA
and remove the asset balance from the
invested capital. Must be consistent

7/29/2019 7355347 Valuation Ratios
http://slidepdf.com/reader/full/7355347-valuation-ratios 11/136Integrated Financial Management Oct 24, 200811
Analysis of Income Statement – Computation of EBITDA,
Minority Interest, Preferred Dividends, Exploration Expense

7/29/2019 7355347 Valuation Ratios
http://slidepdf.com/reader/full/7355347-valuation-ratios 12/136Integrated Financial Management Oct 24, 200812
Income Statement Analysis
• Example of Adjustments to EBITDA
Exploration Expenses (EBITDAX)
Rental and Lease Payments (EBITDR)
• EBITDA Computation
Top Down – move other income
Bottom-up (Indirect)
• EBITDA Notes
Interest Income out of EBITDA
Interest Expense not in EBITDA
Understand Non-cash Expenses
Deferred Mining Costs
Equity Income
Minority Interest

7/29/2019 7355347 Valuation Ratios
http://slidepdf.com/reader/full/7355347-valuation-ratios 13/136Integrated Financial Management Oct 24, 200813
Employee Stock Options
• One can debate the treatment of employee stock options for EBITDA,
free cash flow and valuation.
• Think of options as giving stock to employees
If the treatment has changed over the years and it is a significant
expense, make adjustments to current or prior statements for consistency.
Think of options as giving free shares to employees. The value of existing shareholders is diluted.
One can argue that this is two things
First, employees are compensated and the cash should beaccounted for
Second, invested capital is increased and the new equityshould be refelected

7/29/2019 7355347 Valuation Ratios
http://slidepdf.com/reader/full/7355347-valuation-ratios 14/136Integrated Financial Management Oct 24, 200814
Cash Flow Statement

7/29/2019 7355347 Valuation Ratios
http://slidepdf.com/reader/full/7355347-valuation-ratios 15/136Integrated Financial Management Oct 24, 200815
Cash Flow Statement
• Cash Flow has fundamental separation between
Operations
Capital expenditures (to maintain and grow operations) and
Financing
• Operating Cash Flow
Add back items from the income statement that do not use cash(depreciation, dry hole costs etc)
• Analyze how much cash flow the company generated and how it raised funds or
disposed funds
• Use Cash Flow statement as a basis to compute free cash flow although cash flow
not presented on the statement

7/29/2019 7355347 Valuation Ratios
http://slidepdf.com/reader/full/7355347-valuation-ratios 16/136Integrated Financial Management Oct 24, 200816
Cash Flow Statement
• A. Operating Cash Flows
• 1) “Cash Flow from Operations”
• 2) Cash Collections
• 3) Cash Outflows
• 4) Interest & Dividends Received
• 5) Interest Paid
• 6) Taxes
• B. Investing Cash Flows
• 1) “Cash Flow from Investments”
• 2) Cap Ex (Purchases)
• 3) Sale of Property, Plant, & Equipment
• 4) Inter-Corporate Investment
• C. Financing Cash Flows
• 1) “Cash Flow from Financing”
• 2) Dividend Payments
• 3) Proceeds from Equity or Debt Issuance
• 4) Equity Repurchased
• 5) Debt Principal Payments

7/29/2019 7355347 Valuation Ratios
http://slidepdf.com/reader/full/7355347-valuation-ratios 17/136Integrated Financial Management Oct 24, 200817
Cash Flow Statement Example

7/29/2019 7355347 Valuation Ratios
http://slidepdf.com/reader/full/7355347-valuation-ratios 18/136Integrated Financial Management Oct 24, 200818
The Notion of Free Cash Flow
• In practice the term cash flow has many uses. For example, operatingcash flow is net income plus depreciation.
• Free cash flow is the cash flow that is available to investors – FREE of obligations such as capital expenditures and taxes -- to both debt andequity investors – after re-investing in plant, and financing and paying
taxes.• Accountants define cash flow from operations as net income plus
depreciation and other non-cash items less changes in working capital.However, this cash flow is not available for distribution to equity holdersand debt holders. The free cash flow must account for capitalexpenditures, repayments of debt, deferred items and other factors.
• Free cash flow consists of
Cash flow to equity holders
Cash flow to debt holders

7/29/2019 7355347 Valuation Ratios
http://slidepdf.com/reader/full/7355347-valuation-ratios 19/136Integrated Financial Management Oct 24, 200819
Importance of Free Cash Flow
• Alternative Definitions, but one correct concept
Free Cash Flow Is Also Known As Unleveraged Cash Flow
Unleveraged Cash Flow Is Not Distorted By The Capital Structure
Free Cash Flow should not change when the capital structure changes
Free Cash Flow should be the same as equity cash flow if no debt isoutstanding and not cash balances are built up.
• Free Cash Flow in Valuation
PV of Free Cash Flow Defines Enterprise Value
The Relevant Discount Rate Is The Unlevered Discount Rate or theWeighted Average Cost of Capital
IRR on Free Cash Flow is the Project IRR
Free Cash Flow in Economic Value
FCF – Carrying Charge = Economic Profit

7/29/2019 7355347 Valuation Ratios
http://slidepdf.com/reader/full/7355347-valuation-ratios 20/136Integrated Financial Management Oct 24, 200820
Fundamental Distinction in Financial Analysis – Free Cash
Flow and Equity Cash Flow
• Free Cash flow that is independent from financing
Valuation
Performance in managing assets
Claims on free cash flow
Cash flow to pay debt obligations
Comparisons unbiased by capital structure policy
• Equity cash flow
Valuation of equity securities
Performance for shareholders

7/29/2019 7355347 Valuation Ratios
http://slidepdf.com/reader/full/7355347-valuation-ratios 21/136Integrated Financial Management Oct 24, 200821
Cash Flow Statement in Financial Model
• Analysis in Cash Flow Statements
Compute Cash Flow before Financing
Operating Cash Flow minus Capital Expenditures
Use Cash Flow Before Financing in Deriving Free Cash Flow
Equity Cash Flow
Dividends less Cash Investments
Cash Flow Before Financing less Maturities plus New Debt Issues
Last Line on Cash Flow Statement Includes
Change in Cash Balance
Change in Short-term Debt or Overdrafts
Beginning Balance + Change = Ending Cash
Beginning Balance of STD + Change = Ending Short-term Debt

7/29/2019 7355347 Valuation Ratios
http://slidepdf.com/reader/full/7355347-valuation-ratios 22/136Integrated Financial Management Oct 24, 200822
Free Cash Flow Formulas
• Free cash flow can be computed from the income statement or from the cash flow statement.
• From the cash flow statement, the formula is:
Cash Before Financing
Plus: Interest Expense
Less: Tax Shield on Interest
• From the income statement, the formula is:
EBITDA
Less: Taxes on EBIT
Less: Working Capital Investment
Less: Capital Expenditures
• From Net Income
Net Income
Add: Net of Tax Interest
Add Depreciation, Deferred Taxes and Other Non-Cash Changes
Less: Changes in Working Capital
Less: Capital Expenditures
Some argue that free cash flow
should not include non-operating
items. Here the non-consolidated
companies are treated in a similar
manner as liquid investments

7/29/2019 7355347 Valuation Ratios
http://slidepdf.com/reader/full/7355347-valuation-ratios 23/136
Integrated Financial Management Oct 24, 200823
Free Cash Flow from NOPLAT
• Free cash flow can be computed using the notion of net operating profit lessadjusted tax as follows (assuming no extraordinary income)
• Step 1: Compute NOPLAT
Net Income
Plus Net Interest after Tax
Plus Deferred tax
Equals NOPLAT
• Step 2: Compute Free Cash Flow
NOPLAT
Plus: Depreciation
Less: Change in Working Capital
Less: Capital Expenditures
Equals Free Cash Flow

7/29/2019 7355347 Valuation Ratios
http://slidepdf.com/reader/full/7355347-valuation-ratios 24/136
Integrated Financial Management Oct 24, 200824
Free Cash Flow Example

7/29/2019 7355347 Valuation Ratios
http://slidepdf.com/reader/full/7355347-valuation-ratios 25/136
Integrated Financial Management Oct 24, 200825
Balance Sheet

7/29/2019 7355347 Valuation Ratios
http://slidepdf.com/reader/full/7355347-valuation-ratios 26/136
Integrated Financial Management Oct 24, 200826
Balance Sheet Issues
• Treat surplus cash as negative debt and debt as negative cash
Rule of thumb – cash is 2% of revenues
Example – when developing a basic cash flow model, group thecash and the debt as one account and then separate this accounton the balance sheet.
Unfunded pension expenses should be treated like debt – theyinvolve a fixed obligation and they can be replaced with debt whenthey are funded.
Deferred taxes depend on the way deferred taxes are modelled for cash flow purposes. If you model future changes in deferred taxesand take account of these in projections, do not put deferred taxesas a component of equity.

7/29/2019 7355347 Valuation Ratios
http://slidepdf.com/reader/full/7355347-valuation-ratios 27/136
Integrated Financial Management Oct 24, 200827
Plant Balances and Retirements
• You can account for capital expenditures by subtracting accounts fromthe balance sheet.
Be careful with retirements
Retirements reduce both the plant balance and the accumulateddepreciation
Accumulated depreciation difference can be compared to thecurrent depreciation expense and the difference is retirement.
The retirements are then use along with plant balance changes toderive the capital expenditures

7/29/2019 7355347 Valuation Ratios
http://slidepdf.com/reader/full/7355347-valuation-ratios 28/136
Integrated Financial Management Oct 24, 200828
Balance Sheet
• Maintains value of assets – from original cost rather than market valueand may be conservative
• Used for base for many financial ratios – debt to capital, depreciation
rates, return on average equity, return on invested capital
• Use to establish the historical analysis and where money was earned andwhere it is spent
• Important as an audit tool in financial modeling
• Total Assets = Total Liabilities + Total Equity

7/29/2019 7355347 Valuation Ratios
http://slidepdf.com/reader/full/7355347-valuation-ratios 29/136
Integrated Financial Management Oct 24, 200829
Balance Sheet Adjustment
• In modeling the balance sheet, a number of adjustments should be madefrom actual balance sheets:
Surplus cash must be separated from other current assets
Short-term debt should be separated from other current liabilities
Current Portion of Long-term Debt should be classified as long-termdebt for reconciliation
Common equity can be aggregated

7/29/2019 7355347 Valuation Ratios
http://slidepdf.com/reader/full/7355347-valuation-ratios 30/136
Integrated Financial Management Oct 24, 200830
Balance Sheet Issues
• Selected Balance Sheet Issues for Financial Analysis
Definition of Capital
Minority Interests
Short-term Debt
Preferred Stock
All Common Equity
Components of Equity Capital
Definition of Book Value per Share
Deferred Debits and Credits

7/29/2019 7355347 Valuation Ratios
http://slidepdf.com/reader/full/7355347-valuation-ratios 31/136
Integrated Financial Management Oct 24, 200831
Balance Sheet
• Total Assets” breaks into:• A. Current Assets
1) Cash & Cash Equivalents2) Marketable Securities
• 3) Accounts Receivable4) Inventories
• B. Fixed Assets1) Net Property Plant and Equipment2) Goodwill (Type 1)3) Other
• “Total Liabilities” breaks into:
• A. Current Liabilities1) Accounts Payable2) Current Portion of Long-Term Debt3) Current Capital Lease Obligation
• B. Long Term Liabilities1) Long-Term Debt2) Capital Leases3) Pension Liabilities4) Others (Deferred Tax Liability, etc)
• “Total Equity” breaks into:• A. Stock
1) Preferred2) Common3) Treasury
• B. Retained Earnings
• C. Other (Translation Gains/Losses, etc)

7/29/2019 7355347 Valuation Ratios
http://slidepdf.com/reader/full/7355347-valuation-ratios 32/136

7/29/2019 7355347 Valuation Ratios
http://slidepdf.com/reader/full/7355347-valuation-ratios 33/136
Integrated Financial Management Oct 24, 200833
Balance Sheet Issues in Modeling
• Compute Debt Balance from Separate Debt Balance
• Understand Deferred Debits and Deferred Credits (for example deferred
compensation or long-term pre-paid expenses)
• Equity Balance from Retained Earnings Statement can be Incorporated in
Statement
• Incorporation of Asset write-ups or write-downs

7/29/2019 7355347 Valuation Ratios
http://slidepdf.com/reader/full/7355347-valuation-ratios 34/136
Integrated Financial Management Oct 24, 200834
Financial Ratio Analysis

7/29/2019 7355347 Valuation Ratios
http://slidepdf.com/reader/full/7355347-valuation-ratios 35/136
Integrated Financial Management Oct 24, 200835
Contents
• Introduction
• Management Performance Ratios
• Valuation Ratios
• Credit Analysis Ratios
7/29/2019 7355347 Valuation Ratios
http://slidepdf.com/reader/full/7355347-valuation-ratios 36/136
Integrated Financial Management Oct 24, 200836
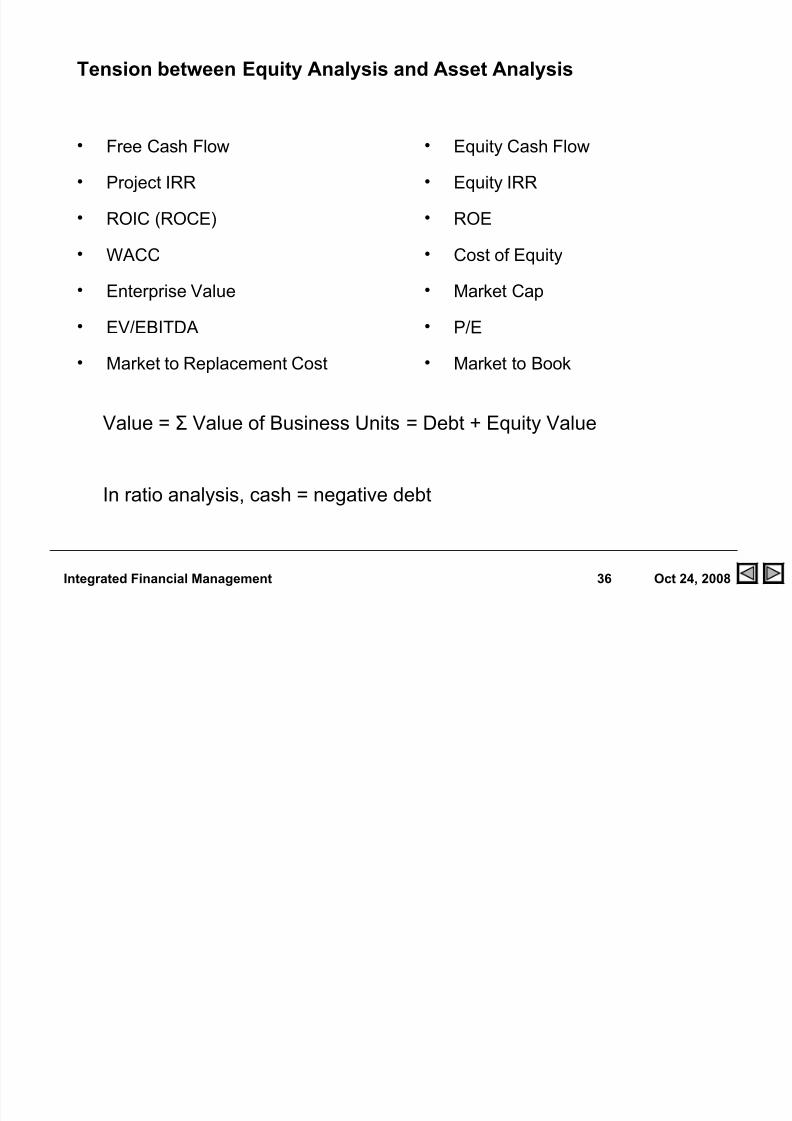
Tension between Equity Analysis and Asset Analysis
• Free Cash Flow
• Project IRR
• ROIC (ROCE)
• WACC
• Enterprise Value
• EV/EBITDA
• Market to Replacement Cost
• Equity Cash Flow
• Equity IRR
• ROE
• Cost of Equity
• Market Cap
• P/E
• Market to Book
Value = Σ Value of Business Units = Debt + Equity Value
In ratio analysis, cash = negative debt

7/29/2019 7355347 Valuation Ratios
http://slidepdf.com/reader/full/7355347-valuation-ratios 37/136
Integrated Financial Management Oct 24, 200837
Financial Ratio Analysis
• Purpose :
Evaluate relation between two or more economically important items (one isthe starting point for further analysis)
Cautions:
Accounting analysis is important (deferred taxes etc.)
• Interpretation is key
What does the P/E mean
Is an interest coverage of 3.5 good
Why is the ROIC low
Should we use MB, PE or EV/EBITDA
• Document financial ratios (numerator and denominator) with footnotes andcomments
• Show components of numerator and denominator in rows above the ratiocalculation

7/29/2019 7355347 Valuation Ratios
http://slidepdf.com/reader/full/7355347-valuation-ratios 38/136
Integrated Financial Management Oct 24, 200838
• Financial Ratios Often Compares Income Statement or Cash Flow with BalanceSheet
In developing ratios, understand why the formula is developed (e.g. other income and other investments in return on invested capital)
• There is Not Necessarily One Single Correct Formula
For example, pre-tax or after-tax return on assets.
Keep the numerator consistent with the denominator
• Financial Ratios should be evaluated in the context of benchmarks
Credit ratios and bond rating standards
Returns and cost of capital
Operating ratios and history
General Discussion of Financial Ratios

7/29/2019 7355347 Valuation Ratios
http://slidepdf.com/reader/full/7355347-valuation-ratios 39/136
Integrated Financial Management Oct 24, 200839
Classes of Financial Ratios
• Management Performance
Ratios that measure the historic economic performance of management andevaluate whether the economic performance can be maintained (e.g. ROIC)
• Valuation
Ratios that are used to give an indication of the value of the company (e.g.
P/E)
• Credit Analysis
Ratios that gauge the credit quality and liquidity of the company (e.g.Interest coverage and current ratio)
• Model Evaluation
Ratios used to evaluate the assumptions and mechanics of financialforecasts

7/29/2019 7355347 Valuation Ratios
http://slidepdf.com/reader/full/7355347-valuation-ratios 40/136
Integrated Financial Management Oct 24, 200840
Ratios that Measure Management
Performance

7/29/2019 7355347 Valuation Ratios
http://slidepdf.com/reader/full/7355347-valuation-ratios 41/136
Integrated Financial Management Oct 24, 200841
• Evaluate Whether Management is Doing a Good Job with Investor Funds (Not if the company is appropriately valued)
Return on Invested Capital
Return on Assets
Return on Equity
Market/Book Ratio
Market Value/Replacement Cost
• Key Issue
Evaluate relative to risk
ROE versus Cost of Equity
ROIC versus WACC
Class 1: Financial Indicators of Management Performance

7/29/2019 7355347 Valuation Ratios
http://slidepdf.com/reader/full/7355347-valuation-ratios 42/136
Integrated Financial Management Oct 24, 200842
Basic Economic Principles, ROIC and Financial Analysis
• When you measure value, you are gauging the ability of a firm to realizeeconomic profit. For example, when you compare the equity IRR with the
equity cost of capital.
• When you assess assumptions in a financial forecast, you must assess
whether economic profit implicit in the assumptions can in fact be
realized. For example, if the financial forecast has a very high ROE, isthat reasonable.
• When you interpret financial statistics, you are gauging the strategy of the
company in terms of whether economic profit is being realized. In
reviewing the return on invested capital, does this demonstrate that the
company has the potential to earn economic profit.

7/29/2019 7355347 Valuation Ratios
http://slidepdf.com/reader/full/7355347-valuation-ratios 43/136
Integrated Financial Management Oct 24, 200843
Return on Invested Capital Analysis
• ROIC is not distorted by the leverage of the company
• ROIC can be used to gauge economic profit and whether the company
should grow operations
• ROIC can be used to assess the reasonableness of projections
For example, if ROIC is very high and the company is in acompetitive business with few barriers to entry, the forecast isprobably not realistic.
• ROIC can be computed on a division basis EBIT and allocation of capital
to divisions from net assets to gauge the profit of parts of the company
• ROIC comes from sustainable competitive advantage and high market
share

7/29/2019 7355347 Valuation Ratios
http://slidepdf.com/reader/full/7355347-valuation-ratios 44/136
Integrated Financial Management Oct 24, 200844
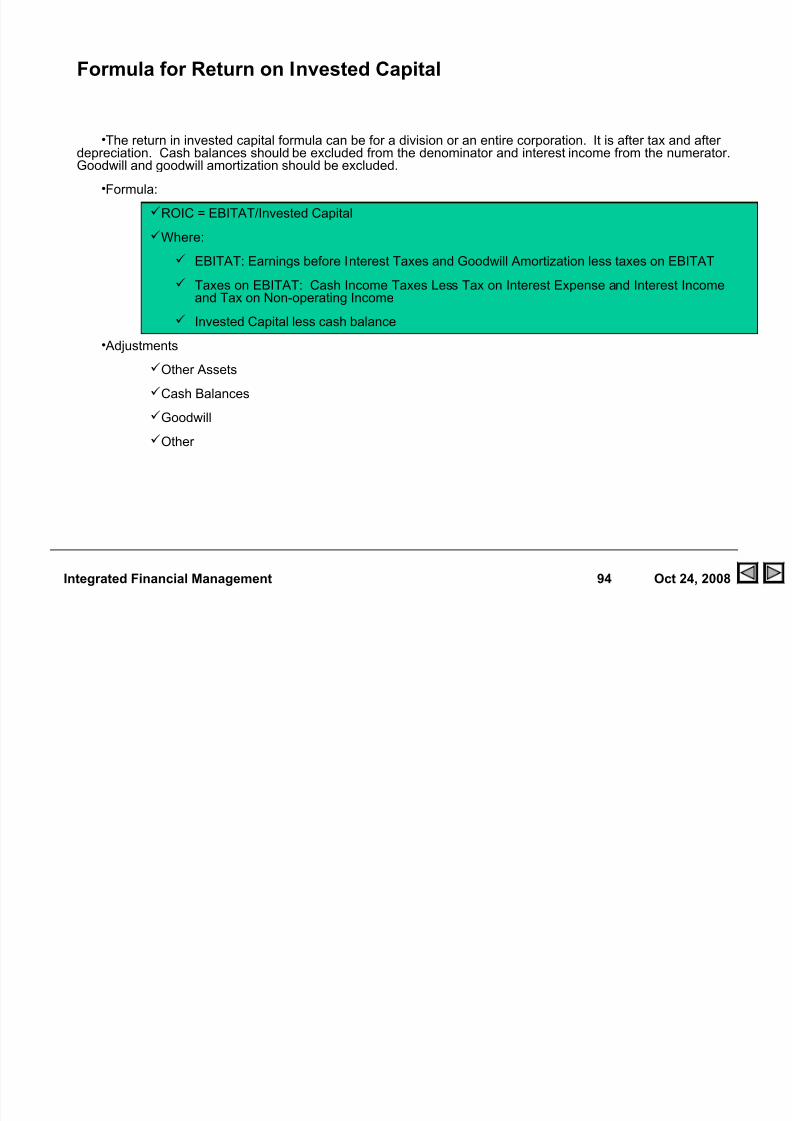
Formula for Return on Invested Capital
• The return in invested capital formula can be for a division or an entire corporation. It is after tax and after depreciation. Cash balances should be excluded from the denominator andinterest income from the numerator. Goodwill and goodwill amortization should be excluded.
• Formula:
ROIC = EBITAT/Invested Capital
Where:
EBITAT: Earnings before Interest Taxes and Goodwill Amortization less taxeson EBITAT
Taxes on EBITAT: Cash Income Taxes Less Tax on Interest Expense andInterest Income and Tax on Non-operating Income
Invested Capital less cash balance
• Adjustments
Other Assets
Cash Balances
Goodwill
Other

7/29/2019 7355347 Valuation Ratios
http://slidepdf.com/reader/full/7355347-valuation-ratios 45/136
Integrated Financial Management Oct 24, 200845
Issues in Management Performance Evaluation
• Basic Formula: ROIC versus WACC How to compute ROIC
NOPLAT/Average Invested Capital
May or may not include goodwill – If goodwill is not included, computeNOPLAT without subtracting goodwill write-off and subtract netgoodwill from invested capital
Reduce the invested capital by surplus cash balances
Some don’t include other income – then the invested capital should bereduced by other investments
Can compute with ratios
EBIT Margin x (1-t) * Asset Turn
Asset Turn = Sales/Assets; EBIT Margin = EBIT/Sales
ROCE vs ROIC
ROCE is generally computed in an indirect way by starting with netincome, and adding net of tax interest and adding minorities

7/29/2019 7355347 Valuation Ratios
http://slidepdf.com/reader/full/7355347-valuation-ratios 46/136
Integrated Financial Management Oct 24, 200846
• Return on average capital employed (ROCE) is a performance measure ratio.From the perspective of the business segments, ROCE is annual business
segment earnings divided by average business segment capital employed
(average of beginning and end-of-year amounts).
• These segment earnings include ExxonMobil’s share of segment earnings of
equity companies, consistent with our capital employed definition, and exclude the
cost of financing.
• The corporation’s total ROCE is net income excluding the after-tax cost of
financing, divided by total corporate average capital employed. The corporation
has consistently applied its ROCE definition for many years and views it as the
best measure of historical capital productivity in our capital intensive long-
term industry, both to evaluate management’s performance and to
demonstrate to shareholders that capital has been used wisely over the long term. Additional measures, which tend to be more cash flow based, are used for
future investment decisions.
Exxon Mobil Return on Average Capital Employed

7/29/2019 7355347 Valuation Ratios
http://slidepdf.com/reader/full/7355347-valuation-ratios 47/136
Integrated Financial Management Oct 24, 200847
Exxon Mobil Return on Capital Employed – Where are they
making expenditures

7/29/2019 7355347 Valuation Ratios
http://slidepdf.com/reader/full/7355347-valuation-ratios 48/136
Integrated Financial Management Oct 24, 200848
Exxon Mobil Return on Capital
Return on average capital employed 2005 2004 2003
-millions of dollars
Net income $ 36,130.00 $ 25,330.00 $ 21,510.00
Financing costs -after tax
Third-party debt (1.00) (137.00) (69.00)
ExxonMobil share of equity companies (144.00) (185.00) (172.00)
All other financing costs – net -1 (295.00) 54.00 1,775.00
Total financing costs (440.00) (268.00) 1,534.00
Earnings excluding financing costs $ 36,570.00 $ 25,598.00 $ 19,976.00
Average capital employed $ 116,961.00 $ 107,339.00 $ 95,373.00
Return on average capital employed – corporate total 31.30 23.80 20.90
“All other financing costs – net” in 2003 includes
interest income (after tax) associated with the
settlement of a U.S. tax dispute.
(1)

7/29/2019 7355347 Valuation Ratios
http://slidepdf.com/reader/full/7355347-valuation-ratios 49/136
Integrated Financial Management Oct 24, 200849
Illustration of Invested Capital Computation

7/29/2019 7355347 Valuation Ratios
http://slidepdf.com/reader/full/7355347-valuation-ratios 50/136
Integrated Financial Management Oct 24, 200850
ROE and ROIC – Note how to compute growth rates from ROE
and Retention

7/29/2019 7355347 Valuation Ratios
http://slidepdf.com/reader/full/7355347-valuation-ratios 51/136
Integrated Financial Management Oct 24, 200851
Example of Return on Capital Employed (Return on Invested Capital)
in Financial Analysis
•The argument has been made that the best measure to evaluate managementperformance that is not distorted by leverage (as in the case of ROE) or has theproblems of ROA is the return on invested capital. An example of use of this ratio isin the Exxon Mobile Merger:
J.P. Morgan reviewed and analyzed the return on capital employed("ROCE") of both Exxon and Mobil since 1993. J.P. Morgan observed thatExxon's ROCE has consistently been 2-3% above that of Mobil.
J.P. Morgan's analysis indicated that if Mobil were to be merged withExxon, the combined entity's capital productivity would eventually behigher than the pro forma capital productivity of Exxon and Mobil.
J.P. Morgan indicated that it would be reasonable to assume that thebenefits of this capital productivity increase would occur within three years of
the closing of the merger.

7/29/2019 7355347 Valuation Ratios
http://slidepdf.com/reader/full/7355347-valuation-ratios 52/136
Integrated Financial Management Oct 24, 200852
Profitability
Gross Margin = Gross profit/ Sales
Less: Operating costs/ Sales
Equals EBIT Margin (EBIT/ Sales)
Asset Utilization
Working Capital/ SalesPlus:
Long-term capital/ Sales
Equals:Capital employed/ Sales
1 divided by Capital Employed/ Sales
Equals: Asset Turnover
(Sales/ Capital Employed)
ROCE(EBIT/ Capital Employed )
Multiplied by
Multiplied by (1 minus Tax Rate)
ROCE(EBIT after Tax/ Capital Employed )
Relationship Between Various Ratios and DuPont Analysis

7/29/2019 7355347 Valuation Ratios
http://slidepdf.com/reader/full/7355347-valuation-ratios 53/136
Integrated Financial Management Oct 24, 200853
Drivers of Value and Free Cash Flow from Financial Ratios
• Revenues
Growth in Revenues
• EBITDA Margin
Multiplied by
• Revenues = EBITDA
• Less: Depreciation Rate
Multiplied by
• Fixed Assets = EBIT
• Fixed Assets = Sales x Sales/Assets (Turnover)
• Ratios Needed: Growth in Revenues, EBITDA Margin, DepreciationRate and Asset Turnover

7/29/2019 7355347 Valuation Ratios
http://slidepdf.com/reader/full/7355347-valuation-ratios 54/136
Integrated Financial Management Oct 24, 200854
Example of Using Ratios to Compute Free Cash Flow

7/29/2019 7355347 Valuation Ratios
http://slidepdf.com/reader/full/7355347-valuation-ratios 55/136
Integrated Financial Management Oct 24, 200855
Class 2: Financial Indicators of Market Value
• Financial Ratios can be used to analyze whether the valuation of a company isappropriate. Analysts should understand the drivers of different ratios. Valuation
Ratios include:
Universal Financial Ratios
Price to Earnings Ratio
Enterprise Value/EBITDA
PEG (P/E to Earnings Growth) Ratio
Market to Book Ratio
Industry Specific Financial Ratios
Value/Reserve
Value/Customer
Value/Plane Seat

7/29/2019 7355347 Valuation Ratios
http://slidepdf.com/reader/full/7355347-valuation-ratios 56/136
Integrated Financial Management Oct 24, 200856
Valuation Ratios and Benchmarks
• Valuation ratios measure the stock market value of a company relative tosome accounting measure such as EPS, EBITDA, Book Value/Share or
growth in EPS
• The ratios can be used as benchmarks in valuing non-traded companies
by using industry average valuation ratios.
• Example to value non-traded company:
Value of company = EPS of Company x Industry Average P/E Ratio
• Valuation ratios will be further discussed in the portion of the course
where corporate models are used to value companies.

7/29/2019 7355347 Valuation Ratios
http://slidepdf.com/reader/full/7355347-valuation-ratios 57/136
Integrated Financial Management Oct 24, 200857
• The P/E Ratio is the most prominent valuation ratio. It is affected by estimatedearnings growth, the ability of a company to earn economic profits and the growthin profitable operations.
• Formula:
Share Price/Earnings per Share
• Issues Trailing Twelve Months and Forward Twelve Months – Generally use
forward EPS
Formula: (1-g/r)/(k-g)
• Problems
Affected by earnings adjustments
Causes too much focus on EPS
Distortions created by financing
P/E Ratio

7/29/2019 7355347 Valuation Ratios
http://slidepdf.com/reader/full/7355347-valuation-ratios 58/136
Integrated Financial Management Oct 24, 200858
Illustration of EV Ratios and Computation of Market Value of
Balance Sheet Components

7/29/2019 7355347 Valuation Ratios
http://slidepdf.com/reader/full/7355347-valuation-ratios 59/136
Integrated Financial Management Oct 24, 200859
Investment Banker Analysis of Comparable Multiples

7/29/2019 7355347 Valuation Ratios
http://slidepdf.com/reader/full/7355347-valuation-ratios 60/136
Integrated Financial Management Oct 24, 200860
Investment Banker Analysis of Multiples

7/29/2019 7355347 Valuation Ratios
http://slidepdf.com/reader/full/7355347-valuation-ratios 61/136
Integrated Financial Management Oct 24, 200861
Use of PE in Valuation
• The long-run P/E ratio is often used in valuation. This process involves:
Project EPS
Compute Stable EPS
Compute P/E Ratio using formula
P/E = (1-g/r)/(k-g)
g – growth in EPS or Net Income
r – rate of return earned on equity
k – cost of equity capital
Related Formula for terminal value with NOPLAT (EBITAT)
(1-g/ROIC)/(WACC – g)
The formula demonstrates where value really comes from

7/29/2019 7355347 Valuation Ratios
http://slidepdf.com/reader/full/7355347-valuation-ratios 62/136
Integrated Financial Management Oct 24, 200862
Liquidity and Solvency
Liquidity
Ability to meet short-term obligations Focus:
• Current Financialconditions
• Current cash flows
•Liquidity of assets
Solvency
Ability to meet long-termobligations
Focus:
• Long-term financialconditions
• Long-term cash flows
• Extended profitability
Credit worthiness: Ability to honor credit obligations
(downside risk)

7/29/2019 7355347 Valuation Ratios
http://slidepdf.com/reader/full/7355347-valuation-ratios 63/136
Integrated Financial Management Oct 24, 200863
Solvency Ratios
• Ratios are the center of traditional credit analysis that assesses whether acompany can re-pay loans. These ratios should be compared to benchmarks.
Solvency
Debt Payback Ratios
Funds from Operations to Total Debt
Debt to EBITDA
Leverage Ratios
Debt to Capital (Include Short-term Debt)
Market Debt to Market Capital
Payment Ratios
Interest Coverage
Debt Service Coverage [Cash Flow/(Interest + Principal)]
Capital Investment Coverage
Operating Cash Flow/Capital Expenditures

7/29/2019 7355347 Valuation Ratios
http://slidepdf.com/reader/full/7355347-valuation-ratios 64/136
Integrated Financial Management Oct 24, 200864
Liquidity
• Current Ratio
Current Assets to Current Liabilities
Current Assets less Inventory to Current Liabilities
• Model Working Capital
Current Assets less Cash and Temporary Securities minus Current liabilitiesless Short-term Debt
• Liquidity Assessment
Debt Profile (Maturities)
Bank Lines (Availability, amount, maturity, covenants, triggers)
Off Balance Sheet Obligations (Guarantees, support, take-or-pay contracts,contingent liabilities)
Alternative Sources of Liquidity (Asset sales, dividend flexibility, capitalspending flexibility)

7/29/2019 7355347 Valuation Ratios
http://slidepdf.com/reader/full/7355347-valuation-ratios 65/136
Integrated Financial Management Oct 24, 200865
Financial Ratios in Credit Analysis
• Analyze financial ratios after determining the riskiness of a company.
• There are hundreds of ratios that could be analyzed, only certain key
ratios need to be analyzed to complete an effective assessment.
• Four ways to assess ratios:
Absolute Levels
Trends in historic ratios
Forecast ratios
Comparison with industry peers

7/29/2019 7355347 Valuation Ratios
http://slidepdf.com/reader/full/7355347-valuation-ratios 66/136
Integrated Financial Management Oct 24, 200866
• Measure how many times the company’s earned income covers interestcharges, etc .
Used to determine the probability of default
A coverage ratio of 1 indicates that income just covers interest
Can be calculated either before- or after-tax
Consistency is important
• Analysts also consider the stability and trend of earnings
Interest and Debt Service Coverage Ratios

7/29/2019 7355347 Valuation Ratios
http://slidepdf.com/reader/full/7355347-valuation-ratios 67/136
Integrated Financial Management Oct 24, 200867
S&P Benchmarks

7/29/2019 7355347 Valuation Ratios
http://slidepdf.com/reader/full/7355347-valuation-ratios 68/136
Integrated Financial Management Oct 24, 200868
S&P Benchmark for Manufacturing and Service Companies –
Funds from Operations/Total Debt
• The benchmark ratios differ according to the risk profile of a company asillustrated on the chart below.
35%25%Well Below Average
45%35%25%Below Average
55%40%30%15% Average
60%50%40%25%20% Above Average
70%60%50%40%30%Well Above
Average
BBBBB A AA AAACompany BusinessRisk Profile

7/29/2019 7355347 Valuation Ratios
http://slidepdf.com/reader/full/7355347-valuation-ratios 69/136
Integrated Financial Management Oct 24, 200869
S&P Benchmarks

7/29/2019 7355347 Valuation Ratios
http://slidepdf.com/reader/full/7355347-valuation-ratios 70/136
Integrated Financial Management Oct 24, 200870
S&P Utility Benchmarks

7/29/2019 7355347 Valuation Ratios
http://slidepdf.com/reader/full/7355347-valuation-ratios 71/136
Integrated Financial Management Oct 24, 200871
S&P Benchmarks

7/29/2019 7355347 Valuation Ratios
http://slidepdf.com/reader/full/7355347-valuation-ratios 72/136
Integrated Financial Management Oct 24, 200872
S&P Ratio Definitions

7/29/2019 7355347 Valuation Ratios
http://slidepdf.com/reader/full/7355347-valuation-ratios 73/136
Integrated Financial Management Oct 24, 200873
Objective of Analysis is Bankruptcy Probability
• Credit agencies use the ratios that differ by industry in establishing rating criteria
• Criteria can often be determined by industry

7/29/2019 7355347 Valuation Ratios
http://slidepdf.com/reader/full/7355347-valuation-ratios 74/136
Integrated Financial Management Oct 24, 200874
Bond Ratings and Yield Spread

7/29/2019 7355347 Valuation Ratios
http://slidepdf.com/reader/full/7355347-valuation-ratios 75/136
Integrated Financial Management Oct 24, 200875
Don’t Put Miscellaneous Un-Explained Factors
• Test

7/29/2019 7355347 Valuation Ratios
http://slidepdf.com/reader/full/7355347-valuation-ratios 76/136
Integrated Financial Management Oct 24, 200876
Class 4: Model Assessment
• Various ratios that some use to assess management performance are mostappropriate for testing the validity of a model. Examples of these ratios include:
EBITDA/Revenue
Working Capital – Activity Ratios
Inventory Turnover
AR/Revenues;
AP/Expenses
Income Tax Payable/Income Taxes
Depreciation Rate – Depreciation Expense/Gross PP&L
Depreciation Expense to Cap Exp
Average Interest Rate – Interest Expense/Average Debt
Capital Expenditure/Capacity

7/29/2019 7355347 Valuation Ratios
http://slidepdf.com/reader/full/7355347-valuation-ratios 77/136
Integrated Financial Management Oct 24, 200877
Other Ratios in Financial Modeling
• Other ratios should be computed in financial models to test the validity of assumptions and the structure of the model. For these ratios, the historic levels
can be used to make forecasts of relevant assumptions.
• Examples include average interest rate, depreciation rate, working capital ratios,
dividend payout ratio, EBITDA/Sales

7/29/2019 7355347 Valuation Ratios
http://slidepdf.com/reader/full/7355347-valuation-ratios 78/136
Integrated Financial Management Oct 24, 200878
Financial Ratio Assignment - Work with the
PE Ratio

7/29/2019 7355347 Valuation Ratios
http://slidepdf.com/reader/full/7355347-valuation-ratios 79/136
Integrated Financial Management Oct 24, 200879
PE Ratio Exercise
• Find the file named P/E Ratio exercise
• Complete the cork screw for determining the equity balance

7/29/2019 7355347 Valuation Ratios
http://slidepdf.com/reader/full/7355347-valuation-ratios 80/136
Integrated Financial Management Oct 24, 200880
Steps in the PE Ratio Exercise – Open the File

7/29/2019 7355347 Valuation Ratios
http://slidepdf.com/reader/full/7355347-valuation-ratios 81/136
Integrated Financial Management Oct 24, 200881
Step 1: Enter Switch Variables for the Holding Period
• Use true, false switches to establish the holding period and the terminalperiod
• Do not use if statement
• Rather,
= year <= final_year for the holding period
= year = final_year for the terminal period
• When you multiply variables by the true or false, the then the numbers
are zero or one

7/29/2019 7355347 Valuation Ratios
http://slidepdf.com/reader/full/7355347-valuation-ratios 82/136
Integrated Financial Management Oct 24, 200882
Step 2: Compute the Equity Balance, Net Income and
Dividends with a Cork Screw
• Start with the beginning equity balance
Income = ROE x Beginning balance
Dividends = Income x Payout Ratio
Ending Balance = Beginning Balance + Income – Dividends
• In subsequent periods
Beginning balance = Prior Period Ending Balance

7/29/2019 7355347 Valuation Ratios
http://slidepdf.com/reader/full/7355347-valuation-ratios 83/136
Integrated Financial Management Oct 24, 200883
Step 3: Compute Cash Flow in Holding Period and in Terminal
Period
• In the holding period
Cash flow = dividends
• In the terminal period
Cash flow = dividends + Multiple x earnings per share
Where
Multiple = P/E Ratio from formula (1-g/r)/(k-g)
• Use switch to make sure cash flow is not counted after the holding period
Cash Flow = dividends x switch

7/29/2019 7355347 Valuation Ratios
http://slidepdf.com/reader/full/7355347-valuation-ratios 84/136
Integrated Financial Management Oct 24, 200884
Step 4: Compute the Value of Cash Flow
• Assume the discount rate is the hurdle rate
• Each year the discount factor is
1/(1+r)^year
• The value of cash flow is:
Discount factor x cash flow

7/29/2019 7355347 Valuation Ratios
http://slidepdf.com/reader/full/7355347-valuation-ratios 85/136
Integrated Financial Management Oct 24, 200885
Step 5: Compute the P/E Ratio
• Compute the total value of the share
Value = ∑ cash flow x discount factor
• Fill in Components
P/E = Value/First Year Earnings

7/29/2019 7355347 Valuation Ratios
http://slidepdf.com/reader/full/7355347-valuation-ratios 86/136
Integrated Financial Management Oct 24, 200886
Experiment with P/E Ratio Using Microsoft Data
• Assume ROE = 17%
Cost of Equity = 17%
Payout Ratio = 50%
What is the P/E
Why
• Assume
ROE = 17%
Cost of Equity = 12%
Payout Ratio = 100%
What is the P/E
Why
E i t ith P/E R ti

7/29/2019 7355347 Valuation Ratios
http://slidepdf.com/reader/full/7355347-valuation-ratios 87/136
Integrated Financial Management Oct 24, 200887
Experiment with P/E Ratio
• Assume
ROE = 17%
Cost of Equity = 12%
Dividend Payout = 50%
What is the P/E
Why

7/29/2019 7355347 Valuation Ratios
http://slidepdf.com/reader/full/7355347-valuation-ratios 88/136
Integrated Financial Management Oct 24, 200888
Reference: Financial Ratio Formulas to
Assess Management Performance
I t d ti T C t f T d

7/29/2019 7355347 Valuation Ratios
http://slidepdf.com/reader/full/7355347-valuation-ratios 89/136
Integrated Financial Management Oct 24, 200889
Introduction: Two Components of Trade
The heart of any financial analysis is measurement of value throughassessing risk and return. The primary subject in financial statement
analysis is how can we read financial statements and evaluate the return of
a company relative to the risk of a company.
As the growth of trade transformed the principles of gambling into the
creation of wealth, the inevitable result was capitalism, the epitome of risk-taking. But capitalism could not have flourished without two new activities …
The first was bookkeeping , a humble activity but one that encouraged the
dissemination of the new techniques of numbering and counting.
The other was forecasting , a much less humble and far more challenging
activity that links risk taking with direct payoffs.
“The Remarkable Story of Risk”
C St d f Fi i l St t t A l i

7/29/2019 7355347 Valuation Ratios
http://slidepdf.com/reader/full/7355347-valuation-ratios 90/136
Integrated Financial Management Oct 24, 200890
Case Study of Financial Statement Analysis
• Examples of Financial Statement Review
You receive financial projections as part of an offeringmemorandum or as part of a financing proposal. How would youdetermine whether the projections are reasonable by comparing theprojections to history.
You are assigned to perform a valuation of a company. You mustassess whether the earnings guidance from investment analysts arereasonable.
You are structuring an M&A transaction. You must determine theamount of debt and equity that can be used in the transaction.
P fit bilit A l i

7/29/2019 7355347 Valuation Ratios
http://slidepdf.com/reader/full/7355347-valuation-ratios 91/136
Integrated Financial Management Oct 24, 200891
Profitability Analysis
• ROE = Net Income/ Avg. Common Equity
• ROA = EBIT/ Total Assets
• ROIC = EBIT x (1-t)/ (Avg. Total Debt + Avg. Total Equity)
• Market Value per Share/Book Value per Share
• Market Value of Assets/Replacement Cost of Assets
• Gross Profit Margin = Gross Profit/ Sales
• Operating Margin = EBITDA/Sales
• Profit Margin = Net Income/ Sales
R t E it

7/29/2019 7355347 Valuation Ratios
http://slidepdf.com/reader/full/7355347-valuation-ratios 92/136
Integrated Financial Management Oct 24, 200892
Return on Equity
•Defines how much income management has made from the equity investment made byinvestors – the return is net income and the investment is the equity.
•Formula:
Net Income/(Beginning + Ending Equity)/2
Net Income after Preferred Dividends/(Average Common Equity)
•The problem with ROE it that it mixes operating performance with financial structure, making
it difficult to understand the underlying performance.
•Return on equity should be related to the risk associated with earnings -- volatile earningsshould imply a higher average return on equity
•High or low return on equity in models
High returns – check your assumptions
Low returns – problems with management performance
Return on Assets

7/29/2019 7355347 Valuation Ratios
http://slidepdf.com/reader/full/7355347-valuation-ratios 93/136
Integrated Financial Management Oct 24, 200893
• Return in assets measures the amounts of income produced relative toinvestment in assets. The ratio is generally pre-tax and total assets candistort the ratio.
• Formula:
• EBIT/Average Total Assets
• Problems:
Difference between capital and asset balance means thatinvestment not measured (examples, deferred taxes, deferredcredits).
Pre-tax means that taxes not considered even though taxes arereal.
Financing by current liabilities not considered (for example ROA isthe same for businesses that have different funding from suppliers)
Return on Assets
Formula for Return on Invested Capital
7/29/2019 7355347 Valuation Ratios
http://slidepdf.com/reader/full/7355347-valuation-ratios 94/136
Integrated Financial Management Oct 24, 200894
•The return in invested capital formula can be for a division or an entire corporation. It is after tax and after
depreciation. Cash balances should be excluded from the denominator and interest income from the numerator.Goodwill and goodwill amortization should be excluded.
•Formula:
ROIC = EBITAT/Invested Capital
Where:
EBITAT: Earnings before Interest Taxes and Goodwill Amortization less taxes on EBITAT
Taxes on EBITAT: Cash Income Taxes Less Tax on Interest Expense and Interest Incomeand Tax on Non-operating Income
Invested Capital less cash balance
• Adjustments
Other Assets
Cash Balances
Goodwill
Other
Formula for Return on Invested Capital
ROIC and Economic Profit

7/29/2019 7355347 Valuation Ratios
http://slidepdf.com/reader/full/7355347-valuation-ratios 95/136
Integrated Financial Management Oct 24, 200895
ROIC and Economic Profit
• ROIC is the foundation for analyzing performance in EVA. If a division or company, then it should be earning economic profit. Alternative measures can beused to measure economic profit:
• Economic Profit Formula:
Economic profit = Invested Capital x (ROIC - WACC)
Economic profit = EBITAT - Capital Charge
Economic profit = EBITAT - WACC x Invested Capital
Market to Book Value

7/29/2019 7355347 Valuation Ratios
http://slidepdf.com/reader/full/7355347-valuation-ratios 96/136
Integrated Financial Management Oct 24, 200896
•Management performance can be evaluated by measuring what equity investors think about
the value of the company. Today’s market value compared to the amount invested byshareholders (directly or indirectly through not retaining earnings) is measured by the market tobook ratio. The ratio measures how much value management has created relative to the amountinitially invested. If the ratio is 1.0, management has not created value, if it is 2.0, managementhas doubled value relative to the amount invested.
•The ratio is related to ROE because if the ROE is greater than the cost of capital, the marketvalue should be above the book value.
•Formula:
Market Price/Book Value per Share
•Problems:
Investment does not inflate
Incorporates benefits or costs of equity value from changes in the liability structure of the company.
Market to Book Value
Example of Market to Book Ratio

7/29/2019 7355347 Valuation Ratios
http://slidepdf.com/reader/full/7355347-valuation-ratios 97/136
Integrated Financial Management Oct 24, 200897
Example of Market to Book Ratio
Market Value to Replacement Cost (Tobin’s Q)

7/29/2019 7355347 Valuation Ratios
http://slidepdf.com/reader/full/7355347-valuation-ratios 98/136
Integrated Financial Management Oct 24, 200898
•Theoretical problems with the market to book ratio are addressed with a ratioknown as Tobin’s Q. This ratio compares market value to replacement cost rather than book value. If replacement cost is lower than market value, then shareholdersare better off by liquidating the company and selling assets in the market. The morethe value is above replacement cost, the better job management is doing in managingassets:
•Formula
Tobin’s Q = Enterprise Value/Replacement CostWhere
Enterprise Value = Market Value of Equity plus market value of Debt
•Problems
How to measure replacement cost
Adjusting replacement cost for asset age
Market Value to Replacement Cost (Tobin s Q)

7/29/2019 7355347 Valuation Ratios
http://slidepdf.com/reader/full/7355347-valuation-ratios 99/136
Integrated Financial Management Oct 24, 200899
Reference: Formulas for Valuation Ratios
Enterprise Value Equity Value and Equity Value per Share

7/29/2019 7355347 Valuation Ratios
http://slidepdf.com/reader/full/7355347-valuation-ratios 100/136
Integrated Financial Management Oct 24, 2008100
Enterprise Value, Equity Value and Equity Value per Share
• Before discussing valuation ratios it is helpful to define market capitalization and enterprise
value.
• Formulas:
Market Capitalization = Share Price x Number of Outstanding Shares (fully diluted)
Enterprise value = Market Capitalization plus Market Value of Debt
• In theory, enterprise value is the present value of free cash flow plus the present value of residual.
• In practice, the value of debt can often be estimated by the book value as long as theaverage interest rate is similar to the market yields on the company debt.
P/E Ratio

7/29/2019 7355347 Valuation Ratios
http://slidepdf.com/reader/full/7355347-valuation-ratios 101/136
Integrated Financial Management Oct 24, 2008101
• The P/E Ratio is the most prominent valuation ratio. It is affected by estimatedearnings growth, the ability of a company to earn economic profits and the growthin profitable operations.
• Formula:
Share Price/Earnings per Share
• Issues
Trailing Twelve Months and Forward Twelve Months
Formula: (1-r/g)/(k-g)
• Problems
Affected by earnings adjustments
Causes too much focus on EPS
Distortions created by financing
P/E Ratio
Enterprise Value/EBITDA

7/29/2019 7355347 Valuation Ratios
http://slidepdf.com/reader/full/7355347-valuation-ratios 102/136
Integrated Financial Management Oct 24, 2008102
Enterprise Value/EBITDA
• Some of the problems with the P/E ratio are rectified by the ratio of EV/EBITDA. This ratio is not affected by leverage, accounting
adjustments and can more effective comparisons across companies can
be made. EBITDA - Pre-tax, pre depreciation operating income is a
proxy for cash flow, so market value is compared to cash flow:
•Formula:EV/EBITDA = Enterprise Value/EBITDA
Where
Enterprise Value = Book value of debt plus market value of equity
Price to Cash Flow

7/29/2019 7355347 Valuation Ratios
http://slidepdf.com/reader/full/7355347-valuation-ratios 103/136
Integrated Financial Management Oct 24, 2008103
Price to Cash Flow
• To correct the P/E ratio for accounting adjustments that are non-cashsuch as depreciation and goodwill amortization, a ratio known as Price to
cash flow is computed. This is similar to the P/E ratio except the
denominator is cash flow rather than earnings.
• Cash Flow measure is very simple and not generally the free cash flow
• Cash Flow is generally the net income plus depreciation
Price to Earnings Growth (PEG)

7/29/2019 7355347 Valuation Ratios
http://slidepdf.com/reader/full/7355347-valuation-ratios 104/136
Integrated Financial Management Oct 24, 2008104
Price to Earnings Growth (PEG)
• Due to the importance of earnings growth in the P/E ratio, this ratio attempts tomeasure the relative value of a company after accounting for earnings growth. If a company has higher earnings growth, its price should be higher. Therefore, thevaluation of two companies can be compared even if they have different earningsgrowth.
• Formula:
PEG = PE Ratio/Consensus Earnings Growth
Internal Rate of Return

7/29/2019 7355347 Valuation Ratios
http://slidepdf.com/reader/full/7355347-valuation-ratios 105/136
Integrated Financial Management Oct 24, 2008105
Internal Rate of Return
• Application to project finance rather than investment analysis
• Equity IRR analogous to the ROE
• Project IRR analogous to the ROIC
• Free cash flow used for project IRR
• Equity cash flow used for equity IRR
• Return on Equity Cash Flow in Gaza Strip Project

7/29/2019 7355347 Valuation Ratios
http://slidepdf.com/reader/full/7355347-valuation-ratios 106/136
Integrated Financial Management Oct 24, 2008106
Reference: Financial Ratio Formulas for
Credit Analysis
Ratio Analysis

7/29/2019 7355347 Valuation Ratios
http://slidepdf.com/reader/full/7355347-valuation-ratios 107/136
Integrated Financial Management Oct 24, 2008107
Ratio Analysis
• Activity Analysis
Inventory Turnover = COGS/Avg. Inventory
Avg. Days in Stock = 365/ Inventory TO
Receivables Turnover = Sales/ Avg. Receivables
Avg. Days Receivables Out = 365/ Receivables
Working Capital Turnover = Sales/ Avg. Working Cap
Total Asset Turnover = Sales/ Average Total Assets
•Liquidity Analysis
Operating Cycle = Avg. Days in Stock +
Avg. Days Receivables OutCash Cycle will be less, depending on use of credit
Current Ratio = CA/CL
Quick Ratio = (CA - Inventories)/ CL
CFO Ratio = CFO/ CL
•Solvency Analysis
Debt-to-Cap = Total Debt/Total Capital
Debt to Equity = Total Debt/ Total Equity
(market values are preferable in this ratio)Times Interest Earned = EBIT/ Interest Expense
Fixed Charge Coverage = EBIT (and before other fixed expenses)/Fixed Charges
Cap Ex Ratio = CFO/ Cap Ex
Credit Analysis Ratios

7/29/2019 7355347 Valuation Ratios
http://slidepdf.com/reader/full/7355347-valuation-ratios 108/136
Integrated Financial Management Oct 24, 2008108
y
• A traditional use of financial ratios has been to assess the value of debtand the chance of default. Liquidity ratios measure the ability of a
company to meet short-term obligations while interest coverage, debt
service and capitalization ratios measure the ability to meet long-term
obligations.
• Credit ratios have been formalized into regression analysis by relating the
defaults on companies to various financial ratios. (Note that credit ratios
are not considered adequate for many assessments, but they are a
starting point.)
Classes of Credit Ratios

7/29/2019 7355347 Valuation Ratios
http://slidepdf.com/reader/full/7355347-valuation-ratios 109/136
Integrated Financial Management Oct 24, 2008109
• Interest Coverage
EBIT/Interest
Debt Service Coverage Ratio
After tax coverage
• Debt to Capital
Total debt to capital
Debt to equity
Long term versus short term
Market value versus book value
• Debt to Cash Flow
• Liquidity
Current Ratio
Quick Ratio
Interest and Debt Service Coverage

7/29/2019 7355347 Valuation Ratios
http://slidepdf.com/reader/full/7355347-valuation-ratios 110/136
Integrated Financial Management Oct 24, 2008110
g
• The interest coverage and debt service ratios measure the amount of buffer or comfort above interest expense and/or debt service that cash
flow provides before obligations cannot be met from current operations.
EBIT/Interest is used more than the debt service coverage in corporate
modeling because of the lumpiness in cash flow that occurs from bullet
maturities:
• Formula:
EBIT/Interest = EBIT/(Long + Short term Interest)
DSCR = (Operating Cash + Interest)/(Interest + Maturities)
Debt to Capital Ratio

7/29/2019 7355347 Valuation Ratios
http://slidepdf.com/reader/full/7355347-valuation-ratios 111/136
Integrated Financial Management Oct 24, 2008111
p
• The debt to capital ratio measures from a book perspective, the amountof debt that is financing assets. The ratio has not been a very good
predictor of bankruptcy. It should include long and short term debt as
well as capitalized lease payments. In some cases, the capitalized value
of contracts has been included.
• Formula:
Debt to Capital = (Long-term debt + Short-term debt)/(Long andShort term debt + Equity)
Debt to Cash Flow

7/29/2019 7355347 Valuation Ratios
http://slidepdf.com/reader/full/7355347-valuation-ratios 112/136
Integrated Financial Management Oct 24, 2008112
• This ratio compares the cash flow with the amount of debt. The less cashflow relative to debt, the worse the credit and the higher the probability of
default. Inquisitively, the ratio can be considered the number of years of
cash flow it takes to pay-off all of the debt.
• Formula:
Debt/Cash Flow = (Long and Short term debt)/EBITDA
• Note that EBITDA is an approximation of cash flow and it does not
include capital expenditures.
Liquidity Ratios

7/29/2019 7355347 Valuation Ratios
http://slidepdf.com/reader/full/7355347-valuation-ratios 113/136
Integrated Financial Management Oct 24, 2008113
•Liquidity ratios measure the ability of a company to meet obligations thatare coming due in the short-term. Liquidity ratios are relevant for suppliersand contractors. A ratio below 1.0 suggests that more is coming due then ison hand to pay the liabilities. The quick ratio excludes inventories becausethey are not liquid.
•Formulas:
•Current Ratio
Current Assets/Current Liabilities
•Quick Ratio
Current Assets – Inventory/Current Liabilities
(Cash + Marketable Securities + A/R)/Current Liabilities
q y
Activity Ratios

7/29/2019 7355347 Valuation Ratios
http://slidepdf.com/reader/full/7355347-valuation-ratios 114/136
Integrated Financial Management Oct 24, 2008114
• Inventory turnover CGS/Average Inventory
Days Inventory in Stock = 365/Inventory Turnover
Receivables Turnover = Sales/AR
Days Receivables Outstanding = 365/Receivables Turnover
Depreciation Rate

7/29/2019 7355347 Valuation Ratios
http://slidepdf.com/reader/full/7355347-valuation-ratios 115/136
Integrated Financial Management Oct 24, 2008115
• In simple models, forecasts of depreciation expense can be made by applying the
depreciation rate to gross plant property and equipment.
• Depreciation Rate
Formula:
Depreciation Rate = Depreciation Expense/Gross Plant
Depreciation Expense divided by average gross plant balance
One divided by depreciation rate gives you the average life of plant
• Accumulated Depreciation/Plant Balance
Indication of average age of the plant
Higher depreciation is older average age of the plant

7/29/2019 7355347 Valuation Ratios
http://slidepdf.com/reader/full/7355347-valuation-ratios 116/136
Integrated Financial Management Oct 24, 2008116
Financial Ratio Formulas for Model
Assessment
EBITDA Margin

7/29/2019 7355347 Valuation Ratios
http://slidepdf.com/reader/full/7355347-valuation-ratios 117/136
Integrated Financial Management Oct 24, 2008117
• As explained above, the EBITDA margin can be a good ratio todetermine if assumptions are reasonable:
Relationship between revenues and operating expenses
Compare forecast to history and evaluate why changes are occurring
Average Interest Rate

7/29/2019 7355347 Valuation Ratios
http://slidepdf.com/reader/full/7355347-valuation-ratios 118/136
Integrated Financial Management Oct 24, 2008118
• The average interest rate is the interest expense divided by the average debt
balance. This can be used to assess whether the project interest rate is
reasonable – particularly for long-term debt.
Average interest rate is the interest expense divided by the average debtbalance
The average interest rate can be compared to prevailing interest rates
Capital Intensity

7/29/2019 7355347 Valuation Ratios
http://slidepdf.com/reader/full/7355347-valuation-ratios 119/136
Integrated Financial Management Oct 24, 2008119
• Capital intensity is often discussed in finance. The capital intensity does not affect
value or credit, but it is helpful in background on the business.
• Formula:
Capital Intensity = Capitalization/Revenues
• Driven by
Life of Asset Capital Cost Relative to Operating Cost
Required Return on Assets
Financial Ratio Output in Corporate Models

7/29/2019 7355347 Valuation Ratios
http://slidepdf.com/reader/full/7355347-valuation-ratios 120/136
Integrated Financial Management Oct 24, 2008120
•Use financial ratios to test the validity of models (can the industry reallysustain high profits)
• Use financial ratios to develop valuation from earnings multiples (P/E and
EBIDA/Enterprise Value)
• Use financial ratios in residual value calculations
Examples of Financial Ratio Analysis in Corporate Model

7/29/2019 7355347 Valuation Ratios
http://slidepdf.com/reader/full/7355347-valuation-ratios 121/136
Integrated Financial Management Oct 24, 2008121
Examples of Financial Ratio Analysis in Corporate Model

7/29/2019 7355347 Valuation Ratios
http://slidepdf.com/reader/full/7355347-valuation-ratios 122/136
Integrated Financial Management Oct 24, 2008122

7/29/2019 7355347 Valuation Ratios
http://slidepdf.com/reader/full/7355347-valuation-ratios 123/136
Integrated Financial Management Oct 24, 2008123
Financial Ratios and Ability to Earn
Economic Profit
The Economics of Value Creation and Strategic Planning

7/29/2019 7355347 Valuation Ratios
http://slidepdf.com/reader/full/7355347-valuation-ratios 124/136
Integrated Financial Management Oct 24, 2008124
In this section we review how value is created by business activity including how
valuation relates to economic profit. The section covers the basic economic drivers of value in different circumstances and the actual value creation activities of variousfirms.
1. Microeconomics and the creation of value
2. Models of strategic choice and value3. Assumption of efficient financial markets
4. Value Drivers, strategy and financial management
Why Does Economic Profit Depend on Barriers to Entry

7/29/2019 7355347 Valuation Ratios
http://slidepdf.com/reader/full/7355347-valuation-ratios 125/136
Integrated Financial Management Oct 24, 2008125
Recall your basic economics course:
Economic profit is the net revenuesearned by a company less all costsincluding opportunity cost(opportunity cost includes the riskadjusted cost of capital).
If companies are earning economicprofit, more firms will enter the
industry. If companies are notmaking economic profit, firms willexit the industry. Therefore, tosustain economic profit (asustainable competitive advantage),firms must be able to keep upbarriers to entry.

7/29/2019 7355347 Valuation Ratios
http://slidepdf.com/reader/full/7355347-valuation-ratios 126/136
Examples of Economic Profit that Could not be Sustained

7/29/2019 7355347 Valuation Ratios
http://slidepdf.com/reader/full/7355347-valuation-ratios 127/136
Integrated Financial Management Oct 24, 2008127
• Internet Companies
The internet bubble occurred because companies had “business models” thatsuggested high growth. But in order to really make profit, there had to bebarriers to entry. In the industry, the business models were easy to copy andeconomic profit was very hard to realize.
• Enron
Enron’s business plan was to make money from being a player in commoditymarkets where there is a zero sum game. It is difficult to realize long termsignificant economic profit by making trades where there is an equal number of winners and losers.
Examples of Economic Profit that Could not be Sustained

7/29/2019 7355347 Valuation Ratios
http://slidepdf.com/reader/full/7355347-valuation-ratios 128/136
Integrated Financial Management Oct 24, 2008128
• Investments in Electricity Generation
After price spikes in electricity, many firms such as Calpine and Natural Gascompanies made significant investments in electricity generation. Theinvestments caused prices to decline and only early entrants made money.
• AT&T and NCR
The merger between AT&T and NCR did not contemplate achieving cost
savings from the merger. Without cost savings or revenue enhancements,the merger could not add value and it turned out to be a disaster.
Examples of Sustainable Economic Profit from Product
7/29/2019 7355347 Valuation Ratios
http://slidepdf.com/reader/full/7355347-valuation-ratios 129/136
Integrated Financial Management Oct 24, 2008129
Differentiation and Barriers to Entry
• Microsoft
It can be argued that Microsoft makes its money not from extremely creativeand innovative products, but from the ability to keep away competitorsthrough standardization of platforms that are required with the internet.
• General Electric
General electric operates in highly technical areas where it is difficult to enter the market. If you are building a turbine, maintaining a turbine or requiring a jet engine, other firms cannot simply enter the market.
Example of Economic Profit from an Efficient Cost Structure

7/29/2019 7355347 Valuation Ratios
http://slidepdf.com/reader/full/7355347-valuation-ratios 130/136
Integrated Financial Management Oct 24, 2008130
• Southwest Airlines versus United Airlines
Southwest Airlines has the same type of planes, motivates its employees, hasextremely short layovers, low prices and high load factors. United Airlineshas union problems, higher prices and lower load factors.
• Freeport McMoran
Freeport developed a copper mine in a remote part of Indonesia where theore grade was high and the copper could be mined from the surface.
Barriers to Entry

7/29/2019 7355347 Valuation Ratios
http://slidepdf.com/reader/full/7355347-valuation-ratios 131/136
Integrated Financial Management Oct 24, 2008131
In thinking about barriers to entry, the types of business activities that lead to
barriers can be complex:
In classic economic theory, capital intensive industries such as steel firmsand automobile firms were thought to have market power from barriers toentry. However, excess capacity can exist in the capital intensive businesses
and size alone has not turned out to be an effective barrier.
More interesting barriers to entry are from a strong name – in theadvertising and financial services business, a highly skilled work force infinancial services and software, standardization of computer platforms andeven barrier to entry from high stock prices.
Planning
Financial Statements and Reflection of Business Activities

7/29/2019 7355347 Valuation Ratios
http://slidepdf.com/reader/full/7355347-valuation-ratios 132/136
Integrated Financial Management Oct 24, 2008132
PlanningInvesting
Current:q Cashq Accounts Receivableq Inventoriesq Marketable Securities
Noncurrent:
q Land, Buildings, &Equipment
q Patentsq Investments
Assets
Balance Sheet
FinancingCurrent:q Notes Payableq Accounts Payableq Salaries Payableq Income Tax Payable
Noncurrent:q
Bonds Payableq Common Stockq Retained Earnings
Liabilities & Equity
Balance Sheet
Statement of
Shareholders’ Equity
Operating
q Salesq Cost of Goods Soldq Selling Expenseq Administrative Expenseq Interest Expense
q Income Tax Expense
Net Income
Income statement
Cash Flow
Statement of
Cash Flows
Traditional Financial Ratio Analysis – Comparative Trend
Analysis

7/29/2019 7355347 Valuation Ratios
http://slidepdf.com/reader/full/7355347-valuation-ratios 133/136
Integrated Financial Management Oct 24, 2008133
Analysis
• Purpose of trend analysis:
Evaluation of consecutive financial statements
• Output of trend analysis:
Determine the direction, speed, and extent of any trends to evaluatewhether the trends will continue
• Types of trend analysis:
Year-to-year Change Analysis
(Ln(revenue(t)/revenue(t-1))
(revenue(t)/revenue(t-1)-1)
Index-Number Trend Analysis
Prior x (1+growth)
Accounting Analysis in Financial Statements

7/29/2019 7355347 Valuation Ratios
http://slidepdf.com/reader/full/7355347-valuation-ratios 134/136
Integrated Financial Management Oct 24, 2008134
Comparability problems — across firms and across time
Manager estimation error
Distortion problems Earnings management
Distortion of business
Accounting
Risk
Process to evaluate and adjust financialstatements to better reflect economic reality
Ratio Analysis
7/29/2019 7355347 Valuation Ratios
http://slidepdf.com/reader/full/7355347-valuation-ratios 135/136
Integrated Financial Management Oct 24, 2008135
• Analysis Issues
• Absolute Levels
• Trends
• Industry Benchmarks
• Industry Specific Ratios\
• Common size analysis
Income statement and balance sheet for companies in an industry
Express income statement items as percent of revenues
Express balance sheet items as percent of total assets
Example of P/E and PEG

7/29/2019 7355347 Valuation Ratios
http://slidepdf.com/reader/full/7355347-valuation-ratios 136/136