7 | transportation impact analysis · stanford 2018 general use permit transportation impact...
TRANSCRIPT

7 | Transportation Impact Analysis
Bicycle on Palm Drive. Photo: Parking and Transportation Services, Stanford University

Stanford 2018 General Use Permit
Transportation Impact Analysis
Part 1
Trip Generation and Trip Distribution
Prepared for: Stanford University
November 2016
SJ15-1585

Stanford 2018 General Use Permit Transportation Impact Analysis Part 1 November 2016
Table of Contents
1: INTRODUCTION ............................................................................................................................................. 1
University Setting ................................................................................................................................................................. 1
No Net New Commute Trips Monitoring .................................................................................................................. 4
2: TRANSPORTATION DEMAND MANAGEMENT PROGRAM ..................................................................... 6
TDM Program Description ............................................................................................................................................... 6
Annual Transportation Survey ........................................................................................................................................ 9
Potential Expansions of TDM Program under Proposed 2018 GUP ................................................................ 9
3: PEAK HOUR TRIP GENERATION ................................................................................................................12
Data Sources ....................................................................................................................................................................... 12
Existing 2015 Trip Generation ...................................................................................................................................... 13
2015 Trip Generation Rates .......................................................................................................................................... 13
Trip Generation Growth: 2015 to Fall 2018 (Commencement of Proposed 2018 GUP) ....................... 15
Projected Trip Generation -- 2018 GUP ................................................................................................................... 16
4: STANFORD TRIP DISTRIBUTIONS .............................................................................................................19
Stanford Off-Campus Commuter Distribution ...................................................................................................... 19
Stanford Resident Distribution .................................................................................................................................... 23
Appendices
Appendix A: Stanford TDM Program Description
Appendix B: Trip Generation Counts

Stanford 2018 General Use Permit Transportation Impact Analysis Part 1 November 2016
List of Figures
Figure 1: Study Area ............................................................................................................................................................................ 2
Figure 2: Historical Drive-Alone Mode Share ............................................................................................................................ 8
Figure 3: Existing and Projected Trip Peak Hour Trips ........................................................................................................ 18
Figure 4: Change in Proportion of Resident and Non-Resident Peak Hour Trips ................................................... 18
Figure 5: Stanford University Employee Mode Share ......................................................................................................... 20
Figure 6: 2015 to 2018 Distribution of Stanford Commuters .......................................................................................... 22
Figure 7: Stanford Resident Distribution .................................................................................................................................. 26
List of Tables
Table 1: Stanford Transportation Demand Management Strategies ............................................................................... 7
Table 2: Campus Trip Generation Rates: 2015 ....................................................................................................................... 14
Table 3: December 2015 – Fall 2018 Development Summary ......................................................................................... 15
Table 4: December 2015 – Fall 2018 Trip Generation Estimate ...................................................................................... 16
Table 5: 2018 GUP Development Proposal ............................................................................................................................. 16
Table 6: 2018 GUP Trip Generation Estimate ......................................................................................................................... 17
Table 7: Percent of Stanford Affiliates (Driving) by Geographic Area .......................................................................... 21
Table 8: Stanford Residence Off-Campus Destinations Geographic Area .................................................................. 25

Stanford 2018 General Use Permit Transportation Impact Analysis Part 1 November 2016
1
1: INTRODUCTION
In December 2000, the Santa Clara County Board of Supervisors approved the Stanford University General Use Permit (GUP) that defined the conditions of Stanford’s planned growth and development. The GUP established the amount of net new development that could be constructed for academic and academic support uses and the number of residential units that could be added (dwelling units and/or beds) within the campus. Stanford is about to reach the 2000 GUP development limits in terms of both the academic and academic support space and residential units. Therefore, Stanford is applying for a new general use permit (the proposed 2018 General Use Permit or 2018 GUP) to establish the conditions for the next increment of campus growth.
One of the key considerations in the evaluation of the 2018 GUP will be the impact of new development on the supporting transportation systems. Stanford achieved a “No Net New Commute Trips” goal under the 2000 GUP. The 2000 GUP’s conditions of approval allow Stanford to either achieve the No Net New Commute Trips goal, or provide proportional funding of mitigation measures for impacted intersections identified in the Stanford Community Plan/ 2000 GUP Environmental Impact Report (2000 GUP EIR). Stanford chose to limit vehicle trips by implementing an Alternative Transportation/ Transportation Demand Management (TDM) program to shift commuters from drive-alone trips to other modes.
As demonstrated through an extensive annual monitoring and reporting program conducted by an independent consultant acting at the direction of the County, Stanford has succeeded in achieving the No Net New Commute Trips goal. The purpose of this report is provide background information on the existing transportation programs operated by Stanford, including the TDM program used to reduce vehicle trips to campus, document the existing travel characteristics of the campus users, and to present trip generation and trip distribution anticipated to result from the proposed 2018 GUP under the conservative assumption that Stanford’s existing TDM program is not expanded to further reduce commute trips. This report also presents potential expansions of the existing TDM program that could enable Stanford to continue to meet the No Net New Commute Trips goal.
UNIVERSITY SETTING
The Stanford campus is a diverse mixture of land uses that includes classrooms, academic offices, lab space, athletic venues, museums, performance and arts venues, lands for outdoor learning, student housing, and faculty/staff housing. The athletics facilities are extensive including a football stadium, gymnasiums, an aquatic center, basketball arena, and several outdoor fields to accommodate field hockey, lacrosse, soccer, and other field sports. There are cultural facilities on campus including Bing Concert Hall, Cantor Arts Center, the Anderson Arts Collection, Memorial Auditorium, and other smaller spaces supporting lectures, concerts, and other cultural events. The Arboretum is a large undeveloped space located along Palm Drive between Campus Drive and El Camino Real. Figure 1 shows the location of the Stanford Campus.

§̈¦280
§̈¦280
£¤101
£¤101
·|}114
·|}237
·|}84
·|}85
·|}92
·|}9
·|}82
·|}82
Alma St
El Camino Real
Saratog
a Ave
Lafayette St
Stevens Creek Blvd SanTomasExpy
Central Expy
N:\Pr
ojects
\_SJ1
5_Pr
ojects
\SJ15
_158
5_Sta
nford_
GUP\A
nalys
is\GI
S\MXD
\Fig1
Study
Area
_Zoo
med.m
xd
Study AreaFigure 1
Stanford CampusStanford within Santa Clara CountyStanford Lands
WaterParksAirports

Stanford 2018 General Use Permit Transportation Impact Analysis Part 1 November 2016
3
The Stanford Medical Center including Lucile Packard Children’s Hospital and Stanford Health Care are located northwest of the campus, as is Stanford Shopping Center, a regional shopping center. These facilities are located within the City of Palo Alto and, therefore, do not fall within the jurisdiction of Santa Clara County.
Stanford’s internal circulation system consists of sixteen gateway roadways that provide access to the campus. The majority of these roadways connect to the Campus Drive loop, which is the primary internal circulation roadway within the campus. Most of the academic and arts buildings, administrative offices, undergraduate housing, and student life facilities are located inside the loop. The core campus inside the loop is primarily accessed by walking or biking, and vehicle access is limited. Uses on the edge of or outside the loop include parking areas, graduate student housing, faculty and staff housing, athletics, and service buildings.
Parking is distributed throughout the Stanford campus, with the exception of the pedestrian/bicycle campus core that includes the Main Quad, the Engineering Quad, and White Plaza. Stanford charges for all forms of parking – visitor, student, faculty, and staff. The campus has seven existing parking structures, plus one under construction, and several dozen surface lots. The parking structures are located on or near Campus Drive. Metered visitor parking is provided in most of the larger parking lots and in the parking structures. All but two parking structures (Via Ortega and the Roble Field structure which is under construction) are located directly off Campus Drive or outside the Campus Drive loop.
Regional freeway access to the campus is provided by US Highway 101 (US 101) and Interstate 280 (I-280). El Camino Real and Foothill Expressway also provide regional access. The local routes from US 101 to campus include Embarcadero Road, Oregon Expressway and University Avenue. These routes lie within the cities of East Palo Alto and Palo Alto. The local routes from I-280 include Page Mill Road, Alpine Road, and Sand Hill Road, which lie within Santa Clara County, San Mateo County and the City of Menlo Park.
Stanford has excellent access to transit services via the Downtown Palo Alto Transit Station located on the edge of the campus. The Palo Alto Transit Station receives frequent Caltrain service during the peak periods. Caltrain is operated by the Joint Powers Board that includes representation from Santa Clara, San Mateo, and San Francisco counties. The University provides the “last mile” connection between the Palo Alto Transit Center and campus with its free Marguerite shuttle service. Many people also choose to bike or walk between the Transit Center and campus.
The campus is located on the service boundary of two county transit agencies – Santa Clara Valley Transportation Authority (VTA) serving Santa Clara County and SamTrans serving San Mateo County. These two agencies provide bus service within the two counties. VTA also provides light-rail service within Santa Clara County, but the service does not extend into Palo Alto or the Stanford campus. Both of the agencies provide bus service on El Camino Real which runs along the edge of the campus. Due to the extensive Marguerite service that Stanford provides within the campus, neither county agency operates buses within

Stanford 2018 General Use Permit Transportation Impact Analysis Part 1 November 2016
4
the campus. The campus is also served by Dumbarton Express that provides express bus service from locations in Alameda County in the East Bay, including the Ardenwood Park and Ride lot and Union City BART station. The Dumbarton Express is administered and governed by AC Transit in cooperation with VTA, SamTrans and Union City Transit. Stanford supplements the Dumbarton service with the U-Line Service for Stanford faculty, staff, students, hospital employees and SLAC employees. This service is similar to the Dumbarton service connecting between the East Bay and the campus, medical center and SLAC. While the services is operated by AC Transit, Stanford fully funds the service.
Stanford promotes the use of alternative commute modes – walking, biking and transit use - through their Transportation Demand Management (TDM) program. The extensive TDM program is designed to reduce the number of vehicles (personal vehicles) accessing the campus each day and to maximize mobility within the campus without the need to drive. A short description of the TDM programs follows, and a detailed description of the program is included in Appendix A.
NO NET NEW COMMUTE TRIPS MONITORING
The 2000 GUP’s conditions of approval allow Stanford to either meet a No Net New Commute Trips goal, or provide proportional funding of mitigation measures for impacted intersections identified in the Stanford Community Plan / 2000 GUP Environmental Impact Report (2000 GUP EIR). Stanford chose to limit vehicle trips by implementing an Alternative Transportation/ TDM program to shift commuters from driving alone to other travel modes. As a part of the 2000 GUP conditions, the County required Stanford to fund an annual monitoring program implemented by an independent consultant directed by the County.
The monitoring program established baseline traffic conditions from peak hour vehicle counts conducted in the spring and fall of 2001. The baseline is the measurement of the volume of inbound trips during the peak hour of the AM commute period (7:00 AM – 9:00 AM) and the volume of outbound trips during the peak hour of the PM commute period (4:00 PM – 6:00 PM). A confidence interval was added to account for day-to-day variation in traffic patterns.
To monitor Stanford’s success in achieving the No Net New Commute Trips goal, vehicle trips are counted in each year for 2 weeks in the fall and 6 weeks in the spring at the 16 campus entry and exit points which form a cordon around the Stanford campus. License plates are recorded to identify cut-through vehicles. Vehicles that exit campus within 15 minutes of entering are considered to be making “cut-through” trips and are excluded from the baseline comparison. The monitoring counts are also adjusted to remove hospital employee vehicle trips ending at parking lots within the cordon where hospital employees are allowed to park. An adjustment also is made to add University employee/student vehicle trips that end in parking lots outside the cordon.
Pursuant to 2000 GUP Condition G.8, Stanford can also receive trip reduction credits for participation by Stanford in off-campus trip reduction efforts. The trip credit is commensurate with the predicted or actual

Stanford 2018 General Use Permit Transportation Impact Analysis Part 1 November 2016
5
number of trips reduced, and the proportion of the cost of the program that Stanford is contributing. Trip reduction must occur in the area between US 101, Valparaiso Avenue/ Sand Hill Road, Interstate 280, and Arastradero Road/ Charleston Road. The County Planning Office determines the appropriate trip credit and monitoring methodology for each program in which Stanford proposes to participate.
Each year the total inbound AM peak hour trips and outbound PM peak hour trips, as modified by the trip reduction credits, are compared to the 2001 baseline to establish compliance. The monitoring is conducted by an independent consultant, AECOM, and an annual report documenting the results is prepared and made publicly available on the County of Santa Clara’s website.

Stanford 2018 General Use Permit Transportation Impact Analysis Part 1 November 2016
6
2: TRANSPORTATION DEMAND MANAGEMENT PROGRAM
Stanford University’s acclaimed Alternative Transportation/ TDM program has been successful in achieving the No Net New Commute Trips goal. Since the performance of the TDM program is monitored by the annual cordon counts, no single aspect of the TDM program is specified in the 2000 GUP. Stanford can add or remove TDM activities based on their success and cost effectiveness in reducing trips. This flexibility in the program operation has been a key to making the program successful and cost effective.
TDM PROGRAM DESCRIPTION
Stanford’s TDM program offered by Parking & Transportation Services (P&TS) include over 20 activities designed to meet the transportation needs of employees and students. The TDM program is available to the majority of its employees (generally those working more than 20 hours per week), as well as programs designed for residents living on the campus. A detailed description of Stanford’s TDM program is included in Appendix A. Key strategies in Stanford’s TDM program includes:
• Direct incentives to commuters who choose alternative modes
• Paid parking at all campus lots
• Fare-free shuttles (first/last-mile to Caltrain and campus circulator shuttles)
• Subsidized carpools and vanpools with expanded rideshare matching
• Subsidized transit passes (Go Pass and Eco Pass)
• Extensive promotional campaigns offering cash rewards and prizes
• A commute buddy program and individualized commute planning services
• Free car share memberships
• Bicycle infrastructure and end-of-trip facilities
Stanford Parking & Transportation Services (P&TS) administers the TDM program including the Commute Club that provides information, management, and incentives for commuters (employees and students) living off campus who commit to not driving alone. Table 1 presents a summary of TDM programs currently in place at Stanford University. Stanford currently provides free Caltrain Go Passes and VTA Eco Passes to their employees that live outside the Stanford zip codes. Anyone driving a vehicle to the campus must pay for parking.
The existing TDM program has successfully maintained the AM and PM peak-hour traffic volumes below 2001 baseline volumes. The TDM program’s success is reflected in the declining single occupancy vehicle mode share as shown in Figure 2. In 2002, the drive alone rate for Stanford employees was 72%; as the TDM program expanded, the drive-alone rate has decreased to around 50%.

Stanford 2018 General Use Permit Transportation Impact Analysis Part 1 November 2016
7
TABLE 1: STANFORD TRANSPORTATION DEMAND MANAGEMENT STRATEGIES
Strategy Type TDM Strategy
Active Transportation
Bicycle program which includes peer-to-peer support, safety education, financial incentives, a bicycle website and “bike speak”: a community based information exchange website.
Bicycle parking – abundant parking near high activity centers
Bicycle shop on campus in addition to repair stands
Bicycle lockers and showers
Bicycle rentals and lease programs
Bicycle and pedestrian connectivity and access improvements
Campus Design On-site amenities: food services, banking, etc. that eliminate midday trips
Buildings, landscaping and pathways designed to create an attractive walkable environment to facilitate pedestrian and bicycle activity
Financial Incentives
Pre-tax transit passes / commuter checks for transit passes, Clipper Cash, Commuter Checks and Caltrain parking permits
Commute Club giveaways as well as a permit returns reward for people handing over their long term parking permit
Car share rental credits for non-driving commuters
Carpool credits towards the cost of a carpool parking permit.
Marketing & Support
Extensive webpage with resources for all modes of transportation in addition to program specific information and educational resources, such as a carbon calculator
Guaranteed ride home program for commuters that take transit, carpool, bike or walk
Personalized commute planning service
eUpdates for Commute Club members
Daily and hourly car rental available on campus
New employee orientation to transportation resources
Promotional events - Capri program/gamification, prizes, gifts and contests
Commute buddy which matches experienced transit and bike commuters with new alternative transportation commuters
Other
Flexible work schedules including staggered work hours, compressed work week and flextime
Parking & Transportation Services
Commuter surveys
Parking Management
Tiered parking pricing and monitoring technology
Freshman parking policy prohibiting freshmen from having personal vehicles on campus
Parking location and configuration
Rideshare Carpool and rideshare matching service for commuters
Prioritized parking for ridesharing vehicles

Stanford 2018 General Use Permit Transportation Impact Analysis Part 1 November 2016
8
TABLE 1: STANFORD TRANSPORTATION DEMAND MANAGEMENT STRATEGIES
Strategy Type TDM Strategy
Vanpool subsidies and support
Transit
Extensive local Marguerite shuttle system
East Bay Express Bus Service (partially funded by Stanford, managed by a consortium of transit agencies, operated by contractor MV Transportation)
Free transit passes (VTA Eco Pass and Caltrain Go Passes) for all employees that live outside Stanford zip codes
Charter bus services for conferences, teams, events or student activities
Source: Fehr & Peers, July 2015. Figure 2: Historical Drive-Alone Mode Share Source: Stanford Parking & Transportation Services, 2015

Stanford 2018 General Use Permit Transportation Impact Analysis Part 1 November 2016
9
ANNUAL TRANSPORTATION SURVEY
P&TS conducts an annual transportation survey to evaluate the performance of the TDM programs and preferences of their users. The annual survey includes all undergraduate and graduate students, postdoctoral students, university faculty and staff, emeriti, and other affiliates of the University. The survey also includes employees of the medical center, since P&TS provides TDM services to Stanford Health Care and Packard Children’s Hospital. The most recent survey was sent to over 50,000 individuals and had 20,725 responses (~41%).
The survey collects a broad range of travel characteristics and preferences, including primary mode of travel, time of travel and days per week. These travel characteristics can then be summarized in terms of the type of user and general geographic location. Having this data allows P&TS to tailor their programs to the needs of the user and provide the appropriate services. Fehr & Peers accessed the spring 2015 survey data when preparing our trip generation and trip distribution analyses. The transportation survey data combined with the 2015 Annual Monitoring cordon data provided an excellent basis for understanding campus travel patterns.
POTENTIAL EXPANSIONS OF TDM PROGRAM UNDER PROPOSED 2018 GUP
Innovation and adaptation has allowed Stanford to meet the ambitious No Net New Commute Trips goal set out in the 2000 GUP. As the timeline below shows, Stanford has been committed to promoting alternative commute modes for over four decades. Beginning with the Marguerite free shuttle service in 1973, Stanford has implemented policies and invested in programs to reduce vehicle travel to and on the campus. One of the most recent additions to the TDM program is the launch of a real-time Marguerite app so that transit users can fine tune their travel experience though knowledge sharing.

Stanford 2018 General Use Permit Transportation Impact Analysis Part 1 November 2016
10
Stanford recognizes that to continue to achieve a No Net New Commute Trips goal under the proposed 2018 General Use Permit, it will need to expand and develop TDM program improvements that will form the next generation of commute options.
The following menu of TDM strategies provides an example of how Stanford may leverage its existing programs and add new measures, with the ultimate goal of not increasing drive-alone peak period trips to or from the campus:
• Commuter Buses – Stanford currently offers two transit passes to all eligible employees. The Caltrain Go Pass and the Santa Clara Valley Transportation Agency’s (VTA) Eco Pass allow Stanford employees to use Caltrain, VTA bus and light rail service, and the AC Transit Dumbarton Express service for free. Stanford is exploring the possible expansion of commuter bus service through its continued partnership with transit agencies and identifying employee transit markets that would benefit from commuter bus services.
• Local Bus Service & First/Last Mile Connections – Stanford began operating the Marguerite shuttle service to provide internal circulation on campus, connections into adjacent communities, and last-mile service to the Caltrain commuter rail service in downtown Palo Alto. All of the Marguerite shuttle service is free and open to the public. The local Marguerite service extends into downtown Palo Alto and to the San Antonio Shopping Center located in Mountain View. As the Caltrain commuter rail service has expanded, Stanford has increased its Marguerite shuttle service operating last mile bus service to three local Caltrain stations (i.e., Menlo Park, Palo Alto and California Avenue stations). Stanford is reviewing the possible expansion of local Marguerite shuttle service to continue to meet first/last mile transit needs and identify employee transit markets that would benefit from local bus services.
• Bicycle Commuters – Recognized as a Platinum Bicycle Friendly University, Stanford is a leader in accommodating and encouraging bicycles on its campus. Stanford has also taken steps to improve conditions for local bicycle travel, with infrastructure projects such as the Perimeter Trail and roundabouts at key intersections on campus. Approximately 20 percent of commuters bike to campus.1 Stanford is committed to increasing the bicycle mode split through its involvement in the City Manager’s Mobility Partnership organized in May 2016.2 To capture new bike commuters, Stanford is working with local jurisdictions to identify key bicycle improvements that would directly reduce the road stress for cyclists on access routes to campus.
• Parking Fees and Policies – Stanford began charging for parking on campus in 1972. The parking fees apply to employees, visitors and residents. Stanford continues to refine the parking permit program as a disincentive to single-occupancy drivers. Discouraging bulk parking permit
1 Approximately 12 percent of the employee population bike to campus. 2 The City Managers’ Mobility Partnership includes Palo Alto, Menlo Park, Mountain View, Redwood City and Stanford.

Stanford 2018 General Use Permit Transportation Impact Analysis Part 1 November 2016
11
purchasing, limiting geography for permit purchasing, and other types of programs will be continuously reviewed for their merit in helping to achieve the No Net New Commute Trips goal.
• Student Vehicle Prohibitions – As part of the 2000 GUP, Stanford implemented a policy that barred freshman from bringing their cars to campus. Expanding this type of program will also be considered to help achieve transportation goals.

Stanford 2018 General Use Permit Transportation Impact Analysis Part 1 November 2016
12
3: PEAK HOUR TRIP GENERATION
Due to the mix of land uses and the unique travel characteristics of a university setting, the trip generation rates used in the 2000 GUP EIR traffic analysis were developed from several sources including campus-wide traffic counts, campus residence traffic counts, and resident trip diary surveys conducted in 1998 – 1999. The rates used in the 2000 GUP EIR were based on continuation of the then-existing TDM programs, without assuming any expansion of those programs. For the 2018 GUP analysis, there is a need to update the Stanford campus trip generation rates to capture the current effects of the TDM program, and to account for travel characteristics that have changed since the 2000 GUP EIR. As was done in the 2000 EIR, the analysis conservatively does not assume expansion of the current TDM program, even though Stanford does intend to expand the program in order to continue to achieve the No Net New Commute Trips goal. To establish new trip generation rates for the campus land uses, a data collection and analysis effort similar to the effort used to prepare the 2000 GUP EIR was conducted again. Due to the ongoing monitoring by the County and annual employee surveys collected by Stanford, there is a substantial amount of available data on campus travel patterns. The available data was further supplemented by new data collection for campus uses, as detailed below.
DATA SOURCES
The following inputs were used to estimate current trip generation rates and to project future traffic growth under the 2018 GUP:
• 2015 peak hour campus cordon counts conducted for the 2000 GUP annual monitoring program;
• Vehicle trip counts, conducted in 2015 and 2016, of representative graduate student housing sites (Escondido Village) and faculty housing sites (Peter Coutts Circle and Mears Court);
• 2015 resident populations;
• 2015 academic and academic support square footage for the entire campus;
• Projections for changes in housing and academic and academic support square footage for the period from December 2015 through the fall 2018 under the 2000 GUP, and from fall 2018 through fall 2035 under the proposed 2018 GUP.
Fehr & Peers was provided the AECOM source files for the 2015 campus cordon count monitoring data. The cordon data is collected over a total of 8 weeks each academic year, 6 weeks in the spring and 2 weeks in the fall. The data collected includes 24-hour directional traffic counts at all 16 campus gateways. The data is collected and summarized in 15-minute intervals. In addition to the cordon count data, Fehr & Peers reviewed the annual reports available from the County to understand the amount of pass-through and medical center trips. The peak hour, peak period, and daily counts were used in the analysis of travel behavior.

Stanford 2018 General Use Permit Transportation Impact Analysis Part 1 November 2016
13
To supplement the cordon counts, Fehr & Peers conducted new counts for two housing types: faculty/staff housing and graduate student housing. For the faculty/staff housing, peak hour, peak period, and daily counts were conducted at two housing developments that could be easily isolated for counting. These locations included Mears Court (single-family detached units) and Peter Coutts Circle (medium density attached housing). To capture graduate student travel patterns, data was collected for Escondido Village which houses graduate students that are single, married, or have families; therefore, the counts capture spouse and other family member trips. The Escondido Village counts were collected at the same time as the spring 2015 annual monitoring. Undergraduate student housing sites are not easily isolated for traffic count purposes; therefore, the undergraduate resident trip rates were estimated from the graduate student resident rates based on proportional parking permit ownership data.
EXISTING 2015 TRIP GENERATION
Based on the data in the 2015 Annual Monitoring Report, the AM and PM peak hour traffic entering and exiting the campus in 2015 was:
• AM Peak Hour: 3,142 inbound trips, 1,790 outbound trips
• PM Peak Hour: 2,510 inbound trips, 3,257 outbound trips
The peak direction volumes (AM inbound and PM outbound) were taken directly from the report summary, and reflect the adjustments made to account for Stanford University Medical Center trips, campus trips outside the cordon, and cut-through trips. Since these adjustments weren’t made for the off-peak direction data, Fehr & Peers reviewed a sample of the directional data for each peak hour, and factored the adjusted peak direction volume to estimate the non-peak direction volume.
The traffic counts used to determine 2015 trips were collected during the fall and spring periods when Stanford was in session. Commuter trips to and from the campus would be lower during summer and holiday periods when fewer off-campus Stanford students would be traveling to and from the campus. Therefore, the trip generation and counts presented in this report are useful for evaluating peak trips for purposes of evaluating roadway and intersection congestion; the accompanying SB 743 VMT Analysis presents annualized data that is used in calculating annual emissions of greenhouse gases.
2015 TRIP GENERATION RATES
Fehr & Peers evaluated multiple methods of estimating existing peak hour trip generation rates for the campus. The selected method uses total academic and academic support square footage as the overall trip generation variable, with an additional step that separates resident trip generation out so that resident and non-resident trip generation can be distributed to the roadway network using unique trip distribution patterns for the two types of trips (commuter/other, and resident). Resident trip generation is more easily captured than non-resident (e.g., commuter/vendor/visitor) trip generation, because Stanford has reliable

Stanford 2018 General Use Permit Transportation Impact Analysis Part 1 November 2016
14
data on the resident populations in various housing areas; and it is possible to isolate and count the traffic generated by those areas. It is important to note that non-resident trip generation includes trips made by commuting students, faculty and staff as well as trips made by visitors to the campus including outside vendors, conference attendees, people traveling to and from campus for meetings, tour groups and individuals touring the campus, and visitors to galleries and performance and athletic venues.
Residential and non-residential trip generation are not independent factors at Stanford. As new on campus housing is constructed for students, faculty and staff, non-residential trips decrease because the students, faculty or staff living in that housing no longer drive to campus. While new on campus housing generates some new peak hour, peak direction trips, that residential trip generation is more than offset by the decrease in non-residential peak direction trips during the peak commute period. Therefore, the total trip generation rate based on academic and academic support space is a conservative rate, and would not be exceeded by constructing additional quantities of on campus housing.
Table 2 shows the observed total campus trip generation rates based on the 2015 measured traffic generation of the entire campus, in the first row. These results are based on 8 weeks of adjusted cordon counts intended to capture all trips into and out of the campus area. Resident-specific trip rates are then provided for faculty/staff residents, and for student residents, using the housing count data described above. The student resident rates represent both graduate and undergraduate residents, and include the trips made by spouses of resident graduate students that may not be affiliated with Stanford. The student rates were developed by weighting the graduate and undergraduate rates based on the total beds on campus in fall 2015.
TABLE 2: CAMPUS TRIP GENERATION RATES: 2015
Component (variable)
AM Peak Hour PM Peak Hour
Inbound Outbound Inbound Outbound
All Campus Trips (per ksf of academic and academic support space)
0.330 0.188 0.264 0.342
Student Residents (per bed)1 0.027 0.035 0.072 0.062
Faculty/Staff Residents (per residential unit) 0.15 0.28 0.26 0.19
Source: Fehr & Peers, September 2016

Stanford 2018 General Use Permit Transportation Impact Analysis Part 1 November 2016
15
TRIP GENERATION GROWTH: 2015 TO FALL 2018 (COMMENCEMENT OF PROPOSED 2018 GUP)
The number of residential and non-residential trips for the time period between December 2015 and fall 20183 were estimated via the following process:
Step A: Total new trip generation = (Growth in academic and academic support square footage) x (2015 campus trip generation rate)
Step B: Faculty/staff resident trip generation = (New residential units) x (2015 faculty/staff
residential trip generation rates) Step C: Student resident trip generation = (New student beds) x (2015 student residential trip
generation rates) Step D: Non-resident trip generation = Total campus trip generation – resident trip generation
Table 3 presents the remaining development authorized under the 2000 GUP. For purposes of this analysis, all of the remaining authorization is assumed to be permitted between December 2015 and fall 2018. Further, this analysis assumes that the net new academic and academic support square footage generates trips at the existing trip generation rate. This is a conservative assumption because Stanford intends to continue to achieve the No Net New Commute Trips goal, as it has done in each of the 15 years since issuance of the 2000 GUP.
TABLE 3: DECEMBER 2015 – FALL 2018 DEVELOPMENT SUMMARY
Component Beds / Units Academic Space (ksf)
Academic and Academic Support Space 769.354
Student (Beds) 2,476
Faculty / Staff (Dwelling Units) 0
Source: Stanford, July 2016.
Table 4 presents the resulting trip generation for this period, using the trip generation rates in Table 2.
3 This analysis captures the timeframe between the 2015 cordon counts and when the 2018 GUP would go into effect.

Stanford 2018 General Use Permit Transportation Impact Analysis Part 1 November 2016
16
TABLE 4: DECEMBER 2015 – FALL 2018 TRIP GENERATION ESTIMATE
Generator AM Peak Hour PM Peak Hour
In Out Total In Out Total
Total Campus Trips (based on academic space growth)
254 145 399 203 263 466
Student Residents 67 87 154 178 154 332
Faculty / Staff Residents 0 0 0 0 0 0
Total Resident Trips 67 87 154 178 154 332
Non-Residential Generators (Commuters, visitors, others)
187 58 245 25 110 134
Source: Fehr & Peers, September 2016
PROJECTED TRIP GENERATION -- 2018 GUP
The number of residential and non-residential trips for the time period between fall 2018 and the completion of development under the 2018 GUP were estimated via the following process:
Step A: Total new trip generation = (Growth in academic and academic support square footage) x (2015 campus trip generation rate)
Step B: Faculty/staff resident trip generation = (New residential units) x (2015 residential trip
generation rates) Step C: Student resident trip generation = (New student beds) x (2015 residential trip generation
rates) Step D: Non-resident trip generation = Total campus trip generation – resident trip generation
The development proposal included in the 2018 GUP application is shown in Table 5. The resulting AM and PM peak hour trip generation using the 2015 trip rates is shown in Table 6.
TABLE 5: 2018 GUP DEVELOPMENT PROPOSAL
Component Beds/Units Academic Space (ksf)
Academic and Academic Support Space 2,275
Student (Beds) 2,600
Faculty / Staff (Dwelling Units) 550 Source: Stanford, July 2016.

Stanford 2018 General Use Permit Transportation Impact Analysis Part 1 November 2016
17
TABLE 6: 2018 GUP TRIP GENERATION ESTIMATE
Generator AM Peak Hour PM Peak Hour
In Out Total In Out Total
Total Campus Trips (based on academic and academic support space growth)
751 428 1,179 600 779 1,379
Student Residents 70 91 161 187 161 348
Faculty/Staff Residents 83 154 237 143 105 248
Total Resident Trips 153 245 398 330 266 596
Non-Residential Generators (Commuters, visitors, others)
598 183 781 270 513 783
Source: Fehr & Peers, September 2016 Similar to the 2015-2018 time period, above, this analysis assumes that the net new academic and academic support square footage generates trips at the existing 2015 trip generation rates. Again, this is a conservative assumption because Stanford intends to continue to achieve the No Net New Commute Trips goal during the duration of the 2018 GUP. Doing so would prevent peak direction peak hour trips from increasing.
Without further trip reductions and trip credits, the 2018 GUP would be expected to generate a total of 751 additional inbound vehicle trips in the AM peak hour and 779 additional vehicle outbound trips in the PM peak hour. Table 6 includes detailed information about the directionality of trips and how many are attributable to residential units and how many are attributable to growth in academic and academic support space.
Figure 3 shows the 2015 trip generation during the AM and PM peak hours, and the estimated trip generation for the period between fall 2015 – fall 2018 and for the growth proposed for the 2018 GUP.
Figure 4 shows the relationship between resident and non-resident peak hour trip generation with the introduction of additional on-campus housing. There is an initial shift in the percent of residential trips with the introduction of additional on-campus student housing in 2018 and a further shift with the introduction of additional faculty / staff and student housing in 2035.

Stanford 2018 General Use Permit Transportation Impact Analysis Part 1 November 2016
18
Figure 3: Existing and Projected Trip Peak Hour Trips Source: Fehr & Peers, September 2016
Figure 4: Change in Proportion of Resident and Non-Resident Peak Hour Trips Source: Fehr & Peers, September 2016.
Stanford 2018 General Use Permit Transportation Impact Analysis Part 1 November 2016
19
4: STANFORD TRIP DISTRIBUTIONS
STANFORD OFF-CAMPUS COMMUTER DISTRIBUTION
Stanford’s annual commuter travel survey (2015) and information on commuter place of residence were used to develop a commuter vehicle trip distribution for the campus. Using the survey responses regarding primary mode of travel to the campus along with the place of residence, it was possible to establish the commuter mode choice for specific geographic areas. The commuter mode choice by geography was combined with the total number of commuters within a geographic area to estimate the number of drivers from each area. Adjustments were made to the survey response to remove bias due to participation of those in the Clean Air Cash program for each geographic area.
The steps used to develop the commuter trip distribution are described below:
• A GIS map layer was created using the survey responses for primary commute mode to campus. • The commute mode map layer was overlaid over the place of residence for all Stanford
employees. • The 9 county Bay Area Region was broken down into 31 geographic subareas that had a large
enough number of survey responses and a sufficient number of total employees to be statistically significant.
• Within each geographic area adjustments were made to the primary commute mode data to account for the different response rates of employees that participate in the Clean Air Cash program versus non-participants.
• The adjusted commuter mode split calculated for each geographic subarea was applied to the total number of employees within the subarea to create the final distribution for commute drivers.
Figure 5 shows the adjusted mode splits sorted by the SOV mode choice for each geographic subarea. There are clear and consistent patterns in the commute travel mode based on the availability of, and proximity to, alternative modes such as Caltrain (East San Francisco and then along the Peninsula) and the Dumbarton Express bus service (Newark and Fremont). It also shows relatively high auto use within 10 miles of the campus and relatively high bicycle use for communities within 5 miles of the campus.
Table 7 summarizes the geographic distribution of employees that primarily commute by autos (SOV and HOV) and indicates the major roadways that would likely be used to approach the campus. Figure 6 shows the distribution of traffic as it approaches Palo Alto and the Stanford Campus. This distribution is based on the existing travel patterns will be used to represent travel behavior in the period from 2015 to 2018.

Stanford 2018 General Use Permit Transportation Impact Analysis Part 1 November 2016
20
Figure 5: Stanford University Employee Mode Share Source: Stanford Parking & Transportation Services & Fehr & Peers, 2016

Stanford 2018 General Use Permit Transportation Impact Analysis Part 1 November 2016
21
TABLE 7: PERCENT OF STANFORD AFFILIATES (DRIVING) BY GEOGRAPHIC AREA
Location Roadways Percent North of Campus Local Menlo Park East – ECR to Bay ECR North 2.08% Menlo Park West – ECR to I-280 Santa Cruz 4.35% Atherton ECR North, Santa Cruz 4.99% Redwood City / San Carlos ECR North, Santa Cruz 4.47% 15.9% Regional Belmont / Foster City / Hillsborough I-280, ECR North 4.65% South San Francisco / Daly City I-280, Alpine, Sand Hill 1.94% City of San Mateo / Burlingame I-280, Alpine, Sand Hill 3.23% Sunnyvale / Santa Clara I-280, Alpine, Sand Hill 1.64% North Bay – Marin / Napa / Sonoma Counties I-280, Alpine, Sand Hill 0.96% San Francisco (East) – good Caltrain access I-280, US101 3.70% San Francisco (West) – poor Caltrain access I-280 3.02% 19.1% South of Campus Local Los Altos Foothill 3.36% Los Altos Hills Foothill, Page Mill 1.82% Mountain View North of Central Expressway ECR South, Foothill 3.09% Mountain View South of Central Expressway ECR South, Foothill 5.95% Palo Alto South of ECR & Page Mill Road ECR South, Foothill 2.92% 17.1% Regional Santa Clara County I-280, US 101 0.51% Santa Cruz County I-280, US 101 1.43% Santa Clara, Sunnyvale, North San Jose US 101, ECR South, Foothill 4.89% Campbell / Central San Jose I-280 4.72% Cupertino / Saratoga / Santa Clara I-280, Foothill 6.29% Northern San Jose / Fremont / Milpitas US 101 1.85% South San Jose US 101, I-280 3.37% Downtown – East San Jose I-280 1.80% South Counties – Monterey, San Benito I-280 0.30% 25.2% East of Campus Local Palo Alto East Oregon, ECR South 3.53% Palo Alto North University, Embarcadero 6.85% 10.4% Regional Fremont / Newark / East Alameda County Dumbarton, SR 237, US 101 5.48%
Oakland / Berkeley / West Alameda County
Dumbarton, US 101 [North]—[Does this mean north of Dumbarton?] 3.17%
Contra Costa / Solano Counties Dumbarton, US 101 North 1.67% 10.3% West of Campus Local Portola Valley, Woodside Alpine Road, Sand Hill 1.99% 2.0% 100.00% 100.00%
Source: Stanford Parking & Transportation Services & Fehr & Peers, 2016

£101
!"#280
·|}þ114
·|}þ84
·|}þ109
·|}þ82
Sand
HillRd
Sant
a Cru
z Ave
Laurel St
University Ave
Embarcadero Rd
Athe
rton
Ave
Va lpar
aiso
Ave
University Dr
Will
owRd
el Camino RealFoothill Expy
San
Anto
nio
Rd
Orego
n Exp
y
JuniperoSerra Blvd
Page
Mill
Rd
Westridge D r
Alma St
Middlefield Rd
XX% Internal Trip Distribution
15%
9%
13%
2%
3%
13%
2.5%
2.5%
2%
UUUUUUUUUUUUUUUUUUnnnnnnnnnnnnnnniiiiiiiiivvvvvvvvvveeeeeeeerrrrrrrrrrrssssssssiiiiiiiiiittttttttttttyyyyyyyyyyyyyyyyy AAAAAAAAAAAAAAAAAAAAAvvvvvvvvvvvvvvAAA eeeeeeee
rccaddddddddeeeeerrrrrrrrooooooooo RRRRRRRRRRRRRRRddddddddddddddddddd113%
7%7%
££
LLauurreelll SSSSSttt
eldddddddddddd RRRRRRRRRRRRRRddddddddddddddd 2%2%
OOOOOOOOOOOOOOOOOOOrrrrrrrrreeeeeeeeegggggggggggoooo
nn
3%
3.5%3.5%4.5%18%
0.5%
1.5%
8%
6%1%
1%
1.5%
9%
16%
11.5%
4% 5%
W:\S
an J
ose
N D
rive\
Pro
ject
s\_S
J15_
Pro
ject
s\S
J15_
1585
_Sta
nfor
d_G
UP
\Gra
phic
s\A
DO
BE
\Fig
6_20
15-2
018
Dis
trib
utio
n of
Sta
nfor
d Co
mm
uter
s.ai
2015-2018 Distribution of Stanford CommutersUsing Auto Trip Place of Residence
XX% Project Trip Distribution
Figure 6
Source: Stanford P&Ts Commuter Survey
The cumulative 2035 conditions will also take into account the official forecasts of the redistribution of regional housing under the Plan Bay Area Regional Transportation Plan and Sustainable Communities Strategy. Initial investigations suggest that this may increase commute travel from beyond the study area by 2-3%, and reduce commute trips within the study area by a similar percentage.

Stanford 2018 General Use Permit Transportation Impact Analysis Part 1 November 2016
23
For cumulative 2035 conditions, the analysis will be based on current employee patterns but will also take into account the official forecasts of the redistribution of regional housing under the Plan Bay Area Regional Transportation Plan and Sustainable Communities Strategy. The housing and trip distribution represented in the ABAG, MTC and VTA Plan Bay Area 2040 regional land use and travel model define the appropriate adjustments to existing residence patterns to be reflected in the TIA. Initial investigations suggest that this may increase the percentage of commute travel from beyond the study area boundaries by 2-3%, and reduce residence commute trip distribution from within the study area by a similar percentage.
STANFORD RESIDENT DISTRIBUTION
While Stanford collects data on resident travel behavior in the annual transportation survey, there is limited information on off-campus destinations. Therefore, the trip distribution for Stanford residents (faculty, staff and students) was developed using data from the Census Transportation Planning Products (CTPP)4. The CTTP data for the Stanford campus and residents come from three census tracts that include the following areas:
• West campus where some of the undergraduate housing is located, • East campus including some undergraduate dorms along with Escondido Village and Raines House
where graduate student housing is located, and • Southwest campus where faculty and staff housing is located.
The census tract that includes faculty and staff housing also includes the residential neighborhoods of College Terrace, Evergreen Park, and South Gate. The campus census tracts do on include the Stanford medical center or shopping center. Therefore, this census tract was considered an employment center and an off-campus destination for Stanford residents.
The data for these three census tracts were combined to develop an off-campus distribution for all Stanford resident trips. The off-campus travel trip distribution was calculated by removing trips to the Stanford campus census tracts, which represented approximately 44% of the total trips. The remaining trips were used to calculate the percent of trips to each destination (city or county).
Table 8 summarizes the distribution of trips base on the CTPP data for Stanford residents. After making the off-campus adjustment described above, approximately 55% of the resident trips were assigned to destinations within the City of Palo Alto. The CTPP data provided some detail regarding the trips to specific census tracts within the City of Palo Alto; therefore, trips within Palo Alto were assigned to four geographic areas:
4 US Census Transportation Planning Products Journey to Work from Place of Residence. http://ctpp.transportation.org/Pages/5-Year-Data.aspx

Stanford 2018 General Use Permit Transportation Impact Analysis Part 1 November 2016
24
• Downtown and northern Palo Alto – north of Oregon Expressway and east of El Camino Real • Southeast Palo Alto – south of Oregon Expressway and east of El Camino Real • Southwest Palo Alto – south of the campus and west of El Camino Real (includes research park) • Medical center and shopping center
Figure 8 shows the trip distribution for Stanford residents. This distribution will be used for both the near-term (2015 – 2018) and cumulative analysis (2018 – 2035) conditions.

Stanford 2018 General Use Permit Transportation Impact Analysis Part 1 November 2016
25
TABLE 8: STANFORD RESIDENCE OFF-CAMPUS DESTINATIONS GEOGRAPHIC AREA
Location Roadways Percent Palo Alto Local Palo Alto – Downtown University, Embarcadero 10.0% Palo Alto – Medical Center / Shopping Center Campus Dr., ECR, Junipero Serra 20.0% Palo Alto – South of Oregon / East of ECR Oregon, ECR, Alma 5.0% Palo Alto – California Avenue / Research Park ECR, Foothill 20.0% 55.0% North of Campus Local Menlo Park, Atherton ECR North 3.9% Redwood City / San Carlos ECR North, Santa Cruz 3.4% 7.3% Regional Northern Peninsula – Belmonte to Millbrae I-280, Alpine, Sand Hill 1.8% San Francisco I-280 4.1% South San Francisco / Daly City I-280, Alpine, Sand Hill 0.6% 6.5% South of Campus Local Los Altos Foothill 0.4% Mountain View ECR South, Foothill 6.8% 7.2% Regional Santa Clara County I-280, US 101 0.8% Santa Cruz County I-280, US 101 1.0% Santa Clara, Sunnyvale, North San Jose US 101, ECR South, Foothill 6.2% Campbell / Central San Jose I-280 0.2% Cupertino / Saratoga / Los Gatos I-280, Foothill 1.1% Downtown – East San Jose US 101, I-280 8.3% South San Jose I-280 0.5% 18.1% East of Campus Local East Palo Alto University, Embarcadero 0.6% 0.6% Regional Alameda County Dumbarton, US 101 3.3% Contra Costa County Dumbarton, US 101 1.1% Fremont / Milpitas Dumbarton, US 101 0.7% 5.1% West of Campus Local Portola Valley, Woodside Alpine Road, Sand Hill 0.4% 0.4% 100% 100%
Source: US Census Transportation Planning Products & Fehr & Peers, 2016

XX%
£101
!"#280
·|}þ114
·|}þ84
·|}þ109
·|}þ82
Sand Hill Rd
Sant
a Cru
z Ave
Laurel St
University Ave
Embarcadero Rd
Athe
rton
Ave
Va lpar
aiso
Ave
University Dr
Will
owRd
el Camino Real
Foothill Expy
San
Anto
nio
Rd
Orego
n Exp
y
JuniperoSerra Blvd
Page
Mill
Rd
Westridge D r
Alma St
Middlefield Rd
3%
4%
0%0.5%
5%
UUUUUUUUUUUUUUUUUUnnnnnnnnnnniiiiiiiiiiivvvvvvvvvvvvvvvveeeeeeeeerrrrrrrrrrrssssssssiiiiiiiiittttttttttyyyyyyyyyyyyyyyyyyy AAAAAAAAAAAAAAAAAAAAAAvvvvvvvvvvvvAAAAAA eeee
EEEEEEEEEEEEmmmmmmmmmmmmmmmmmbbbbbbbbbbbbbbaaaarrcca
10%10%
5%5%
FFFFFFFFFFooooooooooooooooooottttttttttttthhhhhhhhhhhhhhhhiiiiiiiiillllllllllllllllll EEEEEEEEEEEExxxxxxxxpppppppppppppyyyyyyyyyy
MMill
RRRRRRRRddddddddddd 20%20%
WWWWWWWWWWWWiiilll
o
1%1%
6%
3%
3%
2%
2%
2%15%
4%
1% 4%
3%
8%
4%
15%
2%
Unniivvvvvvvvvvveeeeeeerrrrrrrrrssssssiiiiiittttttttttyyyyyyyyyy DDDDDDDDDDrrrrrrr
20%20%
W:\S
an J
ose
N D
rive\
Pro
ject
s\_S
J15_
Pro
ject
s\S
J15_
1585
_Sta
nfor
d_G
UP
\Gra
phic
s\A
DO
BE
\Fig
7_Tr
ipD
istri
butio
n_A
uto_
Off_
Cam
pus.
ai
Figure 7 Distribution of Stanford Residents
Using Auto Off-Campus
XX% Project Trip Distribution
Source: US Census, CTPP Data Stanford, CA
Internal Trip Distribution

Stanford General Use Permit Transportation Study August 2016
APPENDIX A
STANFORD TDM PROGRAM

Stanford General Use Permit Transportation Study August 2016
1
ACTIVE TRANSPORTATION PROGRAM
A large proportion of Stanford employees and students live within three to five miles of campus which facilitates active transportation modes. The campus itself is approximately two miles wide and relatively flat. These factors alone make walking and biking very attractive; however, infrastructure and support mechanisms are in place to ensure that people have the resources they need and to facilitate a culture of active transportation commuting.
BICYCLE PROGRAM
Bicycle programs encourage employees and students to bike by creating biking groups or buddies, providing incentives for cyclists and providing resources and information on bicycling. Stanford provides ongoing bicycle safety classes and conducts outreach to students to promote bicycle safety awareness. The program includes a student-to-student exchange to promote peer education.
In addition to safety messaging, Stanford conducts ongoing promotions such as bicycle giveaways and other financial incentives. Stanford also provides a commute buddy program which matches experienced bicyclists with new ones to assist them in adjusting to the commute. The experienced bicyclist will provide guidance on how to load bicycles onto transit vehicles, which routes to take to and from campus, as well as what kind of gear is needed during the fall and winter to be prepared for rain. Stanford provides a rider’s guide with bicycle routes, lanes, and paths to campus making it easier for people to bike and walk.
Bicycle commuters ride in a “bike train”; Source: Fehr & Peers, 2015.

Stanford General Use Permit Transportation Study August 2016
2
BICYCLE SHOP AND REPAIR FACILITIES
Stanford has a full service bike shop on campus that also provides bike rentals and sales. The bike shop website provides a variety of resources including safety and security education as well as maps and links to other bike resources.
Bike repair stations at key locations allow cyclists to conduct repairs as needed. This encourages commuters to bike because it is a convenient way to make routine repairs and maintenance. It also gives riders peace of mind if they choose this mode choice as their primary transportation option. Do-it-yourself bike repairs stands include an air pump and basic tools such as Phillips/Flat-head screwdrivers, 15/32 mm combination wrench, 8/9/10 mm combination wrenches, tire levers, Torx wrench, and Allen wrenches. Stanford has installed bicycle repair stations around the campus at centralized locations.
BICYCLE PARKING, SHOWERS, AND LOCKERS
Stanford provides locker and shower rentals for students and employees on campus in addition to bicycle rack parking throughout campus. Strategic bike parking locations on campus give employees and students more direct access to building facilities. Showers and lockers also promote biking and walking as it gives people a clean, easily accessible place to shower and get ready for work or school after their morning bicycle or walking commute.
BICYCLE RENTALS
A bicycle rental program provides flexibility for people who want to use bicycles as a form of transportation on a short-term basis. This helps eliminate vehicle trips made during the day by providing mobility options for people who chose to carpool, walk or take transit to work. Bicycle rentals are also effective in reducing vehicle trips when visitors are on campus and they need a mode to move about the campus without using a car.
BICYCLE AND PEDESTRIAN CONNECTIVITY AND ACCESS IMPROVEMENTS
Stanford has invested large amounts of time, effort and funding to implement bicycle and pedestrian facility improvements around the campus providing connectivity, access and safety for cyclists. The campus utilizes
Bike repair station, Source: www.locallygrownnorthfield.org

Stanford General Use Permit Transportation Study August 2016
3
Class I (off-street) and Class II (on-street) bicycle lanes. The recently completed 3.4 mile Perimeter Trail is the longest bicycle facility Stanford has invested in thus far. The Perimeter Trail is a high quality facility that parallels El Camino Real and Stanford Avenue the length of these campus frontages. It provides circulation within the campus and connects to other facilities in Palo Alto and Santa Clara County.
The Stanford campus is well connected to the surrounding neighborhoods and also includes a comprehensive network of pedestrian facilities within the campus to connect the various campus uses. These attractive and safe connections between buildings and the surrounding streets encourage people to walk more. Green spaces are integral to the design of the campus. The wide pedestrian pathways and small green spaces create a safe, comfortable walking environment for internal pedestrian trips.
CAMPUS DESIGN
The design of a site can facilitate walkability by creating an environment scaled to a human rather than a vehicle. Landscaping, paths, building fronts and other features provide non-motorized modes an opportunity to have an enjoyable experience as well as feel safe. Parking lots, driveways, large amounts of asphalt and other automobile oriented features introduce intermodal conflicts and are unattractive features for a pedestrian or bicyclist. By slowing down vehicle traffic or eliminating it completely from major pedestrian and bicycle facilities, safety for non-motorized modes is greatly increased. Additionally, by providing onsite amenities and services people do not have to leave campus in the midday to get their daily needs met.
ON-SITE AMENITIES AND SERVICES
Amenities and services located on-site can help to reduce the number of trips an employee or student needs to make during a regular day. Onsite amenities include, but are not limited to, the following: cafeterias, restaurants and coffee shops, book store, a full service post office, daycare centers, ATMs, barbershop, and fitness facilities (open to anyone with a Stanford ID). Stanford has designed a campus that connects these various amenities to student and employee activity areas.
BUILDING AND CAMPUS DESIGN
A pedestrian-friendly environment is created by orienting building entries towards plazas, parks, or adjacent roadways with pedestrian facilities, which encourages people to walk more. Stanford’s campus design creates a walkable environment, which facilitates the use of alternative modes when combined with the numerous facilities and resources provided to students and employees who chose a mode other than driving alone.

Stanford General Use Permit Transportation Study August 2016
4
TRAFFIC CALMING & ROUNDABOUTS
To create a pedestrian and bicycle-friendly environment which in turn promotes site access via non-automobile modes, traffic calming features, including bulb-outs and crosswalks, have been installed on internal campus streets. These features reduce vehicle speeds and create a safe, comfortable environment for pedestrians and bicyclists. Three new roundabouts have also been introduced on campus to improve safety and traffic operations on campus. A fourth roundabout is currently under construction and will open in fall 2016. The use of roundabouts on Campus Drive achieves a policy of not having traffic signals on campus while creating a better experience for pedestrian, bicyclists and auto users. The roundabouts have replaced traditional all-way stop sign locations.
FINANCIAL INCENTIVES
Financial incentives can motivate people to use alternative modes by offsetting the financial cost of using those modes to provide a greater financial gain for the employee. When combined with positive messaging, financial incentives that assist people with their commute can be very effective.
PRE-TAX COMMUTER BENEFITS
The IRS tax code allows employers to set aside pre-tax income for employee commute expenses. Providing tax benefits to employees who choose to utilize non-drive alone transportation modes during their commute to and from work provides them with a financial incentive to use these alternative modes. In addition to providing transit passes for Caltrain and the VTA system, Stanford provides pre-tax commuter benefits for people using other transit systems or to pay for Caltrain parking permits.
CAR SHARE RENTAL AND CARPOOL CREDITS
People who join the Commute Club and rideshare are eligible for carpool credit to partially offset the cost of a carpool permit. Each member of the carpool is eligible for up to $150 of credit. Additionally members of the Commute Club are eligible for up to $102 per year in Zipcar driving credits and up to 12 free hourly car rental vouchers for use with Enterprise.
COMMUTE CLUB GIVEAWAYS & PARKING PERMIT RETURN PROMOTION
Stanford provides other financial incentives in the form of rewards for people who consistently commute using an alternative mode. In 2014 prizes valued at over $10,000 were given away throughout the year to

Stanford General Use Permit Transportation Study August 2016
5
people who pledged to commute using an alternative form of transportation. Additionally, in the 2015-2016 academic year Stanford is providing financial rewards to people who turn in their long-term parking commuter permit.
MARKETING AND SUPPORT
Marketing the TDM program by providing readily available information to employees increases awareness and improves participation. Clear messaging and information ensures that multiple TDM options are well understood. Stanford’s marketing program is extensive and includes positive messaging that helps create a culture of sustainable transportation awareness.
WEBSITE AND ONE-STOP SHOP FOR INFORMATION
Stanford maintains an all-inclusive website with commute planning tools and up-to-date information on transportation resources. The website includes educational resources such as commute cost and carbon emissions calculator. Having a one-stop-shop in the form of a website with bountiful resources empowers commuters to make alternative commuting choices easily and quickly.
GUARANTEED RIDE HOME PROGRAM
Employees who use transit, carpools, or vanpools are guaranteed a ride home in case of emergency or if they need to work late which helps reduce concerns about using alternative modes. Having this program encourages employees to not drive alone to work. When an emergency occurs a commuter can either call Parking & Transportation Services to request a taxi or they can make their own arrangements and receive reimbursement at a later date.
PERSONALIZED COMMUTE PLANNING SERVICES
The Parking & Transportation Services website provides commute planning services that include links to transportation resources, mapping an individual’s commute and a contact form to receive personalized assistance for planning an individual commute. This type of personalized assistance is important for people with disabilities or who are not used to navigating transit systems or bicycle facilities. This resource combined with the Commute Buddy program makes it easy for a commuter to navigate the numerous transportation systems surrounding the campus.
E-UPDATES FOR COMMUTE CLUB
A monthly eUpdate, or newsletter, is sent out to all Commute Club members. The eUpdate includes stories that reinforce positive messaging and provides information on road closures, changes to the transit system or other relevant commuter information.

Stanford General Use Permit Transportation Study August 2016
6
CAR RENTAL AND CAR SHARE
Car sharing or rental programs on-site give employees who do not normally drive to work access to a vehicle. Employees who commute to work by biking, taking transit, or participating in carpools,can utilize a vehicle located on-site for errands or meetings. This helps reduce concerns and inconveniences of not having a vehicle during the day. Stanford provides credits for ZipCar as well as vouchers for Enterprise which allows commuters access to a vehicle during the work/school day. This continues to encourage individuals to use alternatives modes for commuting to and from the campus.
NEW EMPLOYEE & STUDENT ORIENTATION
When employees start working at Stanford they are provided with an orientation to the numerous resources for commuting other than driving alone. This provides employees with an opportunity to ask questions and start forming sustainable commute habits early on in their career with Stanford. This program has helped to engrain the culture of sustainable transportation in the employee base at Stanford. Additionally, new students are provided with pamphlets and other information resources to plan their commutes to and from campus.
PROMOTIONAL EVENTS AND POSITIVE MESSAGING
By using positive messaging to convey the benefits of carpooling, transit, and active modes, employees are encouraged to use alternative modes. Events like transportation fairs provide information on alternative modes in the context of a fun event, which sends positive messaging to employees. Those who currently use these modes will feel good about their decisions and continue using them. In addition, employees may find commute buddies interested in riding transit, biking, or walking to work together which helps to create a culture of alternative commuting.
COMMUTE BUDDY
Having companions when commuting to work can make it more enjoyable and safe. The commute buddy program pairs more experienced commuters with inexperienced commuters. This allows first time bicycle, transit or pedestrian commuters to get familiar with the routes and traffic patterns. It can also encourage bicycle and pedestrian safety by forming groups of people to “bike train” or “walk train” into work.
OTHER MEASURES
Measures that do not fit within the categories already described are included as “other” measures.

Stanford General Use Permit Transportation Study August 2016
7
TELECOMMUTING/FLEXIBLE WORK SCHEDULE PROGRAM
Telecommuting allows employees to work remotely via telecommunications, reducing trips made to the employer site. Additionally, flexible work schedules allow employees to set or modify their arrival and departure times which can alleviate some demand during typical peak travel periods and may provide the flexibility people need to use alternative modes of transportation. Other types of alternative work schedules, such as compressed schedules or staggered work hours, can be incorporated by managers to create more flexibility for employees.
TRANSPORTATION & PARKING SERVICES DEPARTMENT
The Transportation & Parking Services Department supports the Stanford campus by planning for its parking and transportation needs. In addition to planning for the long-term transportation infrastructure needs of the campus, the department manages the very robust TDM program and has staff on board developing, marketing, implementing, and evaluating the TDM program. Having dedicated personnel on campus makes the TDM program robust, consistent and reliable. Employees and students have a designated point of contact for questions about the various TDM measures, which allows them to easily stay informed on various TDM functions and program eligibility.
COMMUTER SURVEYS
Surveys are key for effective marketing and for targeting the TDM program to commuter needs, residential location and preferences. Surveys are administered by Stanford’s Parking & Transportation Services Department. They are conducted at regular intervals, typically on a semi-annual or annual basis, in order to keep track of transportation behavior changes and preferences. Incentives are provided to complete the survey which boosts participation.
PARKING MANAGEMENT
Parking policies can effect driving behavior by requiring the user to pay for the cost of the parking space rather than taking for granted the availability of free parking.
TIERED PARKING PRICING & PARKING MONITORING
There are several parking permit types that commuters and residents can purchase for campus use. Student residents are only allowed to have one vehicle on campus and are not allowed to purchase the commuter parking permits. These permits are only valid for the residential location for which they were purchased. All permits can be purchased on a monthly, academic year or annual basis.

Stanford General Use Permit Transportation Study August 2016
8
FRESHMAN PARKING POLICY
Stanford students are not permitted to bring cars to campus for the duration of their freshman year (Fall through Spring quarters). This includes students who have enough credits to be considered sophomores at any time during their first academic year at Stanford. Parking restrictions have been applied to freshmen, as they are the least impacted by a “no vehicle” policy. Freshmen are required to live in residence halls with board plans, and any freshman who needs employment can obtain a job on campus. Freshmen are also supported by a wide array of special social activities in their residence halls and elsewhere on campus.
PARKING LOCATION AND CONFIGURATION
The campus includes parking located away from building frontages which does not impede access to the building by other modes. It also provides a more attractive street frontage for pedestrians and bicyclists.
RIDESHARE
Stanford University is a regional employer that attracts people from all over the San Francisco Bay Area. The University spends a lot of resources to supplement existing transit services and to get people onto bicycles or walking. However, some people do not live close enough to transit facilities to use them or their schedule may not be conducive to using transit. For these people ridesharing can be a great resource as it provides a door to door commute service and is highly flexible.
PASSENGER LOADING ZONES
The Stanford campus has pick up and drop off zones at strategic locations that provide more convenient access to/from major buildings for modes other than drive alone. This can improve carpool and vanpool ridership by providing convenient passenger access near the main entries to buildings or other centralized locations that generate high pedestrian traffic.
PRIORITY PARKING
Reserved parking spaces for carpools and vanpools near major building entrances prioritize non-single occupancy mode choices. Stanford provides these parking spaces for employees commuting in carpools or vanpools.
Priority parking sign, Source: Fehr & Peers

Stanford General Use Permit Transportation Study August 2016
9
RIDESHARE MATCHING SERVICES
Rideshare programs help facilitate carpool and vanpools by matching drivers and passengers based on location and schedules. Stanford provides a variety of ride matching services including access to 511.org, customized commute planning, online ride matching with other Stanford employees, and listing vanpools online with contact information.
SUBSIDIZED VANPOOLS AND CARPOOLS
Stanford provides financial incentives for those who participate in vanpools or carpools including Carpool Credits, described above, which are earned through membership in the Commute Club. Additionally vanpools receive a $300 per month subsidy to defray the cost of monthly vanpool expenses.
TRANSIT
There are many transit systems in the San Francisco Bay Area (refer to Figure 1). Navigating these systems can be overwhelming even for experienced transit riders. Stanford provides several resources to assist people in using the transit system in addition to providing an extensive shuttle system that connects to the various transit services.
MARGUERITE SHUTTLE SYSTEM
Operation of shuttle services to the nearby transit centers provides a critical last-mile connection for people who choose to travel on public transit. Stanford’s extensive Marguerite Shuttle System provides service to the East Bay, several Caltrain stations as well as around campus. The shuttle system is free and open to the public for use.
FREE TRANSIT PASSES
Employer subsidized transit passes are an effective way to get people using the transit system. By providing employees with a free alternative to driving alone Stanford increases the attractiveness of transit. Stanford provides both Go Passes and Eco Passes which allow free use of VTA buses and light rail, the Dumbarton Express, the Highway 17 Express, the Monterey-San Jose Express, and Caltrain.
TRANSIT RIDERS GUIDE
Stanford’s website contains a comprehensive listing of transit agencies. Stanford also provides a guide with Marguerite transit routes and schedules. The commute planning assistance website described above helps employees and students plan trips via transit, whether it’s for a commute trip or a quick errand or off-site

Stanford General Use Permit Transportation Study August 2016
10
meeting nearby. Stanford also provides real time travel information for the Marguerite shuttle system using the Zoute public transit app.

Ä391
ÄPX
Ä522
ÄRXÄ390
Ä182
Ä104
Ä102Ä103
Ä101
Ä397
ÄU
ÄKX
ÄDB3
ÄDB
ÄDB1
ÄM
®72
®73
®271
®89
®274
®34
®52
®83
®88
®281
®53
®40
®280
®35
®32
®296
®297
®22
®85
®295
N:\PR
OJEC
TS\O
ther_O
ffice_
Proje
cts\_S
J Proj
ects\
SJ15
-1585
_Nex
t GUP
\GIS\
Trans
it Figu
re\Tra
nsit F
igure\
Fig2T
ransit
.mxd
Figure 1
Marguerite Shuttle System and Transit Services
Stanford Marguerite ShuttleCaltrainLight RailRegional/Express BusLocal Bus
Stanford LandsWaterParksAirports

WindyHill OS
Aras
trade
roPr
eserv
e
SMC
SSE
SPSHD
SR
SW
SN
STECH
SY
SEB
SC
SAE-F
SOSOCA
SCA
SSLAC
SRP
SS
SVA
S1050A
ÄRXÄ397
Ä390
Ä522
ÄDB3
ÄU
ÄDB1
Ä182
Ä104
ÄKX
ÄDB
Ä102Ä101
Ä103
®72
®88
®271
®297
®22
®35
®89
®296®83
®281
®280
®295
®85
W:\W
alnut
Cree
k N D
rive\P
ROJE
CTS\O
ther_O
ffice_
Proje
cts\_S
J Proj
ects\
SJ15
-1585
_Nex
t GUP
\GIS\
Trans
it Figu
re\Tra
nsit F
igure\
Fig2T
ransit
_Stan
fordD
etail.m
xd
Figure 1
Marguerite Shuttle System and Transit Services
Stanford Marguerite ShuttleCaltrainRegional/Express BusLocal Bus
Stanford Lands
WaterAirports

APPENDIX B: TRIP GENERATION COUNTS

3AM PETER COUTTS RD & PETER COUTTS CIRCLE.xls - Vehicles
Start Time Right Thru Left Peds Right Thru Left Peds Right Thru Left Peds Right Thru Left Peds07:00 AM 1 9 1 0 2 0 2 0 1 22 5 0 2 0 2 107:15 AM 1 10 1 0 3 0 2 0 0 24 9 0 3 0 1 207:30 AM 3 15 0 6 2 1 5 0 0 41 11 1 9 1 3 607:45 AM 16 34 0 22 2 1 7 1 3 41 41 0 19 0 7 208:00 AM 5 28 2 7 2 2 8 0 2 34 11 0 30 1 7 708:15 AM 1 18 0 0 0 2 8 0 0 24 5 0 8 0 3 108:30 AM 3 14 2 3 5 0 1 0 4 20 4 2 8 0 1 508:45 AM 2 19 1 3 2 0 4 0 4 32 4 0 11 0 5 2
7:15 - 8:15 25 87 3 9 4 22 5 140 72 61 2 18 4487:30 - 8:30 25 95 2 6 6 28 5 140 68 66 2 20 4637:45 - 8:45 25 94 4 9 5 24 9 119 61 65 1 18 4348:00 - 9:00 11 79 5 9 4 21 10 110 24 57 1 16 347
File Name: C:\TMC Data\Data 2015\FP Stanford 10-15\3AM FINAL.ppdStart Date: 10/8/2015Start Time: 7:00:00 AMSite Code: 00000003
Comment 1: 0Comment 2: 0Comment 3: 0Comment 4: 0
PETER COUTTS RDSouthbound
PETER COUTTS CIRCLEWestbound
PETER COUTTS RDNorthbound
RAIMUNDO WAYEastbound

3AM PETER COUTTS RD & PETER COUTTS CIRCLE.xls - Bikes
Start Time Right Thru Left Peds Right Thru Left Peds Right Thru Left Peds Right Thru Left Peds07:00 AM 0 1 0 0 1 0 0 0 0 0 0 0 0 0 0 007:15 AM 0 0 0 0 0 0 0 0 0 0 0 0 0 0 0 007:30 AM 0 0 1 0 0 0 5 0 0 0 0 0 4 1 1 007:45 AM 0 1 0 0 0 2 3 0 0 2 1 0 5 1 0 008:00 AM 0 5 0 0 2 1 4 0 0 0 0 0 3 0 2 008:15 AM 0 3 0 0 2 0 1 0 0 1 0 0 1 0 3 008:30 AM 0 0 0 0 0 0 0 0 0 1 0 0 1 0 0 008:45 AM 0 9 0 0 1 0 0 0 0 0 0 0 0 0 5 0
File Name: C:\TMC Data\Data 2015\FP Stanford 10-15\3AM FINAL.ppdStart Date: 10/8/2015Start Time: 7:00:00 AMSite Code: 00000003
Comment 1: 0Comment 2: 0Comment 3: 0Comment 4: 0
PETER COUTTS RDSouthbound
PETER COUTTS CIRCLEWestbound
PETER COUTTS RDNorthbound
RAIMUNDO WAYEastbound

3PM PETER COUTTS RD & PETER COUTTS CIRCLE.xls - Vehicles
Start Time Right Thru Left Peds Right Thru Left Peds Right Thru Left Peds Right Thru Left Peds04:00 PM 2 26 2 7 1 0 4 0 3 23 8 0 9 1 2 504:15 PM 2 26 3 3 6 1 2 0 4 25 7 0 9 0 1 504:30 PM 2 35 2 0 2 0 4 0 0 15 3 0 11 0 2 104:45 PM 2 26 4 0 2 1 5 0 3 31 5 2 7 0 5 205:00 PM 3 32 8 2 1 0 6 0 5 35 7 0 11 2 5 805:15 PM 4 31 6 1 2 0 2 0 5 30 10 1 7 1 1 405:30 PM 5 46 5 0 6 2 2 0 4 29 5 1 5 0 0 505:45 PM 4 37 3 2 2 0 8 0 6 60 6 0 3 1 1 3
4:15 0 5:15 9 119 17 11 2 17 12 106 22 38 2 13 3684:30 - 5:30 11 124 20 7 1 17 13 111 25 36 3 13 3814:45 - 5:45 14 135 23 11 3 15 17 125 27 30 3 11 4145:00 - 6:00 16 146 22 11 2 18 20 154 28 26 4 7 454
File Name: C:\TMC Data\Data 2015\FP Stanford 10-15\3PM FINAL.ppdStart Date: 10/8/2015Start Time: 4:00:00 PMSite Code: 00000003
Comment 1: 0Comment 2: 0Comment 3: 0Comment 4: 0
PETER COUTTS RDSouthbound
PETER COUTTS CIRCLEWestbound
PETER COUTTS RDNorthbound
RAIMUNDO WAYEastbound
3PM PETER COUTTS RD & PETER COUTTS CIRCLE.xls - Bikes
Start Time Right Thru Left Peds Right Thru Left Peds Right Thru Left Peds Right Thru Left Peds04:00 PM 0 1 1 0 0 0 0 0 0 3 1 0 0 0 0 004:15 PM 0 0 0 0 0 0 0 0 1 3 1 0 0 0 0 004:30 PM 0 0 0 0 0 0 0 0 0 2 1 0 0 0 0 004:45 PM 0 0 0 0 0 0 0 0 1 2 0 0 0 0 0 005:00 PM 2 0 0 0 2 0 0 0 0 0 0 0 0 0 1 005:15 PM 1 1 1 0 0 0 0 0 1 4 0 0 1 0 1 005:30 PM 4 0 0 0 0 0 0 0 0 4 1 0 1 1 0 005:45 PM 2 0 1 0 0 0 0 0 0 3 0 0 0 0 0 0
File Name: C:\TMC Data\Data 2015\FP Stanford 10-15\3PM FINAL.ppdStart Date: 10/8/2015Start Time: 4:00:00 PMSite Code: 00000003
Comment 1: 0Comment 2: 0Comment 3: 0Comment 4: 0
PETER COUTTS RDSouthbound
PETER COUTTS CIRCLEWestbound
PETER COUTTS RDNorthbound
RAIMUNDO WAYEastbound

4AM STANFORD AVE & MEARS CT.xls - Vehicles
Start Time Right Thru Left Peds Right Thru Left Peds Right Thru Left Peds Right Thru Left Peds07:00 AM 0 27 0 0 2 0 2 0 0 36 0 0 0 0 0 007:15 AM 0 29 0 0 1 0 0 3 0 52 0 1 0 0 0 007:30 AM 0 33 4 0 3 0 2 18 2 77 1 0 0 0 0 007:45 AM 0 53 4 0 3 0 6 17 7 116 0 0 0 0 0 008:00 AM 0 36 1 0 1 0 8 5 5 90 0 0 0 0 0 008:15 AM 0 27 0 0 2 0 1 3 1 88 0 0 0 0 0 008:30 AM 0 47 2 0 2 0 3 1 3 97 0 0 0 0 0 008:45 AM 0 39 4 0 4 0 3 6 1 90 0 0 0 0 0 0
7:15 - 8:15 0 151 9 8 0 16 14 335 1 0 0 0 5347:30 - 8:30 0 149 9 9 0 17 15 371 1 0 0 0 5717:45 - 8:45 0 163 7 8 0 18 16 391 0 0 0 0 6038:00 - 9:00 0 149 7 9 0 15 10 365 0 0 0 0 555
File Name: C:\TMC Data\Data 2015\FP Stanford 10-15\4AM FINAL.ppdStart Date: 10/8/2015Start Time: 7:00:00 AMSite Code: 00000004
Comment 1: 0Comment 2: 0Comment 3: 0Comment 4: 0
STANFORD AVESouthbound
MEARS CTWestbound
STANFORD AVENorthbound Eastbound

4AM STANFORD AVE & MEARS CT.xls - Bikes
Start Time Right Thru Left Peds Right Thru Left Peds Right Thru Left Peds Right Thru Left Peds07:00 AM 0 0 0 0 0 0 0 0 0 1 0 0 0 0 0 007:15 AM 0 5 0 0 0 0 0 0 0 1 0 0 0 0 0 007:30 AM 0 2 0 0 1 0 0 0 0 6 0 0 0 0 0 007:45 AM 0 4 0 0 0 0 0 0 0 9 0 0 0 0 0 008:00 AM 0 5 0 0 0 0 0 0 0 6 0 0 0 0 0 008:15 AM 0 5 0 0 0 0 0 0 0 3 0 0 0 0 0 008:30 AM 0 3 0 0 1 0 0 0 0 5 0 0 0 0 0 008:45 AM 0 1 0 0 0 0 0 0 0 9 0 0 0 0 0 0
File Name: C:\TMC Data\Data 2015\FP Stanford 10-15\4AM FINAL.ppdStart Date: 10/8/2015Start Time: 7:00:00 AMSite Code: 00000004
Comment 1: 0Comment 2: 0Comment 3: 0Comment 4: 0
STANFORD AVESouthbound
MEARS CTWestbound
STANFORD AVENorthbound Eastbound

Start Time Right Thru Left Peds Right Thru Left Peds Right Thru Left Peds Right Thru Left Peds04:00 PM 0 79 4 0 1 0 0 6 3 41 0 0 0 0 0 004:15 PM 0 70 3 0 0 0 2 1 0 48 0 0 0 0 0 004:30 PM 0 69 2 0 2 0 1 4 2 44 0 0 0 0 0 004:45 PM 0 74 2 0 3 0 0 2 0 56 0 0 0 0 0 005:00 PM 0 84 0 0 2 0 0 7 0 44 0 0 0 0 0 005:15 PM 0 58 2 0 0 0 0 6 0 47 0 0 0 0 0 005:30 PM 0 62 3 0 0 0 2 3 2 52 0 0 0 0 0 005:45 PM 0 45 1 0 2 0 1 1 1 47 0 0 0 0 0 0
4:15 0 5:15 0 297 7 7 0 3 2 192 0 0 0 0 5084:30 - 5:30 0 285 6 7 0 1 2 191 0 0 0 0 4924:45 - 5:45 0 278 7 5 0 2 2 199 0 0 0 0 4935:00 - 6:00 0 249 6 4 0 3 3 190 0 0 0 0 455
Comment 3: 0Comment 4: 0
STANFORD AVESouthbound
MEARS CTWestbound
STANFORD AVENorthbound Eastbound
Site Code: 00000004Comment 1: 0Comment 2: 0
File Name: C:\TMC Data\Data 2015\FP Stanford 10-15\4PM FINAL.ppdStart Date: 10/8/2015Start Time: 4:00:00 PM
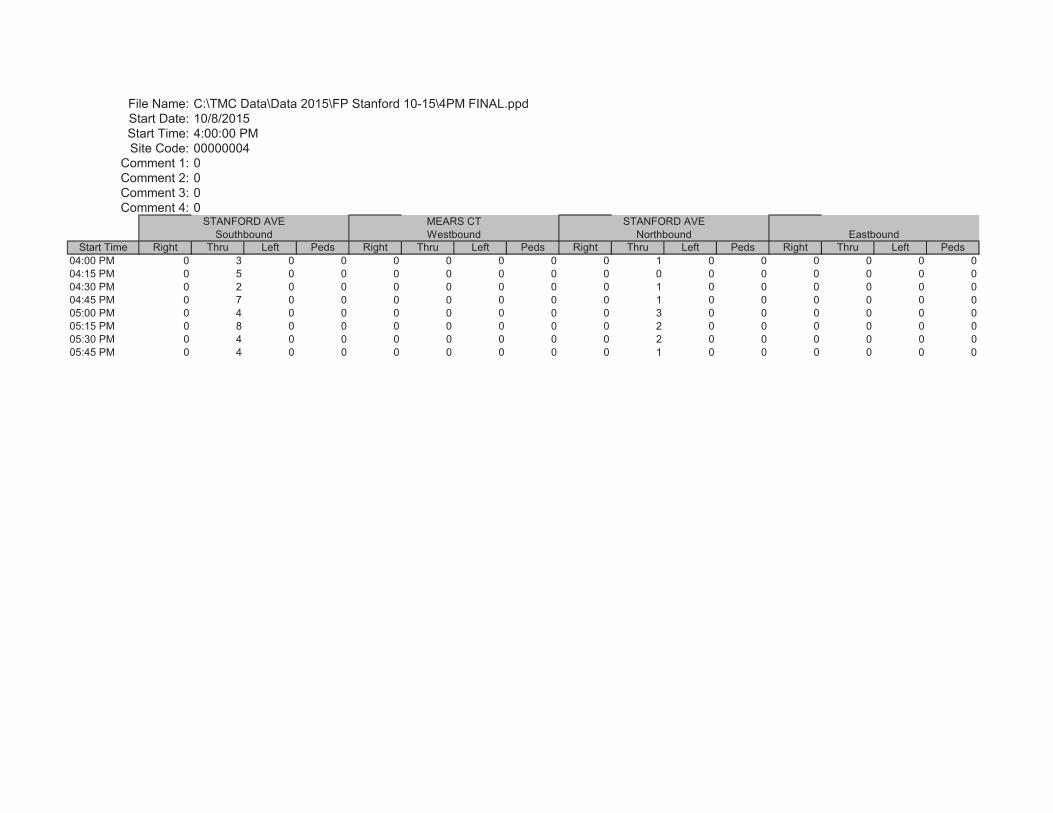
Start Time Right Thru Left Peds Right Thru Left Peds Right Thru Left Peds Right Thru Left Peds04:00 PM 0 3 0 0 0 0 0 0 0 1 0 0 0 0 0 004:15 PM 0 5 0 0 0 0 0 0 0 0 0 0 0 0 0 004:30 PM 0 2 0 0 0 0 0 0 0 1 0 0 0 0 0 004:45 PM 0 7 0 0 0 0 0 0 0 1 0 0 0 0 0 005:00 PM 0 4 0 0 0 0 0 0 0 3 0 0 0 0 0 005:15 PM 0 8 0 0 0 0 0 0 0 2 0 0 0 0 0 005:30 PM 0 4 0 0 0 0 0 0 0 2 0 0 0 0 0 005:45 PM 0 4 0 0 0 0 0 0 0 1 0 0 0 0 0 0
Comment 3: 0Comment 4: 0
STANFORD AVESouthbound
MEARS CTWestbound
STANFORD AVENorthbound Eastbound
Site Code: 00000004Comment 1: 0Comment 2: 0
File Name: C:\TMC Data\Data 2015\FP Stanford 10-15\4PM FINAL.ppdStart Date: 10/8/2015Start Time: 4:00:00 PM

VehicleCount-6686 Page 1
Traffic Data Service -- Campbell, CAVehicle Counts
VehicleCount-6686 -- English (ENU)
Datasets: Site: [22] MEARS CT E OF STANFORD AVEData type: Axle sensors - Paired (Class/Speed/Count)
Profile:Included classes: 1, 2, 3, 4, 5, 6, 7, 8, 9, 10, 11, 12, 13Speed range: 0 - 100 mph.Direction: East (bound)Name: Default ProfileScheme: Vehicle classification (Scheme F)Units: Non metric (ft, mi, ft/s, mph, lb, ton)
* Tuesday, May 19, 2015 - Total=186, 15 minute drops 0000 0100 0200 0300 0400 0500 0600 0700 0800 0900 1000 1100 1200 1300 1400 1500 1600 1700 1800 1900 2000 2100 2200 2300 0 0 0 0 1 2 1 11 10 10 8 10 8 15 31 14 13 19 7 10 8 4 1 3 0 0 0 0 0 0 1 0 4 1 4 3 2 1 7 0 1 3 0 4 2 1 0 1 0 0 0 0 0 0 0 0 0 4 0 3 1 3 4 5 2 4 6 3 3 4 1 1 0 1 0 0 0 0 1 1 0 2 1 1 0 2 0 5 13 8 3 3 2 1 0 2 0 2 1 0 0 0 0 0 1 0 9 1 8 1 4 3 5 6 4 5 7 2 2 2 0 0 0 0AM Peak 0730 - 0830 (19), AM PHF=0.53 PM Peak 1400 - 1500 (31), PM PHF=0.60
* Wednesday, May 20, 2015 - Total=201, 15 minute drops 0000 0100 0200 0300 0400 0500 0600 0700 0800 0900 1000 1100 1200 1300 1400 1500 1600 1700 1800 1900 2000 2100 2200 2300 2 0 0 1 0 3 2 18 16 7 4 9 11 33 15 7 18 15 19 5 6 4 5 1 0 0 0 0 0 2 0 0 6 3 0 0 2 8 6 2 3 3 3 2 1 2 1 0 0 1 0 0 0 0 1 0 2 4 1 0 5 2 10 4 2 6 4 7 2 0 1 1 0 1 1 0 0 1 0 0 2 4 4 2 2 2 2 11 5 2 5 5 7 0 4 1 0 1 0 0 0 0 0 0 0 0 12 2 1 2 2 5 4 0 1 4 3 2 1 1 0 3 0 0AM Peak 0730 - 0830 (26), AM PHF=0.54 PM Peak 1245 - 1345 (34), PM PHF=0.77
* Thursday, May 21, 2015 - Total=198, 15 minute drops 0000 0100 0200 0300 0400 0500 0600 0700 0800 0900 1000 1100 1200 1300 1400 1500 1600 1700 1800 1900 2000 2100 2200 2300 1 0 0 0 1 1 2 18 13 9 9 17 10 17 30 13 16 8 17 5 7 4 0 0 0 0 0 0 0 0 0 0 4 4 4 3 2 7 8 2 3 5 8 0 1 2 0 0 0 1 0 0 0 0 0 1 5 6 2 1 5 3 2 5 2 4 2 4 3 2 1 0 0 0 0 0 0 0 0 1 1 5 0 2 3 6 2 5 12 5 4 1 3 1 1 1 0 0 0 0 0 0 0 1 0 0 8 3 1 1 3 3 3 5 4 5 0 2 1 3 0 0 0 1AM Peak 0730 - 0830 (23), AM PHF=0.72 PM Peak 1400 - 1500 (30), PM PHF=0.63
VehicleCount-6686 Page 1

VehicleCount-6684 Page 1
Traffic Data Service -- Campbell, CAVehicle Counts
VehicleCount-6684 -- English (ENU)
Datasets: Site: [22] MEARS CT E OF STANFORD AVEData type: Axle sensors - Paired (Class/Speed/Count)
Profile:Included classes: 1, 2, 3, 4, 5, 6, 7, 8, 9, 10, 11, 12, 13Speed range: 0 - 100 mph.Direction: West (bound)Name: Default ProfileScheme: Vehicle classification (Scheme F)Units: Non metric (ft, mi, ft/s, mph, lb, ton)
* Tuesday, May 19, 2015 - Total=190, 15 minute drops 0000 0100 0200 0300 0400 0500 0600 0700 0800 0900 1000 1100 1200 1300 1400 1500 1600 1700 1800 1900 2000 2100 2200 2300 0 0 1 0 0 2 5 18 20 11 11 6 9 11 27 19 15 8 8 7 8 3 0 1 0 0 0 0 0 0 0 0 7 2 3 0 4 0 5 7 4 1 2 3 2 0 0 0 0 0 0 0 0 0 1 3 2 4 2 3 1 1 0 4 2 6 1 3 2 5 2 0 1 0 0 0 1 0 0 1 1 8 5 5 3 3 2 5 10 6 2 3 0 1 0 1 0 0 0 0 0 0 0 0 0 1 8 4 2 2 2 2 6 8 4 3 3 3 1 1 0 0 0 0AM Peak 0730 - 0830 (27), AM PHF=0.84 PM Peak 1415 - 1515 (29), PM PHF=0.72
* Wednesday, May 20, 2015 - Total=194, 15 minute drops 0000 0100 0200 0300 0400 0500 0600 0700 0800 0900 1000 1100 1200 1300 1400 1500 1600 1700 1800 1900 2000 2100 2200 2300 0 0 0 1 0 2 3 23 17 17 8 8 7 29 19 13 10 8 13 6 6 2 2 0 0 0 0 0 0 1 1 1 9 2 3 2 0 5 5 4 0 1 3 3 1 1 0 0 0 0 0 0 0 0 1 0 2 3 4 1 2 1 10 6 2 5 3 4 2 3 1 1 0 0 0 0 0 1 0 0 1 8 2 5 3 1 1 11 4 1 3 4 3 1 0 0 1 0 0 0 0 0 0 0 0 1 12 3 6 1 3 5 3 4 6 2 0 3 0 2 0 0 0 0AM Peak 0730 - 0830 (32), AM PHF=0.67 PM Peak 1245 - 1345 (31), PM PHF=0.70
* Thursday, May 21, 2015 - Total=203, 15 minute drops 0000 0100 0200 0300 0400 0500 0600 0700 0800 0900 1000 1100 1200 1300 1400 1500 1600 1700 1800 1900 2000 2100 2200 2300 0 0 0 1 1 1 2 22 16 19 9 12 13 16 30 23 10 12 7 5 3 1 0 0 0 0 0 1 0 0 0 1 6 8 2 2 4 2 2 1 5 5 2 0 2 0 0 0 0 0 0 0 0 0 0 0 3 2 4 1 3 1 4 7 3 3 4 2 2 0 0 0 0 0 0 0 0 0 0 1 1 6 7 3 5 3 3 4 12 8 0 1 2 2 1 1 0 0 0 0 0 0 0 1 0 1 12 1 4 1 4 5 6 9 11 2 2 1 1 0 0 0 0 0AM Peak 0715 - 0815 (27), AM PHF=0.56 PM Peak 1400 - 1500 (30), PM PHF=0.63
VehicleCount-6684 Page 1

VehicleCount-6688 Page 1
Traffic Data Service -- Campbell, CAVehicle Counts
VehicleCount-6688 -- English (ENU)
Datasets: Site: [23] MEARS CT N OF COUNT STATION 22Data type: Axle sensors - Paired (Class/Speed/Count)
Profile:Included classes: 1, 2, 3, 4, 5, 6, 7, 8, 9, 10, 11, 12, 13Speed range: 0 - 100 mph.Direction: North (bound)Name: Default ProfileScheme: Vehicle classification (Scheme F)Units: Non metric (ft, mi, ft/s, mph, lb, ton)
* Tuesday, May 19, 2015 - Total=55, 15 minute drops 0000 0100 0200 0300 0400 0500 0600 0700 0800 0900 1000 1100 1200 1300 1400 1500 1600 1700 1800 1900 2000 2100 2200 2300 0 0 0 0 0 1 1 1 2 2 1 5 2 6 4 6 5 8 0 6 3 0 0 2 0 0 0 0 0 0 1 0 0 1 0 2 0 0 0 0 1 1 0 3 0 0 0 1 0 0 0 0 0 0 0 0 0 0 0 1 1 1 3 1 2 1 1 0 2 2 0 0 0 0 0 0 0 0 0 1 0 1 2 0 0 1 0 3 2 4 0 1 0 0 0 0 0 1 0 0 0 0 0 0 0 0 0 0 1 0 1 1 0 1 0 3 5 0 1 1 0 0 0 0AM Peak 1100 - 1200 (5), AM PHF=0.63 PM Peak 1700 - 1800 (8), PM PHF=0.40
* Wednesday, May 20, 2015 - Total=61, 15 minute drops 0000 0100 0200 0300 0400 0500 0600 0700 0800 0900 1000 1100 1200 1300 1400 1500 1600 1700 1800 1900 2000 2100 2200 2300 0 0 0 0 0 2 1 0 3 3 1 5 4 8 4 1 7 8 6 2 3 1 1 1 0 0 0 0 0 1 0 0 0 0 0 0 1 4 2 0 1 1 0 1 0 1 0 0 0 0 0 0 0 0 1 0 0 1 0 0 3 1 1 1 1 3 4 3 0 0 0 0 0 0 0 0 0 0 0 0 1 0 2 2 0 1 0 2 1 0 1 2 3 0 3 0 0 1 0 0 0 0 0 0 0 0 0 0 1 1 1 2 1 0 0 2 1 0 1 0 0 1 0 0AM Peak 1115 - 1215 (6), AM PHF=0.50 PM Peak 1245 - 1345 (9), PM PHF=0.56
* Thursday, May 21, 2015 - Total=61, 15 minute drops 0000 0100 0200 0300 0400 0500 0600 0700 0800 0900 1000 1100 1200 1300 1400 1500 1600 1700 1800 1900 2000 2100 2200 2300 0 0 0 0 0 1 0 1 0 1 3 10 5 11 9 5 2 1 5 2 3 2 0 0 0 0 0 0 0 0 0 0 0 1 0 2 0 5 2 1 0 1 2 1 0 2 0 0 0 0 0 0 0 0 0 0 0 0 0 1 2 1 2 1 0 1 0 1 0 1 0 0 0 0 0 0 0 0 0 1 0 1 0 0 1 4 1 2 3 1 1 0 2 0 0 0 0 0 0 0 0 0 0 0 0 0 0 0 0 1 2 3 2 3 3 0 0 0 1 2 0 0 0 1AM Peak 1100 - 1200 (10), AM PHF=0.63 PM Peak 1245 - 1345 (12), PM PHF=0.60
VehicleCount-6688 Page 1

VehicleCount-6690 Page 1
Traffic Data Service -- Campbell, CAVehicle Counts
VehicleCount-6690 -- English (ENU)
Datasets: Site: [23] MEARS CT N OF COUNT STATION 22Data type: Axle sensors - Paired (Class/Speed/Count)
Profile:Included classes: 1, 2, 3, 4, 5, 6, 7, 8, 9, 10, 11, 12, 13Speed range: 0 - 100 mph.Direction: South (bound)Name: Default ProfileScheme: Vehicle classification (Scheme F)Units: Non metric (ft, mi, ft/s, mph, lb, ton)
* Tuesday, May 19, 2015 - Total=80, 15 minute drops 0000 0100 0200 0300 0400 0500 0600 0700 0800 0900 1000 1100 1200 1300 1400 1500 1600 1700 1800 1900 2000 2100 2200 2300 0 0 1 0 0 1 2 4 6 7 9 3 5 6 6 9 7 1 6 0 4 2 0 1 0 0 0 0 0 0 1 0 1 1 3 0 2 0 2 3 2 0 2 0 0 0 0 0 0 0 0 0 0 0 1 1 2 2 1 3 0 1 0 1 1 3 0 3 0 3 1 0 1 0 0 0 1 0 0 0 0 2 0 3 1 1 1 3 0 1 0 1 0 0 0 1 0 0 0 0 0 0 0 0 0 0 0 3 2 2 2 1 3 3 4 2 0 1 0 1 0 0 0 0AM Peak 0930 - 1030 (11), AM PHF=0.92 PM Peak 1530 - 1630 (10), PM PHF=0.63
* Wednesday, May 20, 2015 - Total=64, 15 minute drops 0000 0100 0200 0300 0400 0500 0600 0700 0800 0900 1000 1100 1200 1300 1400 1500 1600 1700 1800 1900 2000 2100 2200 2300 0 0 0 1 0 1 2 3 4 8 3 3 2 12 6 5 1 4 5 2 1 1 0 0 0 0 0 0 0 1 1 1 1 2 0 1 0 6 1 3 0 0 0 0 0 0 0 0 0 0 0 0 0 0 0 0 0 0 1 1 1 0 2 3 0 1 2 3 1 0 1 0 0 0 0 0 0 1 0 0 0 2 2 2 1 1 0 2 1 0 0 1 0 1 0 0 0 0 0 0 0 0 0 0 0 1 0 1 3 1 0 2 2 1 2 0 1 2 0 1 0 0 0 0AM Peak 0900 - 1000 (8), AM PHF=0.67 PM Peak 1245 - 1345 (12), PM PHF=0.50
* Thursday, May 21, 2015 - Total=74, 15 minute drops 0000 0100 0200 0300 0400 0500 0600 0700 0800 0900 1000 1100 1200 1300 1400 1500 1600 1700 1800 1900 2000 2100 2200 2300 0 0 0 1 1 0 1 5 5 6 3 6 7 8 8 9 5 5 1 2 1 0 0 0 0 0 0 1 0 0 0 1 1 3 0 0 2 1 0 0 2 1 0 0 1 0 0 0 0 0 0 0 0 0 0 0 1 0 1 1 1 0 0 2 2 2 3 0 1 0 0 0 0 0 0 0 0 0 0 0 1 1 3 0 1 3 1 2 1 2 0 1 0 0 0 0 0 0 0 0 0 0 0 1 0 0 2 1 2 1 2 4 5 5 5 1 0 1 1 0 0 0 0 0AM Peak 0830 - 0930 (8), AM PHF=0.67 PM Peak 1515 - 1615 (11), PM PHF=0.55
VehicleCount-6690 Page 1

VehicleCount-6691 Page 1
Traffic Data Service -- Campbell, CAVehicle Counts
VehicleCount-6691 -- English (ENU)
Datasets: Site: [24] MEARS CT S OF COUNT STATION 22Data type: Axle sensors - Paired (Class/Speed/Count)
Profile:Included classes: 1, 2, 3, 4, 5, 6, 7, 8, 9, 10, 11, 12, 13Speed range: 0 - 100 mph.Direction: North (bound)Name: Default ProfileScheme: Vehicle classification (Scheme F)Units: Non metric (ft, mi, ft/s, mph, lb, ton)
* Tuesday, May 19, 2015 - Total=73, 15 minute drops 0000 0100 0200 0300 0400 0500 0600 0700 0800 0900 1000 1100 1200 1300 1400 1500 1600 1700 1800 1900 2000 2100 2200 2300 0 0 0 0 0 1 3 6 13 3 2 3 3 5 2 10 8 5 0 5 4 0 0 0 0 0 0 0 0 0 0 0 5 1 0 0 0 0 0 4 1 0 0 2 2 0 0 0 0 0 0 0 0 0 0 1 0 2 0 1 1 0 1 1 1 4 1 0 2 2 0 0 0 0 0 0 0 0 0 1 1 5 5 2 1 2 1 2 0 5 2 2 0 0 0 0 0 0 0 0 0 0 0 0 0 1 1 1 0 0 0 2 2 1 0 1 2 0 1 0 0 0 0 0AM Peak 0730 - 0830 (13), AM PHF=0.65 PM Peak 1445 - 1545 (11), PM PHF=0.55
* Wednesday, May 20, 2015 - Total=94, 15 minute drops 0000 0100 0200 0300 0400 0500 0600 0700 0800 0900 1000 1100 1200 1300 1400 1500 1600 1700 1800 1900 2000 2100 2200 2300 0 0 0 0 0 1 0 9 7 9 6 5 4 9 4 9 9 5 5 5 5 0 2 0 0 0 0 0 0 0 0 0 3 1 3 0 0 3 1 1 0 1 3 3 1 0 0 0 0 0 0 0 0 0 1 0 1 2 1 0 1 0 3 1 2 4 1 0 2 3 0 1 0 0 0 0 0 0 0 0 0 5 0 4 2 1 1 3 0 1 3 3 1 0 0 0 1 0 0 0 0 0 0 0 0 0 3 2 3 1 3 3 0 2 5 2 0 1 0 1 0 0 0 0AM Peak 0730 - 0830 (13), AM PHF=0.65 PM Peak 1245 - 1345 (12), PM PHF=1.00
* Thursday, May 21, 2015 - Total=96, 15 minute drops 0000 0100 0200 0300 0400 0500 0600 0700 0800 0900 1000 1100 1200 1300 1400 1500 1600 1700 1800 1900 2000 2100 2200 2300 0 0 0 0 0 1 1 6 6 8 6 11 7 10 10 12 4 6 4 3 0 1 0 0 0 0 0 0 0 0 0 0 2 3 2 3 2 2 2 1 3 3 1 0 0 0 0 0 0 0 0 0 0 0 0 0 2 0 0 0 2 0 4 3 0 1 1 1 1 0 0 0 0 0 0 0 0 0 0 1 0 2 4 3 4 2 3 3 3 6 0 0 2 2 0 1 0 0 0 0 0 0 0 0 0 1 2 0 2 0 4 2 1 2 5 0 2 0 0 0 0 0 0 0AM Peak 1100 - 1200 (11), AM PHF=0.69 PM Peak 1530 - 1630 (15), PM PHF=0.63
VehicleCount-6691 Page 1

VehicleCount-6693 Page 1
Traffic Data Service -- Campbell, CAVehicle Counts
VehicleCount-6693 -- English (ENU)
Datasets: Site: [24] MEARS CT S OF COUNT STATION 22Data type: Axle sensors - Paired (Class/Speed/Count)
Profile:Included classes: 1, 2, 3, 4, 5, 6, 7, 8, 9, 10, 11, 12, 13Speed range: 0 - 100 mph.Direction: South (bound)Name: Default ProfileScheme: Vehicle classification (Scheme F)Units: Non metric (ft, mi, ft/s, mph, lb, ton)
* Tuesday, May 19, 2015 - Total=94, 15 minute drops 0000 0100 0200 0300 0400 0500 0600 0700 0800 0900 1000 1100 1200 1300 1400 1500 1600 1700 1800 1900 2000 2100 2200 2300 0 0 0 0 1 1 1 1 7 7 8 2 8 6 9 7 8 9 5 3 5 4 1 1 0 0 0 0 0 0 1 0 3 0 4 1 3 1 4 0 0 1 0 1 2 1 0 0 0 0 0 0 0 0 0 0 0 3 0 3 0 2 2 1 0 3 4 3 1 2 1 1 0 0 0 0 0 0 1 0 0 0 0 1 0 0 0 1 2 4 3 2 2 0 0 2 0 1 1 0 0 0 0 0 1 0 1 1 6 1 1 3 2 2 3 2 2 0 1 1 0 0 0 0AM Peak 0930 - 1030 (14), AM PHF=0.58 PM Peak 1530 - 1630 (10), PM PHF=0.63
* Wednesday, May 20, 2015 - Total=101, 15 minute drops 0000 0100 0200 0300 0400 0500 0600 0700 0800 0900 1000 1100 1200 1300 1400 1500 1600 1700 1800 1900 2000 2100 2200 2300 1 0 0 1 0 1 0 2 10 6 2 5 6 14 6 6 10 7 12 5 2 2 3 0 0 0 0 0 0 1 0 0 2 3 0 0 1 4 3 2 2 1 3 2 1 0 1 0 0 0 0 0 0 0 0 0 2 3 1 0 2 0 3 1 1 2 2 6 3 0 1 1 0 1 1 0 0 1 0 0 0 0 3 2 1 2 2 5 2 1 4 3 2 0 1 1 0 0 0 0 0 0 0 0 0 0 0 2 0 1 1 3 2 0 2 2 1 1 0 0 0 1 0 0AM Peak 0815 - 0915 (11), AM PHF=0.92 PM Peak 1245 - 1345 (15), PM PHF=0.75
* Thursday, May 21, 2015 - Total=111, 15 minute drops 0000 0100 0200 0300 0400 0500 0600 0700 0800 0900 1000 1100 1200 1300 1400 1500 1600 1700 1800 1900 2000 2100 2200 2300 1 0 0 0 1 0 1 5 9 4 8 11 7 10 13 6 11 6 7 5 4 2 0 0 0 0 0 0 0 0 0 0 1 1 4 2 2 2 7 1 3 2 3 1 1 0 0 0 0 1 0 0 0 0 0 1 4 5 0 0 3 2 2 3 1 2 2 2 3 1 1 0 0 0 0 0 0 0 0 0 0 1 1 2 3 2 2 4 2 3 3 1 1 1 1 1 0 0 0 0 0 0 0 1 0 0 0 2 1 1 4 1 2 1 1 3 1 1 0 1 0 0 0 0AM Peak 1100 - 1200 (11), AM PHF=0.69 PM Peak 1330 - 1430 (16), PM PHF=0.57
VehicleCount-6693 Page 1

EventCount-6695 Page 1
Traffic Data Service -- Campbell, CAEvent Counts
EventCount-6695 -- English (ENU)
Datasets: Site: [25] PETER COUTTS CR E OF PETER COUTTS RDInput A: 4 - West bound. - Lane= 0, Excluded from totals.Input B: 2 - East bound. - Lane= 0, Added to totals. (/2.000)Data type: Axle sensors - Separate (Count)
Profile:Name: Default ProfileScheme: Count events divided by setup divisorUnits: Non metric (ft, mi, ft/s, mph, lb, ton)
* Tuesday, May 19, 2015=410, 15 minute drops 0000 0100 0200 0300 0400 0500 0600 0700 0800 0900 1000 1100 1200 1300 1400 1500 1600 1700 1800 1900 2000 2100 2200 2300 3 0 0 0 0 1 2 9 25 16 17 18 24 23 27 35 36 42 50 28 29 19 6 2 1 0 0 0 0 0 0 2 7 4 5 4 6 4 7 9 9 13 11 8 14 10 2 0 2 0 0 0 0 0 0 1 1 7 7 3 3 3 8 4 9 11 7 14 4 8 4 1 0 0 0 0 0 0 0 0 0 4 7 2 7 5 9 4 9 7 8 14 14 9 2 4 3 1 1 2 0 0 0 0 1 1 2 5 3 2 6 6 7 8 10 8 8 11 7 5 1 0 1 2AM Peak 0800 - 0900 (25), AM PHF=0.89 PM Peak 1800 - 1900 (50), PM PHF=0.88
* Wednesday, May 20, 2015=439, 15 minute drops 0000 0100 0200 0300 0400 0500 0600 0700 0800 0900 1000 1100 1200 1300 1400 1500 1600 1700 1800 1900 2000 2100 2200 2300 5 2 0 0 0 2 5 11 20 20 13 25 37 27 16 27 46 46 37 39 29 18 12 5 2 2 0 0 0 1 1 0 2 4 3 6 6 7 5 4 5 9 13 9 7 4 4 1 2 0 0 0 0 0 0 0 0 7 6 8 6 14 6 6 5 14 8 9 7 7 3 4 1 1 1 0 0 0 0 1 1 5 4 8 0 9 9 4 2 9 19 10 8 14 9 7 1 1 0 2 0 0 0 0 0 3 6 7 3 2 4 8 10 3 9 8 19 7 9 6 4 3 2 0AM Peak 1130 - 1230 (33), AM PHF=0.59 PM Peak 1730 - 1830 (51), PM PHF=0.68
* Thursday, May 21, 2015=433, 15 minute drops 0000 0100 0200 0300 0400 0500 0600 0700 0800 0900 1000 1100 1200 1300 1400 1500 1600 1700 1800 1900 2000 2100 2200 2300 3 3 0 0 0 1 6 8 26 21 30 20 23 33 19 37 34 41 53 25 18 14 10 11 2 0 0 0 0 0 1 0 7 5 11 3 7 9 0 7 5 4 14 9 7 2 3 9 0 1 1 0 0 0 0 0 3 4 5 8 9 3 12 8 8 8 11 9 3 2 7 4 2 0 0 2 0 0 0 0 0 3 11 7 7 3 7 3 8 10 9 17 17 8 7 3 1 0 0 0 0 0 0 0 1 5 2 4 4 4 5 6 9 3 12 12 9 13 5 2 2 2 0 1AM Peak 0930 - 1030 (30), AM PHF=0.68 PM Peak 1800 - 1900 (53), PM PHF=0.80
EventCount-6695 Page 1

EventCount-6694 Page 1
Traffic Data Service -- Campbell, CAEvent Counts
EventCount-6694 -- English (ENU)
Datasets: Site: [25] PETER COUTTS CR E OF PETER COUTTS RDInput A: 4 - West bound. - Lane= 0, Added to totals. (/2.000)Input B: 2 - East bound. - Lane= 0, Excluded from totals.Data type: Axle sensors - Separate (Count)
Profile:Name: Default ProfileScheme: Count events divided by setup divisorUnits: Non metric (ft, mi, ft/s, mph, lb, ton)
* Tuesday, May 19, 2015=402, 15 minute drops 0000 0100 0200 0300 0400 0500 0600 0700 0800 0900 1000 1100 1200 1300 1400 1500 1600 1700 1800 1900 2000 2100 2200 2300 1 1 0 0 0 3 5 34 40 38 31 15 20 25 26 30 35 31 31 17 11 7 3 1 0 1 0 0 0 0 2 9 13 11 13 6 7 8 5 11 5 8 11 4 2 3 1 0 1 0 0 0 0 0 0 1 6 10 6 3 3 3 7 6 7 7 7 8 6 0 1 0 0 0 1 0 0 0 0 1 0 11 9 10 7 5 6 5 11 4 10 9 5 3 3 2 2 0 1 0 0 0 0 0 2 2 9 9 11 9 1 4 5 4 8 13 7 7 4 6 1 0 1 1AM Peak 0730 - 0830 (42), AM PHF=0.83 PM Peak 1615 - 1715 (38), PM PHF=0.73
* Wednesday, May 20, 2015=429, 15 minute drops 0000 0100 0200 0300 0400 0500 0600 0700 0800 0900 1000 1100 1200 1300 1400 1500 1600 1700 1800 1900 2000 2100 2200 2300 3 2 0 0 1 2 8 31 43 30 35 25 30 27 25 26 31 39 25 17 16 9 5 2 1 1 0 0 1 0 4 4 11 7 10 8 7 8 5 5 8 11 5 3 2 0 2 2 1 0 1 0 0 0 0 1 5 9 5 11 7 10 5 6 6 9 7 7 7 6 4 2 0 0 1 0 0 0 0 1 1 9 13 13 10 2 5 7 4 7 7 10 7 6 1 1 1 0 0 1 0 0 0 0 1 2 13 10 6 6 9 10 7 10 8 7 11 6 1 7 4 0 0 0AM Peak 0745 - 0845 (46), AM PHF=0.88 PM Peak 1700 - 1800 (39), PM PHF=0.88
* Thursday, May 21, 2015=418, 15 minute drops 0000 0100 0200 0300 0400 0500 0600 0700 0800 0900 1000 1100 1200 1300 1400 1500 1600 1700 1800 1900 2000 2100 2200 2300 1 1 0 0 0 4 4 34 46 33 33 21 34 22 29 24 33 29 30 20 11 9 1 2 1 0 0 0 0 0 1 3 15 9 10 1 9 4 4 4 11 9 8 10 3 2 0 1 0 0 1 0 0 0 0 2 3 9 2 11 5 9 6 10 9 9 6 7 2 4 2 0 1 0 0 0 0 0 0 3 1 12 10 7 7 7 5 6 10 5 5 7 6 7 3 1 0 0 0 0 0 0 0 0 1 0 17 12 15 5 8 11 6 5 6 9 8 10 1 1 4 1 0 0AM Peak 0730 - 0830 (52), AM PHF=0.76 PM Peak 1200 - 1300 (34), PM PHF=0.77
EventCount-6694 Page 1

VehicleCount-6710 Page 1
Traffic Data Service -- Campbell, CAVehicle Counts
VehicleCount-6710 -- English (ENU)
Datasets: Site: [27] ESCONDIDO VILLAGE DW 1 E OF CAMPUS DRData type: Axle sensors - Paired (Class/Speed/Count)
Profile:Included classes: 1, 2, 3, 4, 5, 6, 7, 8, 9, 10, 11, 12, 13Speed range: 0 - 100 mph.Direction: East (bound)Name: Default ProfileScheme: Vehicle classification (Scheme F)Units: Non metric (ft, mi, ft/s, mph, lb, ton)
* Wednesday, May 20, 2015 - Total=227, 15 minute drops 0000 0100 0200 0300 0400 0500 0600 0700 0800 0900 1000 1100 1200 1300 1400 1500 1600 1700 1800 1900 2000 2100 2200 2300 13 5 1 0 1 1 0 9 12 10 6 13 8 13 14 12 9 12 18 20 13 13 12 12 4 1 0 0 0 1 0 0 5 2 1 1 0 3 5 4 4 1 1 3 1 5 0 1 3 4 1 0 0 1 0 0 0 1 4 1 7 4 2 6 2 2 5 3 6 6 3 3 4 4 3 2 1 0 0 0 0 2 2 3 3 2 1 6 2 4 3 0 9 6 3 1 4 4 1 2 1 0 0 0 0 0 7 4 1 1 3 3 2 1 2 0 6 5 5 3 4 5 3 1AM Peak 0730 - 0830 (15), AM PHF=0.54 PM Peak 1830 - 1930 (23), PM PHF=0.64
* Thursday, May 21, 2015 - Total=199, 15 minute drops 0000 0100 0200 0300 0400 0500 0600 0700 0800 0900 1000 1100 1200 1300 1400 1500 1600 1700 1800 1900 2000 2100 2200 2300 9 5 2 0 1 1 0 8 7 11 7 5 11 13 12 6 9 20 11 18 15 9 9 10 3 0 0 0 1 0 0 0 4 4 2 0 2 3 5 3 4 4 4 5 9 3 2 3 2 4 1 0 0 0 1 0 2 1 1 2 1 3 5 0 1 1 8 4 6 2 0 3 2 3 1 3 2 0 0 0 0 3 0 2 2 3 2 2 5 2 1 4 3 5 0 2 4 3 3 1 1 0 0 0 0 0 3 2 4 1 1 4 3 2 0 3 4 0 2 4 4 0 2 2AM Peak 0715 - 0815 (12), AM PHF=0.75 PM Peak 1915 - 2015 (22), PM PHF=0.61
VehicleCount-6710 Page 1

VehicleCount-6713 Page 1
Traffic Data Service -- Campbell, CAVehicle Counts
VehicleCount-6713 -- English (ENU)
Datasets: Site: [27] ESCONDIDO VILLAGE DW 1 E OF CAMPUS DRData type: Axle sensors - Paired (Class/Speed/Count)
Profile:Included classes: 1, 2, 3, 4, 5, 6, 7, 8, 9, 10, 11, 12, 13Speed range: 0 - 100 mph.Direction: West (bound)Name: Default ProfileScheme: Vehicle classification (Scheme F)Units: Non metric (ft, mi, ft/s, mph, lb, ton)
* Wednesday, May 20, 2015 - Total=132, 15 minute drops 0000 0100 0200 0300 0400 0500 0600 0700 0800 0900 1000 1100 1200 1300 1400 1500 1600 1700 1800 1900 2000 2100 2200 2300 1 0 0 0 0 0 2 4 11 11 13 10 8 11 4 10 4 9 7 9 8 6 3 1 1 0 0 0 0 0 0 2 1 5 3 2 2 3 0 1 3 3 2 2 2 3 0 0 0 0 0 0 0 0 0 0 0 4 3 2 5 1 3 2 4 0 2 1 0 4 1 1 1 1 0 0 0 0 0 0 1 1 1 2 3 0 2 3 1 5 0 1 4 4 1 1 1 0 1 0 0 0 0 0 0 1 1 5 1 5 3 3 2 1 0 1 3 0 3 1 1 1 0 2AM Peak 0815 - 0915 (15), AM PHF=0.75 PM Peak 1930 - 2030 (13), PM PHF=0.81
* Thursday, May 21, 2015 - Total=117, 15 minute drops 0000 0100 0200 0300 0400 0500 0600 0700 0800 0900 1000 1100 1200 1300 1400 1500 1600 1700 1800 1900 2000 2100 2200 2300 4 0 0 0 0 0 1 4 4 11 8 10 5 3 8 5 10 7 7 7 12 4 2 5 0 0 0 0 0 0 0 2 0 3 4 1 4 0 2 3 1 1 1 2 5 0 1 1 0 1 0 0 0 0 0 0 0 1 3 1 2 1 2 1 0 4 1 2 1 2 3 1 0 0 1 0 0 0 0 0 0 1 1 3 1 6 0 1 2 1 2 2 3 3 3 1 0 3 0 2 0 0 0 0 0 1 1 2 2 2 1 0 0 3 1 3 3 1 1 2 0 0 1 0AM Peak 1115 - 1215 (13), AM PHF=0.54 PM Peak 2000 - 2100 (12), PM PHF=0.60
VehicleCount-6713 Page 1

VehicleCount-6716 Page 1
Traffic Data Service -- Campbell, CAVehicle Counts
VehicleCount-6716 -- English (ENU)
Datasets: Site: [28] ESCONDIDO VILLAGE DW 2 E OF SERRA STData type: Axle sensors - Paired (Class/Speed/Count)
Profile:Included classes: 1, 2, 3, 4, 5, 6, 7, 8, 9, 10, 11, 12, 13Speed range: 0 - 100 mph.Direction: East (bound)Name: Default ProfileScheme: Vehicle classification (Scheme F)Units: Non metric (ft, mi, ft/s, mph, lb, ton)
* Tuesday, May 19, 2015 - Total=1043, 15 minute drops 0000 0100 0200 0300 0400 0500 0600 0700 0800 0900 1000 1100 1200 1300 1400 1500 1600 1700 1800 1900 2000 2100 2200 2300 17 9 5 6 2 5 13 20 38 59 49 50 45 39 48 48 64 93 110 82 88 66 46 41 3 2 2 2 1 1 4 0 9 13 17 13 10 10 9 13 13 27 33 30 29 19 12 15 4 5 4 1 2 0 1 3 6 8 13 11 12 16 7 14 14 19 20 25 21 25 15 12 9 4 6 3 1 1 0 0 0 4 9 18 14 12 5 15 13 10 14 23 22 12 16 16 12 9 5 3 0 1 1 1 3 6 10 12 15 7 13 14 7 12 11 18 23 30 19 18 16 10 8 6AM Peak 0915 - 1015 (63), AM PHF=0.88 PM Peak 1800 - 1900 (110), PM PHF=0.83
* Wednesday, May 20, 2015 - Total=1065, 15 minute drops 0000 0100 0200 0300 0400 0500 0600 0700 0800 0900 1000 1100 1200 1300 1400 1500 1600 1700 1800 1900 2000 2100 2200 2300 19 4 6 0 4 6 10 37 45 54 52 55 51 41 56 65 66 98 101 86 66 67 40 36 4 1 1 0 2 1 3 7 14 13 18 13 9 11 19 10 9 22 36 27 20 16 7 15 3 4 0 3 0 0 1 2 7 6 18 13 14 19 9 12 21 25 28 29 21 19 19 15 5 11 5 3 1 0 1 2 4 10 10 14 8 11 13 13 11 16 18 23 22 18 13 14 6 10 7 6 0 1 0 1 2 1 13 15 9 13 17 10 8 14 18 14 25 14 20 14 18 12 6 3AM Peak 0845 - 0945 (60), AM PHF=0.83 PM Peak 1730 - 1830 (113), PM PHF=0.78
* Thursday, May 21, 2015 - Total=1083, 15 minute drops 0000 0100 0200 0300 0400 0500 0600 0700 0800 0900 1000 1100 1200 1300 1400 1500 1600 1700 1800 1900 2000 2100 2200 2300 24 10 5 1 6 7 11 32 41 55 43 51 51 62 53 65 65 101 96 94 64 61 48 37 3 4 2 0 2 0 1 8 11 15 14 9 9 12 14 16 13 18 27 36 9 17 12 13 11 11 1 1 1 1 3 3 7 13 15 8 9 19 18 12 17 20 24 22 18 27 20 14 5 14 7 5 1 0 1 0 0 7 7 11 7 19 13 20 10 16 16 33 22 19 18 17 10 7 4 3 0 1 0 2 4 7 10 10 14 14 14 10 12 17 16 16 26 25 21 10 7 12 12 2AM Peak 1130 - 1230 (61), AM PHF=0.80 PM Peak 1715 - 1815 (110), PM PHF=0.83
VehicleCount-6716 Page 1

VehicleCount-6718 Page 1
Traffic Data Service -- Campbell, CAVehicle Counts
VehicleCount-6718 -- English (ENU)
Datasets: Site: [28] ESCONDIDO VILLAGE DW 2 E OF SERRA STData type: Axle sensors - Paired (Class/Speed/Count)
Profile:Included classes: 1, 2, 3, 4, 5, 6, 7, 8, 9, 10, 11, 12, 13Speed range: 0 - 100 mph.Direction: West (bound)Name: Default ProfileScheme: Vehicle classification (Scheme F)Units: Non metric (ft, mi, ft/s, mph, lb, ton)
* Tuesday, May 19, 2015 - Total=870, 15 minute drops 0000 0100 0200 0300 0400 0500 0600 0700 0800 0900 1000 1100 1200 1300 1400 1500 1600 1700 1800 1900 2000 2100 2200 2300 13 6 3 3 1 7 10 25 51 59 46 44 35 37 52 41 51 66 80 64 69 60 28 19 1 1 1 1 0 2 0 3 18 11 15 11 9 7 12 7 7 19 20 18 22 16 10 9 3 4 2 2 1 0 4 1 4 9 13 16 13 3 6 13 15 19 21 14 20 19 13 12 7 5 4 3 0 1 1 0 0 2 7 12 5 10 6 20 12 7 13 10 18 11 14 21 5 1 1 4 0 0 0 0 1 9 16 17 23 10 10 17 4 15 12 12 16 28 15 14 10 1 2 2AM Peak 0930 - 1030 (66), AM PHF=0.72 PM Peak 1830 - 1930 (84), PM PHF=0.75
* Wednesday, May 20, 2015 - Total=863, 15 minute drops 0000 0100 0200 0300 0400 0500 0600 0700 0800 0900 1000 1100 1200 1300 1400 1500 1600 1700 1800 1900 2000 2100 2200 2300 11 5 5 0 3 5 7 40 44 70 47 53 51 28 55 39 52 69 62 65 56 45 28 23 3 1 0 0 0 2 0 6 12 18 18 12 9 7 20 2 8 16 18 20 10 12 8 10 1 5 1 5 0 0 1 2 10 11 18 9 9 20 7 12 17 19 17 18 18 21 11 12 5 7 1 3 0 0 2 1 4 5 4 21 10 14 11 6 11 8 17 19 14 8 15 9 2 6 3 2 0 0 0 1 1 1 19 17 13 10 18 11 8 12 12 8 17 12 19 10 13 6 2 3AM Peak 0845 - 0945 (74), AM PHF=0.88 PM Peak 1730 - 1830 (72), PM PHF=0.95
* Thursday, May 21, 2015 - Total=981, 15 minute drops 0000 0100 0200 0300 0400 0500 0600 0700 0800 0900 1000 1100 1200 1300 1400 1500 1600 1700 1800 1900 2000 2100 2200 2300 14 5 3 1 5 7 8 39 62 58 55 55 45 57 49 62 46 72 69 85 53 58 45 28 1 3 0 0 1 2 1 7 14 14 16 8 13 13 12 16 6 18 20 29 12 10 12 11 4 7 0 2 1 2 3 2 14 14 15 13 9 7 11 13 8 19 19 16 18 16 24 15 7 9 3 2 1 0 0 0 0 7 17 12 10 15 8 16 9 13 13 23 15 18 15 14 10 8 0 3 0 0 0 2 2 5 11 17 17 16 23 17 17 15 25 8 12 18 20 10 10 8 2 2AM Peak 0830 - 0930 (63), AM PHF=0.93 PM Peak 1900 - 2000 (85), PM PHF=0.73
VehicleCount-6718 Page 1

VehicleCount-6721 Page 1
Traffic Data Service -- Campbell, CAVehicle Counts
VehicleCount-6721 -- English (ENU)
Datasets: Site: [29] ESCONDIDO VILLAGE DW 3 E OF SERRA STData type: Axle sensors - Paired (Class/Speed/Count)
Profile:Included classes: 1, 2, 3, 4, 5, 6, 7, 8, 9, 10, 11, 12, 13Speed range: 0 - 100 mph.Direction: East (bound)Name: Default ProfileScheme: Vehicle classification (Scheme F)Units: Non metric (ft, mi, ft/s, mph, lb, ton)
* Tuesday, May 19, 2015 - Total=711, 15 minute drops 0000 0100 0200 0300 0400 0500 0600 0700 0800 0900 1000 1100 1200 1300 1400 1500 1600 1700 1800 1900 2000 2100 2200 2300 5 0 2 3 2 4 12 36 38 45 35 19 32 24 22 39 45 78 82 45 53 37 29 24 1 0 1 1 0 1 1 4 6 14 13 1 9 6 5 7 7 20 20 13 11 11 10 6 3 3 0 0 1 1 2 4 5 8 10 8 7 6 6 4 13 10 20 23 11 10 6 11 4 3 1 0 1 1 0 0 4 17 11 5 7 6 7 8 5 12 11 16 26 13 16 10 4 7 1 0 0 0 0 1 1 3 10 13 16 7 5 10 4 8 7 17 22 13 8 16 10 4 7 1AM Peak 0830 - 0930 (48), AM PHF=0.86 PM Peak 1745 - 1845 (91), PM PHF=0.88
* Wednesday, May 20, 2015 - Total=777, 15 minute drops 0000 0100 0200 0300 0400 0500 0600 0700 0800 0900 1000 1100 1200 1300 1400 1500 1600 1700 1800 1900 2000 2100 2200 2300 8 4 2 2 3 4 12 25 44 57 45 35 38 36 31 46 49 89 71 49 51 27 31 18 3 2 1 0 2 1 0 2 7 25 10 10 9 8 11 16 12 17 18 20 7 12 5 5 3 3 2 0 1 0 1 4 10 10 12 8 9 12 10 7 11 11 28 19 10 15 7 7 5 1 1 0 0 0 0 0 4 5 11 8 14 9 9 7 8 6 13 26 15 11 15 4 10 5 3 1 0 1 1 1 2 4 8 16 12 13 7 8 11 5 13 13 18 19 8 14 4 9 3 1AM Peak 0830 - 0930 (64), AM PHF=0.64 PM Peak 1715 - 1815 (90), PM PHF=0.80
* Thursday, May 21, 2015 - Total=687, 15 minute drops 0000 0100 0200 0300 0400 0500 0600 0700 0800 0900 1000 1100 1200 1300 1400 1500 1600 1700 1800 1900 2000 2100 2200 2300 8 6 2 1 0 3 9 22 57 37 19 30 30 26 29 37 50 75 71 58 35 41 28 13 3 3 0 0 0 1 0 4 15 15 6 5 7 5 7 10 7 16 22 14 13 9 6 0 4 1 2 0 0 0 0 2 6 11 11 4 11 11 8 6 10 13 17 21 14 6 15 6 8 0 3 1 1 0 0 2 3 6 16 4 6 9 7 7 9 10 16 17 12 13 8 10 7 1 1 1 0 1 1 0 0 4 6 15 7 3 5 5 6 7 7 14 25 16 17 8 7 9 4 3AM Peak 0800 - 0900 (57), AM PHF=0.89 PM Peak 1730 - 1830 (85), PM PHF=0.85
VehicleCount-6721 Page 1

VehicleCount-6722 Page 1
Traffic Data Service -- Campbell, CAVehicle Counts
VehicleCount-6722 -- English (ENU)
Datasets: Site: [29] ESCONDIDO VILLAGE DW 3 E OF SERRA STData type: Axle sensors - Paired (Class/Speed/Count)
Profile:Included classes: 1, 2, 3, 4, 5, 6, 7, 8, 9, 10, 11, 12, 13Speed range: 0 - 100 mph.Direction: West (bound)Name: Default ProfileScheme: Vehicle classification (Scheme F)Units: Non metric (ft, mi, ft/s, mph, lb, ton)
* Tuesday, May 19, 2015 - Total=764, 15 minute drops 0000 0100 0200 0300 0400 0500 0600 0700 0800 0900 1000 1100 1200 1300 1400 1500 1600 1700 1800 1900 2000 2100 2200 2300 5 2 2 2 3 9 13 60 69 60 35 30 27 29 34 38 53 73 71 49 39 28 18 15 2 0 0 0 0 1 1 6 11 19 11 10 7 6 8 8 11 18 13 8 10 9 2 2 3 0 1 0 0 1 1 1 8 16 16 5 3 7 5 6 12 11 21 16 15 7 3 11 4 1 1 1 1 1 0 2 5 20 13 10 9 8 6 15 12 7 11 20 27 19 9 8 2 3 0 2 0 1 1 2 5 6 26 29 15 10 9 7 3 8 11 20 14 15 7 13 8 3 6 1AM Peak 0815 - 0915 (77), AM PHF=0.66 PM Peak 1645 - 1745 (79), PM PHF=0.94
* Wednesday, May 20, 2015 - Total=841, 15 minute drops 0000 0100 0200 0300 0400 0500 0600 0700 0800 0900 1000 1100 1200 1300 1400 1500 1600 1700 1800 1900 2000 2100 2200 2300 5 1 0 3 3 6 14 47 84 82 54 46 35 39 36 51 48 75 81 41 41 21 16 12 3 0 0 1 1 1 0 11 18 28 16 10 11 3 10 10 12 20 22 13 8 9 5 3 2 1 1 0 0 0 1 3 8 19 25 11 12 13 9 9 14 12 24 26 9 13 4 4 5 1 0 0 0 0 0 1 7 13 25 16 14 10 3 9 9 9 16 13 14 6 10 4 2 3 3 1 0 0 2 2 3 4 15 22 13 13 14 8 18 8 18 8 18 19 13 10 4 5 1 2AM Peak 0830 - 0930 (100), AM PHF=0.89 PM Peak 1800 - 1900 (81), PM PHF=0.78
* Thursday, May 21, 2015 - Total=749, 15 minute drops 0000 0100 0200 0300 0400 0500 0600 0700 0800 0900 1000 1100 1200 1300 1400 1500 1600 1700 1800 1900 2000 2100 2200 2300 8 3 0 0 0 10 15 53 86 62 34 29 24 32 36 39 52 72 57 57 34 28 12 6 2 0 0 0 0 0 2 7 24 21 14 7 6 8 4 14 15 21 17 11 7 3 5 1 7 1 1 0 0 0 0 3 9 18 16 9 8 10 11 12 6 21 13 8 14 8 9 2 1 1 3 1 0 0 0 5 3 13 16 14 7 8 7 4 12 8 7 16 15 15 5 5 3 2 1 2 1 0 0 0 5 7 24 28 11 4 6 1 9 8 11 9 22 17 17 14 11 2 2 0AM Peak 0800 - 0900 (86), AM PHF=0.77 PM Peak 1700 - 1800 (72), PM PHF=0.82
VehicleCount-6722 Page 1

VehicleCount-6729 Page 1
Traffic Data Service -- Campbell, CAVehicle Counts
VehicleCount-6729 -- English (ENU)
Datasets: Site: [30] ESCONDIDO VILLAGE DW 4 S OF SERRA STData type: Axle sensors - Paired (Class/Speed/Count)
Profile:Included classes: 1, 2, 3, 4, 5, 6, 7, 8, 9, 10, 11, 12, 13Speed range: 0 - 100 mph.Direction: North (bound)Name: Default ProfileScheme: Vehicle classification (Scheme F)Units: Non metric (ft, mi, ft/s, mph, lb, ton)
* Tuesday, May 19, 2015 - Total=954, 15 minute drops 0000 0100 0200 0300 0400 0500 0600 0700 0800 0900 1000 1100 1200 1300 1400 1500 1600 1700 1800 1900 2000 2100 2200 2300 5 3 4 3 0 11 14 38 92 88 51 35 46 44 47 60 70 111 82 42 30 28 29 21 1 0 4 3 0 0 2 8 22 23 12 5 13 14 8 8 24 22 23 14 6 11 7 10 1 1 0 0 0 0 2 3 12 20 21 12 9 13 9 6 10 14 30 23 7 10 2 14 4 3 1 2 0 0 0 4 4 6 28 26 17 12 11 10 16 26 16 32 19 11 11 9 5 7 0 2 1 0 0 0 5 5 12 22 18 10 9 9 11 17 16 16 27 17 10 3 6 3 0 5AM Peak 0830 - 0930 (94), AM PHF=0.84 PM Peak 1715 - 1815 (112), PM PHF=0.88
* Wednesday, May 20, 2015 - Total=961, 15 minute drops 0000 0100 0200 0300 0400 0500 0600 0700 0800 0900 1000 1100 1200 1300 1400 1500 1600 1700 1800 1900 2000 2100 2200 2300 9 4 3 1 2 10 18 46 100 88 60 54 41 48 41 59 74 96 66 44 39 29 14 15 1 0 3 0 1 0 5 5 31 15 23 16 7 9 12 13 10 29 21 10 12 11 4 4 1 3 2 0 0 0 1 3 8 18 26 17 11 11 9 9 17 20 23 18 12 14 6 5 2 3 0 2 0 0 0 2 4 22 34 29 9 8 14 11 10 13 16 26 13 11 7 3 1 7 0 5 0 0 1 1 7 6 11 17 18 11 19 9 19 10 16 28 18 14 11 6 9 4 2 3AM Peak 0800 - 0900 (100), AM PHF=0.74 PM Peak 1645 - 1745 (106), PM PHF=0.91
* Thursday, May 21, 2015 - Total=1004, 15 minute drops 0000 0100 0200 0300 0400 0500 0600 0700 0800 0900 1000 1100 1200 1300 1400 1500 1600 1700 1800 1900 2000 2100 2200 2300 7 8 2 2 1 10 17 49 89 82 60 36 49 46 42 61 74 104 73 53 53 39 32 15 1 1 2 0 0 0 3 9 22 24 20 7 18 16 10 14 22 27 23 18 15 10 11 7 7 3 1 0 0 0 0 7 8 25 18 16 7 10 10 12 12 13 26 19 12 9 13 14 1 12 0 3 0 1 0 3 2 12 27 13 13 11 17 9 11 16 12 25 22 9 10 10 2 3 1 3 3 0 1 1 7 5 20 15 27 11 11 4 11 9 19 27 26 9 14 19 6 5 4 1AM Peak 0745 - 0845 (94), AM PHF=0.87 PM Peak 1645 - 1745 (105), PM PHF=0.97
VehicleCount-6729 Page 1

VehicleCount-6725 Page 1
Traffic Data Service -- Campbell, CAVehicle Counts
VehicleCount-6725 -- English (ENU)
Datasets: Site: [30] ESCONDIDO VILLAGE DW 4 S OF SERRA STData type: Axle sensors - Paired (Class/Speed/Count)
Profile:Included classes: 1, 2, 3, 4, 5, 6, 7, 8, 9, 10, 11, 12, 13Speed range: 0 - 100 mph.Direction: South (bound)Name: Default ProfileScheme: Vehicle classification (Scheme F)Units: Non metric (ft, mi, ft/s, mph, lb, ton)
* Tuesday, May 19, 2015 - Total=967, 15 minute drops 0000 0100 0200 0300 0400 0500 0600 0700 0800 0900 1000 1100 1200 1300 1400 1500 1600 1700 1800 1900 2000 2100 2200 2300 5 4 5 3 0 10 12 42 93 87 46 42 45 44 45 61 74 107 74 50 37 31 32 18 1 0 3 3 0 0 2 7 22 24 12 8 9 13 9 11 22 22 21 17 9 13 8 8 2 2 1 1 0 0 2 2 15 23 27 12 9 17 12 9 13 18 30 24 11 11 3 15 4 2 1 2 0 0 0 4 5 6 24 21 12 13 9 7 15 20 15 30 14 9 11 10 6 5 0 1 1 1 0 0 4 3 14 24 15 10 12 10 12 12 17 19 25 15 13 6 5 3 1 5AM Peak 0830 - 0930 (99), AM PHF=0.92 PM Peak 1700 - 1800 (107), PM PHF=0.89
* Wednesday, May 20, 2015 - Total=966, 15 minute drops 0000 0100 0200 0300 0400 0500 0600 0700 0800 0900 1000 1100 1200 1300 1400 1500 1600 1700 1800 1900 2000 2100 2200 2300 9 4 3 1 3 8 11 44 104 83 51 45 48 54 47 59 76 100 56 51 36 36 21 16 2 1 2 0 1 1 4 4 34 17 16 12 7 12 16 15 12 28 23 13 9 10 5 6 3 2 2 1 0 0 2 0 12 19 26 15 9 14 12 11 15 21 26 13 12 14 8 9 3 3 0 1 0 0 1 2 2 19 32 23 13 7 14 11 12 18 19 29 7 15 6 6 3 5 0 5 0 0 1 1 3 5 9 19 17 7 17 13 19 8 11 24 17 13 11 7 12 4 2 2AM Peak 0800 - 0900 (104), AM PHF=0.76 PM Peak 1645 - 1745 (107), PM PHF=0.92
* Thursday, May 21, 2015 - Total=1028, 15 minute drops 0000 0100 0200 0300 0400 0500 0600 0700 0800 0900 1000 1100 1200 1300 1400 1500 1600 1700 1800 1900 2000 2100 2200 2300 8 10 3 2 1 8 8 49 86 77 58 37 44 43 42 68 74 103 87 62 64 42 35 17 3 2 3 0 0 0 2 10 23 24 18 6 15 14 11 16 20 27 28 17 19 9 14 8 5 3 2 0 1 0 0 2 9 26 23 18 7 12 11 11 15 13 22 22 16 9 14 16 1 15 0 2 0 1 0 3 1 14 23 13 14 12 11 8 13 17 14 30 21 11 14 12 1 3 1 2 4 0 0 1 5 3 16 14 17 8 12 6 10 7 20 27 24 16 18 22 7 4 5 2AM Peak 0745 - 0845 (88), AM PHF=0.85 PM Peak 1645 - 1745 (106), PM PHF=0.88
VehicleCount-6725 Page 1

VehicleCount-6736 Page 1
Traffic Data Service -- Campbell, CAVehicle Counts
VehicleCount-6736 -- English (ENU)
Datasets: Site: [31] ESCONDIDO VILLAGE DW 5 W OF OLMSTED RDData type: Axle sensors - Paired (Class/Speed/Count)
Profile:Included classes: 1, 2, 3, 4, 5, 6, 7, 8, 9, 10, 11, 12, 13Speed range: 0 - 100 mph.Direction: East (bound)Name: Default ProfileScheme: Vehicle classification (Scheme F)Units: Non metric (ft, mi, ft/s, mph, lb, ton)
* Wednesday, May 20, 2015 - Total=248, 15 minute drops 0000 0100 0200 0300 0400 0500 0600 0700 0800 0900 1000 1100 1200 1300 1400 1500 1600 1700 1800 1900 2000 2100 2200 2300 1 1 1 1 2 1 5 16 27 18 21 21 9 12 9 16 19 24 15 9 10 4 4 2 0 0 0 0 1 0 1 2 10 3 10 8 3 2 3 5 0 8 8 2 2 0 2 0 0 0 1 1 0 0 1 3 2 7 4 2 5 3 5 2 3 12 4 0 1 6 2 0 0 0 0 0 0 1 1 0 0 6 4 7 5 6 1 1 3 3 2 5 6 4 1 1 0 1 0 1 0 0 0 0 0 1 6 6 4 4 2 2 4 1 5 5 7 1 2 1 1 2 1 0AM Peak 0730 - 0830 (29), AM PHF=0.72 PM Peak 1615 - 1715 (27), PM PHF=0.56
* Thursday, May 21, 2015 - Total=244, 15 minute drops 0000 0100 0200 0300 0400 0500 0600 0700 0800 0900 1000 1100 1200 1300 1400 1500 1600 1700 1800 1900 2000 2100 2200 2300 0 1 0 1 0 1 4 14 26 17 16 13 12 9 10 21 12 24 21 16 9 8 8 1 0 0 0 0 0 0 1 3 7 6 3 2 5 3 2 4 7 8 5 8 2 2 2 0 1 0 1 0 0 0 0 1 2 7 6 4 3 4 1 4 4 4 6 5 4 0 3 3 0 1 0 0 0 1 0 1 2 2 4 2 8 4 3 3 2 5 1 4 9 1 1 0 2 0 0 0 0 0 0 0 0 0 7 8 3 1 4 0 2 2 8 0 6 2 3 6 3 1 1 0AM Peak 0800 - 0900 (26), AM PHF=0.81 PM Peak 1745 - 1845 (25), PM PHF=0.69
VehicleCount-6736 Page 1

VehicleCount-6735 Page 1
Traffic Data Service -- Campbell, CAVehicle Counts
VehicleCount-6735 -- English (ENU)
Datasets: Site: [31] ESCONDIDO VILLAGE DW 5 W OF OLMSTED RDData type: Axle sensors - Paired (Class/Speed/Count)
Profile:Included classes: 1, 2, 3, 4, 5, 6, 7, 8, 9, 10, 11, 12, 13Speed range: 0 - 100 mph.Direction: West (bound)Name: Default ProfileScheme: Vehicle classification (Scheme F)Units: Non metric (ft, mi, ft/s, mph, lb, ton)
* Wednesday, May 20, 2015 - Total=240, 15 minute drops 0000 0100 0200 0300 0400 0500 0600 0700 0800 0900 1000 1100 1200 1300 1400 1500 1600 1700 1800 1900 2000 2100 2200 2300 2 2 1 2 1 1 4 9 16 20 13 14 12 6 8 15 15 25 18 16 14 14 9 3 1 1 0 0 0 0 1 1 4 2 2 4 4 0 3 5 4 6 5 4 0 5 2 1 1 0 1 1 0 1 1 0 2 3 10 3 5 4 1 1 5 6 4 3 4 5 3 2 1 1 0 0 0 1 0 0 2 4 5 3 5 1 2 1 1 4 3 8 4 4 5 3 3 1 0 1 0 0 1 0 0 1 2 4 5 3 4 2 4 3 1 2 7 6 4 4 3 2 0 0AM Peak 0830 - 0930 (21), AM PHF=0.53 PM Peak 1700 - 1800 (25), PM PHF=0.78
* Thursday, May 21, 2015 - Total=240, 15 minute drops 0000 0100 0200 0300 0400 0500 0600 0700 0800 0900 1000 1100 1200 1300 1400 1500 1600 1700 1800 1900 2000 2100 2200 2300 2 2 0 1 1 1 2 6 15 11 15 12 14 12 6 14 16 16 15 23 22 16 13 5 1 1 0 0 0 0 1 2 1 4 2 2 3 3 3 5 4 6 4 6 4 5 5 3 0 1 1 0 1 0 0 0 3 8 2 4 6 5 3 2 2 4 3 5 2 4 5 5 0 1 0 0 0 0 0 1 0 1 3 5 8 2 2 2 1 2 5 5 4 6 5 4 2 1 1 0 0 0 0 1 0 1 0 3 0 1 2 4 4 0 5 3 2 2 9 9 2 1 1 0AM Peak 0815 - 0915 (18), AM PHF=0.56 PM Peak 2030 - 2130 (24), PM PHF=0.67
VehicleCount-6735 Page 1

VehicleCount-6745 Page 1
Traffic Data Service -- Campbell, CAVehicle Counts
VehicleCount-6745 -- English (ENU)
Datasets: Site: [32] ESCONDIDO VILLAGE DW 6 W OF OLMSTED RDData type: Axle sensors - Paired (Class/Speed/Count)
Profile:Included classes: 1, 2, 3, 4, 5, 6, 7, 8, 9, 10, 11, 12, 13Speed range: 0 - 100 mph.Direction: East (bound)Name: Default ProfileScheme: Vehicle classification (Scheme F)Units: Non metric (ft, mi, ft/s, mph, lb, ton)
* Wednesday, May 20, 2015 - Total=37, 15 minute drops 0000 0100 0200 0300 0400 0500 0600 0700 0800 0900 1000 1100 1200 1300 1400 1500 1600 1700 1800 1900 2000 2100 2200 2300 0 0 0 0 0 0 0 1 2 4 7 4 0 2 2 2 1 5 3 3 0 0 1 0 0 0 0 0 0 0 0 0 0 1 2 1 0 1 1 1 0 1 0 0 0 0 0 0 0 0 0 0 0 0 0 0 1 0 1 2 1 0 1 1 0 1 1 0 0 0 0 1 0 0 0 0 0 0 0 0 0 0 1 2 1 1 0 0 0 1 0 2 3 0 0 0 0 0 0 0 0 0 0 0 0 0 0 1 0 2 1 0 0 0 0 0 1 0 3 0 0 0 0 0AM Peak 1000 - 1100 (7), AM PHF=0.88 PM Peak 1700 - 1800 (5), PM PHF=0.63
* Thursday, May 21, 2015 - Total=45, 15 minute drops 0000 0100 0200 0300 0400 0500 0600 0700 0800 0900 1000 1100 1200 1300 1400 1500 1600 1700 1800 1900 2000 2100 2200 2300 0 0 0 0 0 1 0 1 4 6 1 0 3 3 2 5 2 2 9 3 0 2 0 1 0 0 0 0 0 0 0 0 0 2 0 0 1 0 1 1 0 1 3 1 0 0 0 0 0 0 0 0 0 0 0 0 1 0 2 0 0 1 0 1 0 0 0 1 2 0 0 0 0 0 0 0 0 0 0 1 0 0 3 0 1 0 0 1 0 3 0 1 3 0 0 2 0 1 0 0 0 0 0 0 0 0 0 1 2 0 0 1 2 0 1 2 0 2 0 0 0 0 0 0AM Peak 0830 - 0930 (8), AM PHF=0.67 PM Peak 1800 - 1900 (9), PM PHF=0.75
VehicleCount-6745 Page 1

VehicleCount-6737 Page 1
Traffic Data Service -- Campbell, CAVehicle Counts
VehicleCount-6737 -- English (ENU)
Datasets: Site: [32] ESCONDIDO VILLAGE DW 6 W OF OLMSTED RDData type: Axle sensors - Paired (Class/Speed/Count)
Profile:Included classes: 1, 2, 3, 4, 5, 6, 7, 8, 9, 10, 11, 12, 13Speed range: 0 - 100 mph.Direction: West (bound)Name: Default ProfileScheme: Vehicle classification (Scheme F)Units: Non metric (ft, mi, ft/s, mph, lb, ton)
* Wednesday, May 20, 2015 - Total=48, 15 minute drops 0000 0100 0200 0300 0400 0500 0600 0700 0800 0900 1000 1100 1200 1300 1400 1500 1600 1700 1800 1900 2000 2100 2200 2300 2 0 0 0 0 0 0 0 3 4 1 3 7 2 5 5 3 2 1 6 2 1 0 1 1 0 0 0 0 0 0 0 1 1 1 0 1 1 2 4 1 0 0 6 2 0 0 0 0 1 0 0 0 0 0 0 0 0 2 0 2 0 1 2 1 0 0 1 0 0 0 0 1 0 0 0 0 0 0 0 0 0 1 1 0 1 2 0 1 0 0 2 0 0 0 1 0 0 0 0 0 0 0 0 0 0 0 1 0 0 0 4 0 0 0 2 0 0 0 0 0 0 0 0AM Peak 0830 - 0930 (5), AM PHF=0.63 PM Peak 1230 - 1330 (8), PM PHF=0.50
* Thursday, May 21, 2015 - Total=54, 15 minute drops 0000 0100 0200 0300 0400 0500 0600 0700 0800 0900 1000 1100 1200 1300 1400 1500 1600 1700 1800 1900 2000 2100 2200 2300 0 0 0 0 0 0 0 2 2 3 3 1 6 3 7 3 4 4 5 3 0 8 0 0 0 0 0 0 0 0 0 2 0 0 0 0 1 0 1 1 3 0 1 2 0 0 0 0 0 0 0 0 0 0 0 0 0 0 3 1 1 3 1 2 1 0 0 1 0 0 4 0 0 1 0 0 0 0 0 0 0 0 0 0 1 0 2 0 2 1 1 1 3 0 0 3 0 0 0 0 0 0 0 0 0 0 0 2 0 1 0 0 2 2 0 0 3 0 1 0 1 0 0 0AM Peak 1145 - 1245 (6), AM PHF=0.50 PM Peak 1745 - 1845 (8), PM PHF=0.67
VehicleCount-6737 Page 1
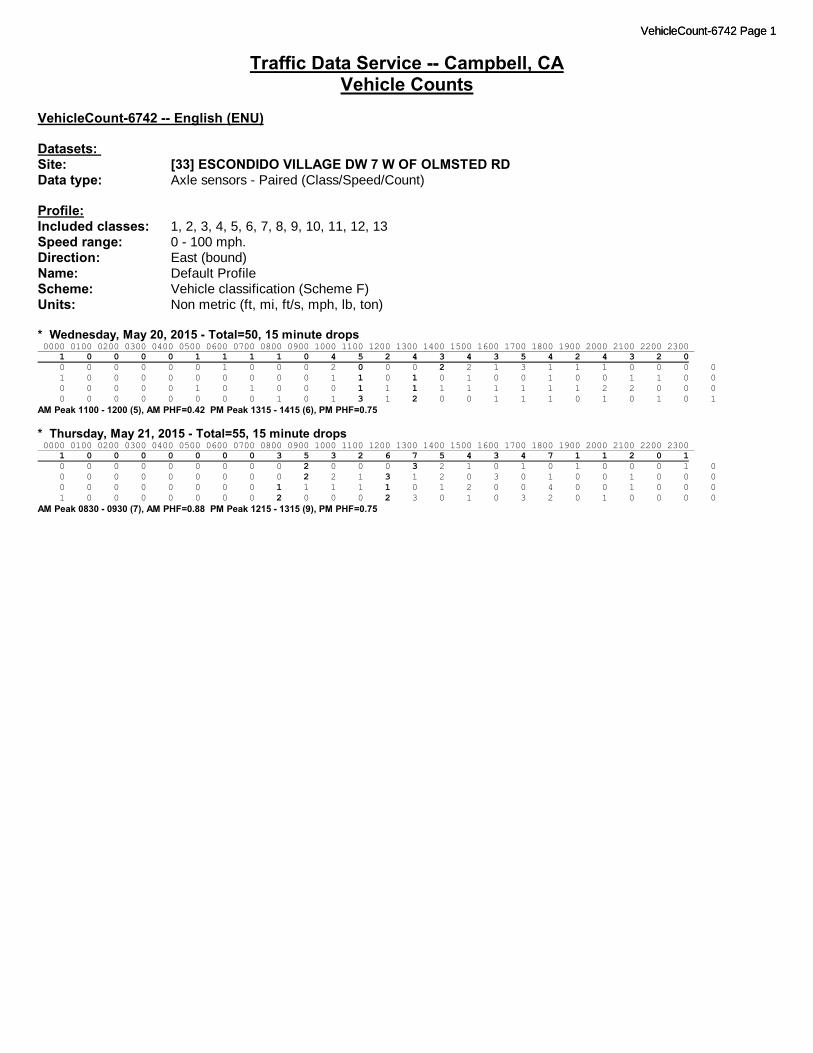
VehicleCount-6742 Page 1
Traffic Data Service -- Campbell, CAVehicle Counts
VehicleCount-6742 -- English (ENU)
Datasets: Site: [33] ESCONDIDO VILLAGE DW 7 W OF OLMSTED RDData type: Axle sensors - Paired (Class/Speed/Count)
Profile:Included classes: 1, 2, 3, 4, 5, 6, 7, 8, 9, 10, 11, 12, 13Speed range: 0 - 100 mph.Direction: East (bound)Name: Default ProfileScheme: Vehicle classification (Scheme F)Units: Non metric (ft, mi, ft/s, mph, lb, ton)
* Wednesday, May 20, 2015 - Total=50, 15 minute drops 0000 0100 0200 0300 0400 0500 0600 0700 0800 0900 1000 1100 1200 1300 1400 1500 1600 1700 1800 1900 2000 2100 2200 2300 1 0 0 0 0 1 1 1 1 0 4 5 2 4 3 4 3 5 4 2 4 3 2 0 0 0 0 0 0 0 1 0 0 0 2 0 0 0 2 2 1 3 1 1 1 0 0 0 0 1 0 0 0 0 0 0 0 0 0 1 1 0 1 0 1 0 0 1 0 0 1 1 0 0 0 0 0 0 0 1 0 1 0 0 0 1 1 1 1 1 1 1 1 1 2 2 0 0 0 0 0 0 0 0 0 0 0 1 0 1 3 1 2 0 0 1 1 1 0 1 0 1 0 1AM Peak 1100 - 1200 (5), AM PHF=0.42 PM Peak 1315 - 1415 (6), PM PHF=0.75
* Thursday, May 21, 2015 - Total=55, 15 minute drops 0000 0100 0200 0300 0400 0500 0600 0700 0800 0900 1000 1100 1200 1300 1400 1500 1600 1700 1800 1900 2000 2100 2200 2300 1 0 0 0 0 0 0 0 3 5 3 2 6 7 5 4 3 4 7 1 1 2 0 1 0 0 0 0 0 0 0 0 0 2 0 0 0 3 2 1 0 1 0 1 0 0 0 1 0 0 0 0 0 0 0 0 0 0 2 2 1 3 1 2 0 3 0 1 0 0 1 0 0 0 0 0 0 0 0 0 0 0 1 1 1 1 1 0 1 2 0 0 4 0 0 1 0 0 0 1 0 0 0 0 0 0 0 2 0 0 0 2 3 0 1 0 3 2 0 1 0 0 0 0AM Peak 0830 - 0930 (7), AM PHF=0.88 PM Peak 1215 - 1315 (9), PM PHF=0.75
VehicleCount-6742 Page 1

VehicleCount-6740 Page 1
Traffic Data Service -- Campbell, CAVehicle Counts
VehicleCount-6740 -- English (ENU)
Datasets: Site: [33] ESCONDIDO VILLAGE DW 7 W OF OLMSTED RDData type: Axle sensors - Paired (Class/Speed/Count)
Profile:Included classes: 1, 2, 3, 4, 5, 6, 7, 8, 9, 10, 11, 12, 13Speed range: 0 - 100 mph.Direction: West (bound)Name: Default ProfileScheme: Vehicle classification (Scheme F)Units: Non metric (ft, mi, ft/s, mph, lb, ton)
* Wednesday, May 20, 2015 - Total=47, 15 minute drops 0000 0100 0200 0300 0400 0500 0600 0700 0800 0900 1000 1100 1200 1300 1400 1500 1600 1700 1800 1900 2000 2100 2200 2300 1 0 0 1 0 0 0 1 1 6 3 3 3 3 6 0 1 4 3 5 2 2 2 0 1 0 0 1 0 0 0 0 0 2 0 0 1 0 1 0 1 2 1 1 0 1 0 0 0 0 0 0 0 0 0 0 0 0 3 1 0 0 0 4 0 0 1 2 2 0 0 0 0 0 0 0 0 0 0 0 0 1 1 1 2 3 1 1 1 0 0 1 0 1 0 0 1 0 0 0 0 0 0 0 0 0 0 0 0 0 0 1 2 0 0 0 0 0 1 2 1 1 0 0AM Peak 0830 - 0930 (6), AM PHF=0.50 PM Peak 1330 - 1430 (8), PM PHF=0.50
* Thursday, May 21, 2015 - Total=42, 15 minute drops 0000 0100 0200 0300 0400 0500 0600 0700 0800 0900 1000 1100 1200 1300 1400 1500 1600 1700 1800 1900 2000 2100 2200 2300 0 0 0 0 1 1 0 2 7 5 1 1 0 6 3 2 1 2 3 1 2 3 0 1 0 0 0 0 0 0 0 0 0 2 0 0 0 2 1 0 0 0 1 0 0 0 0 1 0 0 0 0 0 0 0 0 0 0 2 0 0 0 1 0 0 1 1 0 1 2 0 0 0 0 0 0 0 0 0 1 0 0 6 1 0 1 0 1 2 2 0 1 1 0 0 2 0 0 0 0 0 0 0 1 0 0 2 1 0 1 0 0 2 0 0 0 0 1 0 0 1 0 0 0AM Peak 0830 - 0930 (11), AM PHF=0.46 PM Peak 1300 - 1400 (6), PM PHF=0.75
VehicleCount-6740 Page 1

VehicleCount-6753 Page 1
Traffic Data Service -- Campbell, CAVehicle Counts
VehicleCount-6753 -- English (ENU)
Datasets: Site: [34] ESCONDIDO VILLAGE DW 8 W OF OLMSTED RDData type: Axle sensors - Paired (Class/Speed/Count)
Profile:Included classes: 1, 2, 3, 4, 5, 6, 7, 8, 9, 10, 11, 12, 13Speed range: 0 - 100 mph.Direction: East (bound)Name: Default ProfileScheme: Vehicle classification (Scheme F)Units: Non metric (ft, mi, ft/s, mph, lb, ton)
* Wednesday, May 20, 2015 - Total=278, 15 minute drops 0000 0100 0200 0300 0400 0500 0600 0700 0800 0900 1000 1100 1200 1300 1400 1500 1600 1700 1800 1900 2000 2100 2200 2300 2 0 0 1 0 0 4 24 24 22 22 15 12 13 18 19 12 22 26 13 12 12 3 2 2 0 0 0 0 0 1 2 3 5 6 3 2 2 5 6 5 4 13 2 1 4 2 0 0 0 0 0 0 0 0 0 3 7 7 11 0 3 3 3 5 2 8 7 5 5 1 0 0 1 0 0 0 1 0 0 0 5 8 4 2 4 5 5 7 2 4 2 2 4 1 1 1 1 1 0 0 0 0 0 0 3 14 6 6 3 8 2 3 3 6 1 8 4 2 5 6 0 1 0AM Peak 0745 - 0845 (32), AM PHF=0.57 PM Peak 1715 - 1815 (31), PM PHF=0.60
* Thursday, May 21, 2015 - Total=286, 15 minute drops 0000 0100 0200 0300 0400 0500 0600 0700 0800 0900 1000 1100 1200 1300 1400 1500 1600 1700 1800 1900 2000 2100 2200 2300 2 0 0 0 1 0 3 22 26 21 17 11 14 16 22 19 19 19 28 13 15 10 6 2 0 0 0 0 1 0 0 7 4 5 4 3 2 1 3 5 7 7 7 6 3 2 2 0 1 1 0 0 0 0 0 0 3 12 6 3 0 3 8 4 3 4 3 5 3 7 3 2 1 2 1 0 0 0 0 0 0 6 5 7 5 5 6 5 8 4 6 5 9 1 3 4 1 0 0 0 0 0 0 0 0 3 6 5 3 5 3 3 2 7 7 2 4 7 3 2 1 1 1 0AM Peak 0730 - 0830 (28), AM PHF=0.58 PM Peak 1800 - 1900 (28), PM PHF=0.78
VehicleCount-6753 Page 1

VehicleCount-6746 Page 1
Traffic Data Service -- Campbell, CAVehicle Counts
VehicleCount-6746 -- English (ENU)
Datasets: Site: [34] ESCONDIDO VILLAGE DW 8 W OF OLMSTED RDData type: Axle sensors - Paired (Class/Speed/Count)
Profile:Included classes: 1, 2, 3, 4, 5, 6, 7, 8, 9, 10, 11, 12, 13Speed range: 0 - 100 mph.Direction: West (bound)Name: Default ProfileScheme: Vehicle classification (Scheme F)Units: Non metric (ft, mi, ft/s, mph, lb, ton)
* Wednesday, May 20, 2015 - Total=317, 15 minute drops 0000 0100 0200 0300 0400 0500 0600 0700 0800 0900 1000 1100 1200 1300 1400 1500 1600 1700 1800 1900 2000 2100 2200 2300 4 1 1 2 2 1 1 22 20 26 19 17 17 19 13 18 17 26 26 15 23 18 7 2 3 0 0 0 0 1 1 2 5 9 5 4 1 4 4 6 7 9 13 2 3 4 4 0 2 1 0 0 1 2 0 0 5 2 8 8 4 8 6 3 5 3 7 7 2 7 1 0 1 0 0 1 0 1 0 0 0 4 9 5 3 5 3 7 4 2 4 3 1 5 3 4 2 1 0 0 0 1 0 0 0 0 11 4 4 3 4 5 2 2 5 3 7 5 6 10 9 1 0 1AM Peak 0830 - 0930 (30), AM PHF=0.83 PM Peak 1715 - 1815 (30), PM PHF=0.58
* Thursday, May 21, 2015 - Total=308, 15 minute drops 0000 0100 0200 0300 0400 0500 0600 0700 0800 0900 1000 1100 1200 1300 1400 1500 1600 1700 1800 1900 2000 2100 2200 2300 3 1 1 0 1 0 1 19 21 19 16 14 20 19 11 21 18 21 33 18 19 16 9 7 2 0 0 0 1 0 0 7 6 3 5 6 5 0 0 5 5 10 8 5 7 4 1 1 2 0 0 0 0 0 0 0 4 5 6 3 2 5 9 3 3 6 2 6 4 5 3 3 4 1 0 1 0 0 0 0 0 6 3 5 5 2 5 5 4 5 3 6 11 3 3 5 3 0 0 1 0 1 0 0 0 1 2 7 5 3 4 5 5 4 8 4 3 8 6 4 4 2 2 1AM Peak 0800 - 0900 (21), AM PHF=0.75 PM Peak 1800 - 1900 (33), PM PHF=0.75
VehicleCount-6746 Page 1

VehicleCount-6756 Page 1
Traffic Data Service -- Campbell, CAVehicle Counts
VehicleCount-6756 -- English (ENU)
Datasets: Site: [35] ESCONDIDO VILLAGE DW 9 W OF OLMSTED RDData type: Axle sensors - Paired (Class/Speed/Count)
Profile:Included classes: 1, 2, 3, 4, 5, 6, 7, 8, 9, 10, 11, 12, 13Speed range: 0 - 100 mph.Direction: East (bound)Name: Default ProfileScheme: Vehicle classification (Scheme F)Units: Non metric (ft, mi, ft/s, mph, lb, ton)
* Wednesday, May 20, 2015 - Total=306, 15 minute drops 0000 0100 0200 0300 0400 0500 0600 0700 0800 0900 1000 1100 1200 1300 1400 1500 1600 1700 1800 1900 2000 2100 2200 2300 8 0 0 0 0 2 8 13 16 19 18 9 23 18 18 11 20 15 27 27 19 10 12 13 6 0 0 0 0 0 1 2 7 6 5 2 6 3 5 2 6 4 4 11 8 0 2 5 2 0 0 0 0 0 1 1 4 2 5 5 2 7 3 2 5 2 6 6 5 2 1 4 3 2 2 0 0 0 0 0 3 3 3 5 3 1 7 4 5 1 3 3 11 5 3 5 1 5 1 0 0 0 0 0 1 3 4 4 3 5 4 3 8 6 3 9 2 6 6 6 4 5 0 1AM Peak 1145 - 1245 (24), AM PHF=0.86 PM Peak 1815 - 1915 (34), PM PHF=0.77
* Thursday, May 21, 2015 - Total=275, 15 minute drops 0000 0100 0200 0300 0400 0500 0600 0700 0800 0900 1000 1100 1200 1300 1400 1500 1600 1700 1800 1900 2000 2100 2200 2300 6 4 0 0 0 3 4 17 16 16 18 13 16 14 9 13 20 17 21 18 15 21 8 6 2 2 0 0 0 0 0 2 6 5 3 4 2 3 1 5 4 5 6 7 5 9 2 2 3 2 2 0 0 0 1 1 6 5 3 3 3 5 6 1 2 3 3 8 0 4 5 1 0 1 1 0 0 0 0 1 0 4 4 1 5 3 8 3 3 5 3 6 3 7 0 4 4 2 2 1 0 0 0 0 1 3 5 1 7 7 3 1 2 4 1 10 3 4 4 6 3 1 2 0AM Peak 0715 - 0815 (21), AM PHF=0.88 PM Peak 1645 - 1745 (24), PM PHF=0.60
VehicleCount-6756 Page 1

VehicleCount-6754 Page 1
Traffic Data Service -- Campbell, CAVehicle Counts
VehicleCount-6754 -- English (ENU)
Datasets: Site: [35] ESCONDIDO VILLAGE DW 9 W OF OLMSTED RDData type: Axle sensors - Paired (Class/Speed/Count)
Profile:Included classes: 1, 2, 3, 4, 5, 6, 7, 8, 9, 10, 11, 12, 13Speed range: 0 - 100 mph.Direction: West (bound)Name: Default ProfileScheme: Vehicle classification (Scheme F)Units: Non metric (ft, mi, ft/s, mph, lb, ton)
* Wednesday, May 20, 2015 - Total=296, 15 minute drops 0000 0100 0200 0300 0400 0500 0600 0700 0800 0900 1000 1100 1200 1300 1400 1500 1600 1700 1800 1900 2000 2100 2200 2300 5 0 0 0 0 1 6 6 9 10 15 17 16 14 11 19 22 25 23 30 22 18 15 12 3 0 0 0 0 0 1 2 3 2 2 2 3 3 5 2 6 6 6 7 8 3 6 7 1 0 0 0 0 0 1 1 2 3 4 5 2 7 3 2 7 4 2 6 7 7 3 3 2 1 2 0 0 0 0 0 3 1 1 4 6 6 4 4 3 4 5 8 7 10 2 8 1 3 0 0 0 0 0 0 0 1 1 2 0 2 7 2 4 1 6 7 9 4 6 5 4 5 0 1AM Peak 1130 - 1230 (23), AM PHF=0.82 PM Peak 1915 - 2015 (31), PM PHF=0.78
* Thursday, May 21, 2015 - Total=262, 15 minute drops 0000 0100 0200 0300 0400 0500 0600 0700 0800 0900 1000 1100 1200 1300 1400 1500 1600 1700 1800 1900 2000 2100 2200 2300 3 5 1 0 0 3 1 6 11 17 18 16 12 9 8 11 16 21 18 23 20 25 9 9 1 2 0 0 0 0 0 0 2 4 6 2 3 2 2 3 4 3 5 5 5 10 3 2 3 1 3 0 0 0 1 1 2 3 4 5 4 2 2 3 2 7 8 4 4 4 2 3 5 3 0 0 1 0 0 1 0 1 2 3 4 2 4 2 2 2 1 5 2 7 7 7 3 1 3 1 0 0 0 0 1 0 3 4 6 3 8 3 3 1 4 4 5 7 7 4 6 0 1 0AM Peak 0945 - 1045 (21), AM PHF=0.88 PM Peak 2015 - 2115 (25), PM PHF=0.63
VehicleCount-6754 Page 1

VehicleCount-6759 Page 1
Traffic Data Service -- Campbell, CAVehicle Counts
VehicleCount-6759 -- English (ENU)
Datasets: Site: [36] ESCONDIDO VILLAGE DW 10 W OF OLMSTED RDData type: Axle sensors - Paired (Class/Speed/Count)
Profile:Included classes: 1, 2, 3, 4, 5, 6, 7, 8, 9, 10, 11, 12, 13Speed range: 0 - 100 mph.Direction: East (bound)Name: Default ProfileScheme: Vehicle classification (Scheme F)Units: Non metric (ft, mi, ft/s, mph, lb, ton)
* Wednesday, May 20, 2015 - Total=182, 15 minute drops 0000 0100 0200 0300 0400 0500 0600 0700 0800 0900 1000 1100 1200 1300 1400 1500 1600 1700 1800 1900 2000 2100 2200 2300 3 7 1 0 0 0 4 6 6 14 10 6 8 6 8 16 9 11 17 15 14 11 4 6 0 0 0 0 0 0 0 2 1 4 2 1 3 1 2 1 2 2 8 4 5 5 2 1 0 0 3 0 0 0 0 0 1 0 6 2 2 1 2 0 2 4 0 1 0 3 2 0 3 1 2 2 0 0 0 0 2 1 2 3 4 2 3 2 5 5 1 5 4 7 3 2 1 1 3 1 2 1 0 0 0 2 2 3 1 2 1 1 1 1 8 2 4 4 4 3 2 1 1 1AM Peak 0845 - 0945 (16), AM PHF=0.67 PM Peak 1530 - 1630 (19), PM PHF=0.59
* Thursday, May 21, 2015 - Total=209, 15 minute drops 0000 0100 0200 0300 0400 0500 0600 0700 0800 0900 1000 1100 1200 1300 1400 1500 1600 1700 1800 1900 2000 2100 2200 2300 5 6 2 1 1 1 2 10 7 7 7 10 10 9 8 12 13 16 24 24 8 14 5 7 0 3 1 0 0 0 0 2 0 3 1 3 3 1 0 0 3 1 3 8 1 5 2 2 2 1 0 1 1 1 0 1 3 2 2 2 3 1 5 3 2 6 4 7 3 2 4 0 2 4 3 3 0 0 0 1 0 1 2 0 2 3 4 1 3 6 3 5 4 8 3 3 3 1 2 1 0 0 0 0 0 1 4 3 2 2 1 2 2 2 4 1 6 10 5 2 2 0 2 1AM Peak 1045 - 1145 (11), AM PHF=0.92 PM Peak 1815 - 1915 (29), PM PHF=0.72
VehicleCount-6759 Page 1

VehicleCount-6757 Page 1
Traffic Data Service -- Campbell, CAVehicle Counts
VehicleCount-6757 -- English (ENU)
Datasets: Site: [36] ESCONDIDO VILLAGE DW 10 W OF OLMSTED RDData type: Axle sensors - Paired (Class/Speed/Count)
Profile:Included classes: 1, 2, 3, 4, 5, 6, 7, 8, 9, 10, 11, 12, 13Speed range: 0 - 100 mph.Direction: West (bound)Name: Default ProfileScheme: Vehicle classification (Scheme F)Units: Non metric (ft, mi, ft/s, mph, lb, ton)
* Wednesday, May 20, 2015 - Total=179, 15 minute drops 0000 0100 0200 0300 0400 0500 0600 0700 0800 0900 1000 1100 1200 1300 1400 1500 1600 1700 1800 1900 2000 2100 2200 2300 3 7 1 0 0 0 1 7 7 7 6 13 8 4 7 14 8 11 12 13 25 11 9 5 0 0 0 0 0 0 0 3 0 0 0 3 2 1 3 2 6 3 3 1 7 3 3 2 0 1 3 0 0 0 0 0 2 1 3 5 3 0 1 1 2 0 3 2 3 6 4 4 2 3 1 2 1 0 0 0 1 1 1 1 1 3 4 1 3 7 2 4 4 6 4 1 0 0 2 1 2 0 0 0 0 0 1 5 3 0 4 2 1 0 3 0 1 3 3 8 3 2 1 1AM Peak 1100 - 1200 (13), AM PHF=0.81 PM Peak 2000 - 2100 (25), PM PHF=0.78
* Thursday, May 21, 2015 - Total=208, 15 minute drops 0000 0100 0200 0300 0400 0500 0600 0700 0800 0900 1000 1100 1200 1300 1400 1500 1600 1700 1800 1900 2000 2100 2200 2300 6 3 1 0 3 1 1 6 9 9 11 10 10 14 3 8 13 10 21 19 14 15 13 8 0 2 0 0 1 0 0 2 1 1 2 2 1 2 0 1 4 1 4 8 3 2 3 1 2 3 0 1 0 1 1 1 2 0 4 1 1 2 1 2 0 4 1 4 2 5 4 1 3 3 2 1 0 0 0 0 0 0 6 1 4 3 3 5 0 2 3 5 6 6 4 7 3 1 1 1 0 0 0 1 0 0 2 2 3 4 4 4 6 1 5 2 3 7 3 2 2 6 3 1AM Peak 0830 - 0930 (13), AM PHF=0.54 PM Peak 1815 - 1915 (25), PM PHF=0.78
VehicleCount-6757 Page 1

VehicleCount-6762 Page 1
Traffic Data Service -- Campbell, CAVehicle Counts
VehicleCount-6762 -- English (ENU)
Datasets: Site: [37] ESCONDIDO VILLAGE DW 11 E OF ESCONDIDO RDData type: Axle sensors - Paired (Class/Speed/Count)
Profile:Included classes: 1, 2, 3, 4, 5, 6, 7, 8, 9, 10, 11, 12, 13Speed range: 0 - 100 mph.Direction: East (bound)Name: Default ProfileScheme: Vehicle classification (Scheme F)Units: Non metric (ft, mi, ft/s, mph, lb, ton)
* Wednesday, May 20, 2015 - Total=163, 15 minute drops 0000 0100 0200 0300 0400 0500 0600 0700 0800 0900 1000 1100 1200 1300 1400 1500 1600 1700 1800 1900 2000 2100 2200 2300 0 0 0 0 0 0 0 0 6 17 26 20 14 19 25 12 9 9 1 4 1 0 0 0 0 0 0 0 0 0 0 0 0 0 2 2 3 7 7 1 4 5 0 1 0 0 0 0 0 0 0 0 0 0 0 0 0 0 4 8 5 5 2 7 2 1 3 0 2 0 0 0 0 1 0 0 0 0 0 0 0 0 1 4 6 3 1 4 10 2 1 0 0 0 1 0 0 0 0 0 0 0 0 0 0 0 0 5 9 10 10 5 6 1 7 3 1 1 1 0 0 0 0 0AM Peak 1000 - 1100 (26), AM PHF=0.65 PM Peak 1345 - 1445 (30), PM PHF=0.75
* Thursday, May 21, 2015 - Total=172, 15 minute drops 0000 0100 0200 0300 0400 0500 0600 0700 0800 0900 1000 1100 1200 1300 1400 1500 1600 1700 1800 1900 2000 2100 2200 2300 1 0 0 0 0 0 0 1 10 18 20 25 21 18 15 18 15 6 1 2 0 1 0 0 0 0 0 0 0 0 0 1 3 3 5 7 7 6 3 1 6 3 0 0 0 0 0 0 0 1 0 0 0 0 0 0 0 1 5 3 5 0 4 3 3 5 3 0 0 0 1 0 0 0 0 0 0 0 0 0 0 0 1 3 2 4 4 7 3 4 0 0 0 1 0 0 0 0 0 0 0 0 0 0 0 0 0 5 7 10 9 10 1 6 10 4 0 1 1 0 0 0 0 0AM Peak 1045 - 1145 (26), AM PHF=0.65 PM Peak 1245 - 1345 (27), PM PHF=0.68
VehicleCount-6762 Page 1

VehicleCount-6767 Page 1
Traffic Data Service -- Campbell, CAVehicle Counts
VehicleCount-6767 -- English (ENU)
Datasets: Site: [37] ESCONDIDO VILLAGE DW 11 E OF ESCONDIDO RDData type: Axle sensors - Paired (Class/Speed/Count)
Profile:Included classes: 1, 2, 3, 4, 5, 6, 7, 8, 9, 10, 11, 12, 13Speed range: 0 - 100 mph.Direction: West (bound)Name: Default ProfileScheme: Vehicle classification (Scheme F)Units: Non metric (ft, mi, ft/s, mph, lb, ton)
* Wednesday, May 20, 2015 - Total=119, 15 minute drops 0000 0100 0200 0300 0400 0500 0600 0700 0800 0900 1000 1100 1200 1300 1400 1500 1600 1700 1800 1900 2000 2100 2200 2300 0 0 0 0 0 0 0 4 8 14 21 12 18 14 13 6 2 2 0 4 0 0 0 1 0 0 0 0 0 0 0 0 2 4 1 3 3 3 2 0 0 1 0 4 0 0 0 0 0 0 0 0 0 0 0 0 0 3 4 3 5 3 3 0 1 2 0 0 0 0 0 0 0 0 0 0 0 0 0 0 0 0 1 3 11 1 8 4 5 1 0 1 0 0 0 0 0 0 0 0 0 0 0 0 0 0 4 2 3 6 3 4 4 6 4 0 0 0 0 0 0 0 1 0AM Peak 1030 - 1130 (25), AM PHF=0.57 PM Peak 1200 - 1300 (18), PM PHF=0.56
* Thursday, May 21, 2015 - Total=118, 15 minute drops 0000 0100 0200 0300 0400 0500 0600 0700 0800 0900 1000 1100 1200 1300 1400 1500 1600 1700 1800 1900 2000 2100 2200 2300 0 0 0 1 0 0 0 3 12 12 17 18 6 17 10 10 7 2 0 2 1 0 0 0 0 0 0 0 0 0 0 0 4 3 1 3 2 4 0 3 2 1 0 2 0 0 0 0 0 0 0 0 0 0 0 0 0 3 4 4 7 1 2 1 3 5 0 0 0 0 0 0 0 0 0 0 0 1 0 0 0 0 3 1 6 4 0 7 4 0 0 0 0 0 0 0 0 0 0 0 0 0 0 0 0 0 3 2 4 6 4 3 4 5 4 0 1 0 0 1 0 0 0 0AM Peak 1030 - 1130 (22), AM PHF=0.79 PM Peak 1300 - 1400 (17), PM PHF=0.61
VehicleCount-6767 Page 1

VehicleCount-6765 Page 1
Traffic Data Service -- Campbell, CAVehicle Counts
VehicleCount-6765 -- English (ENU)
Datasets: Site: [38] ESCONDIDO VILLAGE DW 12 E OF ESCONDIDO RDData type: Axle sensors - Paired (Class/Speed/Count)
Profile:Included classes: 1, 2, 3, 4, 5, 6, 7, 8, 9, 10, 11, 12, 13Speed range: 0 - 100 mph.Direction: East (bound)Name: Default ProfileScheme: Vehicle classification (Scheme F)Units: Non metric (ft, mi, ft/s, mph, lb, ton)
* Wednesday, May 20, 2015 - Total=599, 15 minute drops 0000 0100 0200 0300 0400 0500 0600 0700 0800 0900 1000 1100 1200 1300 1400 1500 1600 1700 1800 1900 2000 2100 2200 2300 15 5 3 2 0 1 6 14 11 11 21 26 29 41 38 30 25 47 65 49 42 48 51 19 7 2 0 0 0 1 2 6 3 6 6 3 8 7 8 10 5 14 23 9 10 13 17 4 8 3 2 0 1 0 0 1 4 1 1 1 5 10 11 17 4 2 16 19 16 14 14 6 7 7 3 1 1 1 0 0 1 1 2 1 9 9 5 9 4 6 11 10 14 10 11 13 16 5 4 2 0 2 0 0 0 2 3 5 3 5 9 6 14 9 10 7 7 9 14 7 8 12 3 8AM Peak 1130 - 1230 (36), AM PHF=0.90 PM Peak 1800 - 1900 (65), PM PHF=0.71
* Thursday, May 21, 2015 - Total=627, 15 minute drops 0000 0100 0200 0300 0400 0500 0600 0700 0800 0900 1000 1100 1200 1300 1400 1500 1600 1700 1800 1900 2000 2100 2200 2300 27 8 8 3 6 2 1 6 18 20 24 25 35 36 21 32 35 49 60 45 43 42 40 41 8 1 4 0 3 0 0 0 5 4 5 10 9 12 6 2 9 6 6 9 12 18 8 11 2 7 2 3 3 2 0 0 0 2 3 6 8 9 14 7 10 8 15 19 10 8 6 9 6 4 4 1 1 0 0 1 1 3 5 5 6 4 9 7 2 8 6 13 17 17 12 9 10 11 2 8 4 0 0 1 1 0 3 6 8 7 3 8 3 6 12 12 15 18 9 11 9 13 13 3AM Peak 1030 - 1130 (31), AM PHF=0.78 PM Peak 1815 - 1915 (63), PM PHF=0.83
VehicleCount-6765 Page 1

VehicleCount-6771 Page 1
Traffic Data Service -- Campbell, CAVehicle Counts
VehicleCount-6771 -- English (ENU)
Datasets: Site: [38] ESCONDIDO VILLAGE DW 12 E OF ESCONDIDO RDData type: Axle sensors - Paired (Class/Speed/Count)
Profile:Included classes: 1, 2, 3, 4, 5, 6, 7, 8, 9, 10, 11, 12, 13Speed range: 0 - 100 mph.Direction: West (bound)Name: Default ProfileScheme: Vehicle classification (Scheme F)Units: Non metric (ft, mi, ft/s, mph, lb, ton)
* Wednesday, May 20, 2015 - Total=628, 15 minute drops 0000 0100 0200 0300 0400 0500 0600 0700 0800 0900 1000 1100 1200 1300 1400 1500 1600 1700 1800 1900 2000 2100 2200 2300 8 3 2 0 1 1 11 21 43 57 52 55 36 41 42 30 26 30 49 32 19 32 24 13 4 1 0 0 1 1 2 5 10 11 6 11 8 14 14 8 5 10 20 11 2 11 5 5 4 1 1 0 0 0 0 3 4 6 18 11 17 14 6 16 9 10 8 17 12 10 8 4 2 5 2 1 1 0 0 0 1 1 9 9 17 10 9 10 4 5 3 4 7 3 5 11 7 3 6 1 0 1 0 0 0 5 11 18 19 18 17 5 11 8 8 8 8 5 6 2 2 8 3 8AM Peak 1030 - 1130 (63), AM PHF=0.88 PM Peak 1745 - 1845 (52), PM PHF=0.65
* Thursday, May 21, 2015 - Total=643, 15 minute drops 0000 0100 0200 0300 0400 0500 0600 0700 0800 0900 1000 1100 1200 1300 1400 1500 1600 1700 1800 1900 2000 2100 2200 2300 23 4 5 1 4 5 6 15 45 64 48 51 50 35 31 29 28 35 39 34 32 26 17 16 4 0 2 0 3 1 1 1 10 12 8 14 9 8 11 7 9 13 7 11 12 8 2 4 0 5 1 1 1 1 0 0 1 6 25 13 14 14 8 7 8 9 3 10 5 7 4 5 1 2 6 1 1 0 0 3 3 2 10 11 13 12 17 13 5 7 3 6 6 11 6 11 7 2 3 8 2 1 0 0 1 2 11 19 16 14 11 10 6 8 7 7 13 16 7 7 3 3 9 1AM Peak 0845 - 0945 (67), AM PHF=0.67 PM Peak 1200 - 1300 (50), PM PHF=0.74
VehicleCount-6771 Page 1