7 march 2018 rolls-royce holdings plc 2017 …/media/files/r/rolls-royce/documents/... · 1 7 march...
TRANSCRIPT

1
7 March 2018
ROLLS-ROYCE HOLDINGS PLC 2017 FULL YEAR RESULTS
ENCOURAGING RESULTS
Commenting on the results, Warren East, Chief Executive, said: “Rolls-Royce made good progress in 2017. Financial results were ahead of our expectations and we achieved a number of important operational and technological milestones, but were impacted by the increasing cost and challenge of managing significant in-service engine issues. The business unit simplification and restructuring programme that we announced this January will drive further rationalisation and is a fundamental step in the journey started two years ago to bring Rolls-Royce closer to its full potential both operationally and financially.
We are encouraged by the improving financial performance in 2017 with growing revenues contributing to improved profitability and cash generation. Looking forward, sustaining this improvement and delivering increasing cash flow generation will strengthen our position as one of the world’s leading industrial technology companies.”
Underlying Reported
Year to 31 December 2017 2016 Organic change*
2017 2016 Change
Revenue (£m) 15,090 13,783 +6% 16,307 14,955 +9%
Profit before tax (£m) 1,071 813 +25% 4,897 (4,636) N/M
Earnings per share 40.5p 30.1p +27% 229.4p (220.1)p N/M
2017 2016 Change
Adj. Net debt (£m)** (520) (225) (295)
Free cash flow (£m) 273 100 173
Payment per share 11.7p 11.7p * Organic change at constant translational currency (‘constant currency’) and excluding M&A **Adj net debt excludes ITP Aero’s £215m net cash. Reported net debt was £305m. FCF excludes £14m post-acquisition ITP Aero cash outflow Percentage or absolute change figures in this document are on an organic basis unless otherwise stated
Group financial highlights
Reported revenue of £16,307m; up 6% on underlying basis, Civil Aerospace service revenues up 12%
Underlying profit before tax up 25% to £1,071m; strong contribution from Power Systems
Reported profit before tax of £4,897m; includes a £2.6bn non-cash profit (2016: £4.4bn loss) from the revaluation of our $38.5bn hedge book as sterling strengthened
Free cash flow improvement driven by improved profits and good working capital management
2016-17 transformation programme achieved £200m run-rate savings; at top end of guidance
€718m ITP Aero acquisition completed in December 2017, first instalment in shares (9.61m issued) Group operational highlights
Civil Aerospace widebody invoiced flying hours up 12%; significant in-service engine issues: in-year £170m cash cost (2016: £90m) and £227m charge to profit (2016: £98m)
Large engine deliveries up by 35% to a record 483 (2016: 357 engines)
Good further progress with Trent XWB-84 OE economics (cash deficit down 37%)
Successful UltraFan Power Gearbox testing and Advance3 engine first run completed
Strong recovery in Power Systems under new leadership; revenue growth, significant cost savings and strong cash generation
Marine results stable year on year; restructuring benefits delivered; strategic review of Commercial Marine business underway
2
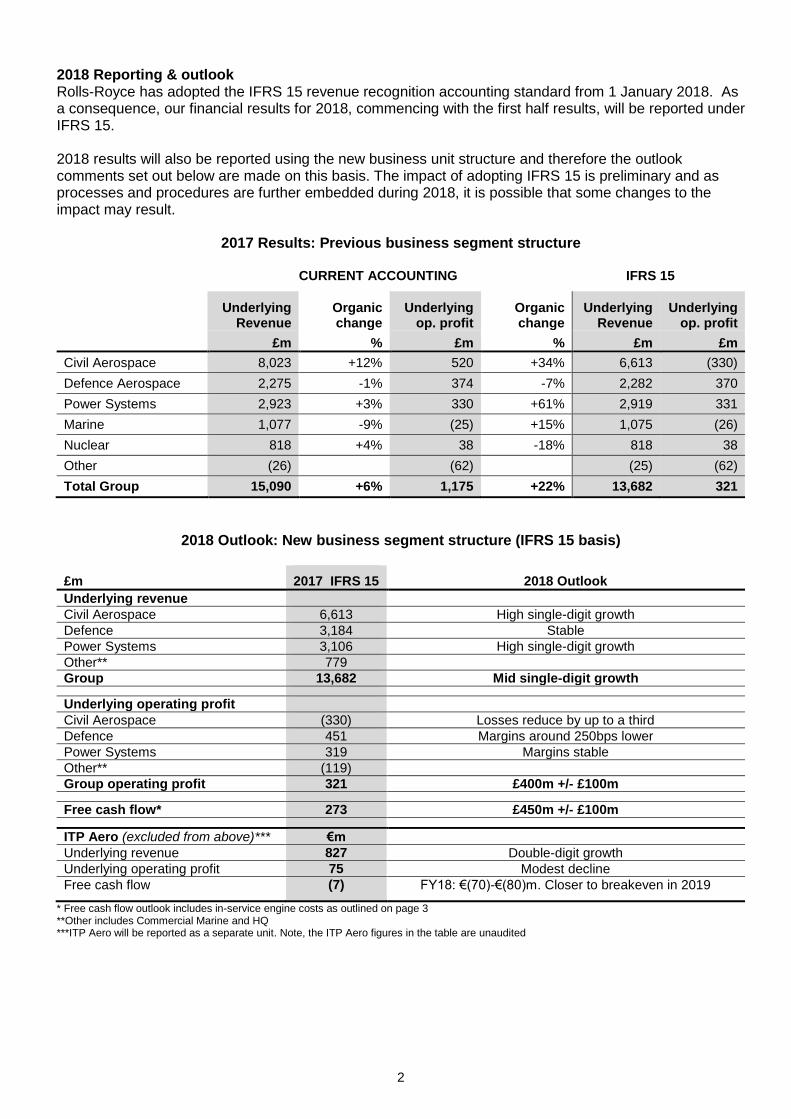
2018 Reporting & outlook Rolls-Royce has adopted the IFRS 15 revenue recognition accounting standard from 1 January 2018. As a consequence, our financial results for 2018, commencing with the first half results, will be reported under IFRS 15. 2018 results will also be reported using the new business unit structure and therefore the outlook comments set out below are made on this basis. The impact of adopting IFRS 15 is preliminary and as processes and procedures are further embedded during 2018, it is possible that some changes to the impact may result.
2017 Results: Previous business segment structure
CURRENT ACCOUNTING IFRS 15
Underlying Revenue
Organic change
Underlying op. profit
Organic change
Underlying Revenue
Underlying op. profit
£m % £m % £m £m
Civil Aerospace 8,023 +12% 520 +34% 6,613 (330)
Defence Aerospace 2,275 -1% 374 -7% 2,282 370
Power Systems 2,923 +3% 330 +61% 2,919 331
Marine 1,077 -9% (25) +15% 1,075 (26)
Nuclear 818 +4% 38 -18% 818 38
Other (26)
(62)
(25) (62)
Total Group 15,090 +6% 1,175 +22% 13,682 321
2018 Outlook: New business segment structure (IFRS 15 basis)
£m 2017 IFRS 15 2018 Outlook
Underlying revenue
Civil Aerospace 6,613 High single-digit growth
Defence 3,184 Stable
Power Systems 3,106 High single-digit growth
Other** 779
Group 13,682 Mid single-digit growth
Underlying operating profit
Civil Aerospace (330) Losses reduce by up to a third
Defence 451 Margins around 250bps lower
Power Systems 319 Margins stable
Other** (119)
Group operating profit 321 £400m +/- £100m
Free cash flow* 273 £450m +/- £100m
ITP Aero (excluded from above)*** €m
Underlying revenue 827 Double-digit growth
Underlying operating profit 75 Modest decline
Free cash flow (7) FY18: €(70)-€(80)m. Closer to breakeven in 2019
* Free cash flow outlook includes in-service engine costs as outlined on page 3 **Other includes Commercial Marine and HQ ***ITP Aero will be reported as a separate unit. Note, the ITP Aero figures in the table are unaudited
3
Commenting on the Group’s outlook, Warren East added: “As I look to the year ahead, we are embarking on a more fundamental restructuring programme with a refreshed leadership team and an improved market environment. The new business structure provides us with a clearer focus on our customers and markets and, combined with our growing installed base, particularly of widebody engines, delivers the potential to drive sustainable long term free cash flow towards our mid-term ambition of around £1bn by around 2020 with further growth over the subsequent years. 2018 will be one of significant operational progress. In Civil Aerospace we will continue to grow our installed widebody fleet and further reduce cash deficits on engine sales. At the same time over the next few years we will be continuing to implement solutions for our airline customers to address the in-service engine issues we are currently experiencing, the estimated costs of which are significant but are included in our cash flow, revenue and earnings guidance for 2018 and beyond. While Defence faces some challenges due to timing changes on export activity and in contract mix, we continue to have attractive longer term export opportunities. After a year of strong recovery, Power Systems is well positioned for another year of good progress, all of which bodes well for the year ahead.” Rolls-Royce business structure simplification and further restructuring In January 2018 we announced a programme to further simplify the business, including the evaluation of strategic options for Commercial Marine and a reduction from five business units to three tightly focussed operating businesses based around Civil Aerospace, Defence and Power Systems. This rationalisation will facilitate a more fundamental restructuring, with empowered businesses supported by a much leaner corporate centre. The restructure will focus on operational restructuring of management, support and engineering and technology functions across the corporate centre and also in our three divisions, driving simplicity, agility and pace into our business. We are proposing to move to a considerably simplified staff structure, with fewer layers and greater spans of control across the group. We have retained restructuring experts Alvarez & Marsal to support us with this programme. We expect this programme to deliver a significant reduction in costs and assist us in improving performance across the Group as a whole, and we will provide clarity of these benefits later in the year. Civil in-service engine performance Our large engine fleet has continued to grow, with over 4,400 engines in active service at the end of 2017, up 7%, on 2016. Invoiced flying hours increased by 12% compared with growth of 4% in 2016. The Trent XWB-84 was a strong contributor to this growth. This engine now represents 6% of our in-service widebody fleet and has achieved over 1.2 million flying hours with unparalleled levels of reliability. It is expected that the Trent XWB-84 fleet will grow to around 1,000 engines over the next five years. The Trent 700 (36% of our total widebody fleet) continued to perform well in service, and achieved a dispatch reliability of 99.9%. The RB211, Trent 500 and Trent 800 comprise 39% of the widebody fleet and are also performing well in service. We have, however, experienced an increased level of activity managing significant in-service engine issues on two engine programmes in 2017. This has principally been due to lower than expected durability of a small number of parts for the Trent 1000 (11% of our total widebody fleet) and the Trent 900 (8% of our total widebody fleet). These issues have required urgent short-term support including both on-wing and shop visit intervention which has resulted in increased disruption for some of our customers. This has been a dynamic situation. We have continued to progress our understanding of both the technical and operational issues and we are making solid progress with longer-term solutions, largely through re-designing affected parts. These are expected to be fully embodied in the Trent 1000 fleet by 2022. On the Trent 900, an extended life turbine blade is already being rolled-out into the current fleet with further re-designs underway which will be available in 2020. Total charges of £227m (2016: £98m) were recognised in the income statement in relation to the Trent 1000 and Trent 900 accelerated maintenance activity and £170m (2016: £90m) in our cash flow. Based on our current estimates, in 2018 the anticipated annual cash impact in respect of both the Trent 1000 and the Trent 900 is expected to broadly double from the total cash cost in 2017 of £170m and reach

4
a peak in 2018, as maintenance activity intensifies. It is then expected to fall by around £100m in 2019. The majority of the work will be undertaken in 2018 and 2019 although it is expected to be fully complete by 2022. All of these costs are included in our cash flow guidance for 2018 and beyond. Balance sheet, capital allocation and payments to shareholders A disciplined approach to capital allocation and to sustaining a healthy balance sheet will play a major part in driving our long-term growth. Through improved free cash flow generation we aim to maintain a strong investment grade rating and ultimately return to A-grade status. For 2017 the final payment to shareholders is held at 7.1 pence giving a full year payment of 11.7 pence (2016 full year: 11.7 pence). Restoring our shareholder payments to an appropriate level over time as free cash flow grows will be a key capital allocation priority. Growing free cash flow will also help sustain our investment in R&D programmes. Through targeted investment we will capture carefully selected growth opportunities. We will provide more details for our capital allocation strategy at our Capital Markets event in June 2018.
ITP Aero acquisition The €718m acquisition of the 53.1% of ITP Aero we did not already own was completed on 19 December 2017 and the first of eight instalments of the consideration was made through the issuance of 9.61m shares in mid-January 2018. In line with the agreement with the Spanish regulator, ITP Aero will be managed and reported as a separate unit. Given the proximity of closing to our year end, ITP Aero’s trading in the post-acquisition period was immaterial to our results of operations. Capital Markets event Rolls-Royce plans to hold a Capital Markets event based in London on 15 June 2018 at which we will be in a position to provide information on the expected nature, financial benefits and exceptional restructuring costs of the simplification and restructuring programme together with more detailed insights into our capital allocation strategy and longer-term KPIs for the business. Group Financial Highlights – Data table
Financial Civil Aerospace Metrics £m 2017 2016 2017 2016
Underlying op. profit 1,175 915 Large engine in-service fleet 4,409 4,137
Underlying PBT 1,071 813
Reported PBT 4,897 (4,636) Large engines deliveries 483 357
Underlying effective tax rate
31% 32%
Reported effective tax rate 14% 13% Avg installed OE cash deficit (£m)
(1.6) (1.6)
Gross R&D spend 1,392 1,331
Net R&D spend 1,035 937 Trent XWB-84 OE cash deficit reduction
-37% -7%
R&D capitalisation 342 99
Capex
764 626 Large engine invoiced flying hours
12.6m 11.2m
FCF 273 100 Total in-service revenue growth
12%
-1%
Adj. Net debt (£m)**** (520) (225)
Hedge book $/£ average $1.55 $1.55 Large engine LTSA major refurbishment overhauls
240 240
Hedge book US$bn US$38.5 US$37.8
Notes to financial tables on pages 1-4: Underlying: for definition see note 2 on page 43 * organic change is shown on a constant translational currency basis and excludes M&A impacts; ** translated at actual exchange rates; ***free cash flow defined as operating cash after capital expenditure, pensions and taxes, before payments to shareholders and acquisitions & disposals. The derivation of free cash flow from the cash flow statement is shown on page 52. ****Adj net debt excludes ITP Aero’s £215m net cash. Reported net debt was £305m. LTSA is long term service agreement (TotalCare)

5
2017 Business Unit Highlights Percentage or absolute change figures in this document are on an organic basis unless otherwise stated.
Civil Aerospace - underlying revenue of £8,023m, underlying operating profit of £520m
Underlying revenue and underlying operating profit growth of 12% and 34% respectively, driven by 35% increase in large engine delivery volumes and a 12% increase in invoiced flying hours
Underlying services revenue grew by 12%
Unit cost reductions and pricing improvements; 37% reduction in Trent XWB-84 cash deficit; overall OE cash deficit stable at £1.6m, as expected given the change in production mix
Good progress on new engine programmes during 2017: Trent 1000 TEN entering into service, Trent XWB-97 achieving certification, and Trent 7000 powering Airbus A330neo first flight
Significant in-service engine issues on Trent 1000 and Trent 900; principally due to lower than expected durability of certain turbine and compressor rotor blade parts (see page 14); focus to mitigate disruption to customers, current year £227m income statement charge and £170m impact to cash flow
Change in R&D policy application: £83m of the £243m increase in R&D capitalisation in year
Defence Aerospace - underlying revenue of £2,275m, underlying operating profit of £374m
Underlying revenue broadly flat with modest decline in both spare parts and LTSA revenues, the latter due to the retirement of the UK MoD’s Gnome-powered Sea King fleet in 2016
Underlying operating profit down 7% through product mix and higher R&D spend reflecting ongoing future programme development
Order intake of over $1.4bn secured in the US, including further funding for long term service contracts with US Department of Defense
Expansion of services offering through the opening of new Service Delivery Centres in Lossiemouth and Bangalore and extended supply agreement signed with Aviall, a Boeing company
Joint venture signed with Turkish industrial conglomerate Kale Group to develop an indigenous engine solution for the TF-X combat programme
Power Systems - underlying revenue of £2,923m, underlying operating profit of £330m
New leadership team driving transformation programme to streamline product portfolio, reduce fixed costs and improve cash conversion
Improved financial performance with 3% growth in underlying revenue; signs of market recovery
Power generation products enjoyed good demand from China and for US data centres
240bp rise in underlying gross margin to 28.8% and material improvement in cash flow
Services revenue growth of 6%: recovery in US spares demand and growing interest in a repair/ reconditioning solution; MTU’s first long-term availability contract signed with Hitachi Rail in UK
Launch of Customer Care Centres and digital solutions reflect focus on customer service initiatives to provide service capability for the installed base of over 100,000 engines
Marine - underlying revenue of £1,077m, underlying operating (loss) of £(25)m
Underlying revenue 9% lower, reflecting ongoing offshore market weakness
Underlying operating loss reduced through strong focus on cost control; modest cash outflow
Continued investment in Rauma facility, Finland, to create state-of-the-art production and test facilities, together with progress on autonomous shipping programme
Strategic review of Commercial Marine business underway
Nuclear - underlying revenue of £818m, underlying operating profit of £38m
Underlying revenue up 4% on greater submarine activity, but lower underlying operating profit as R&D spend on Small Modular Reactors increased
Submarines achieves strong improvements in operational delivery; further investment in facilities
Civil Nuclear delivered key milestones as part of the long-term, retrofit contracts in France and Finland

6
Further guidance for 2018 underlying results under IFRS 15 basis Civil Aerospace
Revenue growth from higher OE delivery volumes and services activity
Higher services activity driving profit growth. Around £50m increased R&D capitalisation
Increased cash flow from continued flying hour growth and further working capital improvements
But higher deliveries of cash deficit OE engines albeit at lower unit losses
Higher Trent 1000 and Trent 900 in-service costs Defence
Headwinds from timing changes on export activity and in contract mix, higher investment to support new product development
Expected non-repeat of £30m favourable timing benefit from the Aviall spares distribution contract Power Systems
Continued recovery of naval, oil & gas, and construction & agriculture end markets
Product mix towards lower margin mining and construction & agricultural products
Higher R&D spend on alternative fuel solutions
ITP Aero
Double digit revenue growth driven by strong increase in delivery volumes on civil programmes
Margin contraction driven by mix change. Lower volumes of higher margin defence engines with strong growth in less profitable civil engines
Higher cash outflow as a result of investments and contributions to third party programmes. Cash flow expected to move closer to breakeven in 2019
Commercial Marine business: Ongoing cost savings helping to mitigate tough market conditions Foreign exchange – guidance assumes that foreign exchange rates for the full year remain unchanged from those at the end of 2017. We expect the average USD:GBP achieved hedge rate for 2018 to be unchanged (2017: $1.54).
Net R&D – excluding ITP Aero, net R&D spend is expected to increase by around £50m in 2018 (2017: £1,035m)
Tax charge - we expect our underlying tax charge to show a modest reduction to the prior year (2017: £166m), however it will remain sensitive to the geographical mix of profit. Cash tax is expected to increase substantially in 2018 through timing effects, despite a modest benefit from US tax reform.
Capital expenditure – capital expenditure for 2018 is expected to be around £775m (2017: £764m)
Finance charges - underlying finance charges in 2018 (2017: £112m) are expected to be around £130m partly reflecting the increased level of net debt, and inclusion of ITP Aero.

7
This announcement has been determined to contain inside information.
Enquiries Investors: Jennifer Ramsey +44 20 7227 9087 Helen Harman +44 20 7227 9339 Ross Hawley +44 20 7227 9282
Media: Richard Wray +44 20 7227 9163
Photographs and broadcast-standard video are available at www.rolls-royce.com. A PDF copy of this report can be downloaded from www.rolls-royce.com/investors. This Full Year Results announcement contains forward-looking statements. Any statements that express forecasts, expectations and projections are not guarantees of future performance and will not be updated. By their nature, these statements involve risk and uncertainty, and a number of factors could cause material differences to the actual results or developments. This report is intended to provide information to shareholders, is not designed to be relied upon by any other party, or for any other purpose and the Company and its directors accept no liability to any other person other than under English law. Results presentation A presentation will be held at 09:00 (GMT) today. Details of how to join the event online are provided below. Downloadable materials will be available on the Investor Relations section of the Rolls-Royce website from the start of the event. Online webcast registration details for 7 March presentation To register for the live webcast, including Q&A participation, please visit the following link:
https://edge.media-server.com/m6/p/m688e88o Please use this same link to access the webcast replay which will be made available shortly after the event.

8
Chief Executive Review
Introduction Rolls-Royce made good progress in 2017, achieving a number of important operational and technological milestones. Financial results were ahead of our expectations as we delivered growth in underlying revenue, underlying operating profit and free cash flow. This was achieved while focusing on managing in-service fleet issues on the Trent 1000 and Trent 900 engines that led to increased costs as efforts were made to minimise the disruptive impact on our customers and to develop longer-term solutions. There was better understanding across the business of the need for cultural change and tangible progress in our efforts to increase openness and transparency with investors. In 2017, we strengthened the executive leadership team (ELT) as we continued to drive cultural change across the Group. We completed our strategic update and are ready to move forward in our drive for pace and simplicity, restructuring from five to three businesses, with a review of strategic options for our commercial marine operation.
Good progress in 2017 Civil Aerospace had some notable successes in 2017 with record levels of large engine deliveries, further expanding the installed fleet and generating service revenue growth. We made good progress with our new large engine programmes, achieving the first flight of three new engine designs within a twelve-month period. Power Systems delivered a strong performance in its first year with new leadership, streamlining the product portfolio and making new inroads into the Chinese market. Defence Aerospace had another solid year as we renewed a number of core US contracts and further developed our service delivery capability. We delivered operational improvements in Nuclear, while in Marine we established leadership in ship intelligence and autonomous shipping. We also received regulatory approval for the acquisition of ITP Aero which was completed on 19 December 2017.
Challenges in 2017 The Group faced several challenges in the year. These are not unusual given the nature of the industries in which we operate. In Civil Aerospace, production milestones were achieved against a backdrop of capacity constraints, primarily blade manufacturing and test bed availability, driven by the in-service fleet issues on the Trent 1000 and Trent 900. As we gained a fuller understanding of the extent of the technical issues involved during the year, we increased our estimates of additional maintenance activity required to mitigate problems, to develop longer-term solutions and to support customers through a proactive engine management programme. In Marine, with the average Brent crude oil price remaining below $55 per barrel for the third consecutive year, our commercial marine operation continued to see substantially reduced activity levels in its historically important offshore market.
Restructuring Efficiencies from the 2015 transformation programme have achieved run-rate cost savings at the top end of our initial expectations of £200m by the end of 2017. However, costs and complexity within the Group remain too high. The further simplification announced in January 2018 to move from five to three operating businesses will enable us to act with greater pace, to innovate in core technologies and to better take advantage of future opportunities in areas such as electrification and digitalisation. It will also help us to undertake a more fundamental restructuring to remove duplicated support and management functions. Within the Group we appreciate that talk of simplification must translate into greater enablement for our people if we are to succeed in bringing about lasting change. These efforts must begin with our leaders and during the year I brought in additional talent and experience to the ELT with the appointment of Stephen Daintith as Chief Financial Officer, Paul Stein as Chief Technology Officer and Simon Kirby as Chief Operating Officer. In early 2018, we announced Chris Cholerton would be taking up the post of President – Civil Aerospace, Tom Bell would be returning to Rolls-Royce as President – Defence and Harry Holt took up the post of Group HR Director.

9
Group Trading Summary The table below and all commentary relates to underlying performance unless otherwise stated
£m 2017 2016 Change Organic change
Order book* 78,476 80,910 -3% -3%
Underlying revenue 15,090 13,783 +9% +6%
Underlying OE revenue 7,687 7,027 +9% +6%
Underlying services revenue 7,403 6,756 +10% +7%
Underlying gross profit 2,973 2,818 +6% +1%
Gross margin % 19.7% 20.4% -70bps -100bps
Commercial and administration costs (1,168) (1,158) +1% -3%
Research and development costs (737) (862) -15% -18%
Joint ventures and associates 107 117 -9% -13%
Underlying operating profit 1,175 915 +28% +22%
Underlying operating margin 7.8% 6.6% +120bps +100bps
Financing costs (104) (102) +2%
Underlying profit before tax 1,071 813 +32%
Tax (328) (261) +26%
Underlying profit for the year 743 552 +35%
Underlying earnings per share 40.46 30.13 +34%
Free Cash Flow 273 100 n/a *The 2016 opening order book has been restated by £1.5bn reflecting a methodology change in the exchange rates used to translate order books – moving from long term planning rates to period spot rates - for overseas subsidiaries, and a restatement of Defence’s order book opening balance by £(441)m.
Underlying revenue up 6% Group revenue rose 6% to £15,090m, reflecting 6% growth in original equipment and 7% in services. Civil Aerospace led the progress, with revenues up 12% reflecting strong growth in OE engine delivery volumes (up 5% in total and up 35% for widebody). Services revenues at Civil Aerospace rose 12%, benefitting from the growing installed base of in-service large engines, which rose 7% to 4,409. Power Systems revenue grew 3% driven by growth in commodity-related markets, construction & agriculture and power generation business. Marine revenues were weak, down 9%, reflecting ongoing weakness in the offshore oil & gas markets. Nuclear revenues rose 4%.
Gross profit up 1% Gross profit rose 1% to £2,973m, with gross margins of 19.7%, down 100bps in the year. This decline was driven by both Civil Aerospace and Defence Aerospace. Civil Aerospace margins reflected the impact of higher volumes of unlinked OE engines, which carry an OE deficit, allied to lower long term service agreement (LTSA) margins and other related costs driven by additional maintenance costs on Trent 1000 and Trent 900. Defence Aerospace gross margins were impacted by lower spares volumes and lower LTSA contract margin improvements. Power Systems saw a strong gross margin improvement of 240bps, principally reflecting improved product mix and pricing discipline.
R&D costs down 18% Gross research & development expenditure grew 1% to £1,392m. After funding from customers and other third parties, self-funded R&D rose 7% to £1,035m. This was primarily driven by increased investment in Civil Aerospace with the development of a number of new engines plus ongoing investment in existing product improvement, including fuel burn efficiency enhancements. Capitalisation of R&D rose from £99m to £342m due to the stage of development programmes and included £83m from a policy application change. Contributions from risk & revenue sharing partners declined £24m. Overall the underlying expensed R&D charge fell 18% to £737m.

10
C&A costs down 3% Commercial & administrative costs were £1,168m, 3% down on the prior year, reflecting the beneficial effects of transformation actions to reduce overhead costs. Looking ahead to 2018 and beyond, we expect to realise additional benefits from further restructuring of our support and management functions.
Exceptional restructuring charges £104m of exceptional restructuring charges were taken in 2017 (£129m in 2016) primarily due to restructuring at Power Systems and Defence, reflecting actions to remove cost and improve operational efficiency. Underlying operating profit up £260m Underlying operating profit of £1,175m (2016: £915m) was up 22% reflecting a number of factors:
Civil Aerospace profit increased to £520m, up 34% with positive margin contribution from higher linked
Trent 700 OE sales, increased services revenues and higher sales of spare parts. This was offset by
higher costs relating to the Trent 1000 and Trent 900 in-service engine issues, with £227m of costs
charged for these. Expensed R&D fell £156m to £412m reflecting increased capitalisation
Defence Aerospace profit of £374m was down 7% due to lower demand for engine spares, higher
restructuring costs and a £14m reduction in LTSA contract margin improvements taken in 2016. These
more than offset the non-repeat of the TP400 charge of £31m in 2016
Power Systems made excellent progress in 2017, with profit of £330m up 61%, reflecting 3% revenue
growth, a 240bps expansion in gross margin, due to better mix and pricing discipline, and benefits of
overhead cost reduction actions which saw C&A costs fall 7%
Despite the 9% decline in Marine revenue, restructuring drove a material reduction in overhead costs
with C&A costs 13% lower, helping to reduce underlying operating losses to £25m (a £2m
improvement versus 2016)
Nuclear operating profit of £38m was 18% lower versus 2016, primarily reflecting a higher R&D charge
of £23m compared with the £6m incurred in 2016 which had benefitted from a one-off positive of £7m
due to the change in treatment of R&D credits
Payment to shareholders held flat For 2017 the final payment to shareholders is held at 7.1 pence giving a full year payment of 11.7 pence (2016 full year: 11.7 pence), a cash cost of £216m. Restoring our shareholder payments to an appropriate level over time as free cash flow grows will be a key capital allocation priority. Reported results Reported profit before tax was £4.9bn, a material increase over the 2016 loss of £4.6bn. This included £798m of gains resulting from the acquisition of ITP Aero, a positive FX mark-to-market adjustment of our hedge book of £2.6bn (£4.4bn negative in 2016), a charge of £671m for financial penalties from agreements with investigating bodies in 2016, a charge (principally relating to the Vickers Group Pension Scheme) of £306m for the restructuring of the UK pension schemes in 2016 and goodwill / other impairments of £24m versus £219m in 2016. This also includes improvements in other operational performances as highlighted above. Free cash flow improving Free cash inflow in the year was better than expected at £273m (2016: £100m), excluding the £14m post-acquisition cash outflow of ITP Aero. The strong cash flow performance was driven by higher profitability at Civil Aerospace, Defence Aerospace and Power Systems and good working capital performance, again principally in receivables, across the Group. This was achieved despite £98m of higher R&D cash spend in 2017, a £188m increase in capital expenditure and the reversal of the £180m working capital management benefit generated in the first half. Trading cash flow at Civil Aerospace of £38m was unchanged year on year. This reflected increased flying hour receipts and higher spare parts sales, offset by an increased outflow from higher deliveries of OE widebody engines and the higher Trent 1000 accelerated maintenance activity. Total cash costs incurred in the year on Trent 1000 and Trent 900 in-service issues were £170m (2016 £90m).

11
Looking ahead, improved Civil Aerospace engine OE economics and increased engine flying hours will drive a further improvement in free cash flow in 2018 and beyond. More details on the movement in trading and free cash flow are included in the funds flow section of the Additional Financial Review.
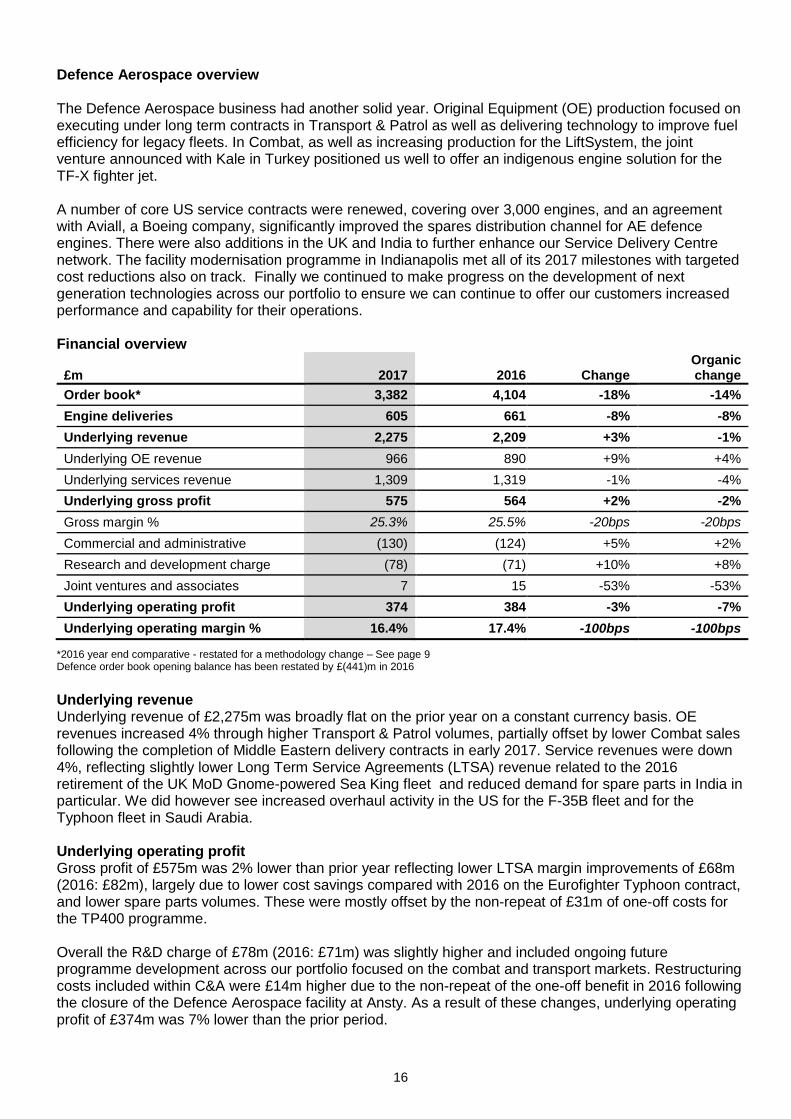
IFRS 15 As highlighted in 2016, the introduction of the new revenue reporting standard, IFRS 15 Revenue from Contracts with Customers, will change fundamentally how Rolls-Royce measures its revenues and profits, Civil Aerospace having by far the largest impact. There are three broad implications:
Linked accounting will cease to exist so all OE sales will be treated on the same basis;
OE engine cash deficits will no longer be capitalised and recorded as contractual aftermarket rights,
they will instead be recognised on delivery;
Revenue and profits for aftermarket services will be recognised on an activity basis as costs are
incurred.
Further information on the 2017 results under IFRS 15 can be found on page 26. Net debt In 2017 the Group’s net debt position rose from £225m to £520m (excluding ITP Aero) largely reflecting the £273m free cash generation offset by shareholder payments of £214m and £286m covering payments due in 2017 for the financial penalties from agreements with investigating bodies. A further £378m of regulatory fines remain due to the SFO, with a payment schedule extending to 2021. Following the acquisition of ITP Aero, its operating cash outflow of £14m and the consolidation of the net funds of £215m result in Group net debt rising somewhat less to £305m. Credit rating The Group is committed to maintaining a robust balance sheet with an investment-grade credit rating. We believe that this is important for our customers given that we deliver high-performance products and support for equipment which will be in operation for decades. Standard & Poor’s updated its rating in January 2017 to BBB+ from A-/negative outlook, with Moody’s lowering its rating in February 2017 from A3/stable to A3/negative. Foreign exchange The Group hedges transactional foreign exchange exposures to reduce volatility of revenues and costs. The most significant exposure is net US dollar income which is converted into GBP (currently approximately $5bn per year and forecast to increase significantly by 2021). The Group has a hedge book of $38.5bn (at an average rate of USD:GBP1.55) covering this exposure. We expect the achieved £/$ hedge rate to remain unchanged at around USD:GBP1.54 for the coming 3 years. Interest Interest and other financing costs remained broadly flat year-on-year, up £2m to £104m. Net interest payable reduced by £10m to £53m. Other underlying financing costs increased by £12m to £51m.
Taxation Underlying taxation was £328m (2016: £261m), an underlying rate of 30.6% compared with 32.1% in 2016. The underlying tax rate remains high due to the continued non-recognition of deferred tax assets on losses in Norway and the mix of profits arising in higher tax rate countries, predominantly the US and Germany.

12
Civil Aerospace overview 2017 marked some notable successes for Civil Aerospace, with record levels of widebody engine deliveries, expanding the installed fleet and generating positive service revenue growth. The Trent XWB-97 and the Trent 7000 achieved full flight certification during the year and the Trent 1000-TEN entered into service. The Trent XWB-84 saw much improved OE economics and has achieved over 1.2 million flying hours in service with unprecedented levels of reliability. These milestones have been achieved against a backdrop of capacity constraints, primarily for blade manufacture and test beds, which have been exacerbated by a number of in-service engine issues relating to the serviceable life of a small number of parts on the Trent 1000, which have led to significant customer disruption, and on the Trent 900. Investments have been made in facilities and people to minimise the disruption caused to our customers and to develop longer-term solutions.
Financial overview £m
2017
2016
Change
Organic change
Order book* 70,164 72,008 -3% -3%
Engine deliveries 683 649 +5% +5%
Underlying revenue 8,023 7,067 +14% +12%
Underlying OE revenue 3,818 3,357 +14% +12%
Underlying services revenue 4,205 3,710 +13% +12%
Underlying gross profit 1,192 1,185 +1% -2%
Gross margin % 14.9% 16.8% -190bps -220bps
Commercial and administrative (373) (353) +6% +5%
Research and development cost (412) (568) -27% -29%
Joint ventures and associates 113 103 +10% +6%
Underlying operating profit 520 367 +42% +34%
Underlying operating margin% 6.5% 5.2% +130bps +100bps
*2016 year end comparative - restated for a methodology change – See page 9
Total underlying revenue Total underlying revenue rose 12% to £8,023m, with both OE revenue of £3,818m (2016: £3,357m) and services revenue of £4,205m (2016: £3,710m) up 12%. The rise in OE revenue reflected record levels of widebody engine deliveries, with growth in Trent XWB-84 engine sales, to support the Airbus A350 programme ramp-up, a significant contributor. Higher services revenues were driven by both increased engine flying hours and higher time and material activity. Overall large engine flying hours increased by 12% to 12.6m. This reflects a 22% increase in flying hours from the in-production Trent engine fleet partially offset by a decrease of 12% from the legacy fleet of engines, the Trent 500 and 800 and RB211s, which are no longer in production. For business aviation, while OE sales were 26% lower, reflecting a 32% reduction in engine sales as airframe production transitioned to competitor-powered programmes, there was a 10% increase in services revenues from continued fleet growth and consistently high CorporateCare coverage. Overall V2500 revenues increased 6% driven by higher maintenance, repair and overhaul activity. Service revenue from V2500 increased 13% led by higher maintenance activity. V2500 OE module sales continued to reduce but revenue from flying hours remained stable. Underlying operating profit Underlying operating profit increased to £520m, up 34% (2016: £367m). Increased gross margin contributions were generated by higher deliveries of link-accounted Trent 700 engines, increased flying hours in growing widebody and business aviation fleets and increased sales of spare parts. This was partially offset by the decline in business jet engine OE sales.

13
Given the performance of our in-service fleets continued to evolve, as we do every year, we have updated our forward estimates of revenues and costs across our long-term contracts. While this included some favourable effects, such as increased utilisation and reduced servicing costs across our business aviation fleet, it also required the inclusion of higher costs for additional maintenance activity for the Trent 1000 and Trent 900 fleets and increased customer support to alleviate the impact of limited engine availability. In total, the contract accounting adjustments created a £18m headwind (2016: £90m benefit) which included a £148m charge (2016: £98m charge) for technical cost (including certain costs relating to the Trent 1000 and Trent 900 in-service issues), a £113m (2016: £217m) benefit from life cycle cost improvements and a £77m benefit from a customer credit rating change, offset by other charges of £60m (2016: £64m charge) largely relating to operational changes. The profit was also impacted by the non-repeat of the £53m release in 2016, following accounting and legal review, of an accrual relating to the termination in prior years of intermediary services. Gross margin from spare engine sales to joint ventures contributed £67m (2016: £97m). Investment in self-funded R&D rose by £50m largely reflecting increased investment in the development of a number of new engine types which we successfully progressed, plus ongoing investment in product improvements to our existing portfolio. In 2017 this focused on further enhancing in-service durability, with a notable focus on the longer-term solutions to the Trent 900 in-service engine issues, and fuel burn efficiency as we look to deliver on our customer commitments. This was more than offset by an increase in R&D capitalisation which rose to £328m (2016: £85m), largely reflecting the stage of capitalisation of a number of development programmes. It also reflects a change we have made to better align with European peers and best practice, to the point at which we start capitalising development costs to reflect current engine programmes reaching technical maturity earlier in the development cycle than has been the case historically. This resulted in additional development costs of £83m being capitalised. Contributions from risk and revenue partners decreased to £39m (2016: £63m). Overall the expensed R&D charge fell to £412m in 2017 from £568m in 2016. Higher restructuring provisions contributed to the 5% increase in commercial and administrative costs. Trading cash flow Trading cash flow at Civil Aerospace of £38m was unchanged year on year. This reflected increased flying hour receipts from the growing widebody fleet and higher spare parts sales, offset by an increased outflow from higher deliveries OE widebody engines and the higher Trent 1000 accelerated maintenance activity. The average cash deficit on widebody engines remained flat at £1.6m per engine, reflecting greater volumes of discounted Trent 700 and some temporary pricing headwind on Trent 900, offsetting strong improvement on Trent XWB-84, where the cash deficit per engine reduced by 37%, underpinning our confidence of further cost reduction and economic improvement. Total cash costs incurred in the year for in-service engine issues on the Trent 1000 were £119m (2016: £45m) and £51m (2016: £45m) on the Trent 900. The increase in self-funded R&D investment mentioned above, together with higher capital expenditure for additional production capacity and for engines to support the growing fleet, were offset by good working capital performance on cash collections from a number of key customers at the end of the period. This benefit helped offset the growth in inventory to support the continuing widebody engine ramp in 2018. Additional financial information and IFRS 15 adoption impact Further details on revenue, profit and balance sheet for Civil Aerospace results can be found on pages 24 to 25. In advance of the adoption of IFRS 15 from January 2018, a comparison of the 2017 financial results under IFRS 15 to those under the current basis, together with a commentary on the key differences between the two approaches can be found on pages 27 to 29. Order book Order intake in 2017 was £10.5bn (2016: £14.1bn including a £2.1bn uplift from a change in the long-term USD planning rate) with orders placed for 185 widebody engines. The closing order book is £70.2bn (2016: £72.0bn) and includes orders for over 2,500 widebody engines. Orders placed during the year included 119 engines for Airbus platforms including the A350 XWB and A330neo as well as 66 engines for Boeing 787 Dreamliners.

14
Operational and strategic review The business has made significant progress in the year, despite capacity constraints on parts and test beds, achieving a record level of large engine production and deliveries while also focusing on minimising the impact on customers from in-service issues on the Trent 1000 and Trent 900 fleets. Engineering and R&D Significant milestones have been achieved in each of the three new large engine programmes on their progression towards entry into service. Two new engines achieved certification: the Rolls-Royce Trent 1000 TEN engine and the Trent XWB-97. The Trent 1000 TEN entered service on the Boeing 787-9 in November and the Trent XWB-97 powering the Airbus A350-1000 entered into service in early 2018. In October, Trent 7000 engines powered the first test flight of the Airbus A330neo and the programme remains on schedule for entry into service in mid-2018. The business continues to invest in developing future technologies which will be key to winning positions on next generation platforms for both large engines and for future business jet programmes. Good progress has been made on new engine architecture demonstrator programmes in 2017. The Advance3 demonstrator successfully completed initial ground test runs and the UltraFan Power Gearbox successfully completed a high power test run to a record 70,000 hp. In November the business announced that it will be developing the E-Fan X hybrid electric demonstrator in collaboration with Airbus and Siemens. This development reflects the growing importance of electrification to the long-term future of the industry. Operational progress Civil Aerospace has invested in both its facilities and in building the skilled workforce necessary to support the continuing ramp-up in widebody engine production. These actions enabled the business to deliver a record 483 widebody engines in 2017 (2016: 357), up 35%, despite challenges caused by in-service issues. In June, £150m investment in facilities was announced with the majority going to new testing facilities for large engines in Derby. We also opened a new Trent XWB assembly line in Dahlewitz to complement the existing one in Derby. Together these two facilities will enable us to deliver seven Trent XWB engines a week by mid-2018. The new fleet support facility in Tyne and Wear became operational, allowing the early closure of an older facility to take place in 2018. In addition, legacy supply chain facilities in Ansty and Sunderland were exited during 2017. In-service fleet performance Our large engine fleet has continued to grow, with over 4,400 engines in active service at the end of 2017, up 7% on 2016. Invoiced flying hours from in-production Trent engines rose 22% and total invoiced flying hours from service agreements across all our widebody, business aviation and regional jet engines were 16.7 million, an 8% increase on 2016. The Trent 700, which constitutes 36% of our installed widebody engine fleet, continued to perform well in service achieving a dispatch reliability of 99.9%. We celebrated a number of milestones in the year including the Trent XWB-84 achieving over 1.2 million flying hours with unprecedented levels of reliability (99.9% dispatch reliability). We have, however, experienced an increased level of activity managing in-service issues on two engine programmes in 2017, the Trent 1000 and Trent 900, caused by the lower than expected durability of a small number of parts. In the first half of the year we took £59m of charges related to technical issues with the in-service fleet, the largest component of which related to the Trent 1000. Since then we have continued to progress our understanding of the technical issues impacting compressor rotor blades, intermediate and high pressure turbine blades for the Trent 1000 and also high pressure turbine blades for the Trent 900, together with the consequential operational impact on our customers. This has been a dynamic situation and we are managing these issues through a proactive engine maintenance programme. This has required increased short-term support including both on-wing and shop visit intervention, which has resulted in disruption for some of our customers.

15
We have grown our Trent 1000 MRO capacity since an issue with the intermediate pressure turbine blade was first identified, including doubling the number of ‘lines’ available in the UK, developing a dedicated ‘shop’ in our SAESL facility in Singapore and using lean methods to reduce turn-around times. We continue to make solid progress with longer-term solutions, largely through the re-design of affected parts, and we expect these to be fully embodied in the Trent 1000 fleet by 2022. Reducing disruption to our customers remains our top priority. The Trent 1000 TEN engine, the latest variant of the Trent 1000, includes a variety of improvements that help deliver greater capability, durability and efficiency. It is, however, possible that a population of early Trent 1000 TEN engines may benefit from proactive maintenance to embody re-designed parts that weren’t available at the point of production. On the Trent 900, an extended life turbine blade is being rolled out into the current fleet. Further re-designs are underway and will be available in 2020. Total charges of £227m (2016: £98m) were recognised in the income statement in relation to accelerated maintenance activity for the Trent 1000 and Trent 900 in 2017 and £170m (2016: £90m) in our cash flow. Based on our current estimates, in 2018 the anticipated annual cash impact in respect of both the Trent 1000 and the Trent 900 is expected to broadly double from the total cash cost in 2017 of £170m and reach a peak in 2018, as maintenance activity intensifies. It is then expected to fall by around £100m in 2019. The majority of the work will be undertaken in 2018 and 2019 although it is expected to be fully complete by 2022. All of these costs are included in our cash flow guidance for 2018 and beyond. Developing the service offerings As the engine base matures and flying hours continue to grow, the business has broadened its range of long-term service packages to meet the needs of an increasingly diverse customer base. In June, the Airline Aircraft Availability Centre was opened in Derby. The Centre uses industry-leading data analytics to proactively plan engine operations and maintenance and complements the existing global network of Customer Service Centres working to provide in-depth expertise in their local markets. The service network has continued to evolve with Air France/KLM joining the CareNetwork for Trent XWB engines. The global network of Authorised Service Centres for business aviation aircraft now totals 74. We have sought to develop both physical and digital infrastructure for aftermarket services through a number of initiatives. We introduced the CareStore as a customer gateway to the full range of digitally-enabled services, supporting more informed decisions. Online apps were launched for both commercial and business aviation customers to provide better insight into their engines to help optimise performance and provide real time service information. We continued to develop our services for our lessor customers and in January 2018 we launched LessorCare, a pioneering new service tailored to their needs, and successfully signed three customers up in the first wave. Total service revenues of £4.2bn in 2017 now represent 52% of Civil revenues and 28% of Group revenues. Over the next few years we expect continued aftermarket revenue growth as we build towards a 50% plus share of the installed widebody passenger market and service revenues from Civil become a greater proportion of our Civil and group revenues.
16
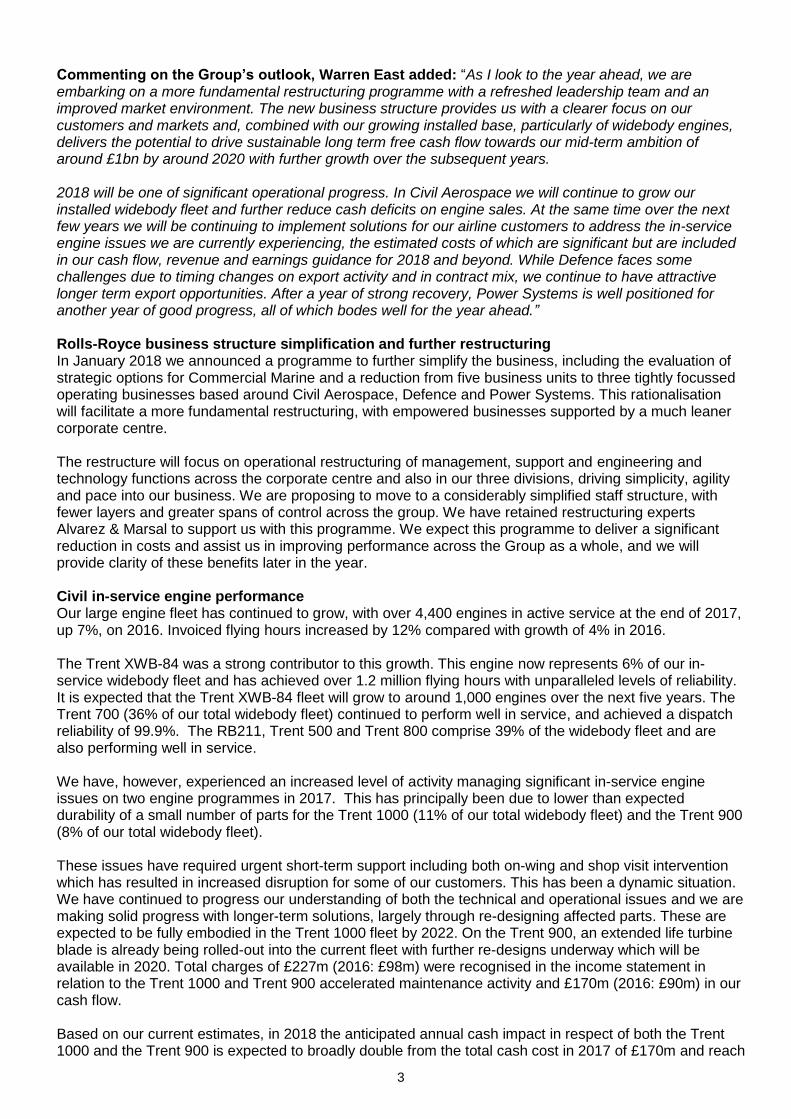
Defence Aerospace overview The Defence Aerospace business had another solid year. Original Equipment (OE) production focused on executing under long term contracts in Transport & Patrol as well as delivering technology to improve fuel efficiency for legacy fleets. In Combat, as well as increasing production for the LiftSystem, the joint venture announced with Kale in Turkey positioned us well to offer an indigenous engine solution for the TF-X fighter jet. A number of core US service contracts were renewed, covering over 3,000 engines, and an agreement with Aviall, a Boeing company, significantly improved the spares distribution channel for AE defence engines. There were also additions in the UK and India to further enhance our Service Delivery Centre network. The facility modernisation programme in Indianapolis met all of its 2017 milestones with targeted cost reductions also on track. Finally we continued to make progress on the development of next generation technologies across our portfolio to ensure we can continue to offer our customers increased performance and capability for their operations. Financial overview £m
2017
2016
Change
Organic change
Order book* 3,382 4,104 -18% -14%
Engine deliveries 605 661 -8% -8%
Underlying revenue 2,275 2,209 +3% -1%
Underlying OE revenue 966 890 +9% +4%
Underlying services revenue 1,309 1,319 -1% -4%
Underlying gross profit 575 564 +2% -2%
Gross margin % 25.3% 25.5% -20bps -20bps
Commercial and administrative (130) (124) +5% +2%
Research and development charge (78) (71) +10% +8%
Joint ventures and associates 7 15 -53% -53%
Underlying operating profit 374 384 -3% -7%
Underlying operating margin % 16.4% 17.4% -100bps -100bps
*2016 year end comparative - restated for a methodology change – See page 9 Defence order book opening balance has been restated by £(441)m in 2016
Underlying revenue Underlying revenue of £2,275m was broadly flat on the prior year on a constant currency basis. OE revenues increased 4% through higher Transport & Patrol volumes, partially offset by lower Combat sales following the completion of Middle Eastern delivery contracts in early 2017. Service revenues were down 4%, reflecting slightly lower Long Term Service Agreements (LTSA) revenue related to the 2016 retirement of the UK MoD Gnome-powered Sea King fleet and reduced demand for spare parts in India in particular. We did however see increased overhaul activity in the US for the F-35B fleet and for the Typhoon fleet in Saudi Arabia. Underlying operating profit Gross profit of £575m was 2% lower than prior year reflecting lower LTSA margin improvements of £68m (2016: £82m), largely due to lower cost savings compared with 2016 on the Eurofighter Typhoon contract, and lower spare parts volumes. These were mostly offset by the non-repeat of £31m of one-off costs for the TP400 programme. Overall the R&D charge of £78m (2016: £71m) was slightly higher and included ongoing future programme development across our portfolio focused on the combat and transport markets. Restructuring costs included within C&A were £14m higher due to the non-repeat of the one-off benefit in 2016 following the closure of the Defence Aerospace facility at Ansty. As a result of these changes, underlying operating profit of £374m was 7% lower than the prior period.

17
During the year, the Defence Aerospace order book was restated by £(441)m to reflect a number of assumption changes relating to certain historical orders and long-term contracts including revised scope and lower expectations of price escalation and delivery volumes. After order intake of £1.8bn, the order book closed at £3.4bn. Operational and strategic review Activity with key customers included major contract renewals with the US Department of Defense supporting engine fleets on aircraft such as the C-130, V-22 Osprey and T-45. Together these cover around 3,000 engines and the orders taken in 2017 for over $1.4bn provide good visibility on a substantial portion of aftermarket revenues for the next 5 years. Internationally the business signed its first OE export order with the Japanese Self-Defense Force to power their new V-22 Osprey fleet and also secured additional MRTT engine contracts. Operationally, the Defence business focused on delivering on its long-term contracts for core transport programmes. In Combat, LiftSystem production for the F-35B Lightning II increased, with the current in-service fleet performing well. The aircraft made its first international operational deployment with the US Marine Corps to Japan, and its first UK-based deployment for the MoD is planned for 2018. EJ200 production was lower following completion of the Saudi Typhoon contract in 2016, although there is the expectation of incremental orders from the State of Qatar following the signing of a contract to purchase 24 aircraft in December. Technology inserts for the Hercules C-130 legacy fleet met operational performance expectations and demonstrated excellent reliability and fuel efficiency in extended hurricane operations during major US storms in 2017. This helped generate good international interest with a potential first export order currently being evaluated. Defence continued with its strategy of moving into adjacent products to deepen relationships with existing customers, identifying an additional platform opportunity for infra-red suppressors installed on the MH-47 helicopter to be fitted onto C-130 gunships. The business continued with the modernisation programme of its manufacturing and technology research plant in Indianapolis with all key 2017 milestones achieved on time. The plant’s first turbine production cell came on stream in March and a second is nearing completion. The modernisation will help drive meaningful productivity benefits and reduce operational overheads by 2020. We also announced further rationalisation of our operational footprint with the closure of our repair and overhaul facility in Oakland, California by 2020. A joint venture agreement with Turkish industrial firm Kale Group positions us well to develop an indigenous combat engine for Turkey targeting the TF-X fighter jet. Development work has also continued on the Anglo-French Future Combat Air System (FCAS) feasibility programme, together with investment in future technologies to position us for new programme opportunities over the next decade. Strategic aftermarket initiatives looked to deepen customer relationships and distribution capability, including an enhanced spares supply contract with Aviall, a Boeing company, covering all defence variants of the AE engine fleet. This multi-year contract is expected to significantly improve availability and logistics, while broadening international opportunities. In addition, two further Service Delivery Centres were opened in Lossiemouth and Bangalore as we continue to find ways to enhance our offering with core customers, helping with preventative maintenance and maximising on-wing availability.

18
Power Systems overview Power Systems core business is the design, manufacture and servicing of reciprocating engines including diesel, gas and hybrid/electrical solutions, propulsion systems and distributed power generation plants. It has a significant installed engine base across a diverse range of end markets. In 2017, strengthening demand in key end markets combined with a clear focus on operational improvements through the RRPS 2018 transformation programme. This enabled the business to deliver a strong performance achieved against the background of greater operational efficiencies and a more balanced annual production cycle. Revenue grew slightly and helped deliver significant profit and cash flow growth. Under new leadership the business was able to achieve a material reduction in product variants and greater R&D discipline while targeting low-emission technologies. There has also been a move to develop more comprehensive and connected power solutions leveraging digitalisation as an enabler of service penetration and a growing competitive advantage. Power Systems also sought to expand its geographic reach with manufacturing and assembly partnerships in India and in the core growth market of China. Financial overview £m
2017
2016**
change
organic change
Order book* 2,196 2,035 +8% +4%
Underlying revenue 2,923 2,655 +10% +3%
Underlying OE revenue 1,961 1,810 +8% +1%
Underlying services revenue 962 845 +14% +6%
Underlying gross profit 842 702 +20% +12%
Gross margin % 28.8% 26.4% +240bps +240bps
Commercial and administrative (331) (335) -1% -7%
Research and development charge (177) (177) - -6%
Joint ventures and associates (4) 1 -500% -400%
Underlying operating profit 330 191 +73% +61%
Underlying operating margin % 11.3% 7.2% +410bps +410bps
*2016 year end comparative - restated for a methodology change – See page 9
** 2016 figures for underlying gross profit and commercial and administrative costs have been restated as a result of other operating income
previously reported in 'cost of sales' being reclassified as 'other commercial and administrative income' to ensure consistent treatment with 2017.
Underlying revenue Underlying revenue of £2,923m increased by 3%. Original Equipment revenues grew 1% while service revenues increased 6%. Commodity-related markets, such as mining and oil & gas saw a strong recovery, as did construction and agriculture. Power Generation products enjoyed good demand from China and for US data centres, but was more subdued elsewhere, as was the yacht market for much of the year. The service business broadened its market reach with good interest in our reconditioning service offering and from US customers. Underlying operating profit Overall, gross margins increased 240 bps to 28.8% reflecting improved product mix, including from service revenues and programme applications, operational gearing and from higher volumes. An improved balance of production between the first and second half of the year also helped to achieve better factory utilisation. The actions taken as part of the RRPS 2018 programme on direct material costs also contributed to the improved gross margin. A more focused approach to R&D drove a 6% reduction to £177m. Commercial & administrative costs reduced 7% to £331m reflecting cost reduction activities in the year. Overall underlying operating profit which increased strongly to £330m (2016: £191m).

19
Operational and strategic review Power Systems’ customers span a range of end-markets providing significant diversity. The strong performance in 2017 reflected growing demand in a number of key end-markets as the overall environment improved. Engine production increased principally due to demand for the core Series 4000 products, large engines and rail power packs. The business was also successful in greater smoothing of the sales and production cycle over the year, reducing the proportion of sales and production activity in the fourth quarter, which has historically been abnormally high. There was growing order interest through the year, particularly naval and governmental customers with a stronger order book in the second half. The medium speed business announced two notable power station orders from Bangladesh. Manufacturers active in the construction and agriculture market increased orders in advance of new EU emissions regulations due to come into force at the start of 2019. The first delivery of the new S4000 Marine Natural Gas Engine which is IMO Tier III compliant, was made to the Dutch ferry operator Doeksen. Gas systems sales in Marine and Power Generation now make up over 14% of revenues from the S4000 range. The business entered into new segments such as excavators with products meeting the latest emissions standards driven by orders from market leaders KATO and JCB. A project agreement was signed with agricultural machinery manufacturer Claas for the annual supply of around 5,000 Series 1000-1500 engines. Power Systems also sought to grow its share of its engine service opportunity. This included the REMAN product, where engines are reconditioned and restored to the latest MTU specification and come with an as-new warranty package, and which generated strong interest. Customer Care Centres were established in key time zones to greatly enhance technical support responsiveness to customers’ critical requirements and applications were launched to deepen customer service and dialogue. Over time, the business will look to develop more comprehensive power solutions which will offer higher-value and digitally connected products which will deepen the customer experience. An initial step was the business’s first long-term availability contract signed with Hitachi Rail for their UK Intercity programme, covering the period to the early 2040s; and Power Systems sees significant opportunity to develop similar long term service offerings for other customers. A reinvigorated leadership team under the new CEO, Andreas Schell, helped drive the RRPS 2018 restructuring programme. This was a key contributor the strong performance in 2017, delivering significant operational improvements as the business pursued greater efficiencies and focus across both R&D and production. This delivered a 20% reduction in product variants and was combined with actions to improve material costs, quality control, inventory levels and a footprint reduction. Greater digitalisation within the development programmes helped to reduce the time to product launch, including the online monitoring of the ramp-up fleet and greater collaborative working. Agreements made in India and China are intended to broaden the production capability in lower-cost locations closer to core end markets. These included the official registration of a 50/50 joint venture with Guangxi Yuchai Machinery in China. The agreement will enable localised production of the MTU Series 4000 diesel engines under license, which comes on-stream in early 2018 and is part of the China growth strategy. An agreement was also signed with Garden Reach Shipbuilders & Engineers Ltd for final assembly in India of Series 4000 naval engines, and we are looking to secure additional partnerships for end markets such as power generation. R&D programmes have focused on the strategic priorities addressing new technologies, alternative fuels and system-based solutions, reflecting the structural shift away from traditional diesel engines expected over the next decade. This included strengthening the gas engine portfolio, reflecting greater demand from better infrastructure and availability within PowerGen, Industrial and Marine segments. This complements the investment in electrification to expand our hybrid capabilities and further development of micro-grid solutions. A co-operation agreement with G+L innotec for electrical-assisted turbo charging technology is part of a programme to build a range of advanced electrical capabilities as a basis for development of future hybrid and electrical drive solutions.

20
Marine overview With the average Brent crude oil price remaining below US$55/barrel for the third consecutive year, our Commercial Marine business continued to see substantially reduced activity levels in its historically important offshore market, but saw opportunities within the merchant sector. The Naval business had a successful year with new projects from existing core clients such as the UK and US navies and from new geographies. As a result of the weak market environment, the business focused on executing on its restructuring programmes, reducing its fixed cost base, including significant headcount reduction, and closing non-core facilities. At the same time it is repositioning itself with product development such as permanent magnet thrusters, investing in future technologies as the industry moves to greater electrification and exploring the growing potential for remote vessel operations and autonomous shipping. It was announced after the year-end that our Commercial Marine operations would be subject to a strategic review in 2018, including the potential for sale, while the Naval operations would be integrated into an enlarged Defence business unit. Financial overview £m
2017
2016
change
organic change
Order book* 814 988 -18% -15%
Underlying revenue 1,077 1,114 -3% -9%
Underlying OE revenue 566 631 -10% -15%
Underlying services revenue 511 483 +6% -
Underlying gross profit 225 236 -5% -9%
Gross margin % 20.9% 21.2% -30bps -20bps
Commercial and administrative (204) (222) -8% -13%
Research and development charge (46) (41) +12% +7%
Joint ventures and associates - - - -
Underlying operating loss (25) (27) -7% -15%
Underlying operating margin % -2.3% -2.4% -10bps -10bps
*2016 year end comparative - restated for a methodology change – See page 9
Underlying revenues Underlying revenues were down 9% at £1,077m, reflecting declining OE activity, with weakness in both offshore and cargo-related merchant markets. Service revenues were stable, though off a low base in 2016, and there was a notable improvement in Naval revenues, particularly in the second half. The 15% decline in OE revenues resulted in service revenues rising to 47% of the total (2016: 43%). By segment, Commercial Marine was down 14% to £805m (2016: £875m) and Naval was up 10% to £272m (2016: £239m). Underlying operating loss Despite the 9% decline in underlying revenues there was a £2m reduction in the underlying operating loss for the year to £25m (2016: £27m), helped by the greater proportion of higher margin service revenues and reflecting the positive impact of cost cutting programmes. R&D spend was broadly flat at £46m, with the focus on developing ship intelligence capabilities as well as on new product development. C&A costs of £204m were 13% lower, demonstrating the progress made in reducing both headcount and fixed costs, together with a significant reduction in inventory which helped mitigate the scale of cash outflows.

21
Operational and strategic review Lower activity within Commercial Marine reflected the weak market environment as deep water exploration activities remained at depressed levels. While OE activity continued to decline, the business was encouraged by the signing of the first offshore service contract since 2015 and a long-term service agreement reached for azimuth thrusters. There was also activity across the merchant sector including Norwegian ferry operator contracts for new gas engines and thrusters along with further auto-crossing system product sales. Within the Naval business a landmark contract was signed to supply the US coastguard’s largest shipbuilding programme, initially covering up to 11 vessels with a range of propulsion and related technologies. In addition, the MT30 gas turbine continued to demonstrate its attractiveness as a naval engine choice with its selection by the Republic of Korea for three Daegu type frigates. Work continued with a number of customers who had previously selected the MT30 including factory acceptance testing with the Italian Navy’s LHD vessel and in the UK both on the Royal Navy’s Type 26 frigate programme and the two new Aircraft Carriers. HMS Elizabeth II completed successful sea trials and preparation for the first run of the HMS Prince of Wales power plants is scheduled for 2018. The team also announced a concept autonomous defence vessel capable of a range of single role naval missions, drawing on the expertise across power and propulsion and autonomous tools. The main operational focus across the Marine business was the continued effort to reduce fixed costs to help mitigate the impact of the weaker offshore market. The restructuring programme announced in November 2016 achieved its target of £45-50m of annualised cost savings. This was helped during the year through further rationalisation of back office functions, together with the closure of the Shanghai assembly facility. Investment of around £20m in the year was made in a state-of-the-art production and test facility in Rauma, Finland which will deliver significant capabilities for what is a growing market opportunity. The Marine business has also sought to capitalise on the broader shift from mechanical to electrical and digital technologies, both within its existing product range and also through investment in opportunities for integrated ship systems and remote or autonomous vessels. The launch of a new energy management solution and the first ever Marine availability-based contract reflects the growing potential in this area. Third party funding was secured to support R&D for land-based control centres and a Fleet Management Centre was established for remote optimisation of ship operations. Rolls-Royce successfully demonstrated this new technology by partnering with global towage operator, Svitzer, including the first trial of a remotely operated commercial vessel that took place in Copenhagen harbour.

22
Nuclear overview
The business plays a key role in the UK’s submarine programme, acting as the Technical Authority, sole supplier and provider of through-life support for all submarine nuclear propulsion systems (representing over 75% of sales). This year work principally focused on the Astute and Dreadnought classes with significant progress made in operational and delivery performance as part of a multi-year improvement programme and increased investment in the Raynesway, Derby manufacturing facilities. The Civil Nuclear business achieved key milestones on large retrofit contracts for safety-critical control systems in Finland and France. Service contracts were signed with nuclear utility customers across Europe, Canada and China while additional investment was made into the small modular reactor (SMR) programme where the UK Government announced a viability study covering a number of technologies.
Financial overview £m
2017
2016
change
organic change
Order book* 1,967 1,825 +8% +7%
Underlying revenue 818 777 +5% +4%
Underlying OE revenue 383 354 +8% +6%
Underlying services revenue 435 423 +3% +2%
Underlying gross profit 133 121 +10% +7%
Gross margin % 16.3% 15.6% +70bps +50bps
Commercial and administrative (72) (70) +3% +1%
Research and development charge (23) (6) +283% +267%
Joint ventures and associates - - - -
Underlying operating profit 38 45 -16% -18%
Underlying operating margin % 4.6% 5.8% -120bps -120bps
*2016 year end comparative - restated for a methodology change – See page 9
Underlying revenue Underlying revenue rose by 4% driven mainly by increased production activity in support of the Dreadnought class build programme, together with greater activity in Civil new build contracts and field services. Submarine revenues grew 3% to £633m while Civil Nuclear revenues grew 9% to £185m. There was a strong second half performance, reflecting phasing within the submarine programmes.
Underlying operating profit Gross margin was broadly flat, reflecting a combination of increased activity offset by additional costs incurred to ensure higher levels of delivery performance for the key submarine programmes. The R&D charge was £17m higher than 2016 as the SMR programme moved to concept design activity and did not benefit from the one-off change in treatment of R&D credits (2016: £7m credit). As a result, underlying operating profit was £38m, £7m lower than the previous year.

23
Operational and strategic review The Nuclear business focused on improving cost-control, sustainable quality and on-time delivery for the key submarine programmes. As part of an overall regeneration of the submarine business capability, a significant number of new manufacturing technologies and systems were introduced. These have helped to drive significant improvements in delivery of reactor plant components into the Astute programme.
Investment was made into new manufacturing facilities, people and infrastructure at Raynesway, Derby. This includes a planned expansion of the Primary Component Operations factory, principally in support of the new Dreadnought programme, where production work is increasing in support of the build programme. The expanded facilities will help develop and manufacture the new generation PWR3 reactor plant as well as support the current submarine fleet.
In addition, the contract to deliver the nuclear propulsion system for HMS Agamemnon, the sixth of the new Astute class submarines was signed during the year. Steady progress was also made towards the establishment of a delivery alliance for the Dreadnought class which should provide greater programme and cost control benefits to help meet the affordability challenges for our MOD customer.
The Civil Nuclear business saw good growth during the year and is well positioned on new build projects. In the UK, activity was centred on Hinkley Point C, with a number of projects underway including the successful completion of the Early Contractor Involvement (ECI) phase for the design of Heat Exchangers. We also signed the main contract to complete detailed design work and begin manufacturing and equipment delivery. There was progress on the supply and delivery of both Waste Treatments systems and Ultimate Diesel Generators under similar ECI arrangements.
Internationally, the Civil Nuclear business achieved key milestones on schedule, as part of its long-term contracts to retrofit and upgrade safety-critical control systems at Loviisa, Finland and for EDF’s fleet of nuclear reactors in France. The business renewed a contract with EDF to provide long-term support and secured a contract for the partial modernisation of safety-critical control systems on all 34 units of its 900 MW French fleet.
At Fennovoima’s new build plant at Hanhikivi, Finland, due for completion in 2024, the business was selected as preferred bidder to supply instrumentation and controls. The business strengthened its position in China with new commercial agreements signed with CTEC (CGN) and secured orders for the current new build programme at Tianwan 5 and 6. In Canada, the contract with Bruce Power to help improve through-life operational efficiency will utilise cutting edge digital analytical tools developed from innovations in the business and based on capability within Civil Aerospace.
Rolls-Royce welcomed the UK Government’s decision to set up an Expert Finance Panel to assess the viability of technology options including short-term deployable SMRs and will participate in this review in 2018. The announcement in November of a technical feasibility study with state-owned Jordan Atomic Energy Commission (JAEC) for the construction of a Rolls-Royce SMR highlights the international
potential, including growing interest from major markets in the Commonwealth and Middle East.

24
Civil Aerospace - Additional financial information
Revenue Overall, underlying revenue for Civil Aerospace rose 12% to £8.0bn, with OE revenue of £3.8bn (2016: £3.4bn) up 12% and services revenue of £4.2bn (2016: £3.7bn) also up 12%. The rise in OE revenue reflected record levels of widebody engine deliveries, with growth in Trent XWB-84 engine sales, to support the Airbus A350 XWB programme ramp, a significant contributor. £m
2017
2016
Change
Organic change
Original Equipment 3,818 3,357 +14% +12%
Large engine: linked and other 1,895 1,604 +18% +18%
Large engine: unlinked installed 1,103 742 +49% +49%
Business aviation 598 757 -21% -26%
V2500 222 254 -13% -13%
Services 4,205 3,710 +13% +12%
Large engine 2,626 2,289 +15% +15%
Business aviation 527 452 +17% +10%
Regional 343 342 - -5%
V2500 709 627 +13% +13%
Original equipment revenue from Large engine: linked and other was up 18% reflecting increased volumes of Trent 700s following a relatively low year in 2016 in which a higher proportion of A330s built were powered by competitor engines, combined with higher deliveries of Trent 900 engines for A380s for Emirates. Sales of spare engines to joint ventures, included in Large engine: linked and other, generated revenue of £362m (2016: £288m).
Original equipment revenue from Large engine: unlinked installed increased 49%, driven by improved pricing and higher volumes of Trent XWB-84 engines.
The 15% growth in Large engine service revenue reflected a 22% increase in invoiced TotalCare flying hours from the growing in-production engine fleet which more than offset the 12% flying hour reduction from mature engine types as older aircraft retired or where customers selected alternative service offerings on transitions. Higher volumes of spare part sales for RB211-535 and Trent 700 engines for time and material overhauls and for TotalCare engines, where not covered by the flying hour payments, also contributed to the revenue increase.
Revenue from Business aviation OE engine sales declined for a second year, with a fall in unit volumes of 32%, mostly BR710’s, reflecting continued weakness at the higher end of the market coupled with the effect of the transition to newer non-Rolls-Royce powered platforms. Volumes of the newer BR725 engine, which powers the Gulfstream G650 and G650ER, remained broadly stable. Overall, although business aviation OE revenues declined 26%, service revenue increased by 10% reflecting continued fleet expansion, increased CorporateCare penetration and price escalation.
Service revenue from our Regional jet engines declined 5%, reflecting further retirements and reduced utilisation of our fleets by North American operators in particular.
On the V2500 programme, which powers aircraft including the Airbus A320, revenue from OE modules declined 13% as production slowed down further as Airbus transitions to the A320neo, powered by a competitor engine provider. However, V2500 service revenues of £709m increased by 13% driven by an increased number of overhauls with increased workscope. The contractual payment from IAE based on flying hours was broadly stable, with a reduction in flying hours flowing from retirements of some older aircraft being mitigated by price escalation.

25
Contract accounting adjustments
£m 2017 2016
Life-cycle cost improvements 113 217
Change in estimated long-term USD to GBP planning rate – 35
Technical costs (148) (98)
Operational changes 17 (64)
Total contract accounting adjustments (18) 90
The in-year net charge from long-term contract accounting adjustments included within the gross margin totalled £18m (2016: £90m total benefit, including a £35m benefit from a change to our long-term USD:GBP planning rate).
The benefit from life-cycle cost improvements in 2017 of £113m (2016: benefit of £217m) included a £70m benefit across the portfolio of business aviation contracts following re-assessments of shop visit frequency and costs. Given that the performance of our in-service fleet has evolved over the year, we have increased our estimates for future costs associated with part life limitations, particularly in relation to compressor rotor blades within the Trent 1000 and high pressure turbine blades within the Trent 900. The resulting contract accounting adjustments associated with these shortfalls in part life, combined with additional customer disruption support costs across these two engine programmes, represents £114m (2016: £55m) of the total £148m impact (2016: £98m).
The overall benefit in 2017 from other operational changes was £17m (2016: £64m charge). This comprised a £60m charge driven by changes in the utilisation pattern of several customers’ Trent 700, Trent 800 and RB211 fleets, offset by a £77m benefit taken in the first half arising from a change to a customer credit rating risk assessment. TotalCare net asset
£m 2017 2016
Cash deficit reversal and profit from new “linked” engines 612 432
Contract accounting adjustments (18) 90
Foreign exchange (97) 77
Cash inflows and net other items (435) (369)
Total change in TotalCare net asset 62 230
TotalCare net assets increased in 2017 by £62m (2016: £230m) to £2.5bn. This reflected an increase in the overall cash deficit combined with higher “linked” profit driven by increased volumes of new “linked” engines of £612m (2016: £432m), notably the Trent 700. This increase was offset by adverse contract accounting adjustments taken in the year of £18m (2016: £90m benefit), foreign exchange of £(97)m (2016: £77m) and cash inflows and net other items of £(435)m (2016: £(369)m). Contractual aftermarket rights (CARs) The CARs balance increased by £230m (2016: increase of £169m) to £803m reflecting higher sales of unlinked Trent XWB engines partly offset by price increases and engine unit cost improvements.

26
Impact of adopting IFRS 15 Group underlying results
2017 £m Current
accounting IFRS 15
Revenue
Civil Aerospace 8,023 6,613
Defence Aerospace 2,275 2,282
Power Systems 2,923 2,919
Marine 1,077 1,075
Nuclear 818 818
Other (26) (25)
Total revenue 15,090 13,682
Operating profit
Civil Aerospace 520 (330)
Defence Aerospace 374 370
Power Systems 330 331
Marine (25) (26)
Nuclear 38 38
Other (62) (62)
Total operating profit 1,175 321
IFRS 15 Revenue from Contracts with Customers (effective for the year beginning 1 January 2018) replaces the separate models for goods, services and construction contracts currently included in IAS 11 Construction Contracts and IAS 18 Revenue. The Group will present its 2018 results in accordance with IFRS 15, including 2017 comparatives, on an IFRS 15 basis. The impact of IFRS 15 on the 2017 underlying results is shown in the tables on this page with further information provided in Notes 1 and 16 to the Condensed Financial Statements. The cumulative impact on net assets as at 31 December 2017 is £(5.2)bn. As processes and procedures are further embedded during 2018, it is possible that some changes to the impact may result. The adoption of IFRS 15 has had a significant impact on the measurement and the timing of recognition of revenue, most particularly in the Civil Aerospace business. It has no impact on the timing or measurement of the reported cash flows. The key impacts of adopting IFRS 15 on our Civil Aerospace business are:
Generally, our contracts with airframers for original equipment and with operators for aftermarket services will not be linked.
Revenue for original equipment will be recorded at the net amount of consideration receivable with any profit or loss on sale, after recognition of the costs of producing the OE, recorded on delivery.
Revenue on LTSAs will be recognised as services are performed rather than as the equipment is used as is frequently the case under the current accounting policy. The stage of completion will be measured using the actual costs incurred to date compared to the estimated costs to complete the performance obligation. As we are generally paid on a monthly basis as engine flying hours occur, whilst overhaul and repair activities happen periodically over the term of the LTSA, the recognition of revenue and profit will generally be deferred compared to the current accounting policy and to cash receipts.
In addition, the overall net impact on operating profit of the adoption of IFRS 15 within the Defence Aerospace business was £4m. This comprised a £34m LTSA margin impact which is broadly expected to recur in the short-term, but was offset by a £30m favourable timing benefit from a spares distribution contract, which is not expected to repeat in 2018.
27
Impact of adopting IFRS 15 - Civil Aerospace The tables below provide more detail on the impact of adopting IFRS 15 in Civil Aerospace. We have provided additional information about this business here as it is most significantly impacted by IFRS 15. A more detailed analysis of the impact of adopting IFRS 15 on the other segments are set out in note 16 to the condensed Financial Statements.
Current
accounting IFRS 15 £m 2017 2017 Adjustments
Underlying revenue 8,023 6,613 (1,410)
Underlying OE revenue 3,818 2,905 (913)
Underlying services revenue 4,205 3,708 (497)
Underlying gross profit 1,192 381 (811)
Gross Margin 14.9% 5.8%
R&D Costs (412) (451) (39)
Underlying operating profit/(loss) 520 (330) (850)
Underlying operating margin % 6.5% (5.0)%
The adoption of IFRS 15 reduces Civil Aerospace underlying revenue and underlying operating profit by £1,410m and £850m respectively. Underlying OE revenue reduces by £913m, primarily from de-linking the OE and services contracts and no longer capitalising cash deficits. In addition, participation fees paid to airframers are treated as a reduction to revenue where previously presented as a cost. Underlying services revenue reduces by £497m. This reduction is driven by: a timing change to revenue recognition on TotalCare and CorporateCare long-term contracts where stage of completion has been amended from a flying hours basis to a cost incurred or “input” basis; the de-linking of OE and services contracts; and classification of operator guarantee payments as a reduction to revenue under IFRS 15 where classified as costs under current accounting.
Underlying revenue by market segmentation The most significant changes to Civil Aerospace revenue from the adoption of IFRS 15 relate to large engine OE and long-term service contract revenue for both large and business aviation engines.
Current
accounting IFRS 15 £m 2017 2017 Differences
Original Equipment 3,818 2,905 (913)
Large engine 2,998 2,104 (894)
Business aviation 598 582 (16)
V2500 222 219 (3)
Services 4,205 3,708 (497)
Large engine 2,626 2,327 (299)
Business aviation 527 396 (131)
Regional 343 277 (66)
V2500 709 708 (1)
Large engine service revenue is £299m lower under IFRS 15. Under current accounting service revenue is recognised on an engine flying hour basis, i.e. as the engines are being used by the airline operators. The move to recognising revenue on an activity basis (i.e. when Civil Aerospace performs the repairs, maintenance and overhauls) changes the point at which revenue is recognised. This change will typically delay the point at which revenue is recognised under IFRS 15 when compared with the treatment under current accounting and as a result lowers service revenues due to the relatively young age of the fleet with many engines yet to reach their first overhaul.
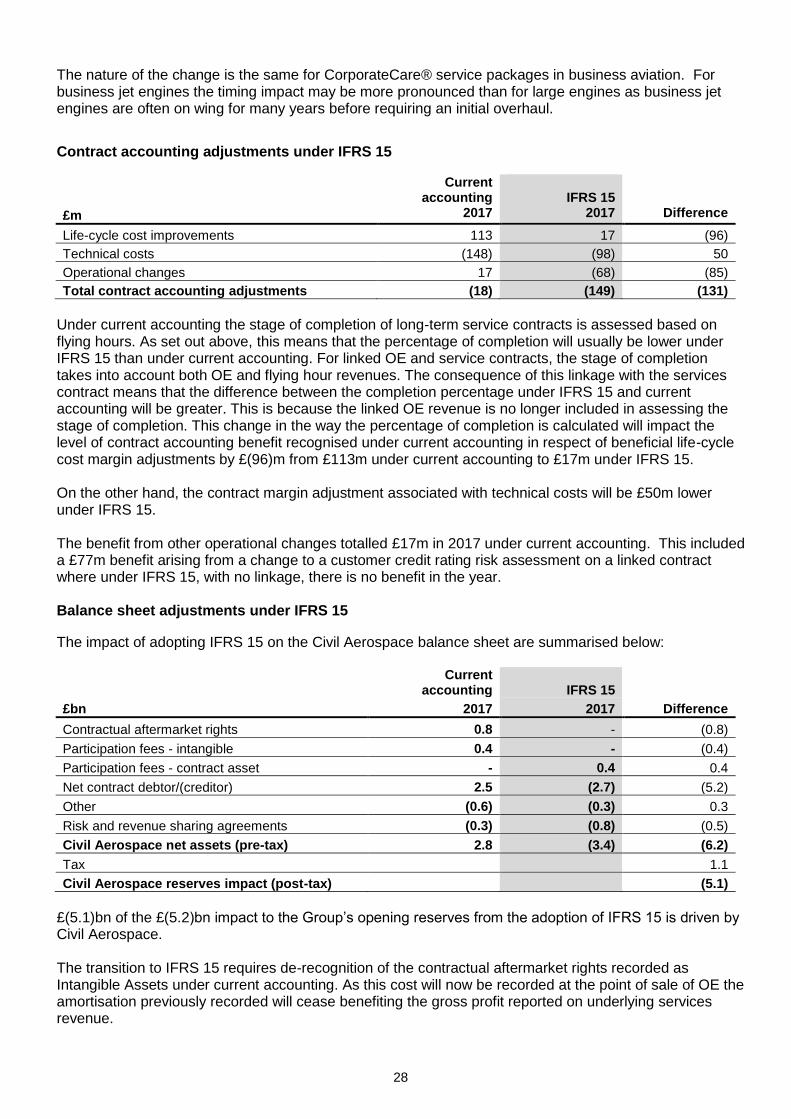
28
The nature of the change is the same for CorporateCare® service packages in business aviation. For business jet engines the timing impact may be more pronounced than for large engines as business jet engines are often on wing for many years before requiring an initial overhaul.
Contract accounting adjustments under IFRS 15
Current
accounting
IFRS 15
£m 2017 2017 Difference
Life-cycle cost improvements 113 17 (96)
Technical costs (148) (98) 50
Operational changes 17 (68) (85)
Total contract accounting adjustments (18) (149) (131)
Under current accounting the stage of completion of long-term service contracts is assessed based on flying hours. As set out above, this means that the percentage of completion will usually be lower under IFRS 15 than under current accounting. For linked OE and service contracts, the stage of completion takes into account both OE and flying hour revenues. The consequence of this linkage with the services contract means that the difference between the completion percentage under IFRS 15 and current accounting will be greater. This is because the linked OE revenue is no longer included in assessing the stage of completion. This change in the way the percentage of completion is calculated will impact the level of contract accounting benefit recognised under current accounting in respect of beneficial life-cycle cost margin adjustments by £(96)m from £113m under current accounting to £17m under IFRS 15. On the other hand, the contract margin adjustment associated with technical costs will be £50m lower under IFRS 15. The benefit from other operational changes totalled £17m in 2017 under current accounting. This included a £77m benefit arising from a change to a customer credit rating risk assessment on a linked contract where under IFRS 15, with no linkage, there is no benefit in the year. Balance sheet adjustments under IFRS 15
The impact of adopting IFRS 15 on the Civil Aerospace balance sheet are summarised below:
Current
accounting IFRS 15
£bn 2017 2017 Difference
Contractual aftermarket rights 0.8 - (0.8)
Participation fees - intangible 0.4 - (0.4)
Participation fees - contract asset - 0.4 0.4
Net contract debtor/(creditor) 2.5 (2.7) (5.2)
Other (0.6) (0.3) 0.3
Risk and revenue sharing agreements (0.3) (0.8) (0.5)
Civil Aerospace net assets (pre-tax) 2.8 (3.4) (6.2)
Tax 1.1
Civil Aerospace reserves impact (post-tax) (5.1)
£(5.1)bn of the £(5.2)bn impact to the Group’s opening reserves from the adoption of IFRS 15 is driven by Civil Aerospace. The transition to IFRS 15 requires de-recognition of the contractual aftermarket rights recorded as Intangible Assets under current accounting. As this cost will now be recorded at the point of sale of OE the amortisation previously recorded will cease benefiting the gross profit reported on underlying services revenue.

29
Under IFRS 15 we regard participation fees as payments to customers that are offset against future revenue from those customers. Therefore, they are recognised as contract assets rather than as intangible assets under current accounting. In assessing the accounting for the participation fee payments we make to our OE customers, we have also assessed the accounting for up-front payments we sometimes receive from the Group’s suppliers under RRSAs to allow them to participate in an engine programme. We have concluded that, consistent with changes to how we will account for participation fees noted above, these receipts should be deferred and recognised against cost of sales over the period of supply. This will also require judgement as to the number of units over which the receipts will be allocated. The most significant change is to the net contract balance. Other than the reclassification of participation fees and the transition from revenue recognition on an engine flying hours to a cost input basis, the adjustment also represents £(3.2)bn of reversal of profit from contract “linkage.” The majority of service contracts are on monthly payment terms based on engine flying hours. As a result, in many cases we will receive cash in advance of incurring costs to support the contract including for overhauls. Under IFRS 15 we will recognise the revenue as costs are incurred, changing the net contract debtor under current GAAP to a net deferred revenue creditor under IFRS 15.

30
Financial review Reported results
The changes in 2017 resulting from underlying trading are described on page 9.
Consistent with past practice and IFRS, we provide both reported and underlying figures. As the Group does not hedge account in accordance with IAS 39 Financial Instruments, we believe underlying figures are more representative of the trading performance by excluding the impact of year-end mark-to-market adjustments. In particular, the USD:GBP hedge book has had a significant impact on the reported results in 2017 as the USD:GBP rate has risen from 1.23 to 1.35 and the EUR:GBP has fallen from 1.17 to 1.13. The adjustments between the underlying income statement and the reported income statement are set out in note 2 to the condensed consolidated financial statements. This basis of presentation has been applied consistently.
Reconciliation between underlying and reported results
Year to 31 December Revenue Profit before
financing Financing Profit/(loss)
before tax £m 2017 2016 2017 2016 2017 2016 2017 2016
Underlying 15,090 13,783 1,175 915 (104) (102) 1,071 813
Revenue recognised at exchange rate on date of transaction
1 1,217 1,172 – – – – – –
Mark-to-market adjustments on derivatives
8 – – 24 – 2,648 (4,420) 2,672 (4,420)
Related foreign exchange adjustments – – 345 570 257 (151) 602 419
Movements on other financial instruments – – – – 11 (8) 11 (8)
Effects of acquisition accounting 2 – – (129) (115) – – (129) (115)
Impairments 3 – – (24) (219) – – (24) (219)
Exceptional restructuring 4 – – (104) (129) – – (104) (129)
Acquisitions and disposals 5 – – 798 (3) – – 798 (3)
Financial penalties 6 – – – (671) – – – (671)
Post-retirement schemes – – – (306) 1 3 1 (303)
Other – – – (1) (1) 1 (1) –
Reported 16,307 14,955 2,085 41 2,812 (4,677) 4,897 (4,636)
The most significant items included in the reported income statement, but not in underlying are summarised below.
Profit before financing
1 The impact of measuring revenues and costs at spot rates rather than rates achieved on hedging transactions increased revenues by £1,217m (2016: £1,172m) and increased profit before financing by £345m (2016: increased £570m).
2 The effects of acquisition accounting £129m (2016: £115m) principally relate to the amortisation of intangible assets arising on the acquisition of Power Systems in 2013.
3 The impairment of goodwill, investments, PPE and inventory of £24m (2016: £219m). In 2017, this includes £12m as a result of consolidating a previously unconsolidated subsidiary and £12m relating to the Marine business. The impairments in 2016 largely related to the Marine business as a result of the weakness in the oil and gas market.
4 Exceptional restructuring costs of £104m (2016: £129m). These are costs associated with the substantial closure or exit of a site, facility or activity related to the significant transformation project that the business is currently undertaking. A number of the projects within the transformation programme are spread over several years.
5 The acquisition of ITP Aero resulted in a gain of £553m from the revaluation of the previous joint venture investment and recognition of a bargain purchase of £245m.
31
6 In 2016, £671m of penalties from agreements with investigating bodies were recognised.
7 In 2016, the UK pension schemes were restructured resulting in costs of £306m, principally a settlement charge on the transfer of the Vickers Group Pension Scheme to an insurance company.
Financing and taxation
8 The mark to market gain on the Group’s hedge book of £2,648m (2016: loss of £4,420m). These reflect: the large hedge book held by the Group (circa USD $38.5bn); and the strengthening of sterling, particularly against the US dollar offset by the weakening of sterling against the euro, as noted above. At each year end, our foreign exchange hedge book is included in the balance sheet at fair value (‘mark to market’) and the movement in the year included in reported financing costs.
Appropriate tax rates are applied to these additional items included in the reported results, leading to an additional tax charge of £361m (2016: credit £865m), largely as a result of the mark to market adjustments £(463)m and £792m in 2017 and 2016 respectively). In addition, £163m of advance corporation tax credits has been recognised as a result of changes to UK tax laws in 2017.
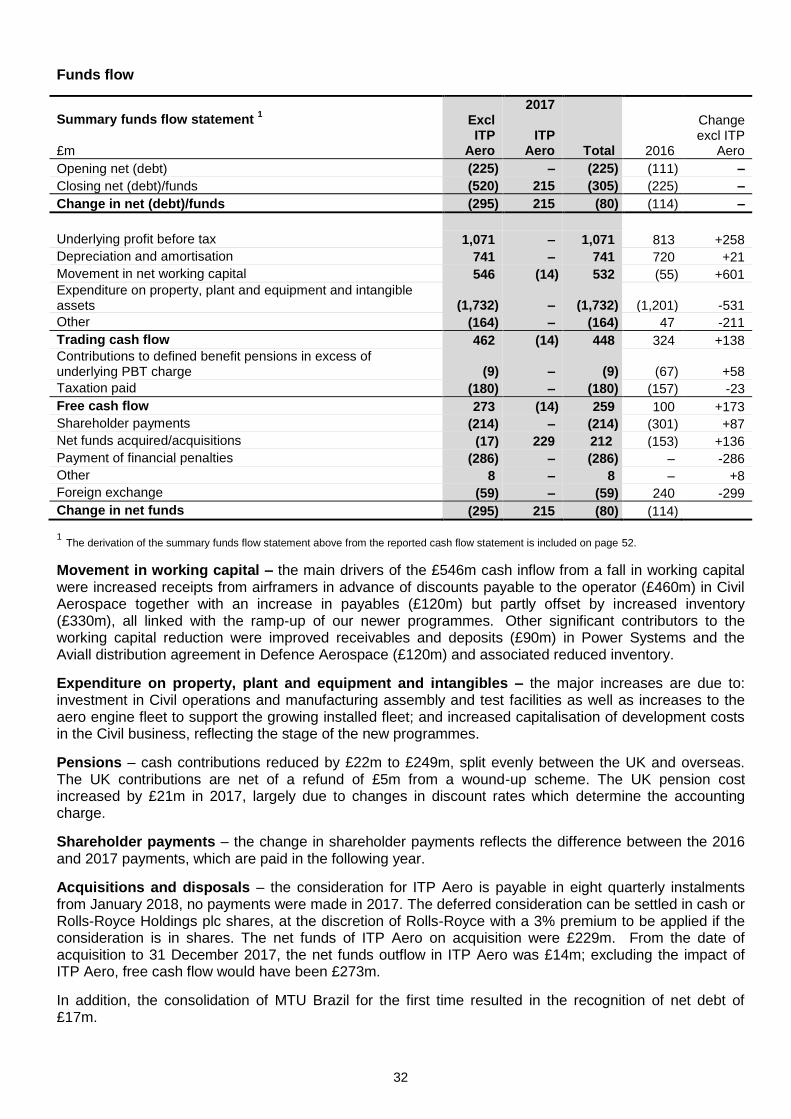
32
Funds flow
Summary funds flow statement 1
£m
Excl ITP
Aero
2017
ITP Aero Total 2016
Change excl ITP
Aero
Opening net (debt) (225) – (225) (111) –
Closing net (debt)/funds (520) 215 (305) (225) –
Change in net (debt)/funds (295) 215 (80) (114) –
Underlying profit before tax 1,071 – 1,071 813 +258
Depreciation and amortisation 741 – 741 720 +21
Movement in net working capital 546 (14) 532 (55) +601
Expenditure on property, plant and equipment and intangible assets (1,732) – (1,732) (1,201) -531
Other (164) – (164) 47 -211
Trading cash flow 462 (14) 448 324 +138
Contributions to defined benefit pensions in excess of underlying PBT charge (9) – (9) (67) +58
Taxation paid (180) – (180) (157) -23
Free cash flow 273 (14) 259 100 +173
Shareholder payments (214) – (214) (301) +87
Net funds acquired/acquisitions (17) 229 212 (153) +136
Payment of financial penalties (286) – (286) – -286
Other 8 – 8 – +8
Foreign exchange (59) – (59) 240 -299
Change in net funds (295) 215 (80) (114)
1 The derivation of the summary funds flow statement above from the reported cash flow statement is included on page 52.
Movement in working capital – the main drivers of the £546m cash inflow from a fall in working capital were increased receipts from airframers in advance of discounts payable to the operator (£460m) in Civil Aerospace together with an increase in payables (£120m) but partly offset by increased inventory (£330m), all linked with the ramp-up of our newer programmes. Other significant contributors to the working capital reduction were improved receivables and deposits (£90m) in Power Systems and the Aviall distribution agreement in Defence Aerospace (£120m) and associated reduced inventory.
Expenditure on property, plant and equipment and intangibles – the major increases are due to: investment in Civil operations and manufacturing assembly and test facilities as well as increases to the aero engine fleet to support the growing installed fleet; and increased capitalisation of development costs in the Civil business, reflecting the stage of the new programmes.
Pensions – cash contributions reduced by £22m to £249m, split evenly between the UK and overseas. The UK contributions are net of a refund of £5m from a wound-up scheme. The UK pension cost increased by £21m in 2017, largely due to changes in discount rates which determine the accounting charge.
Shareholder payments – the change in shareholder payments reflects the difference between the 2016 and 2017 payments, which are paid in the following year.
Acquisitions and disposals – the consideration for ITP Aero is payable in eight quarterly instalments from January 2018, no payments were made in 2017. The deferred consideration can be settled in cash or Rolls-Royce Holdings plc shares, at the discretion of Rolls-Royce with a 3% premium to be applied if the consideration is in shares. The net funds of ITP Aero on acquisition were £229m. From the date of acquisition to 31 December 2017, the net funds outflow in ITP Aero was £14m; excluding the impact of ITP Aero, free cash flow would have been £273m.
In addition, the consolidation of MTU Brazil for the first time resulted in the recognition of net debt of £17m.

33
Payment of financial penalties – following the agreements reached with investigating authorities in January 2017, £286m of penalties were paid in the UK, US and Brazil. Further UK payments of £378m (plus interest) will be made in 2019-2021.
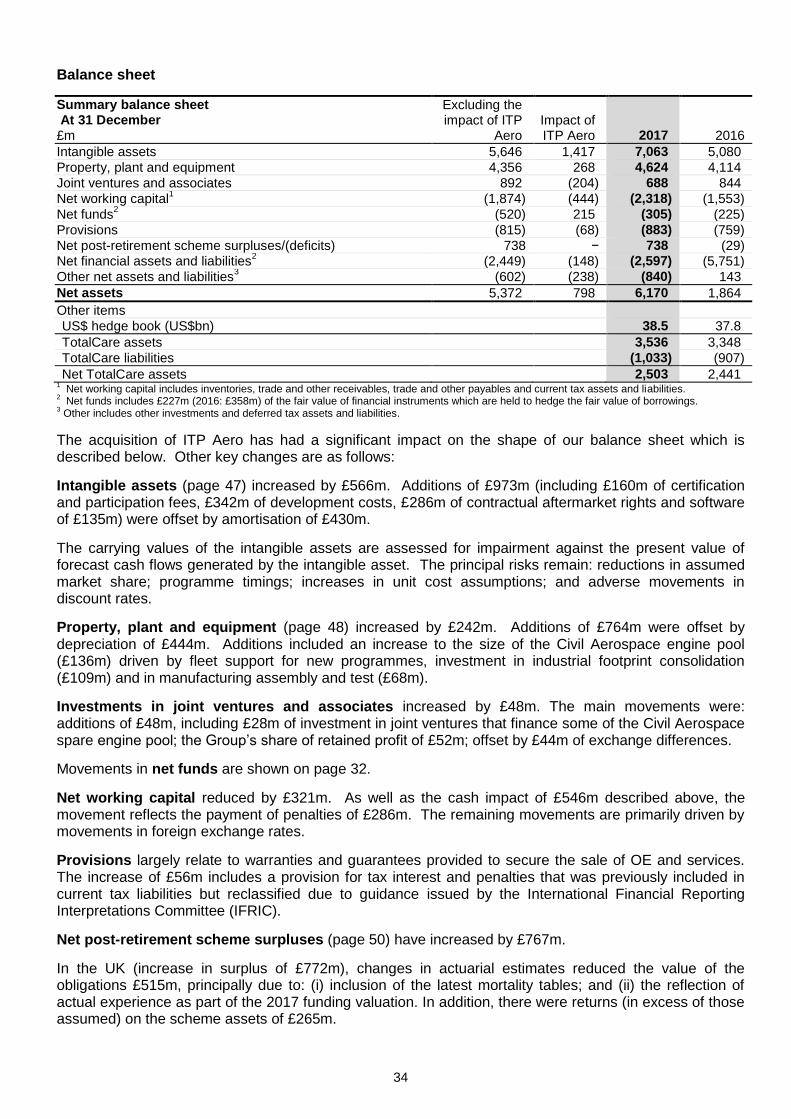
34
Balance sheet
Summary balance sheet At 31 December £m
Excluding the impact of ITP
Aero Impact of ITP Aero 2017 2016
Intangible assets 5,646 1,417 7,063 5,080
Property, plant and equipment 4,356 268 4,624 4,114
Joint ventures and associates 892 (204) 688 844
Net working capital1 (1,874) (444) (2,318) (1,553)
Net funds2 (520) 215 (305) (225)
Provisions (815) (68) (883) (759)
Net post-retirement scheme surpluses/(deficits) 738 − 738 (29) Net financial assets and liabilities
2 (2,449) (148) (2,597) (5,751)
Other net assets and liabilities3 (602) (238) (840) 143
Net assets 5,372 798 6,170 1,864
Other items
US$ hedge book (US$bn) 38.5 37.8
TotalCare assets 3,536 3,348
TotalCare liabilities (1,033) (907)
Net TotalCare assets 2,503 2,441 1
Net working capital includes inventories, trade and other receivables, trade and other payables and current tax assets and liabilities. 2 Net funds includes £227m (2016: £358m) of the fair value of financial instruments which are held to hedge the fair value of borrowings.
3 Other includes other investments and deferred tax assets and liabilities.
The acquisition of ITP Aero has had a significant impact on the shape of our balance sheet which is described below. Other key changes are as follows:
Intangible assets (page 47) increased by £566m. Additions of £973m (including £160m of certification and participation fees, £342m of development costs, £286m of contractual aftermarket rights and software of £135m) were offset by amortisation of £430m.
The carrying values of the intangible assets are assessed for impairment against the present value of forecast cash flows generated by the intangible asset. The principal risks remain: reductions in assumed market share; programme timings; increases in unit cost assumptions; and adverse movements in discount rates.
Property, plant and equipment (page 48) increased by £242m. Additions of £764m were offset by depreciation of £444m. Additions included an increase to the size of the Civil Aerospace engine pool (£136m) driven by fleet support for new programmes, investment in industrial footprint consolidation (£109m) and in manufacturing assembly and test (£68m).
Investments in joint ventures and associates increased by £48m. The main movements were: additions of £48m, including £28m of investment in joint ventures that finance some of the Civil Aerospace spare engine pool; the Group’s share of retained profit of £52m; offset by £44m of exchange differences.
Movements in net funds are shown on page 32.
Net working capital reduced by £321m. As well as the cash impact of £546m described above, the movement reflects the payment of penalties of £286m. The remaining movements are primarily driven by movements in foreign exchange rates.
Provisions largely relate to warranties and guarantees provided to secure the sale of OE and services. The increase of £56m includes a provision for tax interest and penalties that was previously included in current tax liabilities but reclassified due to guidance issued by the International Financial Reporting Interpretations Committee (IFRIC).
Net post-retirement scheme surpluses (page 50) have increased by £767m.
In the UK (increase in surplus of £772m), changes in actuarial estimates reduced the value of the obligations £515m, principally due to: (i) inclusion of the latest mortality tables; and (ii) the reflection of actual experience as part of the 2017 funding valuation. In addition, there were returns (in excess of those assumed) on the scheme assets of £265m.

35
The position overseas has remained broadly stable, with in the impact of reduced discount rates in Germany and the US being offset by other actuarial gains in the US.
Net financial assets and liabilities principally relate to the fair value of foreign exchange, commodity and interest rate contracts, set out in detail in note 10. All contracts continue to be held for hedging purposes. The fair value of foreign exchange derivatives is a net financial liability of £2.3bn, a reduction of £3.2bn in the year, mainly a result of the strengthening of sterling against the US dollar.
The US$ hedge book increased by 2% to US$38.5bn. This represents around six years of net exposure and has an average book rate of £1 to US$1.55.
Net TotalCare assets relate to Long-Term Service Agreement (LTSA) contracts in the Civil Aerospace business, including the flagship services product TotalCare. These assets represent the timing difference between the recognition of income and costs in the income statement and cash receipts and payments.
Impact of the acquisition of ITP Aero:
The acquired net assets of ITP Aero are shown on page 51. The most significant intangible assets acquired relate to customer relationships, to technology, patents and licences and to in-process development. In addition, working capital includes an accrual of £648m for the deferred consideration to be paid in 2018 and 2019. The deferred consideration can be settled in cash or Rolls-Royce Holdings plc shares, at the discretion of Rolls-Royce with a 3% premium to be applied if the consideration is in shares.
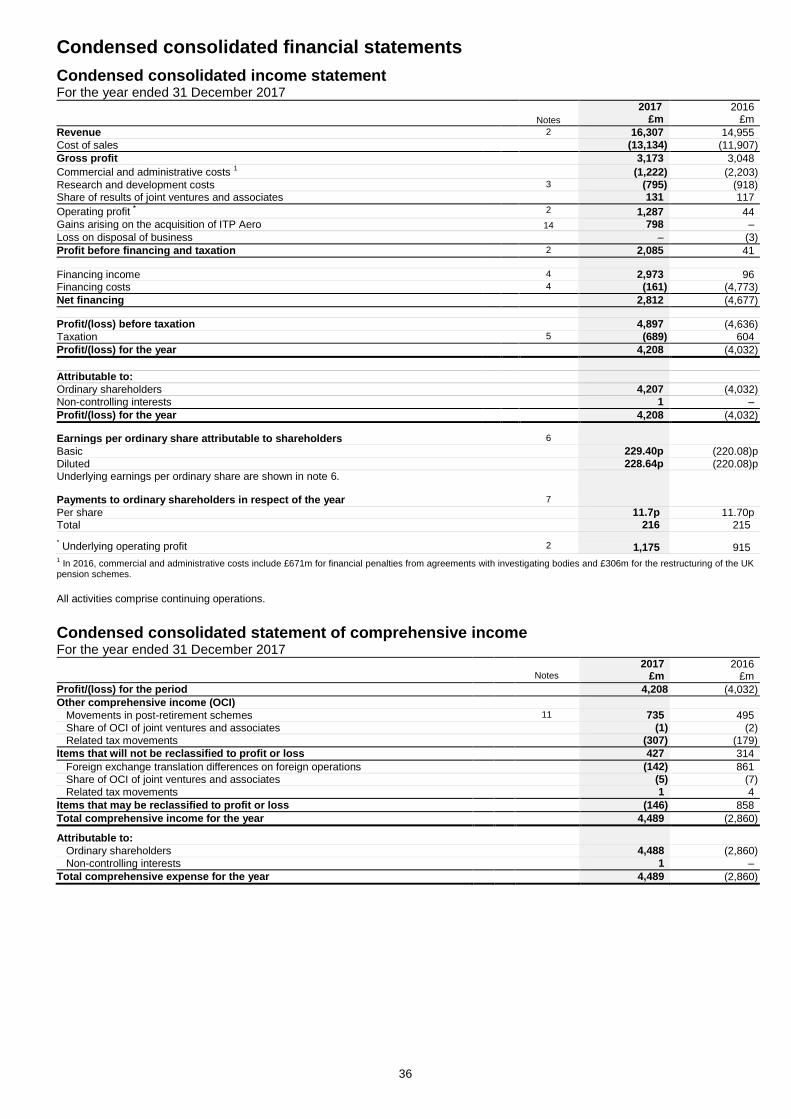
Condensed consolidated financial statements
36
Condensed consolidated income statement For the year ended 31 December 2017 2017 2016 Notes £m £m
Revenue 2 16,307 14,955
Cost of sales (13,134) (11,907)
Gross profit 3,173 3,048
Commercial and administrative costs 1 (1,222) (2,203)
Research and development costs 3 (795) (918) Share of results of joint ventures and associates 131 117
Operating profit * 2 1,287 44
Gains arising on the acquisition of ITP Aero 14 798 –
Loss on disposal of business – (3)
Profit before financing and taxation 2 2,085 41
Financing income 4 2,973 96 Financing costs 4 (161) (4,773)
Net financing 2,812 (4,677)
Profit/(loss) before taxation 4,897 (4,636)
Taxation 5 (689) 604
Profit/(loss) for the year 4,208 (4,032)
Attributable to:
Ordinary shareholders 4,207 (4,032)
Non-controlling interests 1 –
Profit/(loss) for the year 4,208 (4,032)
Earnings per ordinary share attributable to shareholders 6
Basic 229.40p (220.08)p
Diluted 228.64p (220.08)p Underlying earnings per ordinary share are shown in note 6. Payments to ordinary shareholders in respect of the year 7
Per share 11.7p 11.70p Total 216 215
* Underlying operating profit 2 1,175 915
1 In 2016, commercial and administrative costs include £671m for financial penalties from agreements with investigating bodies and £306m for the restructuring of the UK
pension schemes.
All activities comprise continuing operations.
Condensed consolidated statement of comprehensive income For the year ended 31 December 2017
2017 2016 Notes £m £m
Profit/(loss) for the period 4,208 (4,032)
Other comprehensive income (OCI)
Movements in post-retirement schemes 11 735 495
Share of OCI of joint ventures and associates (1) (2)
Related tax movements (307) (179)
Items that will not be reclassified to profit or loss 427 314
Foreign exchange translation differences on foreign operations (142) 861
Share of OCI of joint ventures and associates (5) (7)
Related tax movements 1 4
Items that may be reclassified to profit or loss (146) 858
Total comprehensive income for the year 4,489 (2,860)
Attributable to:
Ordinary shareholders 4,488 (2,860)
Non-controlling interests 1 –
Total comprehensive expense for the year 4,489 (2,860)

37
Condensed consolidated balance sheet At 31 December 2017 2017 2016 Notes £m £m
ASSETS Non-current assets Intangible assets 8 7,063 5,080
Property, plant and equipment 9 4,624 4,114
Investments – joint ventures and associates 688 844
Investments – other 26 38 Other financial assets 10 610 382
Deferred tax assets 271 876
Post-retirement scheme surpluses 11 2,125 1,346
15,407 12,680
Current assets Inventories 3,660 3,086
Trade and other receivables 7,919 6,956
Taxation recoverable 17 32
Other financial assets 10 36 5 Short-term investments 3 3
Cash and cash equivalents 2,953 2,771
Assets held for sale 7 5
14,595 12,858
Total assets 30,002 25,538
LIABILITIES Current liabilities
Borrowings (82) (172)
Other financial liabilities 10 (581) (651) Trade and other payables (9,527) (7,957)
Current tax liabilities (209) (211)
Provisions for liabilities and charges (526) (543)
(10,925) (9,534)
Non-current liabilities Borrowings (3,406) (3,185)
Other financial liabilities 10 (2,435) (5,129)
Trade and other payables (4,178) (3,459)
Deferred tax liabilities (1,144) (776) Provisions for liabilities and charges (357) (216)
Post-retirement scheme deficits 11 (1,387) (1,375)
(12,907) (14,140)
Total liabilities (23,832) (23,674)
Net assets 6,170 1,864
EQUITY Attributable to ordinary shareholders
Called-up share capital 368 367
Share premium account 195 181
Capital redemption reserve 162 162 Cash flow hedging reserve (112) (107)
Other reserves 673 814
Retained earnings 4,881 445
6,167 1,862 Non-controlling interests 3 2
Total equity 6,170 1,864
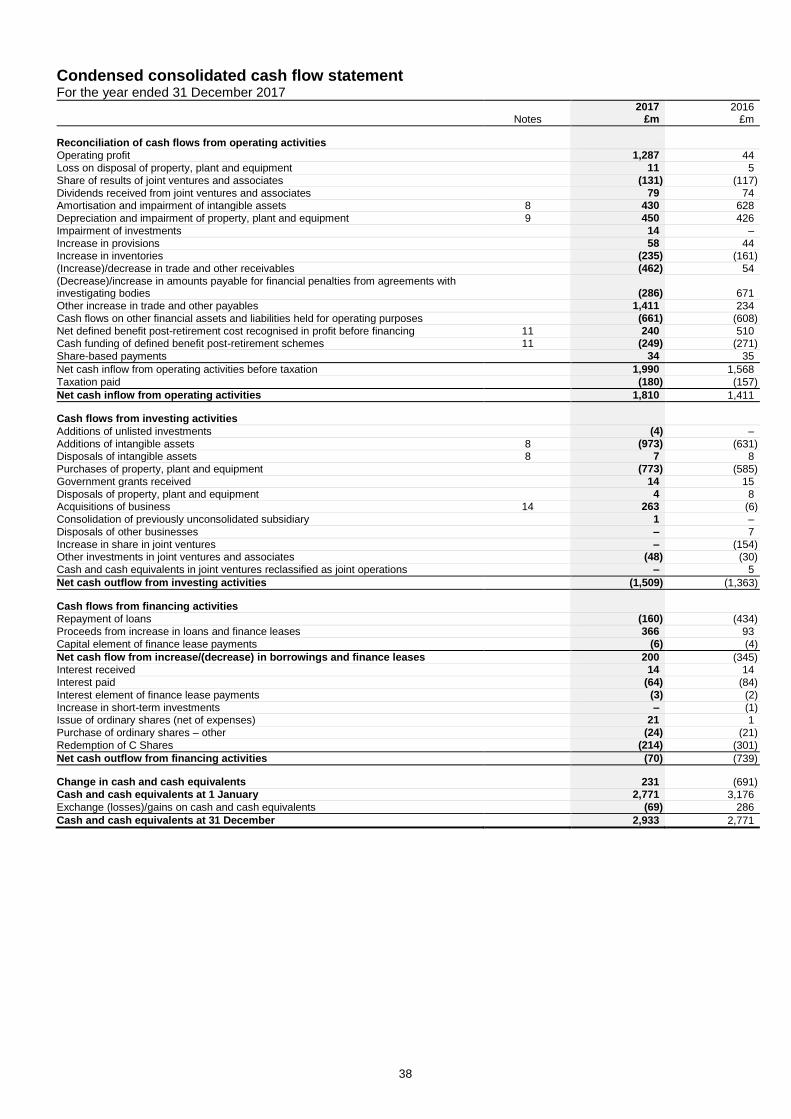
38
Condensed consolidated cash flow statement For the year ended 31 December 2017
Notes 2017
£m 2016
£m
Reconciliation of cash flows from operating activities Operating profit 1,287 44
Loss on disposal of property, plant and equipment 11 5
Share of results of joint ventures and associates (131) (117)
Dividends received from joint ventures and associates 79 74 Amortisation and impairment of intangible assets 8 430 628
Depreciation and impairment of property, plant and equipment 9 450 426
Impairment of investments 14 –
Increase in provisions 58 44 Increase in inventories (235) (161)
(Increase)/decrease in trade and other receivables (462) 54
(Decrease)/increase in amounts payable for financial penalties from agreements with investigating bodies
(286) 671
Other increase in trade and other payables 1,411 234
Cash flows on other financial assets and liabilities held for operating purposes (661) (608)
Net defined benefit post-retirement cost recognised in profit before financing 11 240 510 Cash funding of defined benefit post-retirement schemes 11 (249) (271)
Share-based payments 34 35
Net cash inflow from operating activities before taxation 1,990 1,568
Taxation paid (180) (157)
Net cash inflow from operating activities 1,810 1,411
Cash flows from investing activities
Additions of unlisted investments (4) –
Additions of intangible assets 8 (973) (631) Disposals of intangible assets 8 7 8
Purchases of property, plant and equipment (773) (585)
Government grants received 14 15
Disposals of property, plant and equipment 4 8 Acquisitions of business 14 263 (6)
Consolidation of previously unconsolidated subsidiary 1 –
Disposals of other businesses – 7
Increase in share in joint ventures – (154) Other investments in joint ventures and associates (48) (30)
Cash and cash equivalents in joint ventures reclassified as joint operations – 5
Net cash outflow from investing activities (1,509) (1,363)
Cash flows from financing activities Repayment of loans (160) (434)
Proceeds from increase in loans and finance leases 366 93
Capital element of finance lease payments (6) (4)
Net cash flow from increase/(decrease) in borrowings and finance leases 200 (345) Interest received 14 14
Interest paid (64) (84)
Interest element of finance lease payments (3) (2)
Increase in short-term investments – (1) Issue of ordinary shares (net of expenses) 21 1
Purchase of ordinary shares – other (24) (21)
Redemption of C Shares (214) (301)
Net cash outflow from financing activities (70) (739)
Change in cash and cash equivalents 231 (691) Cash and cash equivalents at 1 January 2,771 3,176
Exchange (losses)/gains on cash and cash equivalents (69) 286
Cash and cash equivalents at 31 December 2,933 2,771

39
2017 £m
2016 £m
Reconciliation of movements in cash and cash equivalents to movements in net funds
Change in cash and cash equivalents 231 (691)
Cash flow from (increase)/decrease in borrowings and finance leases (200) 345 Cash flow from increase in short-term investments – 1
Change in net funds resulting from cash flows 31 (345)
Net funds (excluding cash and cash equivalents) on acquisition of ITP Aero (34) –
Net funds (excluding cash and cash equivalents) of previously unconsolidated subsidiary (18) –
Net funds (excluding cash and cash equivalents) of joint ventures reclassified as joint operations – (9) Exchange (losses)/gains on net funds (59) 240
Fair value adjustments 131 (345)
Movement in net funds 51 (459)
Net funds at 1 January excluding the fair value of swaps (583) (124)
Net funds at 31 December excluding the fair value of swaps (532) (583) Fair value of swaps hedging fixed rate borrowings 227 358
Net funds at 31 December (305) (225)
The movement in net funds (defined by the Group as including the items shown below) is as follows:
At
1 J
an
ua
ry
2017
Fu
nd
s f
low
Net
fun
ds
on
acq
uis
itio
n o
f
bu
sin
ess
Net
fun
ds
on
co
ns
olid
ati
on
of
pre
vio
usly
un
co
nso
lid
ate
d
su
bs
idia
ry
Exch
an
ge
dif
fere
nc
es
Fa
ir v
alu
e
ad
jus
tmen
ts
Recla
ssif
icati
on
s
At
31 D
ecem
be
r
2017
£m £m £m £m £m £m £m £m
Cash at bank and in hand 872 (5) – – (29) – – 838
Money market funds 552 44 – – (7) – – 589
Short-term deposits 1,347 212 – – (33) – – 1,526
Overdrafts – (20) – – – – – (20)
Cash and cash equivalents 2,771 231 – – (69) – – 2,933
Short-term investments 3 – – – – – – 3
Other current borrowings (169) 159 (6) (18) 3 – (8) (39)
Non-current borrowings (3,121) (280) (28) – (2) 131 8 (3,292)
Finance leases (67) (79) – – 9 – – (137)
Financial liabilities (3,357) (200) (34) (18) 10 131 – (3,468)
Net funds excluding the fair value of swaps (583) 31 (34) (18) (59) 131 – (532)
Fair value of swaps hedging fixed rate borrowings 358 (131) 227
Net funds (225) 31 (34) (18) (59) – – (305)

40
Condensed consolidated statement of changes in equity For the year ended 31 December 2017 Attributable to ordinary shareholders
Sh
are
cap
ital
Sh
are
p
rem
ium
Cap
ital
red
em
pti
on
re
serv
e
Cash
flo
w
he
dg
ing
reserv
e
Oth
er
reserv
es
1
Reta
ine
d
earn
ing
s
2
To
tal
No
n-
co
ntr
ollin
g
inte
rests
(NC
I)
To
tal
eq
uit
y
£m £m £m £m £m £m £m £m £m
At 1 January 2016 367 180 161 (100) (51) 4,457 5,014 2 5,016
Loss for the year – – – – – (4,032) (4,032) – (4,032)
Foreign exchange translation differences on foreign operations – – – – 861 – 861 – 861
Movements on post-retirement schemes – – – – – 495 495 – 495
Share of comprehensive income of joint ventures and associates – – – (7) – (2) (9) – (9)
Related tax movements – – – – 4 (179) (175) – (175)
Total comprehensive income for the year – – – (7) 865 (3,718) (2,860) – (2,860)
Arising on issues of ordinary shares – 1 – – – – 1 – 1
Issue of C Shares 3 – – (301) – – 1 (300) – (300)
Redemption of C Shares – – 302 – – (302) – – – Ordinary shares purchased – – – – – (21) (21) – (21)
Share-based payments – direct to equity 4 – – – – – 30 30 – 30
Related tax movements – – – – – (2) (2) – (2)
Other changes in equity in the year – 1 1 – – (294) (292) – (292)
At 1 January 2017 367 181 162 (107) 814 445 1,862 2 1,864
Profit for the year – – – – – 4,207 4,207 1 4,208
Foreign exchange translation differences on foreign operations – – – – (142) – (142) – (142)
Movements on post-retirement schemes – – – – – 735 735 – 735
Share of comprehensive income of joint ventures and associates – – – (5) – (1) (6) – (6) Related tax movements – – – – 1 (307) (306) – (306)
Total comprehensive income for the year – – – (5) (141) 4,634 4,488 1 4,489
Arising on issues of ordinary shares 1 14 – – – (14) 1 – 1
Issue of C Shares 3 – – (215) – – 1 (214) – (214)
Redemption of C Shares – – 215 – – (215) – – –
Ordinary shares purchased – – – – – (24) (24) – (24)
Share-based payments – direct to equity 4 – – – – – 51 51 – 51
Related tax movements – – – – – 3 3 – 3
Other changes in equity in the year 1 14 – – – (198) (183) – (183)
At 31 December 2017 368 195 162 (112) 673 4,881 6,167 3 6,170
1 Other reserves include a merger reserve of £3m and a translation reserve of £670m.
2 At 31 December 2017, 6,466,153 ordinary shares with a net book value of £52m (2016: 6,854,216, 2015: 5,894,064 ordinary shares with net book values of £56m and £52m respectively) were held for the purpose of share-based payment plans and included in retained earnings. During the year, 4,992,304 ordinary shares with a net book value of £42m (2016: 1,955,390 shares with a net book value of £17m) vested in share-based payment plans. During the year the Company acquired 92,537 (2016: 165,542) of its ordinary shares via reinvestment of dividends received on its own shares and purchased 2,711,349 (2016: 2,750,000) of its ordinary shares through purchases on the London Stock Exchange. During the year, the Company issued 1,740,355 new ordinary shares (2016: nil) with a book value of £14m (2016: nil) to the Group’s share trust for its employee share based payment plans.
3 In Rolls-Royce Holdings plc’s own financial statements, C Shares are issued from the merger reserve. As this reserve is eliminated on consolidation, in the consolidated financial statements, the C Shares are shown as being issued from the capital redemption reserve.
4 Share-based payments - direct to equity is the share based payment charge for the year less the actual cost of vesting and cash received on share based schemes vesting.

41
1 Basis of preparation and accounting policies
Reporting entity Rolls-Royce Holdings plc (the ‘Company’) is a company domiciled in the UK. These condensed consolidated financial statements of the Company as at and for the year ended 31 December 2017 comprise the Company and its subsidiaries (together referred to as the "Group") and the Group's interests in joint arrangements and associates.
The consolidated financial statements of the Group as at and for the year ended 31 December 2016 (2016 Annual Report) are available upon request from the Company Secretary, Rolls-Royce Holdings plc, 62 Buckingham Gate, London SW1E 6AT.
Statement of compliance These condensed consolidated financial statements have been prepared in accordance with International Financial Reporting Standards (IFRS) adopted for use in the EU. They do not include all of the information required for full annual statements, and should be read in conjunction with the 2017 Annual Report.
The comparative figures for the financial year 31 December 2016 are not the Group's statutory accounts for that financial year. Those accounts have been reported on by the Group's auditors and delivered to the registrar of companies. The report of the auditors was (i) unqualified, (ii) did not include a reference to any matters to which the auditors drew attention by way of emphasis without qualifying their report, and (iii) did not contain a statement under section 498(2) or (3) of the Companies Act 2006.
The Board of directors approved the condensed consolidated year financial statements on 6 March 2018.
Significant accounting policies No new accounting policies had a significant impact in 2017.
Revisions to IFRS not applicable in 2017 Standards and interpretations issues by the IASB are only applicable if endorsed by the EU.
IFRS 9 Financial Instruments
IFRS 9 (effective for the year beginning 1 January 2018) relates to the accounting for financial instruments and covers: classification and measurement; impairment; and hedge accounting. Except for hedge accounting, retrospective application is required with any adjustment being made to reserves on 1 January 2018. The Group is not required to restate 2017 comparative information and is analysing the impact on adoption on its financial statements. • The Group can sell trade receivables of certain customers before the due date. The trade receivables of these customers that
are not sold will be classified and disclosed at fair value through other comprehensive income from 2018. This will not have a significant impact on the income statement.
• The Group will adopt the simplified approach to provide for losses on receivables and contract assets resulting from transactions within the scope of IFRS 15. The Group performed a preliminary assessment of the adoption of the standard on the basis of average default risk of customers and will continue to work during 2018 to analyse the impact. This will not have a significant impact on the income statement.
• The Group determined that all existing effective hedging relationship will continue to qualify for hedge accounting under IFRS 9. We will continue not to hedge account for forecast foreign exchange transactions. This will not have a significant impact on the financial statements.
IFRS 15 Revenue from Contracts with Customers
IFRS 15 provides a single, principles based five-step model to be applied to all sales contracts. It is based on the transfer of control of goods and services to customers and replaces the separate models for goods, services and construction contracts currently included in IAS 11 Construction Contracts and IAS 18 Revenue. There are three broad implications: • Linked accounting will cease to exist so all OE sales will be treated on the same basis; • OE engine cash deficits will no longer be capitalised and recorded as contractual aftermarket rights, they will instead be
recognised on delivery; • Revenue and profits for aftermarket services will be recognised on an activity basis as costs are incurred.
The Group will adopt IFRS 15 on 1 January 2018 using the ‘full’ retrospective approach. The Group has undertaken significant analysis on the impact of IFRS 15 and the most significant accounting judgements, estimates and policies are set out below. Work will continue during 2018 to review and refine policies and procedures required to implement IFRS 15. As a result it is possible that there may be some changes to the impact reported.
Key areas of judgement:
Determining the timing of satisfaction of performance obligations: • Where the performance obligation is the supply of goods (principally original equipment and spare parts) which is satisfied at the
point in time that those goods are transferred to the customer, the Group will recognise revenue at that point in time. • The Group generates a significant proportion of its revenue and profit from aftermarket arrangements arising from the use of the
installed original equipment (OE). These aftermarket contracts, such as TotalCare and CorporateCare agreements in Civil Aerospace, cover a range of services and often have contractual terms covering more than one year. Under these contracts, the Group’s primary obligation is to maintain customers’ equipment in an operational condition and this is achieved by undertaking various activities, such as repair, overhaul and engine monitoring over the period of the contract. Revenue on these contracts is recognised over the period of the contract and the measure of performance is a matter of judgement. In general, the Directors consider that the stage of performance of the contract is best measured by using the actual costs incurred to date compared to the estimated costs to complete the performance obligations.
• The assessment of stage of completion is generally measured for each contract. However, in certain cases, such as for CorporateCare agreements where there are many contracts covering aftermarket services, each for a small number of engines, the Group will apply the practical expedient offered by IFRS 15 to account for a portfolio of contracts together as it expects that

42
the effects on the financial statements would not differ materially from applying the standard to the individual contracts in the portfolio.
The Group has paid participation fees to airframe manufacturers, its customers for OE on certain programmes. Amounts paid are initially treated as contract assets and subsequently charged as a reduction to the OE revenue when it is transferred to the customer. The number of units over which the asset will be charged is a matter of judgement as the orders will grow over the course of the programme.
In assessing the accounting for the participation fee payments we make to our OE customers, we have also assessed the accounting for up-front payments we sometimes receive from the Group’s suppliers under RRSAs to allow them to participate in an engine programme. We have concluded that, consistent with our accounting for participation fees noted above, these receipts should be deferred and recognised against cost of sales over the period of supply. This will also require judgement as to the number of units over which the receipts will be allocated.
The Group has elected to use the practical expedient to expense as incurred any incremental costs of obtaining or fulfilling a contract if the amortisation period of an asset created would have been one year or less.
Key sources of estimation uncertainty: Assessment of long-term contractual arrangements: • The estimated revenue and costs under such agreements are inherently imprecise and significant estimates are required to take
into account uncertainties relating to: (i) the forecast utilisation of the engines by the operator and related pricing; (ii) the frequency of engine overhauls where the principal variables are the operating parameters of the engine and operational lives of components; and (iii) the forecast costs to maintain the engines in accordance with the contractual requirements where the cost of each overhaul is dependent on the required work-scope and the cost of parts and labour at the time.
• An allowance is made against the risk of non-recovery of resulting contract balances from reduced utilisation e.g. engine flying hours, based on historical forecasting experience, the risk of aircraft being parked by the customer and the customer’s creditworthiness.
• A significant amount of revenue and cost is denominated in currencies other than that of the relevant Group undertaking. These are translated at estimated long-term exchange rates.
Significant accounting policies: Revenue recognition comprises sales to outside customers after discounts and amounts payable to customers and excludes value added taxes. The Group has elected to use the practical expedient not to adjust revenue for the effect of financing components where the expectation is that the period between the transfer of goods and services to customers and the receipt of payment is less than a year.
Sales of services are recognised by reference to the progress towards complete satisfaction of the performance obligation provided the outcome of contracts can be assessed with reasonable certainty. Full provision is made for any estimated losses to completion of contracts, having regard to the overall substance of the arrangements.
TotalCare and similar long-term aftermarket service arrangements are accounted for on a stage of completion basis. A contract liability will be created where payment is received ahead of the costs incurred to meet performance obligations. In making the assessment of future revenue, costs and the level of profit recognised, the Group takes account of the inherent uncertainties and the risk of non-recovery of any resulting contract balances. To the extent that actual revenue and costs differ from forecast or that forecasts change, the cumulative impact is recognised in the period. When accounting for a portfolio of long-term service arrangements, such as CorporateCare agreements, the Group uses estimates and assumptions that reflect the size and composition of the portfolio. The new standard has no impact on the timing of the reported cash flows.
The comparative 2017 results to be included in the 2018 financial statements will be restated. Certain tables from note 2 have been prepared on the IFRS 15 basis set out above and are shown in note 16. Overall, the adoption of IFRS 15 is expected to result in a reduction in 2017 underlying revenue and operating profit of £1,408m and £854m respectively and a reduction of net assets of £5.2bn at 31 December 2017.
IFRS 16 Leases
IFRS 16 (effective for the year beginning 1 January 2019) will require all leases to be recognised on the balance sheet. Currently, IAS 17 Leases only requires leases categorised as finance leases to be recognised on the balance sheet.
The Group is progressing well in its analysis of how IFRS 16 should be implemented and is developing the data-set, system and processes that will be required. The most significant leases, by value, relate to property and aircraft engines. The Group expects to apply the standard retrospectively with the cumulative effect of initially application recognised on 1 January 2019. Under this approach the Group will not restate comparative periods.
In broad-terms the impact of the standard will be to: • Recognise an additional lease liability equivalent to the present value of the lease commitments at the date of transition. Further
work is required to validate the contracts which will represent leases under IFRS 16, including ongoing consideration of some supply chain contracts. The Group is also considering whether there are any re-assessments of lease term required, and the discount rate to be applied. Under the expected transition option, payments will be discounted using incremental borrowing rates at 1 January 2019. The Group holds some leases in non-functional currencies where the value of the lease liability will be dependent on spot exchange rates on transition.
• Recognise a right-of-use asset measured either: as if the standard had applied since commencement of the lease; or at an amount equal to the lease liability on transition.
The Group does not consider that any other standards, amendments or interpretations issued by the IASB, but not yet applicable will have a significant impact on the financial statements.
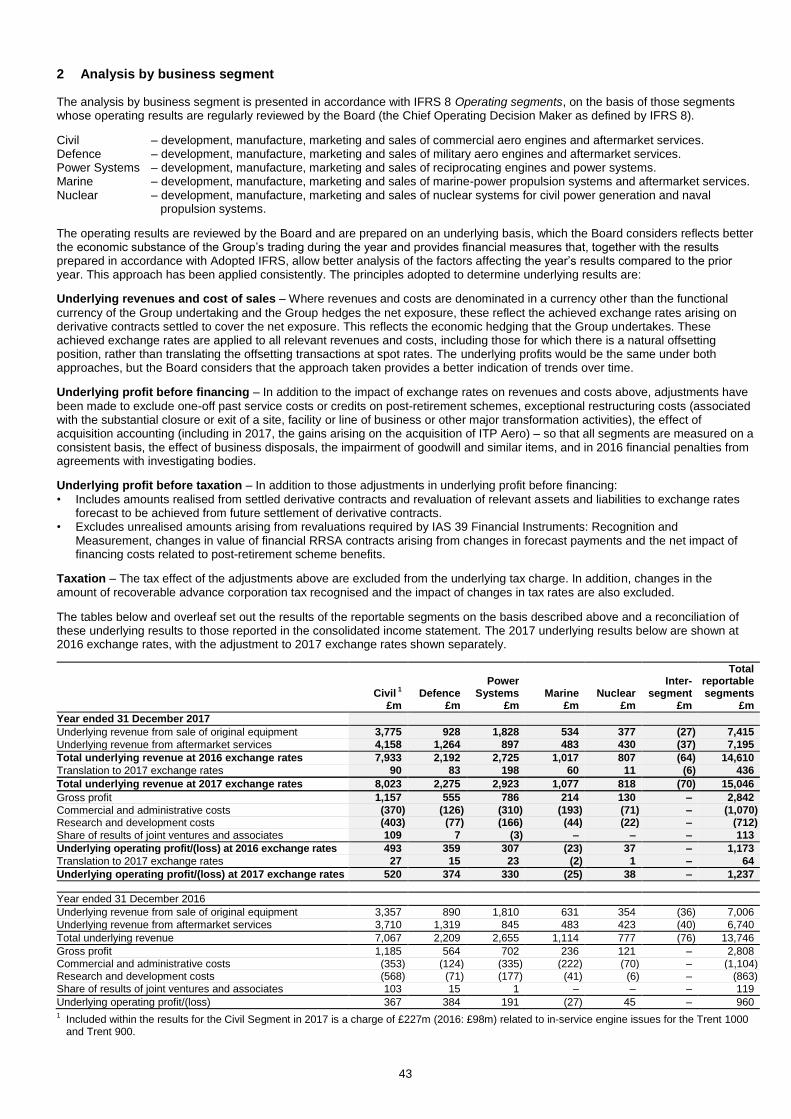
43
2 Analysis by business segment
The analysis by business segment is presented in accordance with IFRS 8 Operating segments, on the basis of those segments whose operating results are regularly reviewed by the Board (the Chief Operating Decision Maker as defined by IFRS 8).
Civil – development, manufacture, marketing and sales of commercial aero engines and aftermarket services. Defence – development, manufacture, marketing and sales of military aero engines and aftermarket services. Power Systems – development, manufacture, marketing and sales of reciprocating engines and power systems. Marine – development, manufacture, marketing and sales of marine-power propulsion systems and aftermarket services. Nuclear – development, manufacture, marketing and sales of nuclear systems for civil power generation and naval
propulsion systems.
The operating results are reviewed by the Board and are prepared on an underlying basis, which the Board considers reflects better the economic substance of the Group’s trading during the year and provides financial measures that, together with the results prepared in accordance with Adopted IFRS, allow better analysis of the factors affecting the year’s results compared to the prior year. This approach has been applied consistently. The principles adopted to determine underlying results are:
Underlying revenues and cost of sales – Where revenues and costs are denominated in a currency other than the functional
currency of the Group undertaking and the Group hedges the net exposure, these reflect the achieved exchange rates arising on derivative contracts settled to cover the net exposure. This reflects the economic hedging that the Group undertakes. These achieved exchange rates are applied to all relevant revenues and costs, including those for which there is a natural offsetting position, rather than translating the offsetting transactions at spot rates. The underlying profits would be the same under both approaches, but the Board considers that the approach taken provides a better indication of trends over time.
Underlying profit before financing – In addition to the impact of exchange rates on revenues and costs above, adjustments have
been made to exclude one-off past service costs or credits on post-retirement schemes, exceptional restructuring costs (associated with the substantial closure or exit of a site, facility or line of business or other major transformation activities), the effect of acquisition accounting (including in 2017, the gains arising on the acquisition of ITP Aero) – so that all segments are measured on a consistent basis, the effect of business disposals, the impairment of goodwill and similar items, and in 2016 financial penalties from agreements with investigating bodies.
Underlying profit before taxation – In addition to those adjustments in underlying profit before financing:
• Includes amounts realised from settled derivative contracts and revaluation of relevant assets and liabilities to exchange rates forecast to be achieved from future settlement of derivative contracts.
• Excludes unrealised amounts arising from revaluations required by IAS 39 Financial Instruments: Recognition and Measurement, changes in value of financial RRSA contracts arising from changes in forecast payments and the net impact of financing costs related to post-retirement scheme benefits.
Taxation – The tax effect of the adjustments above are excluded from the underlying tax charge. In addition, changes in the amount of recoverable advance corporation tax recognised and the impact of changes in tax rates are also excluded.
The tables below and overleaf set out the results of the reportable segments on the basis described above and a reconciliation of these underlying results to those reported in the consolidated income statement. The 2017 underlying results below are shown at 2016 exchange rates, with the adjustment to 2017 exchange rates shown separately.
Civil 1 Defence
Power Systems Marine Nuclear
Inter-segment
Total reportable segments
£m £m £m £m £m £m £m
Year ended 31 December 2017
Underlying revenue from sale of original equipment 3,775 928 1,828 534 377 (27) 7,415
Underlying revenue from aftermarket services 4,158 1,264 897 483 430 (37) 7,195
Total underlying revenue at 2016 exchange rates 7,933 2,192 2,725 1,017 807 (64) 14,610
Translation to 2017 exchange rates 90 83 198 60 11 (6) 436
Total underlying revenue at 2017 exchange rates 8,023 2,275 2,923 1,077 818 (70) 15,046
Gross profit 1,157 555 786 214 130 – 2,842
Commercial and administrative costs (370) (126) (310) (193) (71) – (1,070)
Research and development costs (403) (77) (166) (44) (22) – (712)
Share of results of joint ventures and associates 109 7 (3) – – – 113
Underlying operating profit/(loss) at 2016 exchange rates 493 359 307 (23) 37 – 1,173
Translation to 2017 exchange rates 27 15 23 (2) 1 – 64
Underlying operating profit/(loss) at 2017 exchange rates 520 374 330 (25) 38 – 1,237
Year ended 31 December 2016
Underlying revenue from sale of original equipment 3,357 890 1,810 631 354 (36) 7,006
Underlying revenue from aftermarket services 3,710 1,319 845 483 423 (40) 6,740
Total underlying revenue 7,067 2,209 2,655 1,114 777 (76) 13,746
Gross profit 1,185 564 702 236 121 – 2,808
Commercial and administrative costs (353) (124) (335) (222) (70) – (1,104) Research and development costs (568) (71) (177) (41) (6) – (863)
Share of results of joint ventures and associates 103 15 1 – – – 119
Underlying operating profit/(loss) 367 384 191 (27) 45 – 960 1
Included within the results for the Civil Segment in 2017 is a charge of £227m (2016: £98m) related to in-service engine issues for the Trent 1000 and Trent 900.

44
Reconciliation to reported results
Total reportable segments
Other businesses
1
and corporate Total
underlying
Underlying adjustments
and adjustments
to foreign exchange
Group results at
actual exchange
rates £m £m £m £m £m
Year ended 31 December 2017
Revenue from sale of original equipment 7,415 21 7,436 654 8,090
Revenue from aftermarket services 7,195 20 7,215 1,002 8,217
Total revenue at 2016 exchange rates 14,610 41 14,651 1,656 16,307
Translation to 2017 exchange rates 436 3 439 (439) –
Total revenue at 2017 exchange rates 15,046 44 15,090 1,217 16,307
Gross profit 2,842 4 2,846 327 3,173
Commercial and administrative costs (1,070) (54) (1,124) (98) (1,222)
Research and development costs (712) 1 (711) (84) (795)
Share of results of joint ventures and associates 113 (11) 102 29 131
Operating profit/(loss) at 2016 exchange rates 1,173 (60) 1,113 174 1,287
Translation to 2017 exchange rates 64 (2) 62 (62) –
Operating profit/(loss) at 2017 exchange rates 1,237 (62) 1,175 112 1,287 Gains arising on the acquisition of ITP Aero – – – 798 798
Profit/(loss) before financing and taxation 1,237 (62) 1,175 910 2,085
Net financing (104) (104) 2,916 2,812
Profit/(loss) before taxation (166) 1,071 3,826 4,897
Taxation (328) (328) (361) (689)
Profit for the year 743 3,465 4,208
Attributable to:
Ordinary shareholders 742 3,465 4,207
Non-controlling interests 1 – 1
Year ended 31 December 2016
Revenue from sale of original equipment 7,006 21 7,027 561 7,588
Revenue from aftermarket services 6,740 16 6,756 611 7,367
Total revenue 13,746 37 13,783 1,172 14,955
Gross profit 2,808 10 2,818 230 3,048
Commercial and administrative costs (1,104) (54) (1,158) (1,045) (2,203) Research and development costs (863) 1 (862) (56) (918)
Share of results of joint ventures and associates 119 (2) 117 – 117
Operating profit/(loss) 960 (45) 915 (871) 44
Loss on disposal of businesses – – – (3) (3)
Profit before financing and taxation 960 (45) 915 (874) 41 Net financing (102) (102) (4,575) (4,677)
Profit/(loss) before taxation (147) 813 (5,449) (4,636)
Taxation (261) (261) 865 604
Profit/(loss) for the year 552 (4,584) (4,032)
Attributable to:
Ordinary shareholders 552 (4,584) (4,032)
Non-controlling interests – – –
1 Other businesses comprise former Energy businesses not included in the disposal to Siemens in 2014.
Total assets Total liabilities Net assets/(liabilities)
2017
£m 2016
£m 2017
£m 2016
£m 2017
£m 2016
£m
Civil 16,005 13,856 (13,160) (14,510) 2,845 (654)
Defence 1,742 1,759 (1,837) (1,996) (95) (237)
Power Systems 3,787 3,837 (1,256) (1,151) 2,531 2,686 Marine 1,271 1,520 (761) (903) 510 617
Nuclear 396 352 (426) (435) (30) (83)
Inter-segment (1,360) (1,223) 1,360 1,223 – –
Reportable segments 21,841 20,101 (16,080) (17,772) 5,761 2,329 Other businesses and corporate
1 2,565 51 (1,524) (183) 1,041 (132)
Net funds/(debt) 3,183 3,132 (3,488) (3,357) (305) (225)
Tax assets/(liabilities) 288 908 (1,353) (987) (1,065) (79)
Post-retirement scheme surpluses/(deficits) 2,125 1,346 (1,387) (1,375) 738 (29)
30,002 25,538 (23,832) (23,674) 6,170 1,864
1 Includes ITP Aero
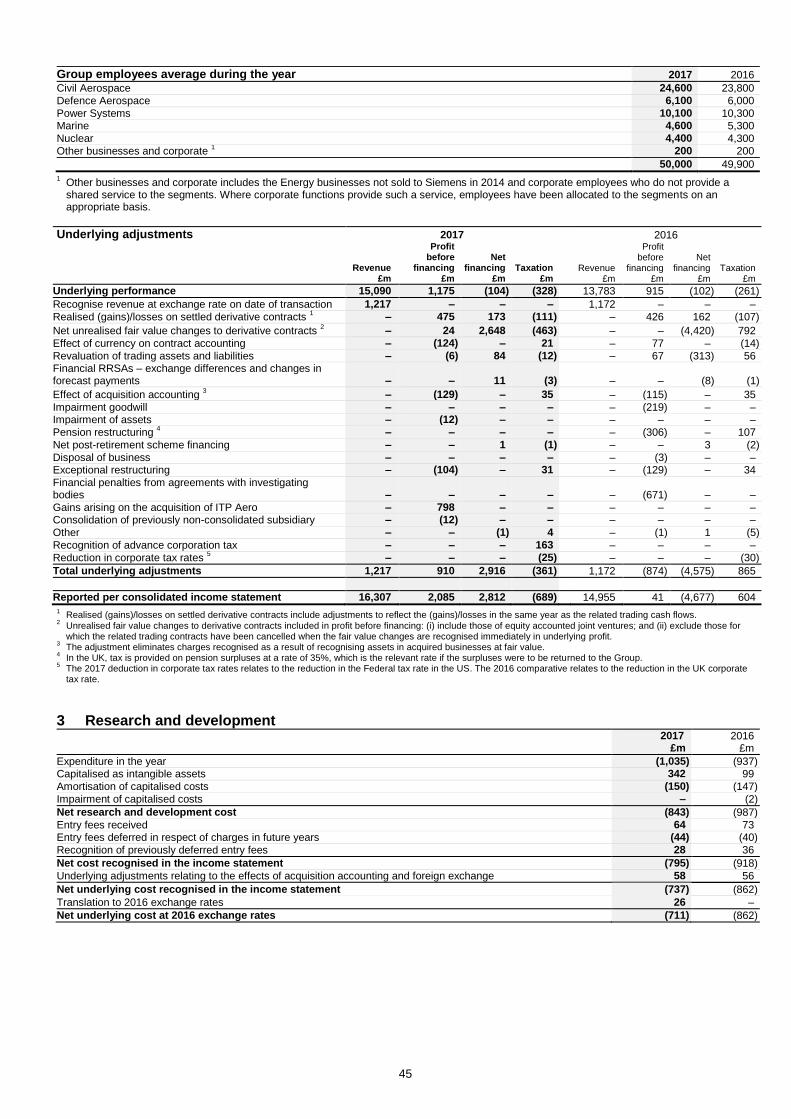
45
Group employees average during the year 2017 2016
Civil Aerospace 24,600 23,800
Defence Aerospace 6,100 6,000
Power Systems 10,100 10,300 Marine 4,600 5,300
Nuclear 4,400 4,300
Other businesses and corporate 1 200 200
50,000 49,900
1 Other businesses and corporate includes the Energy businesses not sold to Siemens in 2014 and corporate employees who do not provide a shared service to the segments. Where corporate functions provide such a service, employees have been allocated to the segments on an appropriate basis.
Underlying adjustments 2017 2016
Revenue
£m
Profit before
financing £m
Net financing
£m Taxation
£m Revenue
£m
Profit before
financing £m
Net financing
£m Taxation
£m
Underlying performance 15,090 1,175 (104) (328) 13,783 915 (102) (261)
Recognise revenue at exchange rate on date of transaction 1,217 – – – 1,172 – – –
Realised (gains)/losses on settled derivative contracts 1 – 475 173 (111) – 426 162 (107)
Net unrealised fair value changes to derivative contracts 2 – 24 2,648 (463) – – (4,420) 792
Effect of currency on contract accounting – (124) – 21 – 77 – (14)
Revaluation of trading assets and liabilities – (6) 84 (12) – 67 (313) 56 Financial RRSAs – exchange differences and changes in forecast payments – – 11 (3) – – (8) (1)
Effect of acquisition accounting 3 – (129) – 35 – (115) – 35
Impairment goodwill – – – – – (219) – – Impairment of assets – (12) – – – – – –
Pension restructuring 4 – – – – – (306) – 107
Net post-retirement scheme financing – – 1 (1) – – 3 (2)
Disposal of business – – – – – (3) – – Exceptional restructuring – (104) – 31 – (129) – 34
Financial penalties from agreements with investigating bodies – – – – – (671) – –
Gains arising on the acquisition of ITP Aero – 798 – – – – – – Consolidation of previously non-consolidated subsidiary – (12) – – – – – –
Other – – (1) 4 – (1) 1 (5)
Recognition of advance corporation tax – – – 163 – – – –
Reduction in corporate tax rates 5 – – – (25) – – – (30)
Total underlying adjustments 1,217 910 2,916 (361) 1,172 (874) (4,575) 865
Reported per consolidated income statement 16,307 2,085 2,812 (689) 14,955 41 (4,677) 604 1 Realised (gains)/losses on settled derivative contracts include adjustments to reflect the (gains)/losses in the same year as the related trading cash flows.
2 Unrealised fair value changes to derivative contracts included in profit before financing: (i) include those of equity accounted joint ventures; and (ii) exclude those for
which the related trading contracts have been cancelled when the fair value changes are recognised immediately in underlying profit. 3
The adjustment eliminates charges recognised as a result of recognising assets in acquired businesses at fair value.
4 In the UK, tax is provided on pension surpluses at a rate of 35%, which is the relevant rate if the surpluses were to be returned to the Group.
5 The 2017 deduction in corporate tax rates relates to the reduction in the Federal tax rate in the US. The 2016 comparative relates to the reduction in the UK corporate
tax rate.
3 Research and development 2017 2016 £m £m
Expenditure in the year (1,035) (937) Capitalised as intangible assets 342 99
Amortisation of capitalised costs (150) (147)
Impairment of capitalised costs – (2)
Net research and development cost (843) (987)
Entry fees received 64 73 Entry fees deferred in respect of charges in future years (44) (40)
Recognition of previously deferred entry fees 28 36
Net cost recognised in the income statement (795) (918)
Underlying adjustments relating to the effects of acquisition accounting and foreign exchange 58 56
Net underlying cost recognised in the income statement (737) (862)
Translation to 2016 exchange rates 26 –
Net underlying cost at 2016 exchange rates (711) (862)
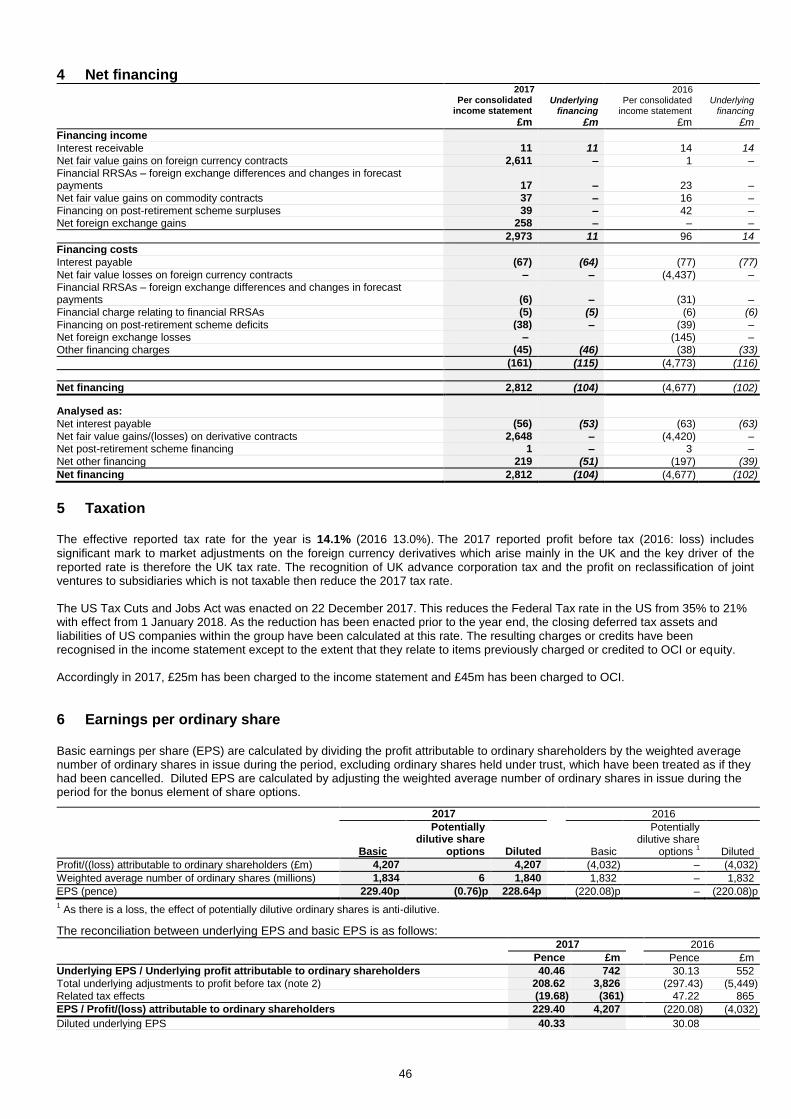
46
4 Net financing 2017 2016
Per consolidated
income statement Underlying
financing Per consolidated
income statement Underlying
financing
£m £m £m £m
Financing income
Interest receivable 11 11 14 14
Net fair value gains on foreign currency contracts 2,611 – 1 – Financial RRSAs – foreign exchange differences and changes in forecast payments 17 – 23 –
Net fair value gains on commodity contracts 37 – 16 –
Financing on post-retirement scheme surpluses 39 – 42 – Net foreign exchange gains 258 – – –
2,973 11 96 14
Financing costs
Interest payable (67) (64) (77) (77)
Net fair value losses on foreign currency contracts – – (4,437) – Financial RRSAs – foreign exchange differences and changes in forecast payments (6) – (31) –
Financial charge relating to financial RRSAs (5) (5) (6) (6)
Financing on post-retirement scheme deficits (38) – (39) – Net foreign exchange losses – (145) –
Other financing charges (45) (46) (38) (33)
(161) (115) (4,773) (116)
Net financing 2,812 (104) (4,677) (102)
Analysed as:
Net interest payable (56) (53) (63) (63)
Net fair value gains/(losses) on derivative contracts 2,648 – (4,420) – Net post-retirement scheme financing 1 – 3 –
Net other financing 219 (51) (197) (39)
Net financing 2,812 (104) (4,677) (102)
5 Taxation
The effective reported tax rate for the year is 14.1% (2016 13.0%). The 2017 reported profit before tax (2016: loss) includes
significant mark to market adjustments on the foreign currency derivatives which arise mainly in the UK and the key driver of the reported rate is therefore the UK tax rate. The recognition of UK advance corporation tax and the profit on reclassification of joint ventures to subsidiaries which is not taxable then reduce the 2017 tax rate. The US Tax Cuts and Jobs Act was enacted on 22 December 2017. This reduces the Federal Tax rate in the US from 35% to 21% with effect from 1 January 2018. As the reduction has been enacted prior to the year end, the closing deferred tax assets and liabilities of US companies within the group have been calculated at this rate. The resulting charges or credits have been recognised in the income statement except to the extent that they relate to items previously charged or credited to OCI or equity. Accordingly in 2017, £25m has been charged to the income statement and £45m has been charged to OCI.
6 Earnings per ordinary share
Basic earnings per share (EPS) are calculated by dividing the profit attributable to ordinary shareholders by the weighted average number of ordinary shares in issue during the period, excluding ordinary shares held under trust, which have been treated as if they had been cancelled. Diluted EPS are calculated by adjusting the weighted average number of ordinary shares in issue during the period for the bonus element of share options.
2017 2016
Basic
Potentially dilutive share
options Diluted
Basic
Potentially dilutive share
options 1 Diluted
Profit/((loss) attributable to ordinary shareholders (£m) 4,207 4,207 (4,032) – (4,032)
Weighted average number of ordinary shares (millions) 1,834 6 1,840 1,832 – 1,832
EPS (pence) 229.40p (0.76)p 228.64p (220.08)p – (220.08)p
1 As there is a loss, the effect of potentially dilutive ordinary shares is anti-dilutive.
The reconciliation between underlying EPS and basic EPS is as follows: 2017 2016
Pence £m Pence £m
Underlying EPS / Underlying profit attributable to ordinary shareholders 40.46 742 30.13 552
Total underlying adjustments to profit before tax (note 2) 208.62 3,826 (297.43) (5,449) Related tax effects (19.68) (361) 47.22 865
EPS / Profit/(loss) attributable to ordinary shareholders 229.40 4,207 (220.08) (4,032)
Diluted underlying EPS 40.33 30.08
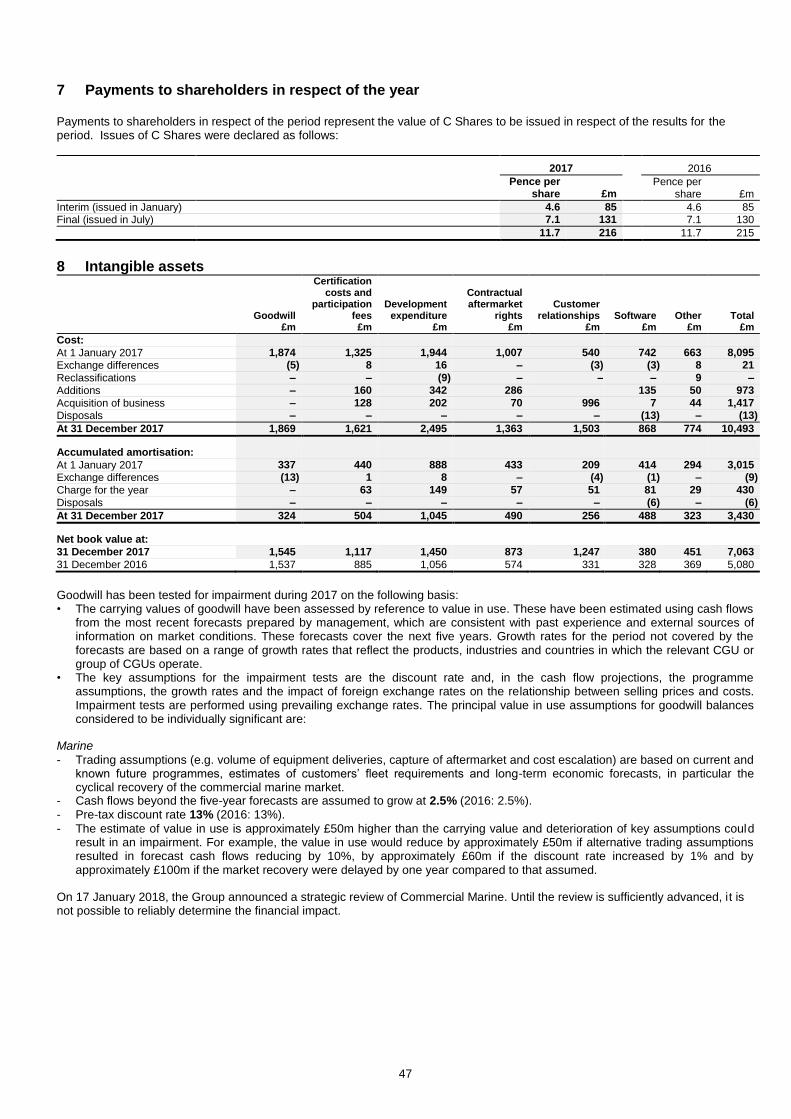
47
7 Payments to shareholders in respect of the year
Payments to shareholders in respect of the period represent the value of C Shares to be issued in respect of the results for the period. Issues of C Shares were declared as follows:
2017
2016
Pence per
share £m Pence per
share £m
Interim (issued in January) 4.6 85 4.6 85 Final (issued in July) 7.1 131 7.1 130
11.7 216 11.7 215
8 Intangible assets
Goodwill
£m
Certification costs and
participation fees £m
Development expenditure
£m
Contractual aftermarket
rights £m
Customer relationships
£m Software
£m Other
£m Total
£m
Cost:
At 1 January 2017 1,874 1,325 1,944 1,007 540 742 663 8,095
Exchange differences (5) 8 16 – (3) (3) 8 21
Reclassifications – – (9) – – – 9 –
Additions – 160 342 286 135 50 973
Acquisition of business – 128 202 70 996 7 44 1,417
Disposals – – – – – (13) – (13)
At 31 December 2017 1,869 1,621 2,495 1,363 1,503 868 774 10,493
Accumulated amortisation:
At 1 January 2017 337 440 888 433 209 414 294 3,015
Exchange differences (13) 1 8 – (4) (1) – (9)
Charge for the year – 63 149 57 51 81 29 430
Disposals – – – – – (6) – (6)
At 31 December 2017 324 504 1,045 490 256 488 323 3,430
Net book value at: 31 December 2017 1,545 1,117 1,450 873 1,247 380 451 7,063
31 December 2016 1,537 885 1,056 574 331 328 369 5,080
Goodwill has been tested for impairment during 2017 on the following basis: • The carrying values of goodwill have been assessed by reference to value in use. These have been estimated using cash flows
from the most recent forecasts prepared by management, which are consistent with past experience and external sources of information on market conditions. These forecasts cover the next five years. Growth rates for the period not covered by the forecasts are based on a range of growth rates that reflect the products, industries and countries in which the relevant CGU or group of CGUs operate.
• The key assumptions for the impairment tests are the discount rate and, in the cash flow projections, the programme assumptions, the growth rates and the impact of foreign exchange rates on the relationship between selling prices and costs. Impairment tests are performed using prevailing exchange rates. The principal value in use assumptions for goodwill balances considered to be individually significant are:
Marine
- Trading assumptions (e.g. volume of equipment deliveries, capture of aftermarket and cost escalation) are based on current and known future programmes, estimates of customers’ fleet requirements and long-term economic forecasts, in particular the cyclical recovery of the commercial marine market.
- Cash flows beyond the five-year forecasts are assumed to grow at 2.5% (2016: 2.5%). - Pre-tax discount rate 13% (2016: 13%).
- The estimate of value in use is approximately £50m higher than the carrying value and deterioration of key assumptions could result in an impairment. For example, the value in use would reduce by approximately £50m if alternative trading assumptions resulted in forecast cash flows reducing by 10%, by approximately £60m if the discount rate increased by 1% and by approximately £100m if the market recovery were delayed by one year compared to that assumed.
On 17 January 2018, the Group announced a strategic review of Commercial Marine. Until the review is sufficiently advanced, it is not possible to reliably determine the financial impact.
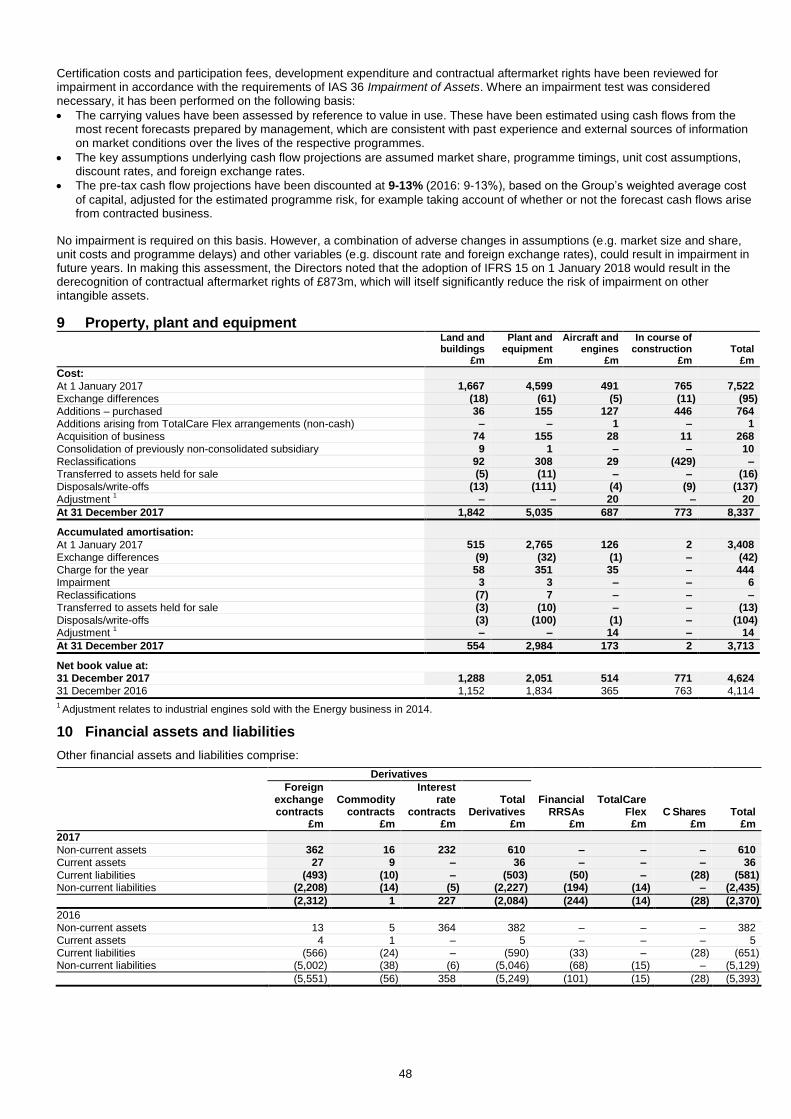
48
Certification costs and participation fees, development expenditure and contractual aftermarket rights have been reviewed for impairment in accordance with the requirements of IAS 36 Impairment of Assets. Where an impairment test was considered necessary, it has been performed on the following basis:
The carrying values have been assessed by reference to value in use. These have been estimated using cash flows from the most recent forecasts prepared by management, which are consistent with past experience and external sources of information on market conditions over the lives of the respective programmes.
The key assumptions underlying cash flow projections are assumed market share, programme timings, unit cost assumptions, discount rates, and foreign exchange rates.
The pre-tax cash flow projections have been discounted at 9-13% (2016: 9-13%), based on the Group’s weighted average cost
of capital, adjusted for the estimated programme risk, for example taking account of whether or not the forecast cash flows arise from contracted business.
No impairment is required on this basis. However, a combination of adverse changes in assumptions (e.g. market size and share, unit costs and programme delays) and other variables (e.g. discount rate and foreign exchange rates), could result in impairment in future years. In making this assessment, the Directors noted that the adoption of IFRS 15 on 1 January 2018 would result in the derecognition of contractual aftermarket rights of £873m, which will itself significantly reduce the risk of impairment on other intangible assets.
9 Property, plant and equipment
Land and buildings
£m
Plant and equipment
£m
Aircraft and engines
£m
In course of construction
£m Total
£m
Cost:
At 1 January 2017 1,667 4,599 491 765 7,522
Exchange differences (18) (61) (5) (11) (95)
Additions – purchased 36 155 127 446 764
Additions arising from TotalCare Flex arrangements (non-cash) – – 1 – 1
Acquisition of business 74 155 28 11 268
Consolidation of previously non-consolidated subsidiary 9 1 – – 10
Reclassifications 92 308 29 (429) –
Transferred to assets held for sale (5) (11) – – (16)
Disposals/write-offs (13) (111) (4) (9) (137)
Adjustment 1 – – 20 – 20
At 31 December 2017 1,842 5,035 687 773 8,337
Accumulated amortisation:
At 1 January 2017 515 2,765 126 2 3,408
Exchange differences (9) (32) (1) – (42)
Charge for the year 58 351 35 – 444
Impairment 3 3 – – 6
Reclassifications (7) 7 – – –
Transferred to assets held for sale (3) (10) – – (13)
Disposals/write-offs (3) (100) (1) – (104)
Adjustment 1 – – 14 – 14
At 31 December 2017 554 2,984 173 2 3,713
Net book value at: 31 December 2017 1,288 2,051 514 771 4,624
31 December 2016 1,152 1,834 365 763 4,114
1 Adjustment relates to industrial engines sold with the Energy business in 2014.
10 Financial assets and liabilities
Other financial assets and liabilities comprise:
Derivatives
Foreign exchange contracts
£m
Commodity contracts
£m
Interest rate
contracts £m
Total Derivatives
£m
Financial RRSAs
£m
TotalCare Flex £m
C Shares £m
Total £m
2017
Non-current assets 362 16 232 610 – – – 610
Current assets 27 9 – 36 – – – 36
Current liabilities (493) (10) – (503) (50) – (28) (581)
Non-current liabilities (2,208) (14) (5) (2,227) (194) (14) – (2,435)
(2,312) 1 227 (2,084) (244) (14) (28) (2,370)
2016
Non-current assets 13 5 364 382 – – – 382
Current assets 4 1 – 5 – – – 5
Current liabilities (566) (24) – (590) (33) – (28) (651) Non-current liabilities (5,002) (38) (6) (5,046) (68) (15) – (5,129)
(5,551) (56) 358 (5,249) (101) (15) (28) (5,393)

49
Derivative financial instruments 2017 2016 1
Foreign exchange
£m Commodity
£m
Interest rate £m
Total £m
Total £m
At 1 January (5,551) (56) 358 (5,249) (1,731)
Currency options at inception – – – – (33)
Acquisition of business 7 2 – 9
Movements in fair value hedges 2 – – (131) (131) 345
Movements in other derivative contracts 3 2,611 37 – 2,648 (4,420)
Contracts settled 621 18 – 639 590
At 31 December (2,312) 1 227 (2,084) (5,249) 1 In 2016, the Group wrote currency options to sell USD and buy GBP as part of a commercial agreement. The fair value of this option on inception was treated as a
discount to the customer. 2 Loss on related hedged items £131m (2016: £343m loss).
3 Include in financing.
Financial risk and revenue sharing arrangements (RRSAs) and other financial liabilities Financial RRSAs TotalCare Flex
2017 £m
2016 £m
2017 £m
2016 £m
At 1 January (101) (110) (15) –
Exchange adjustments included in OCI (14) 5 – – Acquisition of business (157) – – –
Additions – – – (14)
Financing charge 1 (5) (6) – (1)
Excluded from underlying profit:
Changes in forecast payments 1 1 5
Exchange adjustments 1 10 (13) 1 (3)
Cash paid to partners 22 18 Other – – – 3
At 31 December (244) (101) (14) (15)
1 Included in net financing.
Fair values of financial instruments equate to book values with the following exceptions:
2017 2016
Book value Fair value Book value Fair value £m £m £m £m
Borrowings (3,488) (3,557) (3,357) (3,413)
Financial RRSAs (244) (247) (101) (109)
Fair values The fair value of a financial instrument is the price at which an asset could be exchanged, or a liability settled, between knowledgeable, willing parties in an arms-length transaction. Fair values have been determined with reference to available market information at the balance sheet date, using the methodologies described below.
Unlisted non-current investments primarily comprise bank deposits where the fair value approximates to the book value.
The fair values of trade receivables and payables, other non-derivative financial assets and liabilities, short-term investments and cash and cash equivalents are assumed to approximate to cost either due to the short-term maturity of the instruments or because the interest rate of the investments is reset after periods not exceeding six months.
Fair values of derivative financial assets and liabilities are estimated by discounting expected future contractual cash flows using prevailing interest rate curves. Amounts denominated in foreign currencies are valued at the exchange rate prevailing at the balance sheet date. These financial instruments are included on the balance sheet at fair value, derived from observable market prices (Level 2 as defined by IFRS 13 Fair Value Measurement).
Borrowings are carried at amortised cost. The fair value is estimated by discounting contractual future cash flows (Level 2 as defined by IFRS 13 Fair Value Measurement).
Financial RRSAs and TotalCare Flex liabilities are carried at amortised cost. The fair value is estimated by discounting contractual future cash flows. Contractual cash flows are based on future trading activity, based on latest forecasts. Amounts denominated in foreign currencies are valued at the exchange rate prevailing at the balance sheet date (Level 3 as defined by IFRS 13 Fair Value Measurement).
Borrowings During the year, the Group has repaid £166m of short-term borrowings and entered into new facilities of £366m.

50
11 Pensions and other post-retirement benefits
Movements in the net post-retirement position recognised in the balance sheet were as follows:
UK schemes Overseas schemes Total
£m £m £m
At 1 January 2017 1,336 (1,365) (29)
Exchange adjustments – 25 25
Current service cost and administrative expenses (190) (58) (248)
Past service credit/(cost) 8 – 8
Financing recognised in the income statement 38 (37) 1
Contributions by employer 174 75 249
Actuarial gains/(losses) recognised in OCI 1 477 (64) 413
Returns on plan assets excluding financing recognised in OCI 1 265 57 322
Other – (3) (3)
At 31 December 2017 2,108 (1,370) 738
Analysed as:
Post-retirement scheme surpluses - included in non-current assets 2,108 17 2,125
Post-retirement scheme deficits - included in non-current liabilities – (1,387) (1,387)
2,108 (1,370) 738
1 The net actuarial gains in the UK arose principally due to changes in the yield curves used to value the assets and the liabilities.
12 Contingent liabilities
In January 2017, after full cooperation, the Company concluded deferred prosecution agreements with the SFO and the US Department of Justice and a leniency agreement with the MPF, the Brazilian federal prosecutors. Prosecutions of individuals may follow and enforcement action may be taken by other authorities. In addition, we could still be affected by actions from customers and customers’ financiers. The Directors are not currently aware of any matters that are likely to lead to a financial loss, but cannot anticipate all the possible actions that may be taken or their potential consequences.
In connection with the sale of its products the Group will, on some occasions, provide financing support for its customers – generally in respect of civil aircraft. The Group’s commitments relating to these financing arrangements are spread over many years, relate to a number of customers and a broad product portfolio and are generally secured on the asset subject to the financing. These include commitments of US$3.3bn (2016: US$3.2bn) (on a discounted basis) to provide borrowing facilities to enable customers to purchase aircraft (of which approximately US$390m (on a discounted basis) could be called during 2018).
These facilities may only be used if the customer is unable to obtain financing elsewhere and are priced at a premium to the market rate. Consequently the Directors do not consider that there is a significant exposure arising from the provision of these facilities.
Commitments on delivered aircraft in excess of the amounts provided are shown in the table below. These are reported on a discounted basis at the Group’s borrowing rate to reflect better the time span over which these exposures could arise. These amounts do not represent values that are expected to crystallise. The commitments are denominated in US dollars. As the Group does not generally adopt cash flow hedge accounting for future foreign exchange transactions, this amount is reported, together with the sterling equivalent at the reporting date spot rate. The values of aircraft providing security are based on advice from a specialist aircraft appraiser.
31 December 2017 31 December 2016
£m $m £m $m
Gross commitments 145 196 238 293
Value of security 1 (41) (55) (103) (126)
Indemnities (51) (69) (74) (91)
Net commitments 53 72 61 76
Net commitments with security reduced by 20% 2 64 86 86 106
1 Security includes unrestricted cash collateral of: 22 29 38 47
2 Although sensitivity calculations are complex, the reduction of the relevant security by 20% illustrates the sensitivity to changes in this assumption.
Contingent liabilities exist in respect of guarantees provided by the Group in the ordinary course of business for product delivery, performance and reliability. The Group has, in the normal course of business, entered into arrangements in respect of export finance, performance bonds, countertrade obligations and minor miscellaneous items. Various Group undertakings are parties to legal actions and claims which arise in the ordinary course of business, some of which are for substantial amounts. As a consequence of the insolvency of an insurer as previously reported, the Group is no longer fully insured against known and potential claims from employees who worked for certain of the Group’s UK based businesses for a period prior to the acquisition of those businesses by the Group. While the outcome of some of these matters cannot precisely be foreseen, the Directors do not expect any of these arrangements, legal actions or claims, after allowing for provisions already made, to result in significant loss to the Group.

51
13 Related party transactions
Transactions with related parties are shown in note 24 of the 2017 Annual Report. Significant transactions in the current financial period are as follows:
2017 2016 £m £m
Sales of goods and services to joint ventures and associates 2,469 2,022
Purchases of goods and services from joint ventures and associates (2,224) (1,881)
Included in sales of goods and services to joint ventures and associates are sales of spare engines amounting to £418m (2016: £356m).
Profit recognised in the year on such sales amounted to £75m (2016: £119m), including profit on current year sales and recognition
of profit deferred on similar sales in previous years. On an underlying basis (at actual achieved rates on settled derivative transactions), the amounts were £67m (2016: £97m).
14 Acquisition
On 19 December 2017, the Group completed the acquisition of the 53.1% of the shares of Industria de Turbo Propulsores SA (ITP Aero) owned by SENER Grupo de Ingenieria SA (SENER) which it did not already own.
The consideration of €718m is payable in eight quarterly instalments, commencing on 15 January 2018. At the Group’s election, each instalment may be settled in either cash or Rolls-Royce Holdings plc shares. If the consideration is in shares, a 3% premium is applied. Interest is accrued on the outstanding balance based on LIBOR + 1.5%.
The fair value of the previous joint venture investment in ITP Aero of £204m was re-measured using a discounted cash flow methodology using judgement in estimating future cash flows, assessing the discount rate and establishing a non-controlling interest discount. This gave rise to a gain of £553m.
Given the proximity of the acquisition to the year end and as permitted by IFRS 3 Business Combinations, the fair value of acquired identifiable assets and liabilities have been presented on a provisional basis. Fair values were determined on the basis of an initial assessment performed by an independent professional expert prior to the acquisition date. Measurement techniques and estimation of future cash flows have been used to assess the value of the intangible assets at the date of acquisition. The total fair value of acquired identifiable assets and liabilities is £1,650m of which a significant value was allocated to intangible assets. The valuation indicated a bargain purchase of £245m, which has been recognised in the income statement.
The acquisition of the controlling interest in ITP Aero on 19 December 2017 did not have a significant impact on the Group’s underlying results for the year.
Recognised amounts of identifiable assets acquired and liabilities assumed:
2017 £m
Intangible assets 1,417
Property, plant and equipment 268
Deferred tax assets 148
Inventory 316
Trade and other receivables 497
Taxation recoverable 2
Cash and cash equivalents 263
Trade and other payables (625)
Borrowings (34)
Other financial assets and liabilities (148)
Deferred tax liability (386)
Provisions (68)
Total identifiable assets and liabilities 1,650
Total consideration (1,405)
Bargain purchase gain arising 245
Consideration satisfied by:
Deferred consideration to be paid in cash or shares 648
Existing shareholding 757
1,405
Net cash outflow arising on acquisition:
Cash consideration –
Less: cash and cash equivalents acquired (263)
Cash inflow per the cash flow statement (263)
Identifiable intangible assets comprise:
Technology, patents and licences 245
Customer relationships 833
Trademark 44
In-process development 91
Other 204
1,417
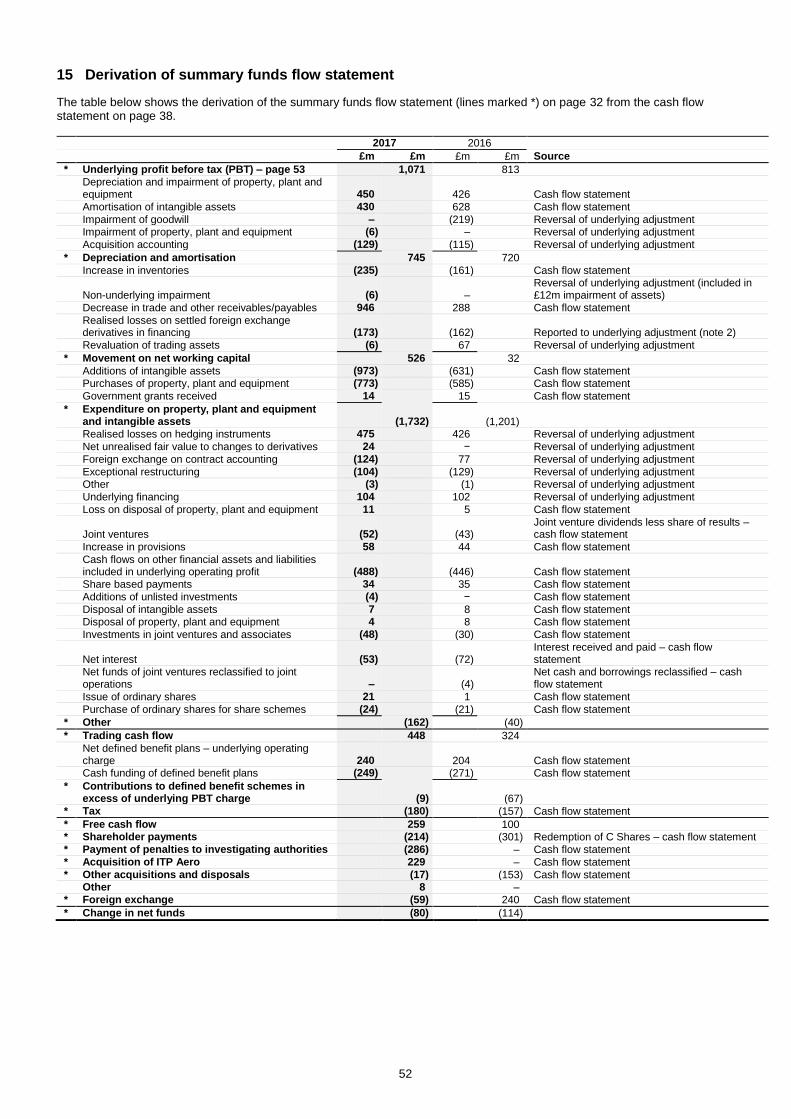
52
15 Derivation of summary funds flow statement
The table below shows the derivation of the summary funds flow statement (lines marked *) on page 32 from the cash flow statement on page 38.
2017 2016
£m £m £m £m Source
* Underlying profit before tax (PBT) – page 53 1,071
813
Depreciation and impairment of property, plant and equipment 450 426
Cash flow statement
Amortisation of intangible assets 430 628
Cash flow statement
Impairment of goodwill – (219) Reversal of underlying adjustment Impairment of property, plant and equipment (6) – Reversal of underlying adjustment
Acquisition accounting (129) (115)
Reversal of underlying adjustment
* Depreciation and amortisation 745
720
Increase in inventories (235) (161)
Cash flow statement
Non-underlying impairment (6) – Reversal of underlying adjustment (included in £12m impairment of assets)
Decrease in trade and other receivables/payables 946 288
Cash flow statement
Realised losses on settled foreign exchange derivatives in financing (173) (162)
Reported to underlying adjustment (note 2)
Revaluation of trading assets (6) 67
Reversal of underlying adjustment
* Movement on net working capital 526
32
Additions of intangible assets (973) (631)
Cash flow statement Purchases of property, plant and equipment (773) (585)
Cash flow statement
Government grants received 14 15 Cash flow statement
* Expenditure on property, plant and equipment and intangible assets (1,732)
(1,201)
Realised losses on hedging instruments 475 426
Reversal of underlying adjustment
Net unrealised fair value to changes to derivatives 24 −
Reversal of underlying adjustment
Foreign exchange on contract accounting (124) 77
Reversal of underlying adjustment
Exceptional restructuring (104) (129)
Reversal of underlying adjustment Other (3) (1)
Reversal of underlying adjustment
Underlying financing 104 102
Reversal of underlying adjustment
Loss on disposal of property, plant and equipment 11 5
Cash flow statement
Joint ventures (52) (43)
Joint venture dividends less share of results – cash flow statement
Increase in provisions 58 44
Cash flow statement
Cash flows on other financial assets and liabilities included in underlying operating profit (488) (446)
Cash flow statement
Share based payments 34 35
Cash flow statement
Additions of unlisted investments (4) − Cash flow statement
Disposal of intangible assets 7 8 Cash flow statement Disposal of property, plant and equipment 4 8
Cash flow statement
Investments in joint ventures and associates (48) (30)
Cash flow statement
Net interest (53) (72)
Interest received and paid – cash flow statement
Net funds of joint ventures reclassified to joint operations – (4)
Net cash and borrowings reclassified – cash flow statement
Issue of ordinary shares 21 1 Cash flow statement
Purchase of ordinary shares for share schemes (24) (21)
Cash flow statement
* Other (162)
(40)
* Trading cash flow 448
324
Net defined benefit plans – underlying operating charge 240 204
Cash flow statement
Cash funding of defined benefit plans (249) (271)
Cash flow statement
* Contributions to defined benefit schemes in excess of underlying PBT charge (9) (67)
* Tax (180)
(157) Cash flow statement
* Free cash flow 259
100 * Shareholder payments (214) (301) Redemption of C Shares – cash flow statement * Payment of penalties to investigating authorities (286) – Cash flow statement * Acquisition of ITP Aero 229 – Cash flow statement * Other acquisitions and disposals (17)
(153) Cash flow statement
Other 8 – * Foreign exchange (59)
240 Cash flow statement
* Change in net funds (80)
(114)

53
Free cash flow is a measure of financial performance of the business’s cash flow to see what is available for distribution among those stakeholders funding the business (including debt holders and shareholders). Free cash flow is calculated as trading cash flow less recurring tax and post-employment benefit expenses excluding capital expenditures and excludes payments made to shareholders, amounts spent (or received) on business acquisitions, exceptional restructuring costs and foreign exchange changes on net funds. The Board considers that free cash flow reflects cash generated from the Group’s underlying trading.
2017 2016
£m £m £m £m Source
Reported operating profit 1,287
44 Realised losses on hedging instruments (475) (426)
Reported to underlying adjustment (note 2)
Net unrealised fair value to changes to derivatives (24) − Reported to underlying adjustment (note 2) Foreign exchange on contract accounting 124 (77)
Reported to underlying adjustment (note 2)
Revaluation of trading assets and liabilities 6 (67)
Reported to underlying adjustment (note 2)
Effect of acquisition accounting 129 115
Reported to underlying adjustment (note 2) UK pension restructuring – 306 Reported to underlying adjustment (note 2)
Impairments 24 219 Reported to underlying adjustment (note 2)
Exceptional restructuring 104 129 Reported to underlying adjustment (note 2)
Accrual for deferred prosecution agreement penalties – 671 Reported to underlying adjustment (note 2) Other – 1 Reported to underlying adjustment (note 2)
Adjustments to reported operating profit (112) 871
Underlying profit before financing 1,175 915
Underlying financing (104) (102) Underlying income statement (note 2)
Underlying profit before tax 1,071
813
The table below shows a reconciliation of free cash flow to the change in cash and cash equivalents presented in the consolidated cash flow statement on page 38.
2017 2016
£m £m £m £m
Change in cash and cash equivalents 231 (691)
Returns to shareholders 214 301 Net cash flow from changes in borrowings and finance leases (200) 345 Increase/decrease in short-term investments – 1 Acquisition of business (263) 6
Consolidation of previously unconsolidated subsidiary (1) –
Increase in share in joint ventures – (154)
Debt of joint ventures reclassified as joint operations – (9) Disposal of other businesses – (7)
Changes in group structure (264) 144
Payment of deferred prosecution agreement penalties 286 –
Other (8) –
Free cash flow 259 100
Exclude cash outflow of ITP Aero 14 –
Free cash flow excluding ITP Aero 273 100
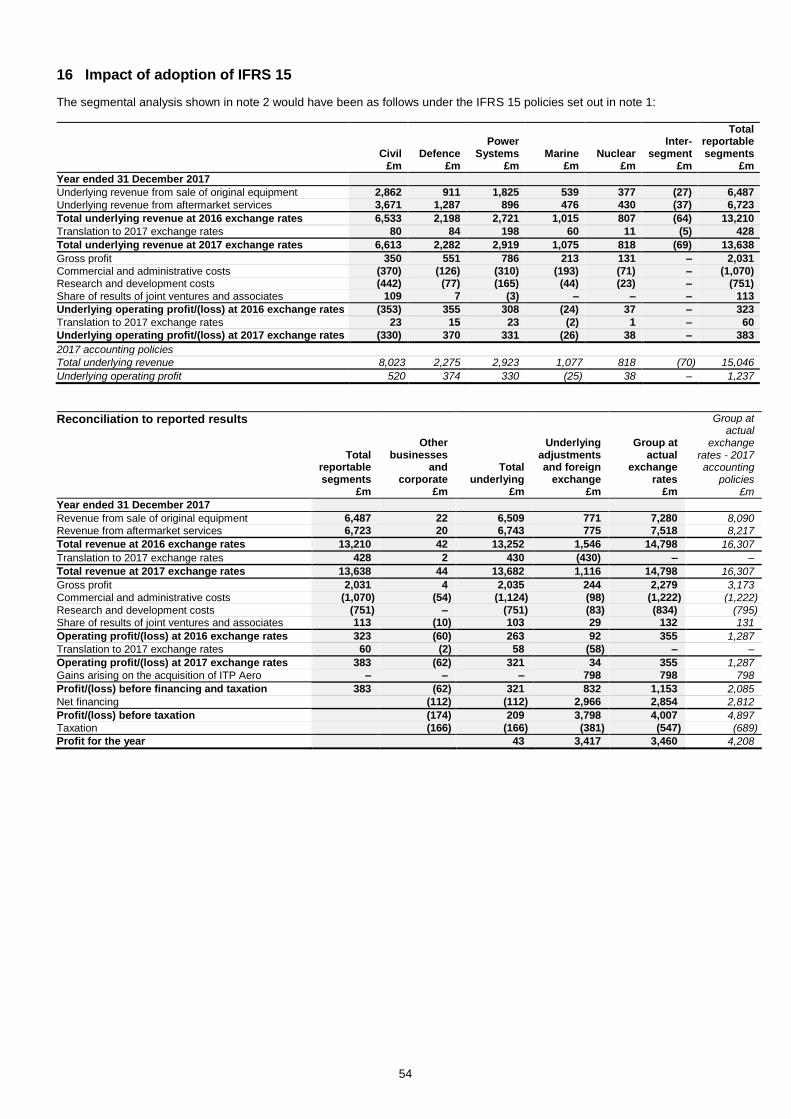
54
16 Impact of adoption of IFRS 15
The segmental analysis shown in note 2 would have been as follows under the IFRS 15 policies set out in note 1:
Civil Defence Power
Systems Marine Nuclear Inter-
segment
Total reportable segments
£m £m £m £m £m £m £m
Year ended 31 December 2017
Underlying revenue from sale of original equipment 2,862 911 1,825 539 377 (27) 6,487
Underlying revenue from aftermarket services 3,671 1,287 896 476 430 (37) 6,723
Total underlying revenue at 2016 exchange rates 6,533 2,198 2,721 1,015 807 (64) 13,210
Translation to 2017 exchange rates 80 84 198 60 11 (5) 428
Total underlying revenue at 2017 exchange rates 6,613 2,282 2,919 1,075 818 (69) 13,638
Gross profit 350 551 786 213 131 – 2,031
Commercial and administrative costs (370) (126) (310) (193) (71) – (1,070)
Research and development costs (442) (77) (165) (44) (23) – (751)
Share of results of joint ventures and associates 109 7 (3) – – – 113
Underlying operating profit/(loss) at 2016 exchange rates (353) 355 308 (24) 37 – 323
Translation to 2017 exchange rates 23 15 23 (2) 1 – 60
Underlying operating profit/(loss) at 2017 exchange rates (330) 370 331 (26) 38 – 383
2017 accounting policies
Total underlying revenue 8,023 2,275 2,923 1,077 818 (70) 15,046
Underlying operating profit 520 374 330 (25) 38 – 1,237
Reconciliation to reported results
Total reportable segments
Other businesses
and corporate
Total underlying
Underlying adjustments and foreign
exchange
Group at actual
exchange rates
Group at actual
exchange rates - 2017 accounting
policies £m £m £m £m £m £m
Year ended 31 December 2017
Revenue from sale of original equipment 6,487 22 6,509 771 7,280 8,090 Revenue from aftermarket services 6,723 20 6,743 775 7,518 8,217
Total revenue at 2016 exchange rates 13,210 42 13,252 1,546 14,798 16,307
Translation to 2017 exchange rates 428 2 430 (430) – –
Total revenue at 2017 exchange rates 13,638 44 13,682 1,116 14,798 16,307
Gross profit 2,031 4 2,035 244 2,279 3,173
Commercial and administrative costs (1,070) (54) (1,124) (98) (1,222) (1,222)
Research and development costs (751) – (751) (83) (834) (795) Share of results of joint ventures and associates 113 (10) 103 29 132 131
Operating profit/(loss) at 2016 exchange rates 323 (60) 263 92 355 1,287
Translation to 2017 exchange rates 60 (2) 58 (58) – –
Operating profit/(loss) at 2017 exchange rates 383 (62) 321 34 355 1,287
Gains arising on the acquisition of ITP Aero – – – 798 798 798
Profit/(loss) before financing and taxation 383 (62) 321 832 1,153 2,085
Net financing (112) (112) 2,966 2,854 2,812
Profit/(loss) before taxation (174) 209 3,798 4,007 4,897
Taxation (166) (166) (381) (547) (689)
Profit for the year 43 3,417 3,460 4,208
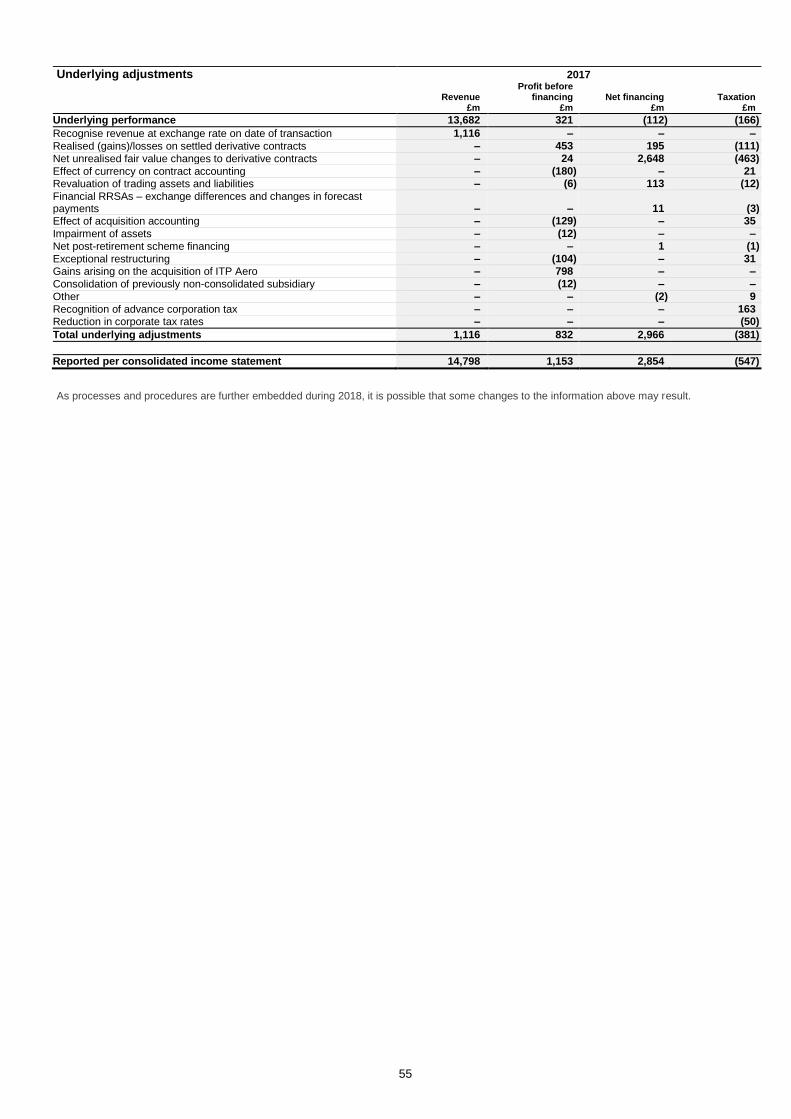
55
Underlying adjustments 2017
Revenue
£m
Profit before financing
£m Net financing
£m Taxation
£m
Underlying performance 13,682 321 (112) (166)
Recognise revenue at exchange rate on date of transaction 1,116 – – –
Realised (gains)/losses on settled derivative contracts – 453 195 (111)
Net unrealised fair value changes to derivative contracts – 24 2,648 (463)
Effect of currency on contract accounting – (180) – 21
Revaluation of trading assets and liabilities – (6) 113 (12)
Financial RRSAs – exchange differences and changes in forecast payments – – 11 (3)
Effect of acquisition accounting – (129) – 35
Impairment of assets – (12) – –
Net post-retirement scheme financing – – 1 (1)
Exceptional restructuring – (104) – 31
Gains arising on the acquisition of ITP Aero – 798 – –
Consolidation of previously non-consolidated subsidiary – (12) – –
Other – – (2) 9
Recognition of advance corporation tax – – – 163
Reduction in corporate tax rates – – – (50)
Total underlying adjustments 1,116 832 2,966 (381)
Reported per consolidated income statement 14,798 1,153 2,854 (547)
As processes and procedures are further embedded during 2018, it is possible that some changes to the information above may result.

56
Principal risks and uncertainties
The following table describes the principal risks facing the Group, notwithstanding that there are other risks that may occur and may impact the achievement of the Group’s objectives:
Risk or uncertainty and potential impact How we manage it
Disruptive technologies and business models
Disruptive technologies, new entrants with alternative business models or disruptions to key markets or customers could reduce our ability to sustainably win future business, achieve operating results and realise future growth opportunities.
• Horizon and emerging technology scanning and understanding our competitors, including patent searches.
• Investing in innovation and new technologies. • Focusing on enhancing our skills and capabilities to maintain our
technology leadership. • Forming strategic partnerships and conducting joint research programmes. • Establishing our digital business.
Competitive position
The presence of large, financially strong competitors in the majority of our markets means that the Group is susceptible to significant price pressure for original equipment or services even where our markets are mature or the competitors few. Our main competitors have access to significant government funding programmes as well as the ability to invest heavily in technology and industrial capability.
• Accessing and developing key technologies and service offerings which differentiate us competitively.
• Focusing on being responsive to our customers and improving the quality, delivery and reliability of our products and services.
• Partnering with others effectively. • Driving down cost and improving margins. • Protecting credit lines. • Investing in innovation, manufacturing and production, and continuing
governance of technology programmes. • Maintaining a healthy balance sheet to enable access to cost-effective
sources of third party funding. • Understanding our competitors.
Major product programme delivery
Failure to deliver a major programme on time, within budget, to specification, or technical performance falling significantly short of customer expectations, or not delivering the planned business benefits, would have potentially significant adverse financial and reputational consequences, including the risk of impairment of the carrying value of the Group’s intangible assets and the impact of potential litigation.
• Major programmes are subject to Board approval. • Reviewing major programmes at levels and frequencies appropriate to
their criticality and performance, against key financial and non-financial deliverables and potential risks throughout the programmes lifecycle.
• Investing in facilities and people to minimise the level of disruption to our customers from Trent 1000 and Trent 900 in-service challenges and developing longer term solutions to these issues.
• Conducting technical audits at pre-defined points which are performed by a team that is independent from the programme.
• Requiring programmes to address the actions arising from reviews and audits and monitoring and controlling progress through to closure.
• Applying knowledge management principles to provide benefit to current and future programmes.
Product safety
The lives of people that our customers serve depend on the safety of our products wherever and whenever they operate them. Any failure to meet this expectation, or if our product causes significant environmental impact, would adversely affect our reputation and long-term sustainability.
• Ensuring a culture that puts safety first. • Applying our engineering design and validation process from initial design,
through production and into service. • Reviewing the scope and effectiveness of the Group’s product safety
policies to ensure that they operate to the highest industry standards. • Operating a safety management system (SMS), governed by the product
safety review board, and subject to continual improvement based on experience and industry best practice. Product safety training is an integral part of our SMS.
• Improving our supply chain quality.
Talent and capability
Inability to attract and retain the critical capabilities and skills needed in sufficient numbers to effectively organise, deploy and incentivise our people to deliver our strategies, business plans and projects.
• Attracting, rewarding and retaining the right people with the right skills globally in a planned and targeted way, including regular benchmarking of remuneration.
• Developing and enhancing organisational, leadership, technical and functional capability to deliver global programmes.
• Continuing a strong focus on individual development and succession planning.
• Proactively monitoring retirement in key areas and actively managing the development and career paths of our people with a special focus on employees with the highest potential.
• Embedding a lean, agile, high-performance culture that tightly aligns Group strategy with individual and team objectives.
• Retaining, incentivising and effectively deploying the critical capabilities, skills and people needed to deliver our strategic priorities, plans and projects whilst implementing the Group's major programme to transform its business, to be resilient and to act with pace and simplicity.
• Tracking engagement through our annual employee opinion survey and a commitment to drive year-on-year improvement to the employee experience and communications.

57
Risk or uncertainty and potential impact How we manage it
Business continuity
Breakdown of external supply chain or internal facilities that could be caused by destruction of key facilities, natural disaster (including those caused by climate change), regional conflict, financial insolvency of a critical supplier or scarcity of materials which would reduce the ability to meet customer commitments, win future business or achieve operational results.
• Continuing our investment in adequate capacity and modern equipment and facilities.
• Identifying and assessing points of weakness in our internal and external supply chain, our IT systems and the skills of our people.
• Selecting stronger suppliers, developing dual sources or dual capability. • Ensuring our suppliers are aware of the 2018 Registration, Evaluation,
Authorisation and restriction of Chemicals (REACH) deadline and conducting research on alternative materials.
• Crisis management exercises and testing site-level incident management and business recovery plans.
• Providing improved response to supply chain disruption through customer excellence centres.
IT vulnerability
Breach of cyber security causing controlled or critical data to be lost, made inaccessible, corrupted or accessed by unauthorised users.
• Implementing ‘defence in depth’ through deployment of multiple layers of software and processes including web gateways, filtering, firewalls, intrusion, advanced persistent threat detectors and integrated reporting.
• Running security and network operations centres. • Actively sharing cyber security information through industry, government
and security forums.
Market and financial shock
The Group is exposed to a number of market risks, some of which are of a macro-economic nature (e.g. foreign currency, oil price, rates) and some of which are more specific to the Group (e.g. liquidity and credit risks, reduction in air travel or disruption to other customer operations). Significant extraneous market events could also materially damage the Group’s competitiveness and/or creditworthiness. This would affect operational results or the outcomes of financial transactions.
• Maintaining a strong balance sheet, through managing cash balances and debt levels.
• Providing financial flexibility by maintaining high levels of liquidity and an investment grade credit rating.
• Sustaining a balanced portfolio through earning revenue both from the sale of original equipment and aftermarket services, providing a broad product range and addressing diverse markets that have differing business cycles.
• Deciding where and what currencies to source in, and where and how much credit risk is extended or taken. The Group has a number of treasury policies that are designed to hedge residual risks using financial derivatives (foreign exchange, interest rates and commodity price risk).
• Review debt financing and hedging in light of volatility in external financial markets caused by external events, such as Brexit or other geopolitical changes.
Political risk
Geopolitical factors that lead to an unfavourable business climate and significant tensions between major trading parties or blocs which could impact the Group’s operations. Examples include: explicit trade protectionism, differing tax or regulatory regimes, potential for conflict or broader political issues.
• Where possible, locating our facilities and supply chain in countries with a low level of political risk and/or ensuring that we maintain dual capability.
• Diversifying global operations to avoid excessive concentration of risks in particular areas.
• The Group’s businesses and its strategic marketing network proactively monitoring local situations.
• Maintaining a balanced business portfolio with high barriers to entry and a diverse customer base.
• Proactively influencing regulation where it affects us. • Steering Committee to co-ordinate activities across the Group and
minimise the impact of Brexit.
Compliance
Non-compliance by the Group with legislation, the terms of the deferred prosecution agreements or other regulatory requirements in the heavily regulated environment in which it operates (e.g. export controls; use of controlled chemicals and substances; and anti-bribery and corruption legislation) compromising the ability to conduct business in certain jurisdictions and exposing the Group to potential: reputational damage; financial penalties; debarment from government contracts for a period of time; and/or suspension of export privileges (including export credit financing), each of which could have a material adverse effect.
• Taking an uncompromising approach to compliance. • Operating an extensive compliance programme. This programme and the
Global Code of Conduct are disseminated throughout the Group and are updated from time to time to ensure their continued relevance, and to ensure that they are complied with, both in spirit and to the letter. The Global Code of Conduct and the Group’s compliance programme are supported by appropriate training.
• Strengthening of the ethics, anti-bribery and corruption, compliance and export control teams.
• A legal team is in place to manage any ongoing regulatory investigations. • Engaging with external regulatory authorities. • Implementing a comprehensive REACH compliance programme. This
includes ensuring that we and our supply chain are covered by REACH authorisations for a number of chemicals needed for our products, establishing appropriate data systems and processes and working with our suppliers, customers and trade associations.
Annual General Meeting
All holders of ordinary shares may attend the Company’s AGM at which the Chairman and Chief Executive present a review of the key business developments during the year. This year’s AGM will be held at 11.00am on Thursday 3 May 2018 at the Pride Park Stadium, Pride Park, Derby, DE24 8XL. Shareholders can ask questions of the Board on the matters put to the meeting, including the Annual Report and the running of the Company generally. All Directors are invited to attend each AGM. Unless unforeseen circumstances arise, all committee chairmen will be present to take questions at the AGM.

58
Payments to shareholders
The Company issues non-cumulative redeemable preference shares (C Shares) as an alternative to paying a cash dividend.
Shareholders can choose to:
• redeem all C Shares for cash; • redeem all C Shares for cash and reinvest the proceeds in the C Share Reinvestment Plan (CRIP); or • keep the C Shares.
The CRIP is operated by Computershare Investor Services PLC (the Registrar). The Registrar will purchase ordinary shares in the market for shareholders electing to reinvest their C Share proceeds. Shareholders wishing to participate in the CRIP or redeem their C Shares in July 2018 must ensure that their instructions are lodged with the Registrar no later than 5:00pm on 1 June 2018 (CREST holders must submit their election in CREST before 3:00pm BST on 1 June 2017). Redemption will take place on 5 July 2018.
At the AGM, the Directors will recommend an issue of 71 C Shares with a total nominal value of 7.1p for each ordinary share. The C Shares will be issued on 2 July 2018 to shareholders on the register on 27 April 2018 and the final day of trading with entitlement to C Shares is 25 April 2018. Together with the interim issue on 3 January 2018 of 46 C Shares for each ordinary share with a total nominal value of 4.6p, this is the equivalent of a total annual payment to ordinary shareholders of 11.7p for each ordinary share.
Annual report and financial statements
The statements below have been prepared in connection with the Company’s full Annual Report for the year ended 31 December 2017. Certain parts thereof are not included in this announcement.
The Board have agreed to extend Brad Singer’s initial two-year appointment as a Non-Executive Director for a further three years. The Company and Brad Singer are party to a relationship agreement with ValueAct (a summary of which can be found on our website). That agreement will expire on 3 May 2018 but will be replaced with a new agreement covering treatment of confidential information and conflicts of interest only.
Going concern
The going concern assessment considers whether it is appropriate to prepare the financial statements on a going concern basis.
The Group meets its funding requirements through a mixture of shareholders’ funds, bank borrowings, bonds and notes. At 31 December 2017, the Group had borrowing facilities of £5.4bn and total liquidity of £5.1bn, including cash and cash equivalents of £3.0bn and undrawn facilities of £2.1bn. £82m of the facilities mature in 2018.
The Group’s forecasts and projections, taking into account reasonably possible changes in trading performance, show that the Group has sufficient financial resources. The Directors have reasonable expectations that the Company and the Group are well placed to manage business risks and to continue in operational existence for the foreseeable future (which accounting standards require to be at least a year from the date of this report) and have not identified any material uncertainties to the Company’s and the Group’s ability to do so.
On the basis described above, the Directors consider it appropriate to adopt the going concern basis in preparing the consolidated financial statements (in accordance with the Guidance on Risk Management, Internal Control and Related Financial and Business Reporting published by the Financial Reporting Council in September 2014).
Responsibility statements under the Disclosure Guidance and Transparency Rules
Each of the persons who is a Director at the date of approval of this report confirms that to the best of his or her knowledge:
i. each of the Group and parent company financial statements, prepared in accordance with IFRS and UK Accounting Standards respectively, gives a true and fair view of the assets, liabilities, financial position and profit or loss of the Company and the undertakings included in the consolidation taken as a whole;
ii. the Strategic Report and Directors’ Report include a fair review of the development and performance of the business and the position of the Company and the undertakings included in the consolidation taken as a whole, together with a description of the principal risks and uncertainties that they face; and
iii. the Annual Report, taken as a whole, is fair, balanced and understandable and provides the information necessary for shareholders to assess the Group’s position and performance, business model and strategy.
By order of the Board
Warren East Stephen Daintith Chief Executive Chief Financial Officer 6 March 2018 6 March 2018