7 elementary statistics hypothesis testing. introduction to hypothesis testing section 7.1
TRANSCRIPT

7
Elementary Statistics
Hypothesis Testing
Introduction to Hypothesis
Testing
Section 7.1
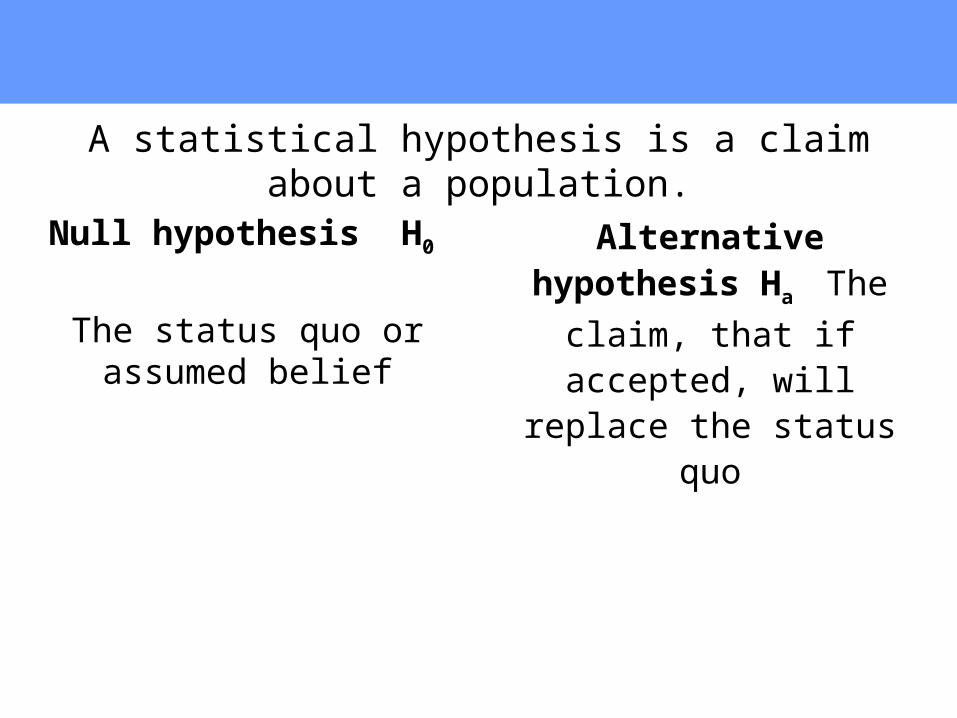
A statistical hypothesis is a claim about a population.
Alternative hypothesis Ha
The claim, that if accepted, will replace the status quo
Null hypothesis H0
The status quo or assumed belief

Write the claim about the population. Then, write its complement.
A hospital claims its ambulance response time is less than 10 minutes.
Writing Hypotheses
claim
assumed status quo
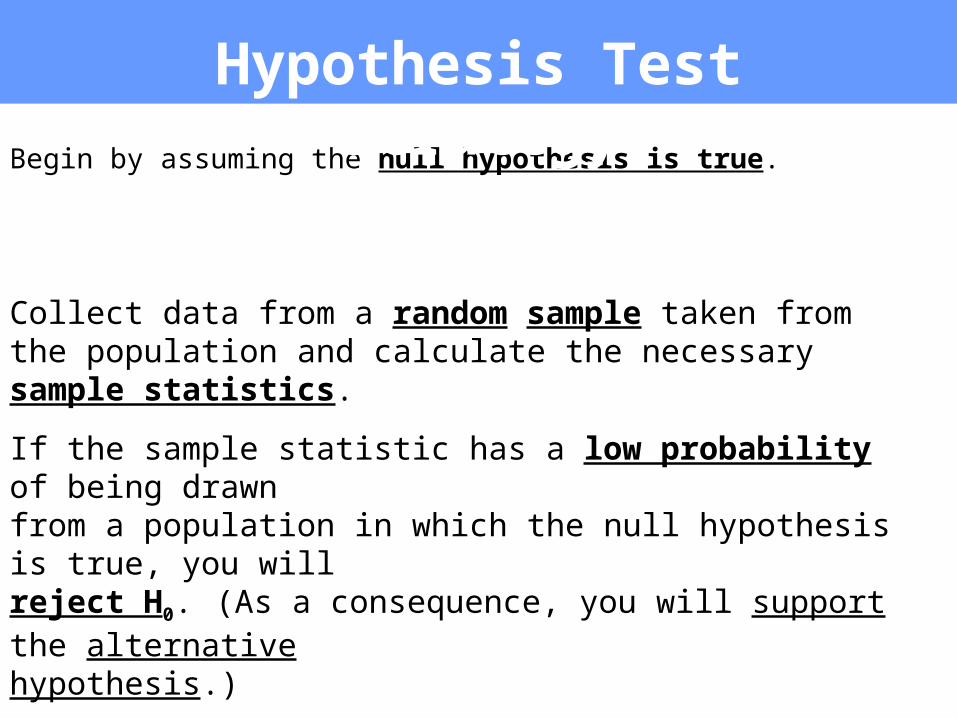
Begin by assuming the null hypothesis is true.
Hypothesis Test Strategy
Collect data from a random sample taken from the population and calculate the necessary sample statistics.
If the sample statistic has a low probability of being drawn from a population in which the null hypothesis is true, you willreject H0. (As a consequence, you will support the alternativehypothesis.)
If the probability is not low enough, fail to reject H0.

A type I error: Null hypothesis is actually true but the decision is to reject it.
Level of significance, Maximum probability of committing a type I error.
Actual Truth of H0
Errors and Level of Significance
H0 True H0 FalseDo notreject H0
Reject H0
CorrectDecision
CorrectDecision
Type IIError
Type IErrorD
ecis
ion

Right-tail test
Two-tail test
Left-tail test
Types of Hypothesis Tests
Ha is more probable
Ha is more probable
Ha is more probable
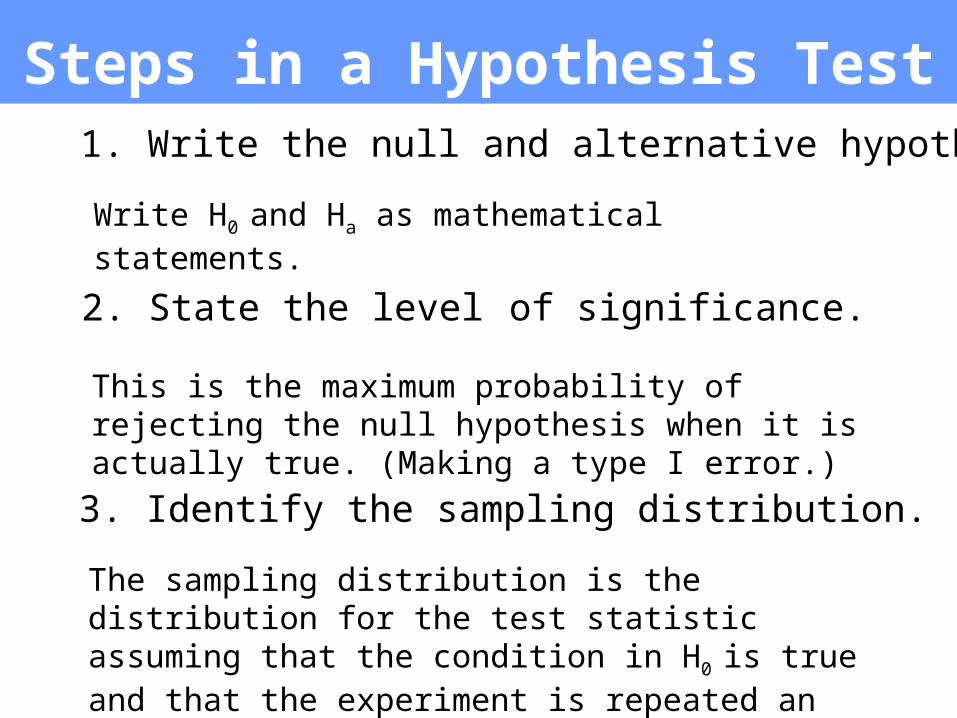
1. Write the null and alternative hypothesis.
2. State the level of significance.
3. Identify the sampling distribution.
Write H0 and Ha as mathematical statements.
This is the maximum probability of rejecting the null hypothesis when it is actually true. (Making a type I error.)
The sampling distribution is the distribution for the test statistic assuming that the condition in H0 is true and that the experiment is repeated an infinite number of times.
Steps in a Hypothesis Test

4. Find the test statistic and standardize it.
Perform the calculations to standardize your sample statistic.
5. Calculate the P-value for the test statistic.
This is the probability of obtaining your test statistic or one that is more extreme from the sampling distribution.
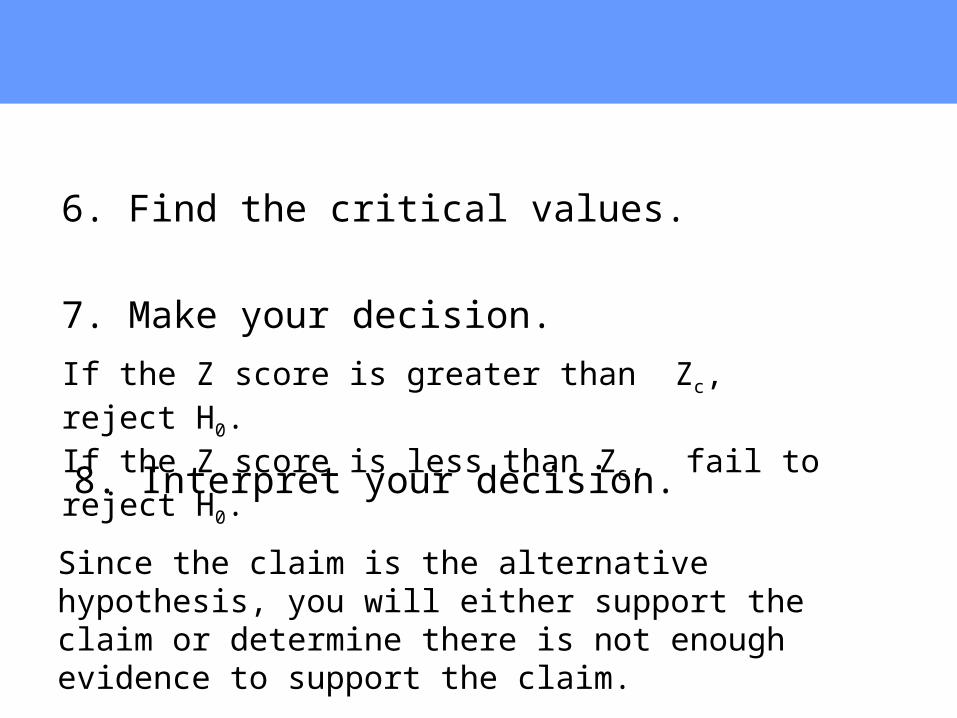
If the Z score is greater than Zc, reject H0. If the Z score is less than Zc, fail to reject H0.
7. Make your decision.
8. Interpret your decision.
Since the claim is the alternative hypothesis, you will either support the claim or determine there is not enough evidence to support the claim.
6. Find the critical values.
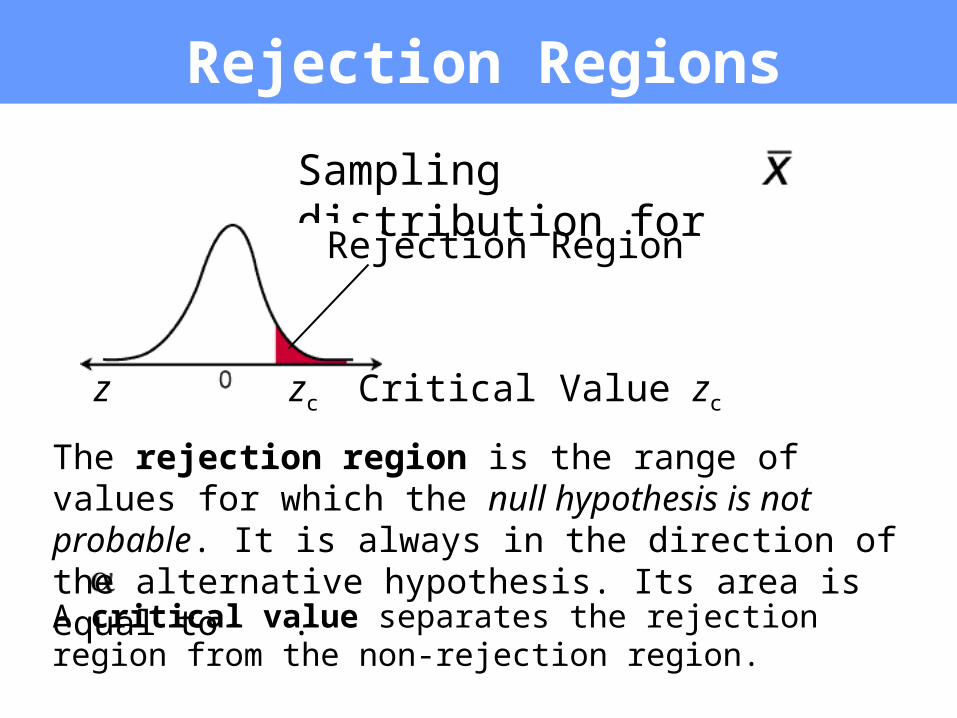
Sampling distribution for
The rejection region is the range of values for which the null hypothesis is not probable. It is always in the direction of the alternative hypothesis. Its area is equal to . A critical value separates the rejection region from the non-rejection region.
Rejection Regions
Rejection Region
Critical Value zcz zc
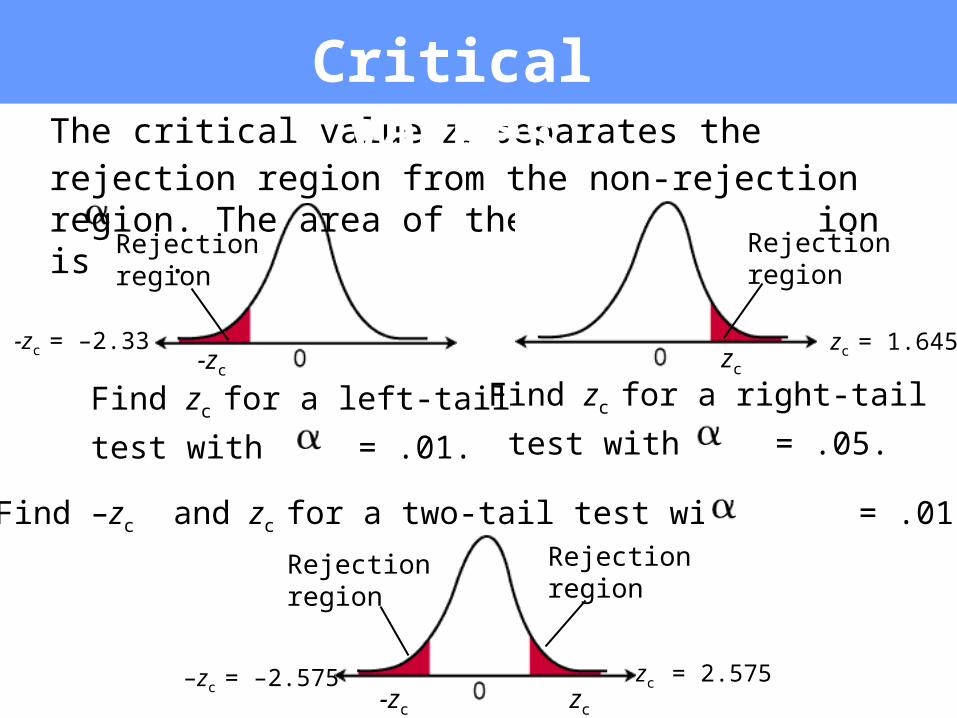
The critical value zc separates the rejection region from the non-rejection region. The area of the rejection region is .
Find zc for a left-tail
test with = .01.
Find zc for a right-tail
test with = .05.
Find –zc and zc for a two-tail test with = .01.
-zc = –2.33
zc = 2.575
zc = 1.645
Critical Values
-zc zc
Rejectionregion
Rejectionregion
zc-zc
Rejectionregion
Rejectionregion
–zc = –2.575
Hypothesis Testing for the
Mean (n 30)
Section 7.2
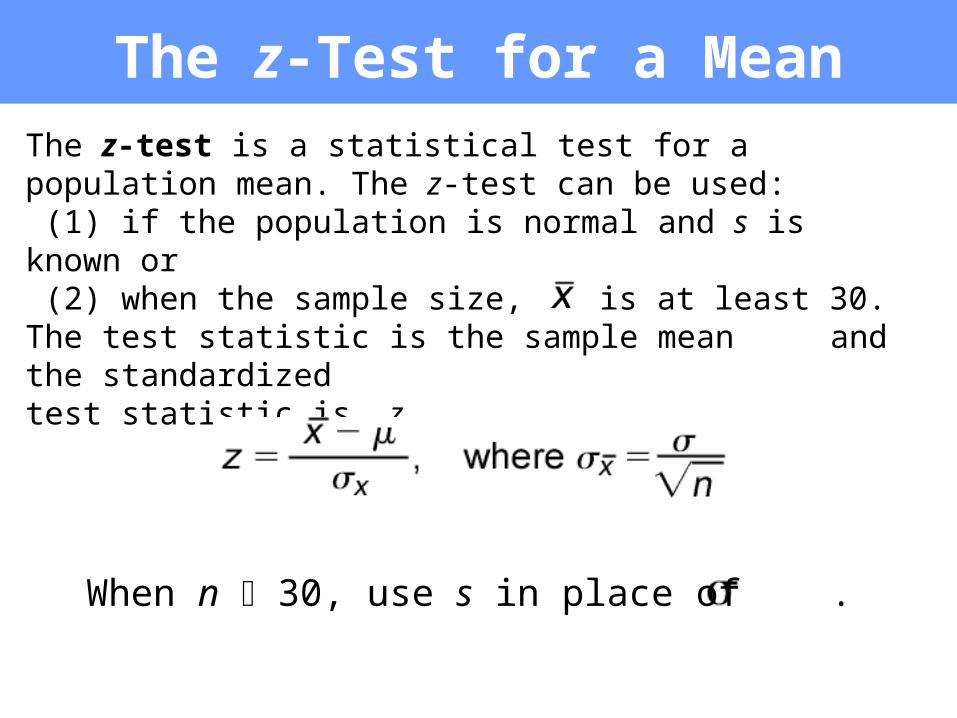
The z-Test for a MeanThe z-test is a statistical test for a population mean. The z-test can be used: (1) if the population is normal and s is known or (2) when the sample size, n, is at least 30. The test statistic is the sample mean and the standardizedtest statistic is z.
When n 30, use s in place of .

A health group claims the mean sodium content in one serving of a cereal is greater than 230 mg. You work for a national health service and are asked to test this claim. You find that a random sample of 52 servings has a mean sodium content of 232 mg and a standard deviation of 10 mg. At = 0.05, do you have enough evidence to accept the group’s claim?
1. Write the null and alternative hypothesis.
2. State the level of significance. = 0.05
3. Determine the sampling distribution.
Since the sample size is at least 30, the sampling distribution is normal.
The z-Test for a Mean (P-value)

4. Find the test statistic and standardize it.
5. Calculate the P-value for the test statistic.
Since this is a right-tail test, the P-value is the area found to the rightof z = 1.44 in the normal distribution. From the table P = 1 – 0.9251
n = 52
s = 10
Test statistic
z = 1.44
Area in right tail
P = 0.0749.

7. Make your decision.
8. Interpret your decision.
Rejectionregion
6. Find the critical values. Since Ha contains the > symbol, this is a right-tail test.
z = 1.44 < Zc = 1.645 thus does not fall in the rejection region, so fail to reject H0
There is not enough evidence to accept the group’s claim that there is greater than 230 mg of sodium in one serving of its cereal.
1.645Zc =
= 0.05 so find 0.0500 in the z table which corresponds to a Zc of 1.645
Hypothesis Testing for the
Mean (n < 30)
Section 7.3
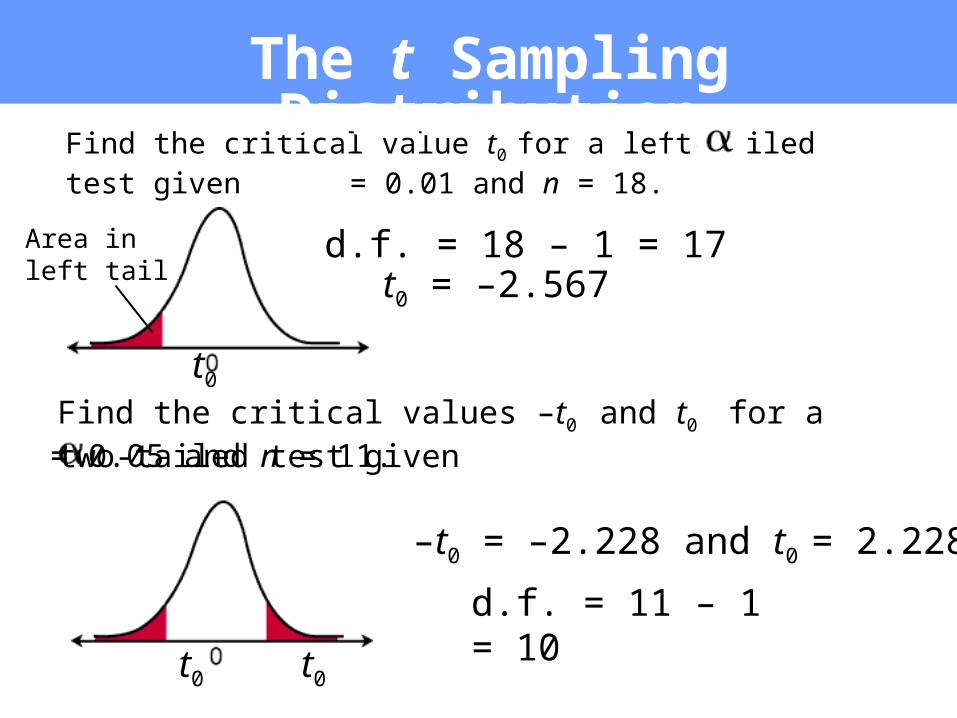
Find the critical value t0 for a left-tailed test given = 0.01 and n = 18.
Find the critical values –t0 and t0 for a two-tailed test given
d.f. = 18 – 1 = 17
t0
t0 = –2.567
d.f. = 11 – 1 = 10
–t0 = –2.228 and t0 = 2.228
The t Sampling Distribution
= 0.05 and n = 11.
Area inleft tail
t0 t0
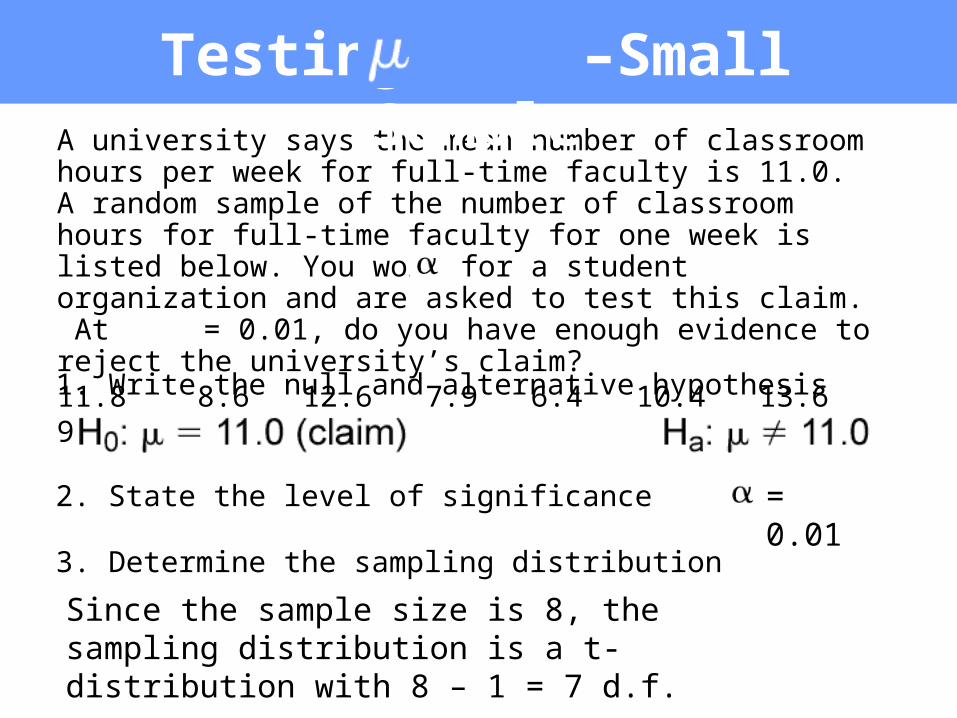
A university says the mean number of classroom hours per week for full-time faculty is 11.0. A random sample of the number of classroom hours for full-time faculty for one week is listed below. You work for a student organization and are asked to test this claim. At = 0.01, do you have enough evidence to reject the university’s claim?11.8 8.6 12.6 7.9 6.4 10.4 13.6 9.1
1. Write the null and alternative hypothesis
2. State the level of significance = 0.01
3. Determine the sampling distribution
Since the sample size is 8, the sampling distribution is a t-distribution with 8 – 1 = 7 d.f.
Testing –Small Sample

t = –1.08 does not fall in the rejection region, so fail to reject H0 at = 0.01
n = 8 = 10.050 s = 2.485
7. Make your decision.
6. Find the test statistic and standardize it
8. Interpret your decision.
There is not enough evidence to reject the university’s claim that faculty spend a mean of 11 classroom hours.
5. Find the rejection region.
Since Ha contains the ≠ symbol, this is a two-tail test.
4. Find the critical values.
–3.499 3.499t0–t0