7 approaches to achieving progressive growth in digital
DESCRIPTION
The Basics 1. Building up channels 2. Reporting Volume drivers 3. Programmatic Buying 4. Member Get Member Programs Advanced stuff 5. Data Management Platforms 6. Cross Platform 7. Growth HackingTRANSCRIPT

7 approaches for achieving progressive growth in digital marketing

Stream:20 Core Service Groupings
Digital Sales Planning
DigitalOrganisation
Digital SalesToolkit
Digital Sales Delivery
Optimising your business structure and skillsets for digital success
Ensuring the correct toolkits are implemented for success
Providing innovative strategic support and analysis to drive your digital sales function
Driving incremental revenue across Desktop/ Mobile/Tablet
The Performance-Driven Digital Marketing Consultancy We push up KPIs by rolling out good practice & best practice
London Munich San Francisco
Who we work with
Retail Finance
Gaming
Telecoms
Travel Entertainment
Publishing
Technology
Utilities
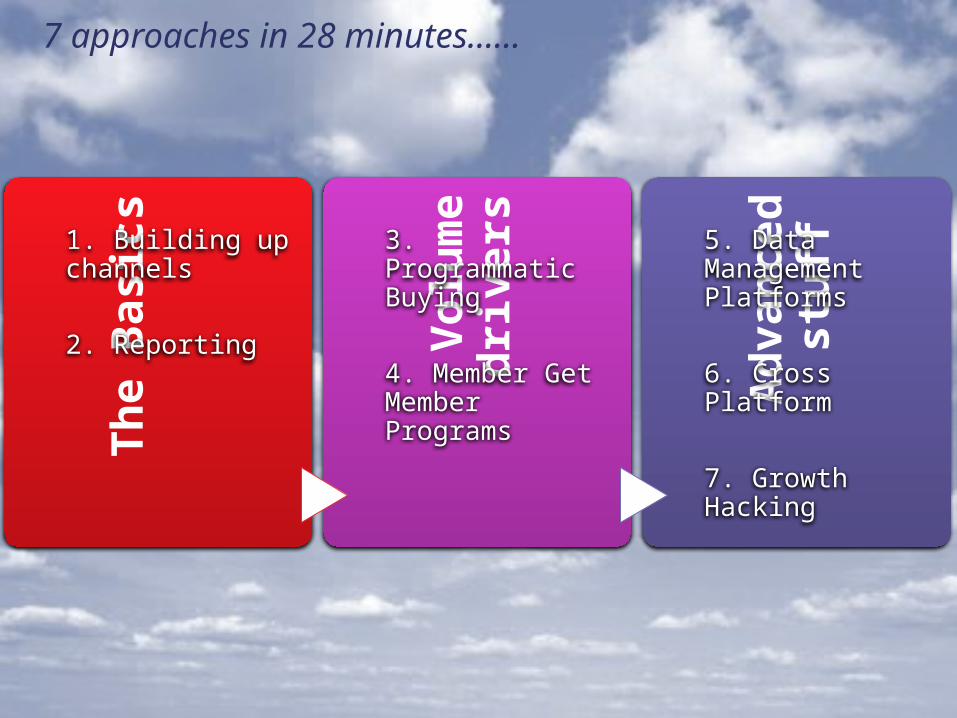
7 approaches in 28 minutes……Th
e Ba
sics
1. Building up channels
2. ReportingVo
lum
e dr
iver
s
3. Programmatic Buying
4. Member Get Member Programs
Adva
nced
stu
ff
5. Data Management Platforms
6. Cross Platform
7. Growth Hacking

The Basics

1. The Basics: Building up your channels
The Need• Proliferation of channels – range of different buying
channels
The Outcome• Measured growth that is cost effective
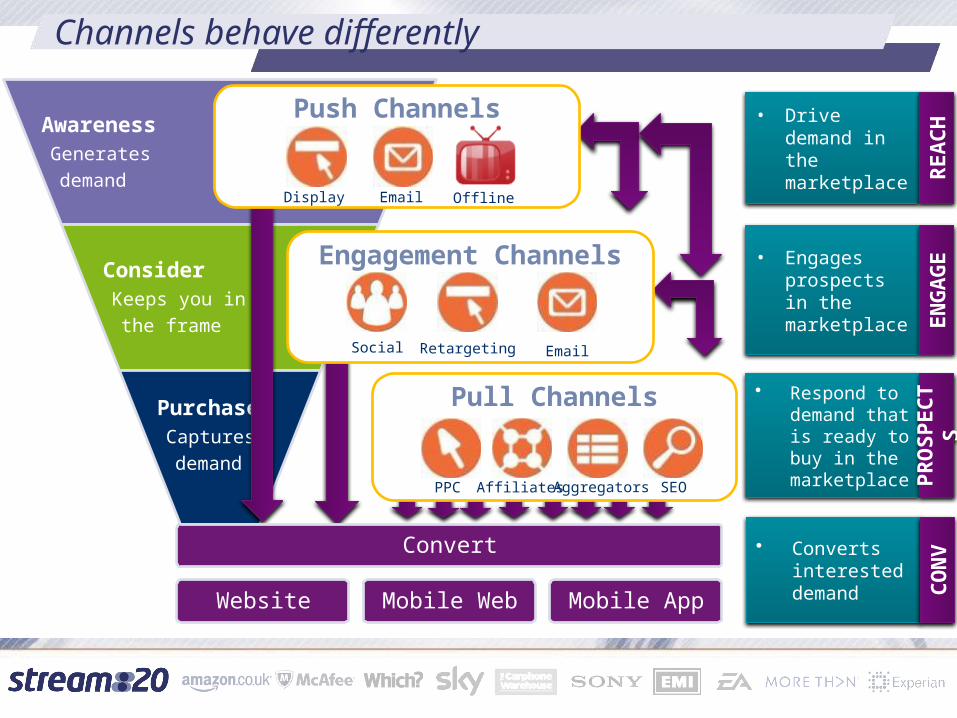
AwarenessGenerates
demand
ConsiderKeeps you in
the frame
PurchaseCaptures
demand
Push Channels
Display Email Offline
Pull Channels
AffiliatesPPC SEOAggregators
Engagement Channels
Social Retargeting Email
• Converts interested demand
• Respond to demand that is ready to buy in the marketplace
• Drive demand in the marketplace
• Engages prospects in the marketplace
REAC
HEN
GAG
EPR
OSP
ECTS
CON
V
Channels behave differently
Convert
Website Mobile Web Mobile App

Turning Strategy into Practice
Detailed, accurate best reporting in the business on the client side
Strong, accurate forecasting capability
Channel: Target visits Visits to Date Visits by DayVisits vs
TargetTarget signups
Signups to Date
Signups by Day
Signups vs Target
Signup Conv Section Conv Conv vs Target
Paid Search 563,301 1,185,983 110.5% 132,476 312,916 136.2% 26.4% 12.2%Affiliates 632,166 1,587,243 151.1% 2,074 5,272 154.3% 0.3% 1.3%SEO 417,329 954,296 128.7% 1,812 4,843 167.2% 0.5% 16.9%Display 454,357 1,155,815 154.4% 9,127 29,777 226.2% 2.6% 28.2%Email 776,018 1,606,959 107.1% 62,295 152,014 144.0% 9.5% 17.8%Social 59,408 134,579 126.5% 337 613 81.7% 0.5% -19.8%Direct 127,612 266,950 109.2% 13,218 37,882 186.6% 14.2% 37.0%Untracked 100,742 233,929 132.2% 924 2,772 199.9% 1.2% 29.2%Total 3,130,933 7,125,754 127.6% 444,525 546,089 22.8% 7.7% -46.0%
Adjust performance of each individual channel
Response (CTR) Conversion(CR)
Budget (Tenancy, CPM,
CPC, CPA)
Increase and decrease the share of sales of
each individual channel
Substitutional Incremental
Compare plans with Actuals
Year on year Month on Month
Forecast demand
Forecast response to
changed conditions

2. Basics: Reporting
The Need
The Outcome• Control:
– Exact understanding of why the numbers are up, why they are down– The ability to then act on those numbers
• People not knowing why sales are going up or why sales are going down• People saying they know where they are, when they don’t
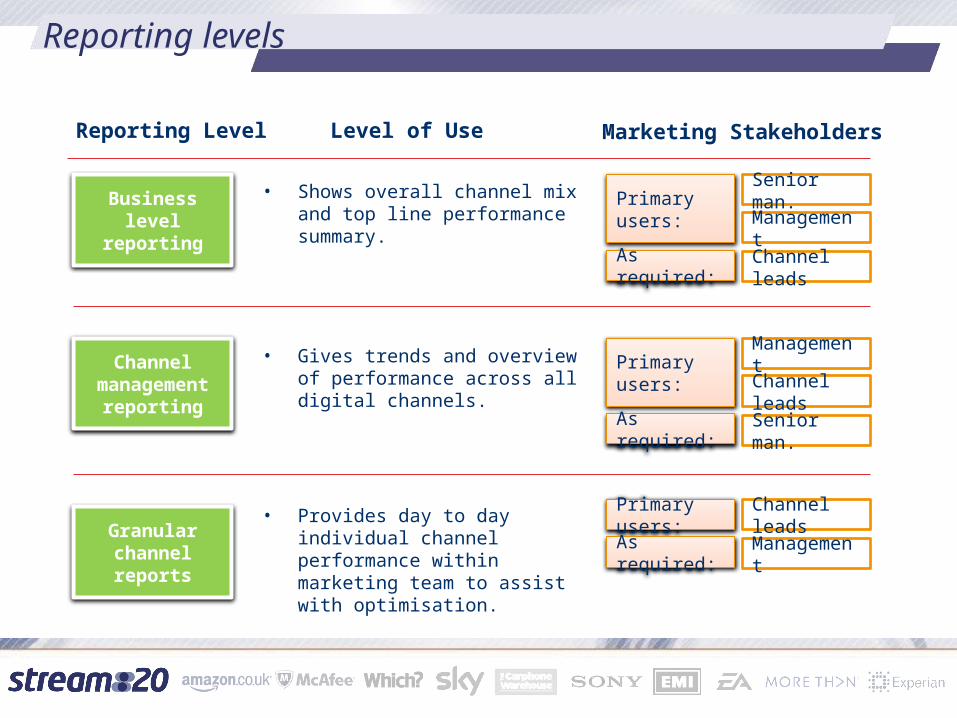
Granular channel reports
Channel management
reporting
Business level reporting
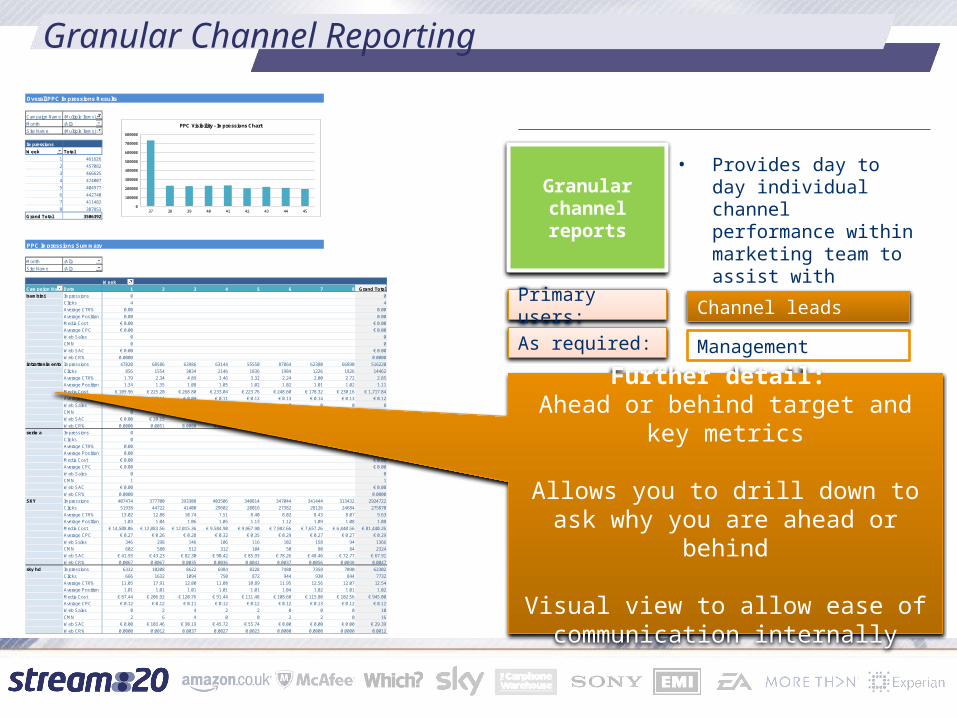
• Provides day to day individual channel performance within marketing team to assist with optimisation.
• Gives trends and overview of performance across all digital channels.
• Shows overall channel mix and top line performance summary.
Primary users: Channel leads
As required: Management
Primary users:Management
Channel leads
Primary users:Senior man.
As required: Channel leads
Management
Reporting Level Level of Use Marketing Stakeholders
As required: Senior man.
Reporting levels

Channel Management Reporting
Channel management
reporting
• Gives trends and overview of performance across all digital channels.
Primary users:Management
Channel leads
As required: Senior man.
Month To Date: Visits Target Visits to Date Channel % Visits by Day Visits vs Target Quote Target Quote to Date Channel % Quote by Day Quote vs Target Quote Conv Channel Conv Conv vs Target
Brand Display 4,995 5,302 1% 6.1% 1,479 12 0% -99.2% 0.2% -99.2%
Performance Display 108,168 118,226 13% 9.3% 1,357 941 1% -30.6% 0.8% -36.5%
Affiliates 27,976 52,829 6% 88.8% 5,994 33,676 22% 461.8% 63.7% 197.5%
PPC Brand 141,829 86,541 10% -39.0% 19,921 27,533 18% 38.2% 31.8% 126.5%
Direct 88,402 384,238 43% 334.6% 1,468 40,747 26% 2676.1% 10.6% 538.7%
PPC 141,665 123,732 14% -12.7% 11,356 21,037 14% 85.2% 17.0% 112.1%
SEO 15,610 91,496 10% 486.1% 632 14,416 9% 2179.9% 15.8% 289.0%
Social 527 39,703 4% 7433.4% 84 16,035 10% 19061.3% 40.4% 154.4%
Month to Date Total 529,171 902,067 70.5% 42,291 154,397 265.1% 17.1% 114.2%
Overarching view: Ahead or behind target and key
metrics for each channel
Visual and numerical
Granular Channel ReportingWeek On Week Campaign Performance Report
Overall PPC Impressions Results
Campaign Name (Multiple Items)
Month (All)
Site Name (Multiple Items)
Impressions
Week Total
1 461626
2 457082
3 466625
4 474007
5 404977
6 442740
7 411482
8 387853
Grand Total 3506392
Month (All)
Site Name (All)
Week
Campaign NameData 1 2 3 4 5 6 7 8 Grand Total
bambini Impressions 0 0
Clicks 4 4
Average CTR% 0.00 0.00
Average Position 0.00 0.00
Media Cost € 0.00 € 0.00
Average CPC € 0.00 € 0.00
Web Sales 0 0
CMN 0 0
Web SAC € 0.00 € 0.00
Web CR% 0.0000 0.0000
intrattenimento Impressions 47820 68586 63986 63144 55550 87864 62380 66890 516220
Clicks 856 1554 3034 2146 1836 1984 1226 1826 14462
Average CTR% 1.79 2.34 4.89 3.46 3.32 2.24 2.00 2.72 2.85
Average Position 1.34 1.35 1.08 1.05 1.02 1.02 1.01 1.02 1.11
Media Cost € 109.96 € 225.20 € 268.80 € 233.04 € 223.76 € 248.60 € 178.32 € 230.16 € 1,717.84
Average CPC € 0.13 € 0.14 € 0.09 € 0.11 € 0.12 € 0.13 € 0.14 € 0.13 € 0.12
Web Sales 0 8 0 0 0 0 0 0 8
CMN 0 12 2 0 0 2 0 0 16
Web SAC € 0.00 € 28.15 € 0.00 € 0.00 € 0.00 € 0.00 € 0.00 € 0.00 € 3.52
Web CR% 0.0000 0.0051 0.0000 0.0000 0.0000 0.0000 0.0000 0.0000 0.0006
serie a Impressions 0 0
Clicks 0 0
Average CTR% 0.00 0.00
Average Position 0.00 0.00
Media Cost € 0.00 € 0.00
Average CPC € 0.00 € 0.00
Web Sales 0 0
CMN 1 1
Web SAC € 0.00 € 0.00
Web CR% 0.0000 0.0000
SKY Impressions 407474 377700 393308 403506 340814 347044 341444 313432 2924722
Clicks 51938 44722 41400 29602 28016 27382 28126 24684 275870
Average CTR% 13.02 12.88 10.74 7.51 8.40 8.02 8.43 8.07 9.63
Average Position 1.03 1.04 1.06 1.05 1.13 1.12 1.09 1.08 1.08
Media Cost € 14,508.06 € 12,883.56 € 12,015.36 € 9,584.90 € 9,967.90 € 7,982.66 € 7,657.26 € 6,840.56 € 81,440.26
Average CPC € 0.27 € 0.26 € 0.28 € 0.32 € 0.35 € 0.29 € 0.27 € 0.27 € 0.29
Web Sales 346 298 146 106 116 102 158 94 1366
CMN 602 580 512 312 104 50 80 84 2324
Web SAC € 41.93 € 43.23 € 82.30 € 90.42 € 85.93 € 78.26 € 48.46 € 72.77 € 67.91
Web CR% 0.0067 0.0067 0.0035 0.0036 0.0041 0.0037 0.0056 0.0038 0.0047
sky hd Impressions 6332 10208 8622 6984 8228 7480 7358 7090 62302
Clicks 666 1632 1094 750 872 944 930 844 7732
Average CTR% 11.05 17.91 12.80 11.08 10.89 11.95 12.56 12.07 12.54
Average Position 1.01 1.01 1.01 1.01 1.01 1.04 1.02 1.01 1.02
Media Cost € 87.44 € 206.92 € 120.76 € 91.44 € 111.48 € 108.60 € 115.80 € 102.56 € 945.00
Average CPC € 0.12 € 0.12 € 0.11 € 0.12 € 0.12 € 0.12 € 0.13 € 0.12 € 0.12
Web Sales 0 2 4 2 2 0 0 0 10
CMN 2 6 4 0 0 2 2 0 16
Web SAC € 0.00 € 103.46 € 30.19 € 45.72 € 55.74 € 0.00 € 0.00 € 0.00 € 29.39
Web CR% 0.0000 0.0012 0.0037 0.0027 0.0023 0.0000 0.0000 0.0000 0.0012
PPC Impressions Summary
0
100000
200000
300000
400000
500000
600000
700000
800000
37 38 39 40 41 42 43 44 45
PPC Visibility - Impressions Chart
Granular channel reports
• Provides day to day individual channel performance within marketing team to assist with optimisation.
Primary users: Channel leads
As required: Management
Further detail: Ahead or behind target and key metrics
Allows you to drill down to ask why you are ahead or behind
Visual view to allow ease of communication internally

Volume Drivers - things that work
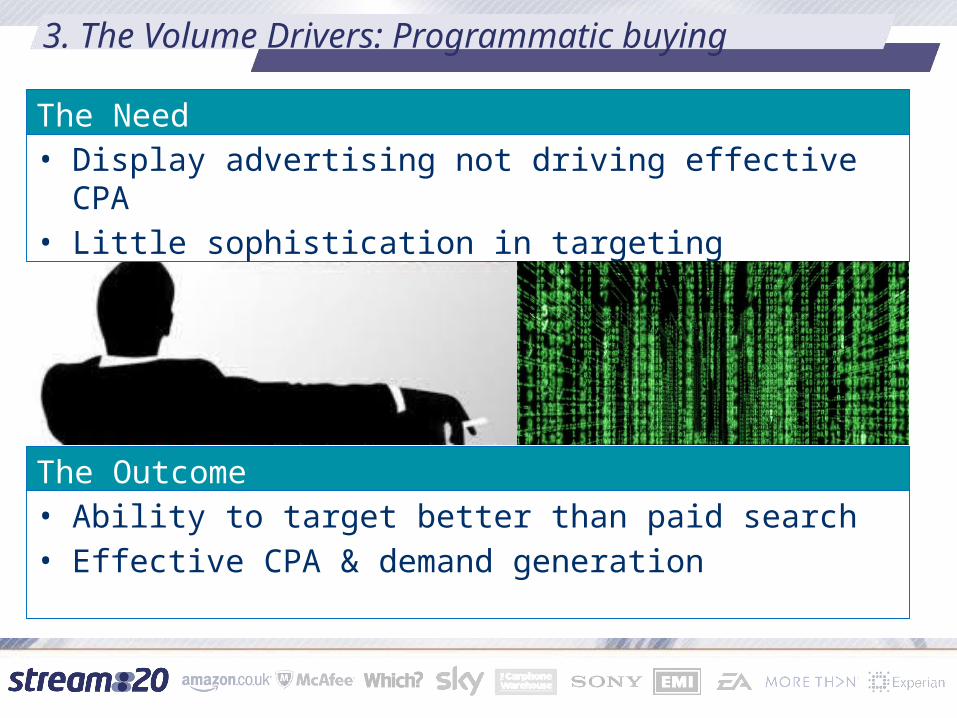
3. The Volume Drivers: Programmatic buying
The Need
The Outcome• Ability to target better than paid search• Effective CPA & demand generation
• Display advertising not driving effective CPA• Little sophistication in targeting

Audience
Supply Side Platforms
Ad Exchanges
Demand Side Platforms
How things have changed
DSP DSP DSP
SSP SSP SSP
Website Website Data Enrichment
Data enrichment
Ad
serv
ed
Advertiser
Audience
Website
Bulk Buy
Media Agency
I/O

Use Case: Audience Segments
16
Unknown Group
Data Driven – Offsite
Brand Aware No Clear Desire
Brand Aware Thinking of Buying
Price / Product Aware
Order Dropouts
• Unknown – no known tags, not meeting any other criteria
• Upper Segment Dropouts Able to target externally
• All other site visits
• Number of Visits / Recency / Time on Site / Brand Section
• Sales Section Visits
• Started Order Process – Not completed order process1
23456
Basic Retargeting
Segmented retargeting
Buying Audiences

4. The volume drivers: Member Get Member Programs
The Need
The Outcome• Channel shares up to 20% of sales• Multiplier on existing channels
• Constant pressure for brands to drive more sales• The most effective selling is peer to peer

MGM – End to End
Referrer (customer) Referee (prospect)
Reward receipt
Reward Receipt
Management Database
VerificationPropensity analysis
Customer Promotion
Referral Destination
Referral Message Landing
Page
Order Process Reward
confirm

Member referral schemes are purely incentive driven
Making MGM work• Requires someone
actively using the product
• Incentive needs to be no strings attached and high perceived value
• Most effective when advocates and proselytizers targeted

The Advanced stuff
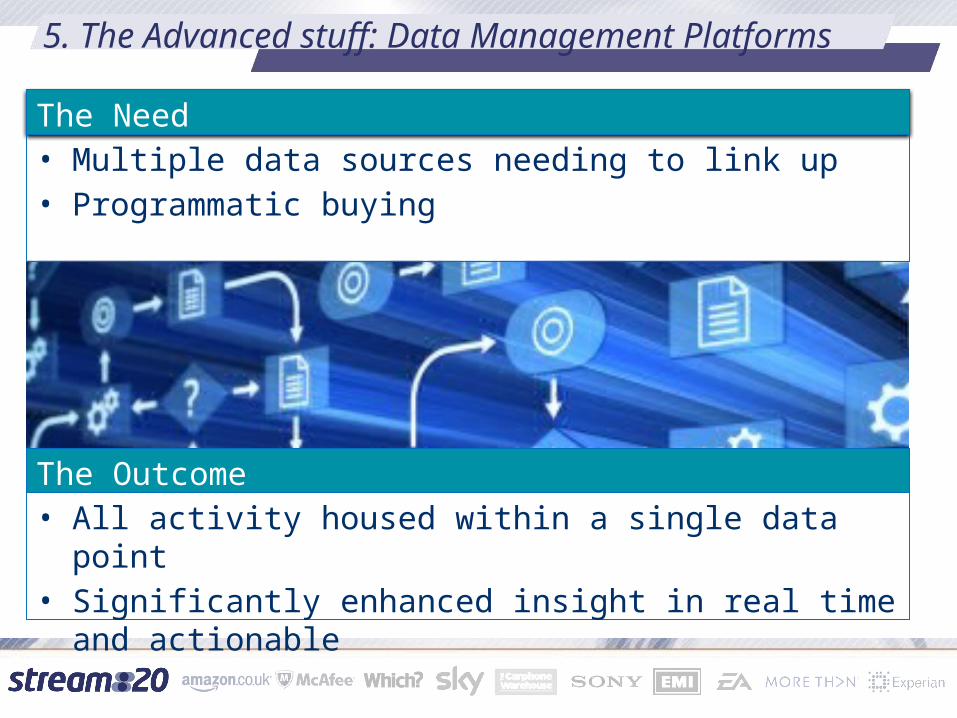
5. The Advanced stuff: Data Management Platforms
The Need• Multiple data sources needing to link up • Programmatic buying
The Outcome• All activity housed within a single data point• Significantly enhanced insight in real time and actionable

DMP – hierarchical overview
22
Site analytics
Email database
Search data
Ad Server data
CRM
CMS
Email campaigns
Display
Search
Mobile
Video
TV
Mobile
Intake
Analytics/InsightU
ser I
nter
face
Chan
nel L
inks
Normalisation
Segmentation/Scoring
Tag Management
Inputs Data Management Platform (DMP) Live Channels
A DMP conducts a multi-layered cookie sync between all your systems, typically through a piece of javascript called a container tag, which allows the DMP to sync its own cookie ID to the cookie IDs of whatever other systems you might be using.

6. The Advanced stuff: Cross Platform Marketing
The Need• 20%-50% of traffic is now mobile• Conversion is often up to 50% lower on mobile
The Outcome• Making mobile marketing viable and sales driving• Attribution across platforms

3 ecosystems with different dynamics
Enablers• Mobile conversion tracking• Mobile analytics• User segmentation > personalisation• Member get Member
APP ECOSYSTEM MOBILE WEB ECOSYSTEM PC ECOSYSTEM
Consider
Install
Usage
Push notifications
App stores
Pay-per-install networks
Pre-loads
Facebook App Install ads
Advertising solutions
Awareness
Consider
Purchase
Usage
Display
ContentOffline
Social Retargeting
EmailPPC
Affiliates
SEO
App recommendation sites
Awareness
Consider
Purchase
Usage
Display
ContentOffline
Social Retargeting
PPCAffiliates
SEO
Retargeting
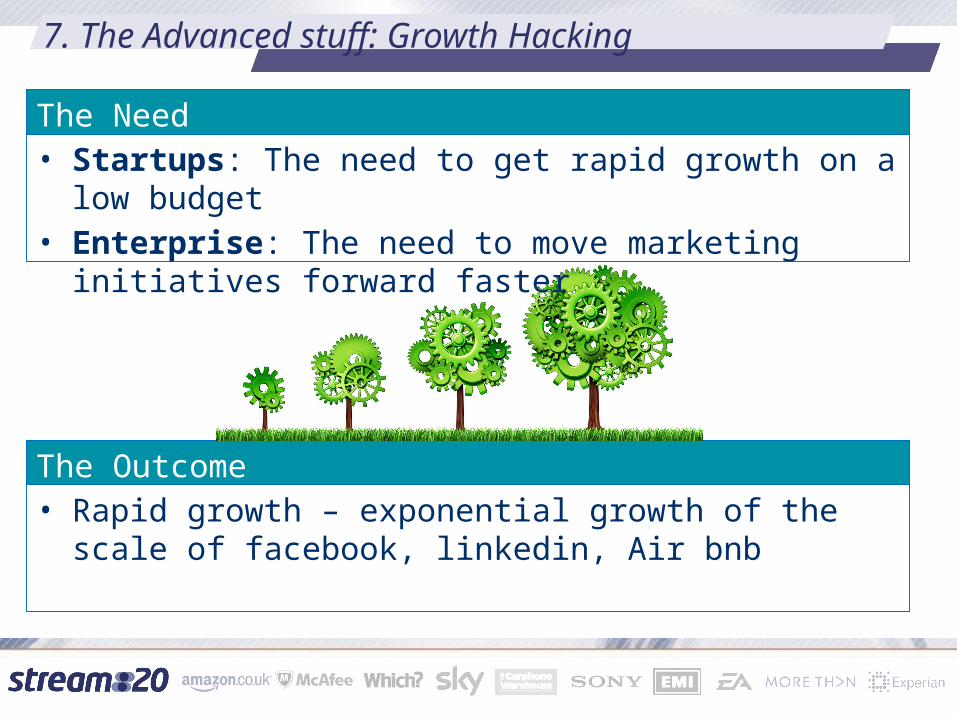
7. The Advanced stuff: Growth Hacking
The Need
The Outcome• Rapid growth – exponential growth of the scale of
facebook, linkedin, Air bnb
• Startups: The need to get rapid growth on a low budget• Enterprise: The need to move marketing initiatives
forward faster

Structure: How growth marketing works
Marketing Product/Tech
Marketing Product/Tech
TR
AD
ITIO
NA
L
MA
RK
ET
ING
GR
OW
TH
M
AR
EK
TIN
G
• Separate teams• Marketing brief goes into the work
stack – you may see it next year• Marketing thinks Product/Tech are
slow and are prone to saying “no”• Product/Tech thinks Marketing are
reckless
• Unified Teams• Marketing & Product/Tech form the
brief as a team• Leverages the ability of the product
itself to market• Reckless briefs become increasingly
viable

Structure: How growth marketing works
Marketing Product
Growth team• 1-2 technical marketers• 2 developers reporting
to marketers, not product development
• Work on marketability of the product
Product Team• Current team• Work on product
improvement
Marketing Team• Traditional Marketing
outputs

Examples
Growth Hack:• Allowed users to create a public
profile so that the search engines index their profiles and show up organically in search results.
• First to have people upload their contact lists
Growth:2 million to 200 million users
Growth Hack:• Peer-to-peer vacation rentals • Facilitated users to promote their
apartment ads on craigs list automatically
Growth:• Valued at $1 billion+ • To hit $500 million in
revenues