(7), - aina publications serverpubs.aina.ucalgary.ca/cpc/cpc1-18.pdf · frost enters or leaves the...
TRANSCRIPT

H. A. Thompson
INTRODUCTION
The degree-day approach hasbeen used successfully for many yea r s to relate temperature data to heating requirements for buildings. Monthly publications of the MeteorologicalBranch l is t cumulative seasonal and monthly heating degree-days below 65 O F for ab6ut fifty representative stations in Canada, while annual summaries include an additional one hundred stations. The growing degree-day concept is famil iar to many a s a convenient method of linking temperature vari- ations, during a growing. season, with plant growth. Calculated normal monthly and annual growing degree-days a r e listed 'for about eighty stations in Canada i n a paper by Boughner and Kendall (2).
The freezing degree-day and thawing degree-day a r e logical developments of the degree-day technique, and, a s the names imply, a r e used to relate climatic effects to frost action. Crawford and Boyd (6) mention that, a s ear ly a s 1930, an empirical relationship involving degree-days below freezing a i r temperature, and f ros t penetration into the ground, was used in highway-design in the United States.
FREEZING AND THAWING DEGREE -DAYS AND INDICES AS RELATED TO FROST ACTION
Fros t action in soils i s a problem in practically a l l sections of Canada i n highway, a i rpor t and building design. The problem has increased during the past ten to fifteen years with the northward extension of exploration and development into a r e a s of widespread permafrost . To a s s i s t in the development of modern engineering techniques in the north, r e sea rch bas been increased in such fields a s ground temperature studies, f ros t penetration, and retreat , i n soi ls , and permafros t distribution and behaviour. During the same period the increasing importance of water transportation in the north ha s fos tered the development of new techniques for forecasting the formation, growth, dissipation and movement of ice i n the seas , lakes and r ive r s . While a l l elements of climate a r e interrelated i n their e f fec ts on each of these manifestations of f ros t action, temperature is probably the most closely related and temperature data most readily available (10). The most useful expressions of temperature values a s they affect so i l s subject to f ros t action (7), and influence
* Published with the approval of the Director , Meteorological Branch, Department of Transpor t , Toronto, Ontario.

i ce growth and dissipation in wa te rways ( l l ) , a r e thawing and freezing degree-days. Thei r accumulations during respective thawing and freezing seasons a r e known a s thawing and freezing indices (16).
Whether it i s used. in determining the heat requirements of buildings o r plant growth, the tempera ture of the ground, the depthof f ros t penetration, the depth of thaw i n permafros t , o r the growth and dissipation of ice in waterways, the degree-day method is based ent i rely on tempera ture and neglects such variables of c l imate a s wind, so lar radiation, precipitation, etc. , not to mention the numerous soi l and water fac tors that a r e involved. However, in most of these fields, the method does represent this climatic parameter in a con- venient, simple form, suitable for use i n many engineering and design studies.
Workable empir ica l relationships exis t between accumulations of freezing degree-days and depth of f r o s t penetration i n the ground (7), and between thawing degree-days and depth of thaw i n permafros t (12). In a r e a s of Canada where tempera ture data a r e not available, the freezing index map m a y be used, with empir ica l curves , to pro- vide f i r s t approximations of f ros t penetration. The ra te a t which f ros t e n t e r s o r leaves the ground has considerable bearing on f r o s t damage to ground installations (6) . ' This , in turn, i s measured by the accumulation of degree:days during the first few weeks of f reezing o r thawing seasons.
Brown ( 3 ) notes that, although the occurrence of permafros t is influenced by many climatic, surface, and geothermal f ac to r s independent of the tempera ture regime, there i s a very broad rela- tionship between the boundary of pe rmaf ros t i n Canada and the mean annual a i r tempera ture . Since the formation and persist'ence of permafros t depends a s much on the f r o s t r e t r ea t during the thawing season as on the f ros t penetration during the freezing season, thawing a s well a s f reezing indices must be considered.
The degree-day method is commonly used to re la te a i r tem- pera ture to i ce formation, growth and diss ipat ion. , Empir ica l relation- ships involving i ce thickness and accumulated freezing degree-days a r e used to predict the ra te of ice growth (11). Similar formulae using melting degree-days provide break-up information. According to Markham (11), these degree-day relationships a r e used a t the Ice Forecas t ing Central to determine the effects of tempera ture on the i ce regime of the coastal waterways of Canada. Burbidge and Lauder (4) tes ted the degree-day technique to link tempera ture data to dates of break-up and freeze-up of lakes and r i v e r s . At selected stations, it was possible to re la te the date of break-up to the number of melting degree-days p r io r to break-up. There did not, however, appear to be

any connection between the date of break-up and the severity of the past winter season a s measured by the freezing index.
PREVIOUS WORK ON FREEZING AND THAWING INDICES
During the las t decade, freezing degree-day accumulations and freezing indices have been computed for a number of stations i n Canada, in connection with special investigations of f ros t action (3, 4, 6 , 13).
In 1954, a s par t of a runway evaluation programme of the Department of Transport , Wilkins and Dujay (13) used freezing degree-day accumulations for more than one hundred stations, aver- aged during the ten freezing seasons 1941 -1950, to construct a freezing inde.x map of Canada. The degree-day computations were based on mean daily temperatures. In 1959, a map of average thawing indices in Canada was prepared by the Division of Building Research, National Research Council (3). In this case, the thawing indices were calculated f rom mean monthly temperature data.
SCOPE AND METHOD
Due to the ra ther sparse climatological station network in northern Canada a t the s tar t of the 1941 -1950 decade, Wilkins and Dujay (13) did not attempt to extend their freezing index map into the Arct ic . As a resul t of the northward expansion during the late forties, an additional number of stations in northern Canada now have clima- tological records of more than ten years . This study is an attempt to f i l l the northern gap in the freezing index map of Canada, to present a thawing index map of northern Canada, and to provide freezing and thawing degree-day accumulations for specified periods of t ime during each year of the la tes t decade, fo r about forty stations. Maps of northern Canada a r e also presented which indicate the average dates of the s t a r t of the freezing season (mean daily temperatures gener- ally below 32°F after this date), and the average dates of the s tar t 'of the thawing season (mean daily temperatures above 3 2 " ~ ) .
In view of increasing requirements fo r degree-day information on shor t period, monthly o r annual fluctuations of temperature about a daily mean temperature of 32"F, it was decided to use machine methods to prepare degree-day tabulations for selected stations throughout Canada. The northern stations were given priority on this project, and the data presented here summarize the degree-day com- putations for about forty stations i n northern Canada.
Degree-day data were computed for practically al l stations in northern Canada which have continuous climatological records during
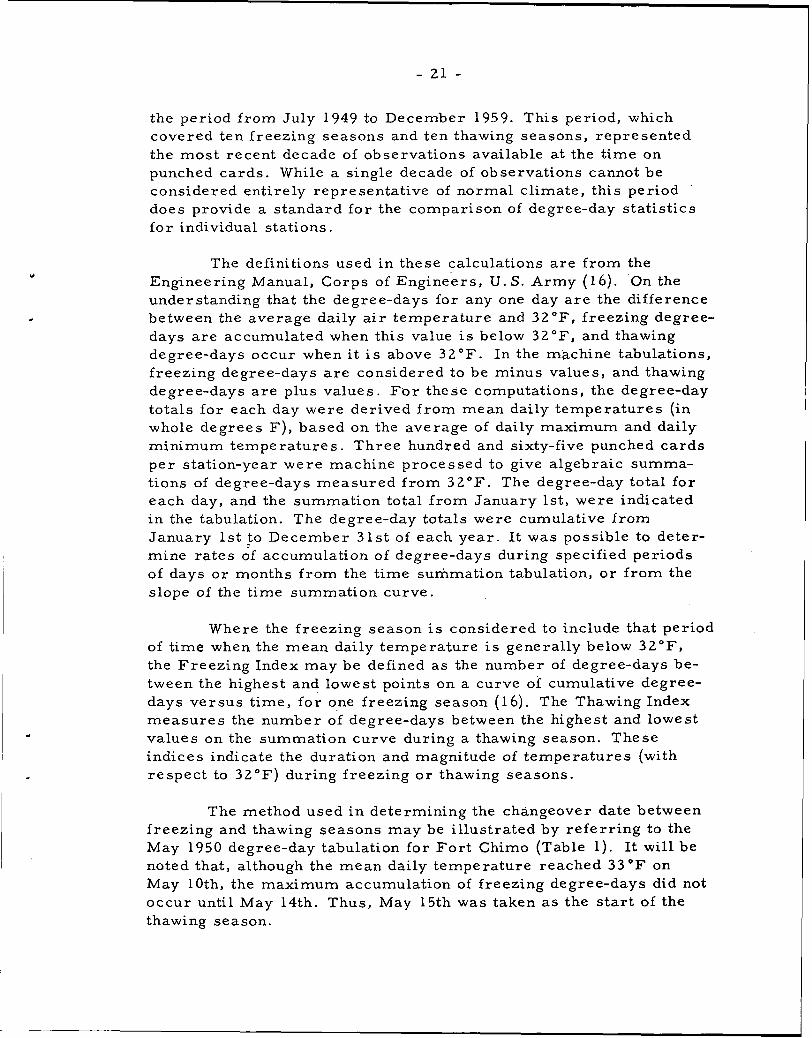
the period f rom July 1949 to December 1959. This period, which covered ten freezing seasons and ten thawing seasons, represented the mos t recent decade of observations available at the t ime on punched ca rds . While a single decade of observations cannot be considered entirely representative of normal climate, this period does provide a s tandard f o r the comparison of degree-day s tat is t ics fo r individual stations.
The definitions used i n these calculations a r e f rom the Engineering Manual, Corps of ~ n ~ i n e k r s , U. S. Army (1 6). On the understanding that the degree-days for any one day a r e the difference between the average daily a i r tempera ture and 32"F, f reezing degree- days a r e accumulated when this value is below 32 O F , and thawing degree-days occur when i t is above 32°F. In the mschine tabulations, f reezing degree-days a r e considered to be minus values, and thawing degree-days a r e plus values. F o r these computations, the degree-day totals for each day were derived f rom mean daily tempera tures (in whole degrees F), based on the average of daily maximum and daily minimum tempera tures . Three hundred and sixty-five punched c a r d s pe r station-year were machine processed to give algebraic summa- tions of degree-days measured f rom 32°F. The degree-day total f o r each day, and the summation total f rom January l s t , were indicated i n the tabulation. The degree-day totals were cumulative from January 1st !o December 3 1 s t of each yea r . I t was possible to deter- mine r a t e s of accumulation of degree-days during specified periods of days o r months f r o m the t ime summation tabulation, o r f rom the slope of the t ime summation curve.
Where the freezing season i s considered to include that period of t ime when the mean daily tempera ture i s generally below 32"F, the Freez ing Index may be defined a s the number of degree-days be- tween the highest and lowest points on a curve of cumulative degree- days ve r sus t ime, fo r one freezing season (1 6). The Thawing Index m e a s u r e s the number of degree-days between the highest and lowest values on the summation curve during a thawing season. These indices indicate the duration and magnitude of tempera tures (with respec t to 32°F) during f reez ing o r thawing seasons.
The method used i n determining the changeover date between f reez ing and thawing seasons may be i l lustrated by refer r ing to the May 1950 degree-day tabulation for F o r t Chimo (Table 1). It will be noted that, although the mean daily temperature reached 33°F on May loth, the maximum accumulation of freezing degree-days did not occur until May 14th. Thus, May 15th was taken a s the s t a r t of the thawing season.

TABLE 1
F o r t Chimo degree-day tabulations - 1950
Date Mean daily Degree-days Degree-day accumulation t empera tu re ( w . r . t . 3 2 " ~ ) f rom January 1 st
May 9 I ' 10 " 11 " 12 l 1 13 ' I 14 ' I 15
16
Graphical representat ions of the duration o f freezing an thawing seasons , and the magnitude of freezing and thawing indices, a r e shown i n F igure 5. The cumulative degree-day s tat is t ics f o r Whitehorse during the 1955-56 and 1957-58 thawing and freezing seasons a r e plotted against t ime. To facilitate comparison of the curves , the degree-day values of each curve have been adjusted so that they a r e cumulative from the z e r o point a t the s t a r t of each thawing season.
FREEZING INDICES
F igure 1 shows the a r e a l distribution of freezing indices i n nor thern Canada during the period 1949-1959. The map was con- s t ruc ted by averaging the. degree-day totals of the ten freezing sea- sons . Isol ines on the map a r e spaced at 500 degree-day intervals .
As a m e a s u r e of the combined duration and magnitude of below freezing tempera tures during a freezing season, the freezing index is made up of degree-day contributions f rom severa l months. Since the months of January, Februa ry and March contribute sub- stantially to the freezing index, it would be expected that the mean daily t empera tu res during these months would be reflected i n the pa t te rn of the freezing index map.
Comparison of the freezing index m a p with mean daily tem- pera ture m a p s f o r January o r Februa ry shows a marked 's imilar i ty i n pat tern over the Arc t ic Islands and in the northern continental i n t e r io r . The dominating cold centre over northern E l l e smere Island, and its southward extension into the B a r r e n s northwest of Hudson Bay, is a feature of both maps . Eureka, the coldest station i n Canada during m o s t of the winter months, a l so h a s the highest freezing index. The temper ing mar ine influenc'es along Hudson Strai t and the e a s t
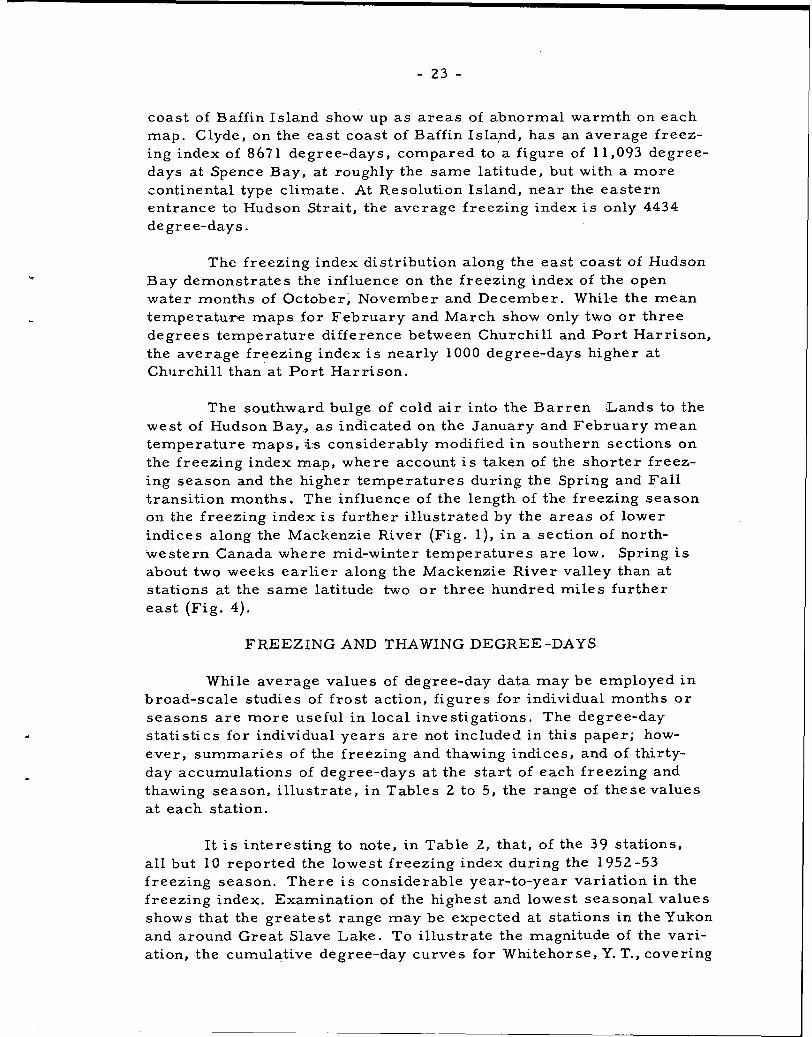
coast of Baffin Island show up a s a r e a s of abnormal warmth on each map. Clyde, on the e a s t coast of Baffin Islayd, has an average freez- ing index of 8671 degree-days, compared to a figure of 11,093 degree- days a t Spence Bay, a t roughly the same latitude, but with a more continental type cl imate. At Resolution Island, near the eas t e rn entrance to Hudson Strait , the average freezing index i s only 4434 degree-days .
The freezing index distribution along the eas t coast of Hudson Bay demonstrates the influence on the freezing index of the open water months of October, November and December. Whil,e the mean t empera tu~m maps for February and March show only two o r three degrees temperature difference between Churchill and P o r t Harr ison, the average freezing index i s nearly 1000 degree-days higher a t Churchill than a t P o r t Harr ison.
The southward bulge of cold a i r into the B a r r e n Lands to the west of Hudson Bay,, as indicated on the January and Februa ry mean tempera ture maps, i:s considerably modified i n southern sections on the freezing index map, where account is taken of the shor t e r f reez- ing season and the higher tempera tures during the Spring and F a l l t ransi t ion months. The influence of the length of the freezing season on the freezing index i s fur ther i l lustrated by the a r e a s of lower indices along the Mackenzie River (Fig. l) , i n a section of north- 'western Canada where mid-winter tempera tures a r e low. Spring is about two weeks e a r l i e r along the Mackenzie River valley than a t stations at the s a m e latitude two o r three hundred mi les fur ther eas t (Fig. 4).
FREEZING AND THAWING DEGREE -DAYS
While average values of degree-day data may be employed i n broad-scale studies of f ros t action, f igures for individual months o r seasons a r e m o r e useful in local investigations. The degree-day s ta t i s t ics for individual y e a r s a r e not included in this paper; how- eve r , summar ies of the freezing and thawing indices, and of thirty- day accumulations of degree-days a t the s t a r t of each freezing and thawing season, i l lus t ra te , in Tables 2 to 5, the range of thesevalues a t each station.
I t is interest ing to note, in Table 2, that, of the 39 stations, a l l but 10 reported the lowest f reezing index during the 1952-53 freezing season. There is considerable year-to-year variation in the f reez ing index. Examination of the highest and lowest seasonal values shows that the grea tes t range may be expected a t stations i n the Yukon and around Great Slave Lake. To i l lustrate the magnitude of the vari- ation, the cumulative degree-day curves for Whitehorse, Y. T., covering

the 1955 -56 and 1957-58 thawing and freezing seasons, a r e shown in F igure 5. The f reez ing indices of 5105 degree-days i n 1955-56 and 2852 in 1957 -58, were respective maximum and minimum figures during the decade. The thawing indices during the preceding thawing seasons were a l so lowest and highest values. I t may be seen f rom th i s comparison that-, while freezing indices a t White.horse covered a wide range of degree-days f rom 2852 to 5 105, the variation i n thaw- ing indices was considerably less , and ranged f rom 2865 degree-days i n 1955 to 3607 i n 1957. During the period April 14th 1957 to March 30th 1958, the thawing index exceeded the freezing index, to show a net accumulation of 755 thawing degree-days. In contrast , during the thawing and freezing seasons i n 1955-56, there was a net accumula- t ion of 2240 freezing degree-days.
The cumulative freezing degree-days during the first thir ty days of each freezing season a r e .summarized i n Table 4. These f igures provide a measure of the ra te of growth of i ce i n waterways, o r the ra te at which f ros t en te r s the ground during this period(6, 11). Similar s ta t i s t ics fo r thawing degree-days a r e l is ted in Table 5. It is apparent f r o m these tables that the ex t reme values a r e of more in t e res t than the average figures, since they indicate the , large year- to-year variation that may be expected i n ra te of f reeze o r ra te of thaw. Reference to Table 4 and Figure 3 shows that, in general, the highest thirty-day accumulations of freezing degree-days occur i n la te f reez ing seasons, while low values usually occur when the s t a r t of the freezing season is ea r l i e r than the average date.
THAWING INDICES
The map of the average thawing indices i n northern Canada during the period 1949-1959 i s presented i n Figure 2 . This map has a pat tern s imi l a r to the mean daily tempera ture map for July.
Over the Arc t i c is lands, where tempera tures in summer a r e controlled by the presence of la rge a r e a s of ice-filled water and where the length of the thawing season va r i e s only a few days with latitude, thawing indices and mean daily tempera tures during a typical s u m m e r month (July) a r e closely related. Almost everywhere nor th of the continental coastline, Foxe Basin and Hudson Strait , the distribution of thawing indices i s very uniform with values mostly in the 500 to 1000 degree-day range.
Along the July 5 0 ° F i so therm, which extends f rom the Mackenzie delta to Baker Lake, southern Hudson Bay and Ungava Bay and which is often t e r m e d the southern boundary of the Arct ic (14), thawing indices average about .I500 degree-days.
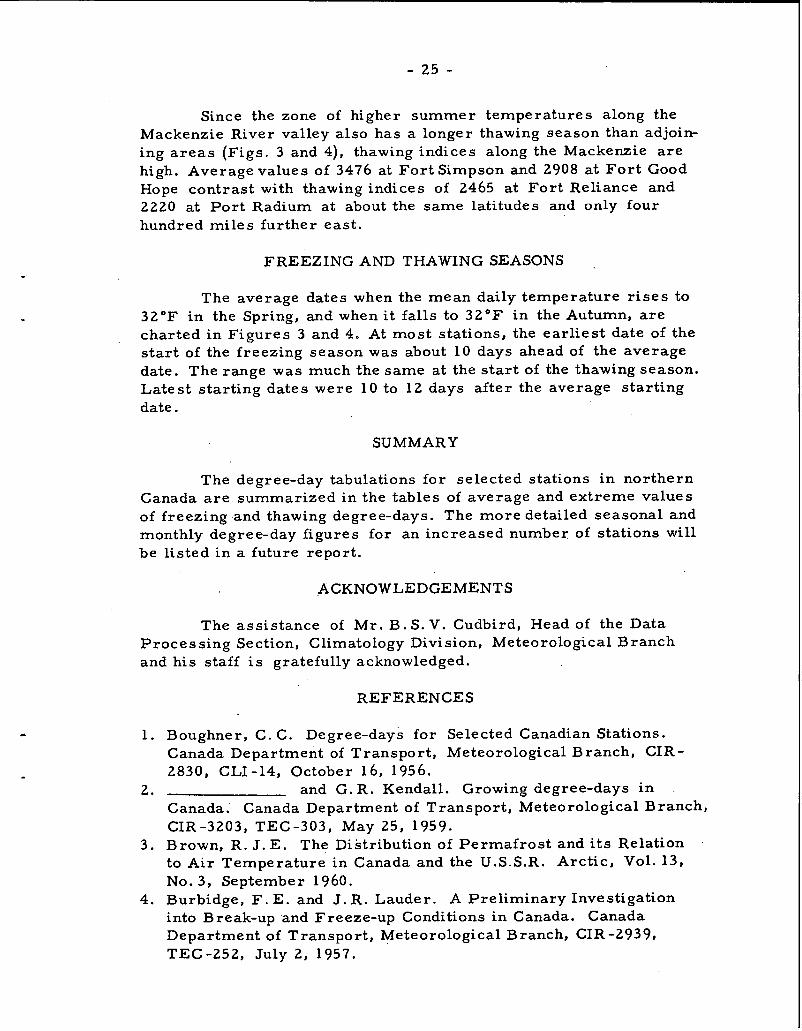
Since the zone of higher summer tempera tures along the Mackenzie River valley also has a longer thawing season than adjoin- ing a r e a s (Figs . 3 and 4), thawing indices along the Mackenzie a r e high. Average values of 3476 at F o r t Simpson and 2908 at F o r t Good Hope cont ras t with thawing indices of 2465 a t F o r t Reliance and 2220 at P o r t Radium a t about the same latitudes and only four hundred mi les fur ther east .
FREEZING AND THAWING SEASONS ,
The average dates when the mean daily temperature r i s e s to 32°F i n the Spring, and when it fal ls t o 32OF i n the Autumn, a r e charted i n F igures 3 and 4. At mos t stations, the ea r l i e s t date of the s t a r t of the freezing season was about 10 days ahead of the average date. The range was much the same a t the s t a r t of the thawing season. Lates t s tar t ing dates were 10 to 12 days af ter the average s tar t ing date.
SUMMARY
The degree-day tabulations for selected stations i n nor thern Canada a r e summarized i n the tables of average and ext reme values of f reezing and thawing degree-days. The more detailed seasonal and monthly degree-day figures for an increased number of stations will be l is ted i n a future report .
ACKNOWLEDGEMENTS
The ass i s tance of Mr . B. S. V. Cudbird, Head of the Data Process ing Section, Climatology Division, Meteorological Branch and his staff is gratefully acknowledged.
REFERENCES
1. Boughner, C. C. ~ e ~ r e e - d a y s for Selected Canadian Stations. Canada Department of Transport , Meteorological Branch, CIR- 2830, CLI-14, October 16, 1956.
2. and G.R. Kendall. Growing degree-days i n Canada. Canada Department of Transpor t , Meteorological Branch, CIR-3203, TEC-303, May 25, 1959.
3. Brown, R. J. E . The Distribution of Pe rmaf ros t and its Relation to Ai r Tempera ture i n Canada and the U.S.S.R. Arct ic , Vol. 13, No. 3, September 1960.
4. Burbidge, F . E . and J. R. Lauder . A Pre l iminary Investigation into B reak-up .and Freeze-up Conditions i n Canada. Canada Department of Transpor t , Meteorological Branch, CIR-2939, TEC -252, July 2, 1957.

Crawford, C. B . F r o s t Penetrat ion Studies i n Canada as an Aid to Construction. Canada National Re sea rch Council, Division of Building Resea rch , Technical P a p e r No. 20, F e b r u a r y 1955.
and D. W. Boyd. Climate in Relation to F r o s t Action. Canada National Resea rch Council, Division of Building Resea rch , Technical Pape r No. 28, January 1956.
and R. F. Legget. Ground Tempera tu re Investi- gations i n Canada. Canada National Research Council, Division of Building Resea rch , P a p e r No. 33, December 1955.. Holmes, Rober t M. and G. W. Robertson. Heat Units and Plant Growth. Canada Department of Agriculture, Publication 1042, J anua ry 1959. L e e , Owen S. and Lloyd Simpson. A P rac t i ca l Method of Predict- ing Sea I ce Fo rma t ion and Growth. U. S. Navy Hydrographic Office, Technical Report TR-4, September 1954. Legget , R. F., H. B . Dickens and R. J . E. Brown. P e r m a f r o s t Investigations i n Canada. Geology of the Arct ic , Vol. 11, 1961. Markham, W. E. Freez ing and Melting Degree-day Computations i n Spring and F a l l Months. Canada Department of Transpor t , Meteorological Branch, CIR-3350, TEC-325, June 8 , 1960. Sebastyan, G. Y . Department of Transpor t P rocedures f o r the Design of Pavement Fac i l i t i es and Foundation S t ruc tu re s i n P e r m a f r o s t Subgrade Soil Areas . F i r s t Canadian Conference on P e r m a f r o s t , Associate Committee on Soil and Snow Mechanics of the National Resea rch Council of Canada, Apr i l 1962. Wilkins, E. B . and W. C. Dujay. F reez ing Index Data Influencing F r o s t Action. Canada National Resea rch Council, Associate Commit tee on Soil and Snow Mechanics, Proceedings of the Seventh Canadian Soil Mechanics Conference Technical Memorandum No. 33, September 1954. Thomas , M. K. Canadian Arc t i c Tempera tu re s . Canada Depart- men t of T ranspor t , Meteorological Branch, CIR -3334, CLI -24, May 9, 1960.
Heating Degreedays and Winter Design Tem- pe ra tu re s i n Southern Ontario. Canada Department of Transpor t , Meteorological Branch, CIR-3 159, CLI-18, F e b r u a r y 11, 1959. Engineer ing Manual, P a r t XV, Arc t ic and Sub-Arctic Construc- tion. U. S. Department of the Army , Corps of Engineers , October 1954.

TABLE 2
Average and ext reme values of f reezing index (degree-days) - 1949-1959
Ten-year Station average High Season Low Season
Aishihik A Aklavik
'#Alert Arctic Bay Baker Lake B rochet Cambridge Bay Cape Hopes Advance Chesterfield Churchill A Clyde Coppe rmine Coral Harbour A Ennadai Lake Eureka F o r t Chimo A F o r t Good Hope F o r t Reliance F o r t Resolution F o r t Simpson F o r t Smith A Frobisher Bay A Hay River
* Holman Island Isachsen Mayo Landing Moosonee
*Mould Bay Norman Wells A Nottingham Island P o r t Harr i son P o r t Radium Resolute A Resolution Island
*Spence Bay Tesl in A Watson Lake A Whitehorse A Yellowknife A
*~nd ica te s period of r eco rd l e s s than ten yea r s .

TABLE 3
Average and extreme values of thawing index (degree-days) - 1949-1 959
Ten-year Station average High Year Low Year
Aishihik A Aklavik
*Ale r t Arctic Bay Baker Lake Brochet Cambridge Bay Cape Hopes Advance Chesterfield Churchill A Clyde Coppe rmine Coral Harbour A Ennadai Lake Eureka F o r t Chimo A F o r t Good Hope .
F o r t Reliance F o r t Resolution F o r t Simpson F o r t Smith A Frobisher Bay A Hay River
*Holman Island Isachsen Mayo Landing Moosonee
*Mould Bay Norman Wells A Nottingham Island P o r t Harr ison P o r t Radium Resolute A Resolution Island
*Spence Bay Tesl in A Watson Lake A Whitehorse A Yellowknife A
*indicates period of record l e ss than ten years .

TABLE 4
Accumulation of f reezing degree-days during f i r s t 30 days of f reezing season - the period 1949-1959
Station Average Highest F r o m date Lowest F r o m date
Aishihik A Aklavik Aler t Arct ic Bay Baker Lake B rochet Cambridge Bay Cape Hopes Advance Chesterfield Churchill A Clyde Coppe rmine Coral Harbour A Ennadai Lake Eureka F o r t Chimo A F o r t Good Hope F o r t Reliance F o r t Resolution F o r t Simpson F o r t Smith A Frobisher Bay A Hay River Holman Island Isachsen Mayo Landing Moosonee Mould Bay Norman Wells A Nottingham Island P o r t Harr i son P o r t Radium Resolute A Re solution Is land, Spence Bay Tesl in A Watson Lake A Whitehorse A Yellowknife A
Oct. 14/53 Oct. 5/50 Sept. 5/58 Sept. 19/5 1 Sept. 28/56 Nov. 4/58 Sept. 28/54 Nov. 3/55 Oct. 9/5 1 Oct. 30/58 Sept. 23/57 Oct. 13/53 Sept. 27/56 Oct. 9/5 1 Sept. 9/58 Oct. 23/54 Oct. 13/53 Oct. 29/58 Nov. 3/58 Oct. 1 O/5 6 Nov. 3/58 Nov. 4/55 Nov. 3/58 Sept. 22/56 Sept. 7/58 Oct. 23/53 Nov. 7/56 Sept. 6/58 Oct. 13/53 Sept. 23/52 Oct. 23/54 Oct. 16/55 Sept. 14/51 Nov. 5/55 Sept. 27/54 Oct. 26/53 Oct. 20/55 Oct. 20/55 Oct. l0/5 6
Oct. 1/54 Sept. 18/54 Aug. 13/53 Sept. 4/55 Sept. 17/51 Oct. 3/50 Sept. 11/57 Sept. 30/54 Sept. 25/54 Oct. 3/50 Sept. 8/55 Sept. 13/57 Sept. 8/55 Sept. 23/53 Aug. 22/49 Sept. 29/51 Sept. 26/52 Sept. 23/52 Oct. 6/49 Oct. 6/54 Oct. 1/57 Sept. 20/53 Oct. 6/49 Aug. 28/52 Aug. 12/53 Oct. 22/5 2 Oct. 29/53 Aug. 12/53 Sept. 27/5 2 Sept. 21/49 Oct. 1/58 Sept. 23/52 Aug . 2 6/5 7 Sept. 29/49 Sept. 6/55 Oct. 6/58 Oct. 14/49 Oct. 5/58 Oct. 6/58

TABLE 5
Accumulation of thawing degree-days during f i r s t 30 days of thawing season - 1949-1959
Station Average Highest F r o m date Lowest F r o m date
Aishihik A Aklavik Ale r t Arc t i c Bay Baker Lake Brochet Cambridge B a y Cape Hopes Advance Chesterf ie ld Churchi l l A Clyde Coppermine Cora l Harbour Ennadai Lake Eureka F o r t Chimo A F o r t Good Hope F o r t Reliance F o r t Resolution F o r t Simpson F o r t Smith A F r o b i s h e r Bay A Hay River Holman Is land I sachsen Mayo Landing Moosonee Mould B a y Norman Wells A Nottingham Island F o r t Har r i son P o r t Radium Resolute A Resolution Is land Spence Bay Tes l in A Watson Lake A Whitehorse A Yellowknife A
May 13/52 May 27/51 June 15/56 June 15/56 June 9/58 Apri l 12/52 June 16/56 June 18/58 June 9/51 June 4/51 June 15/56 June 12/56 June 8/56 June 4/51 June 5/57 May 25/51 May 11/55 May 12/55 May 3/58 May 3/58 May 3/54 June 8/56 May 3/58 June 12/56 June 12/57 May 4/59 May 7/50 June 12/57 May 10/55 June 7/58 May 17/55 May 23/54 June 15/56 June 8/58 June 17/56 Apri l 30/54 Apri l 30/54 Apri l 29/54 May 11/55
Apri l 14/5 1 M a y . 11/59 June 14/55 June 4/55 May 28/54 Apri l 27/57 June 3/53 May 5/52 May 28/54 April 23/52 May 21/50 May 14/55 May 28/54 May 25/54 June 4/55 Apri l 27/59 April 28/56 April 28/50 April 22/55 Apri l 14/57 Mar . 24/5 8 May 15/59 April 26/57 '
May 11/53 June 1/52 Mar . 24/58 April 15/53 June 17/53 Apri l 21/52 May 19/50 - May 10/58 May 11/59 June 15/55 May 20/53 June 13/59 Apri l 9/52 Apr i l 13/56 Mar . 30/51 Apri l 26/57

Discussion
J .R. Mackay asked if i t is possible to give the approximate relationship which might be expected between freezing and thawing indices measured in a weather s c r e e n and those for the ground surface, fo r example, a t a depth of one cent imeter . The author replied that a l l the tempera tures used in the computation of freezing and thawing indices were obtained f r o m weather screens . There is no information available on the expected relationship. T. A. Harwood commented that micro-meteorological complications, which a r e evident a t the ground sur face , a r e ironed out a t a height of 4 feet above the ground. Therefore, a i r tempera ture measurements f r o m the weather sc reen a r e a m o r e rel iable indicator of meteorological conditions.
In reply to an inquiry by T. A. Harwood on the correspondence existing between mean annual a i r i so therms and the southern Limit of permafrost in Canada, the author replied that there a r e not enough meteorological stations a t present in the a r e a to give a p rec i se answer. The paper by R. J. E. Brown (The Distribution of Pe rmaf ros t and I t s Relation to Air Tempera ture in Canada and the U. S. S. R. , Arct ic , Vol. 13, No. 3, Sept. 1960, pp. 163-177, NRC 5941) shows only a broad relationship. Thawing indices , i n addition to freezing indices, must be considered, the final r e su l t being a consideration of m e a n annual a i r temperature. R. J. E. Brown remarked that a broad relationship exis ts between mean annual a i r tempera ture and the southern limit of permafrost . Our present knowledge of the southern limit in Canada indicates
0 0 that i t l ies in the zone bounded by the 25 F. and 30 F. m e a n annual a i r isotherms. Because of the complex energy exchange reg ime operative a t the ground surface which r e su l t s in the mean annual ground tempera ture being seve ra l degrees (about 6) w a r m e r than the mean annual a i r tempera ture ,
0 there is no known instance of the permafros t lying south of the 30 F. mean annual air isotherm. Fluctuations a c r o s s the country and local variations in permafros t within a sma l l a r e a appear to be influenced by t e r r a in and subsurface fea tures such a s vegetation, soil , and others.
N. W. Radforth wondered if i t is possible to reconcile the differences existing between isolines of f reez ing and thawing indices to permafrost . It appears that thawing indices, in addition to freezing indices, should be considered before any comparison can be attempted. Also, the degree day method considers tempera ture only, as one of many fac tors of climate affecting the distribution of permafrost . The snow on the ground, vegetation, type of soil , and other fea tures affect the southern boundary considerably.

I
Fig. 1.
FREEZING INDICES IN NORTHERN CANADA
Based an doily mean temperatures during the !en year period 1949 - 1959
l hdiiam a e h ur.d in lh. M O ~ ~ S ~ S


Fig. 3. MEAN DATE
OF THE BEGINNING OF THE FREEZING SEASON
(The doh of maxim swamal wmulaHon of thawing degree-days)
Ten ywr pwiod 1949 -1959


-600.
-1000
-1600.
- eooo -
4000-
Nov. 4/57 +
Freezing Index'
I Q)
IOOO- . eL Q) 0
Fig.5 - Degree-day Accumulations at Whitehorse, Yukon. (00% temperature 32 deg. F.)