6.a.1 lion properties fund
TRANSCRIPT
REAL ESTATE INVESTMENT MANAGEMENT WWW.CLARIONPARTNERS.COM
LION PROPERTIES FUNDQUARTERLY REPORT 1Q18
6.A.1
CLARION LION PROPERTIES FUND QUARTERLY REPORT 1Q18
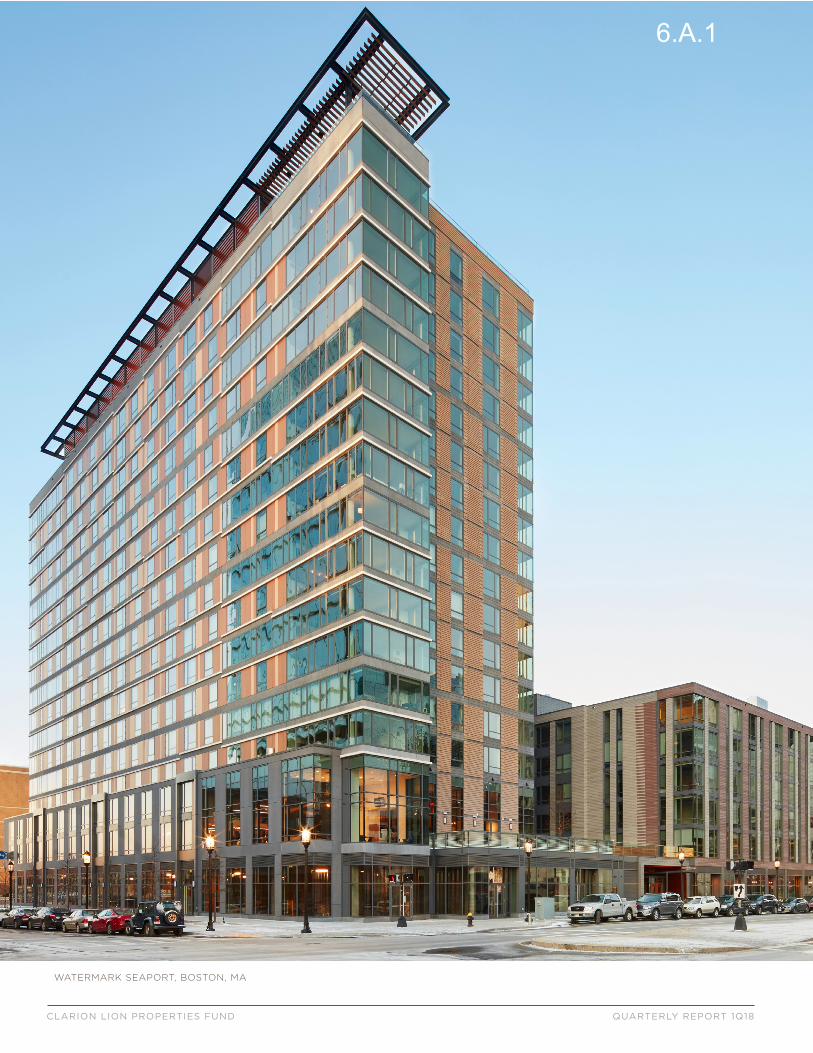
WATERMARK SEAPORT, BOSTON, MA
6.A.1

Letter to Shareholders 3
Fund Overview 4
Market View 5
Portfolio Performance 7
Performance Versus NFI-ODCE 8
Weightings and Sector Performance 9
Investment Activity 11
Financial Management 12
Occupancy and Leasing 13
Diversification 13
Commitment to Sustainability 14
Financial Statements 15
Property List 18
Notes 23
TABLE OF CONTENTS
CLARION LION PROPERTIES FUND 2
QUARTERLY REPORT 1Q18
For use with Shareholders only. Not intended for public distribution.
6.A.1
3 CLARION LION PROPERTIES FUND
Letter to ShareholdersThe Fund had a strong start to the year, with a total gross return of 2.56% (2.35% net of fees), which outpaced the ODCE benchmark by 36 bps. Fundamentals for U.S. core real estate remain solid and the Fund continues to benefit from high occupancy throughout the portfolio with very good leasing activity across all property sectors.
Ralph J. Belford, IIIPortfolio Manager
The Fund’s total gross return for the first quarter of 2.56% (2.35% net of fees) was comprised of 1.06% in income and 1.50% in appreciation. The Fund’s one-year trailing total gross return has been 8.93% (8.05% net of fees), outperforming the ODCE benchmark by 86 bps. Total gross assets at quarter end were $11.2 billion; the portfolio being made up of 144 investments located throughout 34 markets. Fund NAV ended the quarter at $8.2 billion.
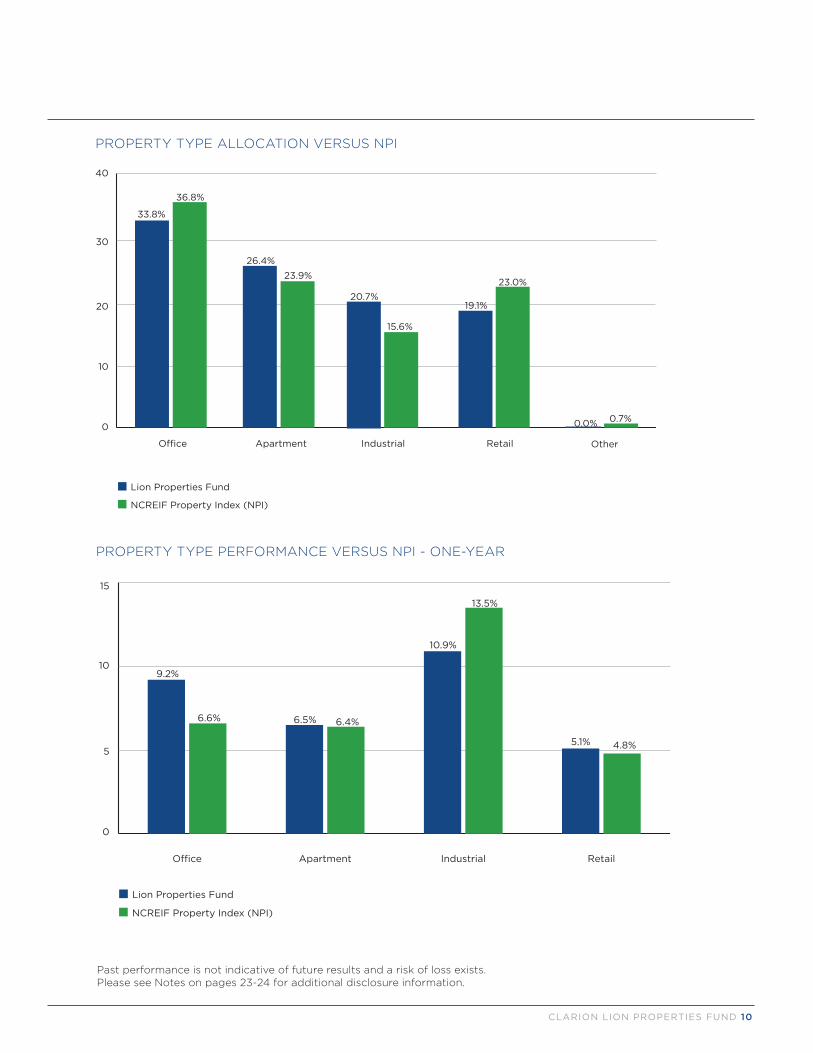
Property values increased +1.0% (excluding developments) over the prior quarter, led by the Fund’s industrial portfolio, where values increased +2.2%. The Fund’s Southern California assets continued to show strong growth within the portfolio. Values for the office portfolio increased +1.5% while value increases for the retail and apartment portfolios were relatively flat (+0.2% and -0.1%, respectively). Net operating income, which we forecast to grow 3.3% in 2018 on a same property basis, was overall +2.2% ahead of plan year-to-date. Occupancy remains strong across the portfolio, ending the quarter at 93.5%.
The Fund distributed $82.0 million to its investors for the first quarter, resulting in a trailing one-year cash dividend yield of 4.08%. The Fund accepted $346.2 million in new contributions in the first quarter, with an additional $171.0 million admitted into the Fund on April 1st. Redemptions for the quarter totaled $109.3 million.
During the quarter, the Fund closed on four new investments with a total purchase price of $418.1 million. A small creative office and retail property (8870 Washington) located in West LA was acquired for $28.0 million; a five-asset Bronx apartment portfolio was acquired for $65.8 million (at share); Watermark Seaport, an apartment asset located in Boston, was acquired for $238.8 million; and Gateway Towne Center, a retail center located in the Los Angeles MSA was acquired for $85.6 million. The Fund completed one disposition during the quarter, selling Chevy Chase Hotel for $58.5 million. This was the last hotel owned by the Fund.
The retail sector suffered another bankruptcy during the quarter, as Toys R Us announced it would shut down after seven decades in the toy business. The Fund has very limited exposure to Toys R Us (two locations) and will not be significantly impacted as a result of its pending liquidation, accounting for less than 0.2% of the Fund’s annualized revenue. We have been monitoring Toys R Us for several quarters and have already started to explore backfill options at both centers.
During the first quarter of 2018, overall U.S. real estate returns continued their recent solid pace. Supply and demand remain fundamentally healthy, and investor capital allocation to the sector remains strong. The industrial sector continues to outperform while the retail sector continues to face challenges.
While underlying interest rates have risen over recent months, as well as actual real estate borrowing rates, pricing for quality assets and markets has shown little change. Transaction volume for the first quarter actually increased 5%, reversing recent trends for the first time in over a year. Industrial and apartment transaction volume increased significantly while office and retail volume was down.
While the domestic economic picture remains largely solid, we are closely watching the direction of interest rates and inflation, as well as demographic, cultural and technology trends to best position the portfolio.
On behalf of Clarion Partners and the Lion Properties Fund team, I would like to thank you for your continued support of the Fund.
QUARTERLY REPORT 1Q18
Past performance is not indicative of future results and a risk of loss exists.Please see Notes on pages 23-24 for additional disclosure information.
Ralph J. Belford, IIIPortfolio Manager(212) [email protected]
6.A.1

KEY STATISTICS
Total Asset Value $11,161 Million Portfolio Occupancy 93.5%
Net Asset Value $8,180 Million Cash Ratio 1.5%
Value Per Share $1,446.83 Leverage Ratio 23.3%
Number of Shareholders 351 Number of Markets 34
Number of Investments 144 Average Investment Size $76 Million
PROPERTY TYPEGROSS REAL ESTATE
VALUE AT SHARE($ MILLIONS)
LONG-TERM TARGET RANGES
CURRENT ALLOCATIONS
Office 3,692 25-40% 33.8%
Apartment 2,881 25-35% 26.4%
Industrial 2,258 15-25% 20.7%
Retail 2,081 10-20% 19.1%
FUND PERFORMANCE QUARTER 1 YEAR 3 YEAR 5 YEAR 7 YEAR 10 YEARSINCE
INCEPTION(4/1/00)
Income Return 1.06% 4.39% 4.54% 4.65% 4.87% 5.08% 6.01%
Appreciation Return 1.50% 4.40% 6.14% 7.16% 7.02% (1.05%) 1.65%
Total Return Before Fees 2.56% 8.93% 10.89% 12.05% 12.14% 3.99% 7.73%
Total Return After Fees 2.35% 8.05% 9.96% 11.10% 11.18% 3.06% 6.85%
O�ce
Retail
Industrial
Apartment
Midwest6.3%
South22.5%
West35.0%
East36.2%
Fund Overview
Past performance is not indicative of future results and a risk of loss exists.Please see Notes on pages 23-24 for additional disclosure information.
CLARION LION PROPERTIES FUND 4
6.A.1

Market View
U.S. Real Estate Market FundamentalsINDUSTRIALU.S. industrial sector fundamentals remained robust with steady demand. In Q1, the national industrial availability rate fell by 10 bps to 7.3%, the lowest level since 2001, as new supply growth moderated. Given the historically low levels of availability in most U.S. markets, rents continued to grow above the long-term average pace. In Q1, U.S. annualized rent growth was 4.6%. Net absorption of 45.4 million sf slightly outpaced completions of 42.1 million sf. Markets that saw the greatest reduction in availability year-over-year as of Q1 were Sacramento (-290 bps), Jacksonville (-220 bps), Memphis (-220 bps), New Haven (-180 bps), and Phoenix (-180 bps).
E-commerce expansion continued to drive occupier demand in 2018 amidst rising online sales. U.S. factory output has also been a stable source of growth in recent months. In Q1 2018, the Institute for Supply Management (ISM) manufacturing index reached a five-year high. Both land and space availability are increasingly scarce in the largest metropolitan areas. Logistics tenants now compete for warehouse and distribution facilities that offer speed, scale, and cost-efficiencies at first- and last-mile locations near strategic transportation nodes. Highest ranking markets for total net absorption were Chicago, Atlanta, and Houston. Overall, the surge in international e-trade, strengthening global economy, and improving U.S. consumer activity, as well as the adoption of advanced industries and 3D printing, are viewed as positives for the sector. Going forward, global trade dynamics are in flux, and the proposed restrictive tariff policy may present a potential risk to international trade. However, recent data does not indicate a slowdown in exports or domestic factory orders.
U.S. industrial market supply and demand fundamentals have been favorable. In 2018, new supply levels are expected to remain near last year’s pace - the highest level so far this cycle, but still below long-term averages - and moderate thereafter. In top distribution hubs, availability for Class A inventory is generally low. Highest ranking markets for completions year-to-date were Atlanta, Riverside, Chicago, Kansas City, and Dallas. A few hubs account for nearly 50% of the new development underway. Functionally obsolete properties, such as Class B/C malls, old manufacturing buildings, and commodity suburban office in top infill locations near air-, port- and rail-related transportation infrastructure are increasingly targeted for warehouse redevelopment. Looking ahead, we expect annual average deliveries to remain below the long-term average from 2018 to 2022.
In Q1, industrial transaction volume totaled $20.9 billion, up 33.8% year-over-year. Portfolio and single-asset sales increased by 84.0% and 10.0%, respectively. Entity sales were Hopu Investment and Bank of China’s JV purchase of GLP for $4.1 billion and Blackstone RE Income Trust’s acquisition of Cabot Properties for $1.8 billion. In Q1, the NPI sub-index posted a total return of 3.3% and an annual return of 13.5%.
APARTMENTOverall, the U.S. multifamily sector reported ongoing strength, although new supply continues to impact select markets. In Q1, the national vacancy rate rose by 10 bps to 5.0%. The recent moderation in rent growth is largely due to new ground-up projects and redevelopment in a few areas. In Q1, new supply of 41,474 units outpaced net absorption of 22,430 units. Effective rents were up 2.0% year-over-year, weighed down by tepid performance in some of the nation’s largest metros. Rents were up 1.1% in New York, 0.2% in Chicago, and 0.7% in Washington D.C., which account for over 20% of total inventory. Four markets registered more than 5% rent growth over the same period—Orlando (7.1%), Las Vegas (6.5%), Sacramento (5.6%), and Tucson (5.3%). Markets with the largest reduction in the vacancy rate year-over-year as of Q1 were Houston (-170 bps), Pittsburgh (-160 bps), Fort Lauderdale (-60 bps), Birmingham (-60 bps), and Orlando (-50 bps). Over the year, Seattle and Dallas reported large vacancy rate increases.
Rental demand remained steady in the nation’s high-growth employment markets. National socioeconomic conditions indicate affordability pressures remain near record levels, suggesting that homeownership remains out of reach for many. In Q1, the homeownership rate remained 64.2%, unchanged from the prior quarter but a significant improvement from the 50-year low of 62.9% in 2016, signaling the for-sale housing recovery is underway. Millennial homeownership however fell from a three-year high of 36.0% in Q4 2017 to 35.3% in Q1. Meanwhile, the homeownership rate for Americans aged 35 to 64 rose. The senior rate is highest as this cohort typically ages in place in long-time homes. Nonetheless, a rapid demand shift from multifamily to for-sale housing is not anticipated, with millions of cost-burdened renters paying more than half their incomes in housing and approximately 23 million young adults still living with family. Overall, the U.S. vacancy rate is still near its cyclical bottom; however, there is significant variation by region. Today, there is steady demand in all segments, with institutional investors continuing to allocate capital to Class A apartments, as well as Class B assets, entry-level housing, and workforce housing in higher-density areas with strong live-work-play environments in cities and premier suburbs.
In 2018, new multifamily completions are expected to reach a level near the cyclical peak in 2017. In Q1, new unit deliveries were highest in Dallas, Seattle, New York, Charlotte, and Boston. In select coastal gateway markets, such as New York City, Class A multifamily reported short-term supply headwinds. In most major markets, however, rents remained near record highs. Furthermore, select supply-constrained premier suburbs around large metropolitan areas have reported very low vacancies (e.g. Long Island and Northern New Jersey). Given elevated rent-to-income ratios in all age cohorts, ongoing rental household demand is expected to support more new Class A product in cities and premier suburbs of top employment hubs. Mid-market housing stock is growing as the CRE industry tackles the nation’s housing affordability crisis. The climate for financing new multifamily development is expected to remain generally conservative, as labor availability and costs have driven up building costs substantially. Looking ahead, we expect annual average deliveries to remain just above the long-term average from 2018-2022, but after this year new supply is expected to significantly moderate.
Investor appetite for multifamily outpaced all other sectors. In Q1, multifamily transaction volume totaled $34.8 billion, up 25.1% year-over-year. Sales activity in major markets re-accelerated, up 39.7% and mid/high-rise properties also rose by 55.1%. In Q1, the NPI multifamily sub-index posted a total return of 1.5% and an annual return of 6.4%.
5 CLARION LION PROPERTIES FUND QUARTERLY REPORT 1Q18
6.A.1

OFFICEU.S. office market fundamentals are healthy in top, high-cost CBDs, premier suburbs, and high-growth secondary markets. Office-using jobs increasingly occupy less traditional formats. In Q1, the national vacancy rate rose by 30 bps to 13.3%, the second consecutive quarter of increases, following six years of continuous declines. The national vacancy rate for CBD remained 10.8%, while it increased for suburban markets by 30 bps to 14.5%. New construction of 11.9 million sf significantly outpaced net absorption of only 1.3 million sf. Markets that saw the greatest reduction in vacancy year-over-year as of Q1 were Las Vegas (-300 bps), Cincinnati (-200 bps), Newark (-130 bps), Detroit (-120 bps), and Phoenix (-120 bps). The largest vacancy increases were in San Jose, Oakland, and Houston. Going forward, corporate tax reform is expected to greatly benefit businesses and, in turn, may spur new office demand.
In Q1, demand continued to moderate following the slowest annual pace of net absorption in 2017 since 2013. Activity continued to vary significantly by market and asset quality. Overall, new and Class A absorption trends, as well as growth, have been strongest in business-friendly and transit-serviced submarkets. Health care & social assistance, high-tech services, and professional & business services are driving much of the new space requirements, often in more efficient space plans. In Q1, U.S. markets reporting the lowest vacancy rates were San Francisco, Seattle, Raleigh, and Orlando. After six consecutive years of climbing new supply, most markets continued to report rents near prior peak levels. Each market’s relative draw depends on its unique demand drivers (e.g. urban dynamism, talent pool, and tax environment). Amazon’s second headquarters, which will add 8 million sf of new office space and 50,000 new high-paying jobs to the target city, will likely be on the east coast. The selected area will likely see an economic boom.
In 2018, new office construction is expected to reach its cyclical peak, following the highest level to-date in this cycle in 2017. In Q1, new project completions were largely concentrated in San Jose, San Francisco, Dallas, Atlanta, and Denver. Furthermore, select markets are nearing an inflection point as supply begins to catch up to demand, sparking greater caution amidst developers and lenders with oversupply concerns. More corporate occupiers are reassessing workplace strategy to accommodate the rising cost of living and are looking beyond traditional office formats. Alternative and flexible workplaces can reduce real estate expenses, offer more flexibility, and improve cost efficiency. WeWork, the largest co-working company, has grown quickly and is gaining traction among corporate and freelance users. Looking ahead, we expect annual average deliveries to remain below the long-term average from 2018 to 2022.
In Q1, office transaction volume totaled $27.4 billion, a 12.3% decline year-over-year. CBD sales fell notably, well above suburban deals, and portfolio transactions fell 50.4%. Medical office building (MOB) was the only office subsector to report positive sales growth. Manhattan saw 111% growth in office deal volume as owners compromise more on prices. In Q1, the NPI office sub-index posted a total return of 1.8% and an annual return of 6.6%.
RETAILDespite healthy consumer spending, U.S. retail property fundamentals continued to be impacted by the rapid growth in omni-channel retail. The “age of Amazon” has continued to transform how brick & mortar players generate in-store sales. In Q1, the availability rate for neighborhood and community shopping centers declined by 20 bps to 9.4%, a positive reversal following four consecutive quarters of increases. This metric is impacted by long-term leases. Net absorption rebounded strongly to 5.6 million sf, outpacing completions of 2.1 million sf. Markets that saw the greatest reduction in availability year-over-year as of Q1 were Seattle (-120 bps), San Antonio (-110 bps), San Jose (-80 bps), Charlotte (-60 bps), and Philadelphia (-60 bps). Clarion Partners continues to favor urban locations, mixed-use formats, and grocery-anchored centers in strong and dense trade areas.
U.S. consumer confidence and spending remained key drivers of growth within the economy. Retail demand has been strongest at Class A shopping centers and commercial districts with high foot traffic. So far this year, fewer retail store closings have been announced relative to prior years. In Q1, Chicago, Philadelphia, and Dallas reported the highest net absorption. Availability is lowest in the San Francisco Bay Area, Miami, and Orange County. Affluence and population density are crucial success factors. Services, discount, food & beverage, entertainment, and recreational destinations now represent an increasing share of space usage. Amazon now drives the majority of U.S. retail sales growth. The recent acquisition of Whole Foods by Amazon opens brick-and-mortar access in top trade areas to the internet retailer, which may put certain grocers at greater risk. Americans are now spending more on health care; the merger between CVS and Aetna may create new opportunities in retail (e.g. outpatient facilities, such as walk-in clinics and urgent care). Over the near term, retail landlords will continue to face the weakest demand with malls and Class B/C centers in tertiary markets.
In 2018, new retail supply is projected to remain well below historical levels. In Q1, Dallas, Newark, Riverside, Fort Worth, and Tampa led in completions. New projects consist mainly of redevelopment at top mall, infill, and high-street locations. Recent completions are modeled after new, more efficient subtypes, such as unanchored lifestyle centers, town centers, and outlet centers, which are more vibrant, walkable, urban environments. Eighteen and 24-hour cities and premier suburbs offer more high-street, value-add, and repositioning strategies, and are also less at risk of store closures. Over the next decade, the industry expects some inventory growth in the Class A segment, with loss mainly concentrated at remote Class B/C malls. Looking ahead, we expect annual average deliveries to remain well-below the long-term average from 2018 to 2022.
In Q1, retail transaction volume totaled $13.2 billion, down 30.8% year-over-year. All segments reported significant annual declines; regional mall sales fell by 73.5%, and grocery declined by 47.1%. Trades of urban/storefront reported the smallest slowdown. In Q1, the NPI retail sub-index posted a total return of 0.7% and an annual return of 4.8%.
CLARION LION PROPERTIES FUND 6
6.A.1

Portfolio Performance
The Lion Properties Fund generated a first quarter total gross return of 2.56% (2.35% net of fees), comprised of 1.06% in income and 1.50% in appreciation, outperforming the ODCE Index by 36 bps. Debt mark-to-market was a larger component of appreciation this quarter, adding +29 bps to the overall return as underlying interest rates and actual borrowing rates have increased since the beginning of the year.
The Fund’s one-year trailing total gross return as of the first quarter was 8.93% (8.05% net of fees), comprised of 4.39% in income and 4.40% in appreciation, ahead of the ODCE total return by 86 bps. Over longer time periods, the Fund’s returns are strong, with its three-year annualized total gross return at 10.89% (9.96% net of fees), outpacing the ODCE Index by 90 bps. The Fund’s five-year annualized total gross return has been 12.05% (11.10% net of fees), ahead of ODCE by 62 bps and its seven-year annualized total gross return has been 12.14% (11.18% net of fees), ahead of ODCE by 35 bps.
The Fund’s operating performance continues to be very healthy, with the Fund projecting same property NOI growth of 3.3% for the year. Same property NOI was +2.2% ahead of budget for the first quarter. Industrial sector NOI is ahead of budget by +5.0%, with leaders including 3245 Meridian Parkway in South Florida, Research Tri-Center in Raleigh-Durham and Mile High Distribution Center in Denver. Office portfolio NOI is +3.3% ahead of budget, with The Lincoln in Miami, 101 Arch Street in Boston and One Victory Park in Dallas leading the sector. Retail sector NOI is ahead of budget by +2.5% through three months, with positive performance from Palm Beach Outlets in West Palm Beach, Westside Provisions District in Atlanta and 600 North Michigan Avenue in Chicago. Finally, apartment sector NOI is behind by -1.5%, mainly due to a handful of properties having slightly lower occupancy than budgeted.
Property values increased +1.0% (excluding developments) on a gross unlevered basis during the first quarter. The industrial sector remained the strongest, growing +2.2% for the quarter. Assets in Southern California led this group once again with large gains at Pacific Technology Park in San Diego, Mile High 4 in Denver, and two recently acquired Amazon warehouse assets: Principio Commerce Center along the I-95 corridor north of Baltimore and 500 Duke Drive in Nashville. Office sector values increased +1.5% during the quarter, led by 245 First Street in Cambridge and 101 Arch Street in Boston (strength of the local office market for both), as well as Waterway Plaza in The Woodlands area of Houston, based on strong leasing. Retail sector values increased only +0.2% over fourth quarter values, with a gain at West Hollywood Gateway in LA offset by declines at Chevy Chase Retail in Washington, DC and Palm Beach Outlets in West Palm Beach. The Fund’s apartment portfolio saw values decrease by -0.1% overall. A number of assets rose in value during the quarter, including several California assets and Eastchester Heights in the Bronx. However, a handful of apartment assets had value declines in submarkets that are receiving above-average new construction, including Printhouse Lofts in Brooklyn, Moda at North Bay Village in Miami and Railway Plaza in suburban Chicago.
There can be no assurance that the Fund’s investment objectives or target returns will be achieved.Past performance is not indicative of future results and a risk of loss exists. Please see Notes on pages 23-24 for additional disclosure information.
7 CLARION LION PROPERTIES FUND QUARTERLY REPORT 1Q18
MILE HIGH DISTRIBUTION CENTER, DENVER, CO
6.A.1

0
5
10
15
Since Inception10 Year7 Year5 Year3 Year1 YearQuarter
10.9%
8.1%
11.4%
2.2%2.6%
10.0%
8.9%
12.1%
Lion Properties Fund
NCREIF Fund Index (NFI-ODCE)
11.8%12.1%
4.0%
5.1%
7.7%8.3%
0
5
10
15
Since Inception10 Year7 Year5 Year3Year1 YearQuarter
10.0%
7.1%
2.0%2.3%
9.0%
8.0%
11.1%
Lion Properties Fund
NCREIF Fund Index (NFI-ODCE)
10.4%11.2%
6.8%7.3%
10.8%
3.1%
4.2%
GROSS OF FEES
NET OF FEES
Performance Versus NFI-ODCE
CLARION LION PROPERTIES FUND 8
Past performance is not indicative of future results and a risk of loss exists. Please see Notes on pages 23-24 for additional disclosure information.
6.A.1

GEOGRAPHIC REGION ALLOCATION VERSUS NPI
0
10
20
30
40
WestSouthMidwestEast
22.5%
8.5%
35.0%32.7%
36.2%
20.1%
6.3%
38.7%
Lion Properties Fund
NCREIF Property Index (NPI)
GEOGRAPHIC REGION PERFORMANCE VERSUS NPI - ONE-YEAR
0
5
10
15
WestSouthMidwestEast
7.0%
5.5%6.1%
5.4%4.8%
6.9%
11.8%
Lion Properties Fund
NCREIF Property Index (NPI)
9.1%
Weightings and Sector Performance
Past performance is not indicative of future results and a risk of loss exists.Please see Notes on pages 23-24 for additional disclosure information.
9 CLARION LION PROPERTIES FUND QUARTERLY REPORT 1Q18
6.A.1
Past performance is not indicative of future results and a risk of loss exists. Please see Notes on pages 23-24 for additional disclosure information.
CLARION LION PROPERTIES FUND 10
PROPERTY TYPE ALLOCATION VERSUS NPI
PROPERTY TYPE PERFORMANCE VERSUS NPI - ONE-YEAR
0
10
20
30
40
23.9%
26.4%
36.8%
33.8%
15.6%
19.1%
23.0%
Lion Properties Fund
NCREIF Property Index (NPI)
0.7%
20.7%
RetailIndustrialApartmentO�ce Other
0.0%
0
5
10
15
RetailIndustrialApartmentO�ce
10.9%
6.4%6.5%6.6%
9.2%
13.5%
Lion Properties Fund
NCREIF Property Index (NPI)
5.1% 4.8%
6.A.1

Past performance is not indicative of future results and a risk of loss exists. Please see Notes on pages 23-24 for additional disclosure information.
Investment Activity
ACQUISITIONS
DISPOSITIONS
DATE PROPERTY NAME TYPEOWNERSHIP
SHARE LOCATION MARKET
PURCHASE PRICE AT SHARE
($ MILLIONS)
01/12/18 8870 Washington Office 100.0% Culver City, CA Los Angeles 28.0
02/01/18 Bronx Apartment Portfolio Apartment 92.7% Bronx, NY New York 65.8
02/27/18 Watermark Seaport Apartment 100.0% Boston, MA Boston 238.8
03/01/18 Gateway Towne Center Retail 100.0% Compton, CA Los Angeles 85.6
Total 418.1
DATE PROPERTY NAME TYPEOWNERSHIP
SHARE LOCATION MARKET
LAST APPRAISED
VALUE AT SHARE
($ MILLIONS)
SALES PRICE
AT SHARE ($ MILLIONS)
01/09/18 Chevy Chase Hotel Hotel 100.0% Washington, DC Washington, DC 58.5 58.5
Total 58.5 58.5
The Fund completed four acquisitions during the first quarter totaling $418.1 million and one disposition for $58.5 million. New acquisitions included one office property with a small retail component, one urban shopping center, one Class A+ apartment building and one workforce housing portfolio.
The office/retail property, 8870 Washington, was acquired for $28.0 million. The property contains 29,723 square feet of creative office space with a small retail boutique located in Culver City in West LA. The property is located one block west of the Fund’s development project at 8777 Washington, which has been leased in its entirety to Apple on a build-to-suit basis. 8870 Washington is leased to two tenants (one office, one retail) with a weighted average lease term of ten years, and while the property is stabilized for term, the dynamic infill location could provide the opportunity for future redevelopment.
The Fund made two apartment sector investments during the quarter, emblematic of its overall strategy to assemble a portfolio diversified across the luxury, Class B and workforce housing spectrum. The first was a portfolio of five workforce housing apartment buildings with 372 rent-stabilized units located in the NYC borough of the Bronx, that was acquired for $65.8 million (at share). The investment was made in joint venture with Taconic Investment Partners, who has extensive experience with this type of housing in New York, including a long history (in joint venture with the Fund) on Eastchester Heights, also located in the Bronx. The second was Watermark Seaport, a Class A+, 346-unit, LEED Gold, luxury apartment building located in the Seaport District of Boston, that was acquired for $238.8 million. The property was completed in 2016 and is made up of two interconnected structures, including a 17-story tower and a 6-story loft-style building. The Seaport District is a top submarket in Boston, where recent and in-process mixed-use development has transformed this area into a thriving urban live-work-play neighborhood.
The final acquisition for the quarter was Gateway Towne Center, a 281,771-square foot regional shopping center located in Compton, approximately 12 miles south of downtown Los Angeles, which was acquired for $85.6 million. The Property is 99% leased to a mix of regional and national retailers including Home Depot, Ross, Best Buy, 24-Hour Fitness, Aldi, and shadow-anchored by Target. The center is considered urban-infill as it is proximate to dense residential neighborhoods as well as a large daytime population. The Fund continues to take a cautious stance to the retail sector overall and is extremely selective in screening potential acquisitions. This property has a combination of strong demographics and sales productivity, strong tenancy which we believe is currently showing resistance to e-commerce disruption, and favorable current and prospective returns.
The Fund closed on one disposition during the quarter, selling the Chevy Chase Embassy Suites Hotel for $58.5 million. Chevy Chase Hotel is a 198-room hotel located in Washington, DC that the Fund acquired in 2005. This completes the Fund’s goal to reduce its hotel exposure to zero.
11 CLARION LION PROPERTIES FUND QUARTERLY REPORT 1Q18
6.A.1

Past performance is not indicative of future results and a risk of loss exists. Please see Notes on pages 23-24 for additional disclosure information.
CLARION LION PROPERTIES FUND 12
At March 31, 2018, Fund borrowings totaled approximately $2.6 billion at par value, consisting primarily of fixed rate loans, with an average maturity of 6.3 years and a weighted average interest rate of 4.1%. The Fund’s loan-to-value ratio increased over the quarter to 23.3% from 22.0% at year-end 2017. The Fund is expecting to keep its leverage ratio between 22-24% for the balance of 2018.
During the first quarter, the Fund closed on a $200 million mixed pool financing, secured by four industrial assets and two office assets. The Fund was able to lock in an attractive rate at the end of 2017 before interest rates began to rise in 2018. The mixed pool has a 3.73% fixed rate with a twelve-year term. The Fund also closed on a financing secured by the Bronx apartment portfolio it recently acquired. The loan amount was $38.5 million (at share) with a five-year term at a floating interest rate of one-month LIBOR plus 200 bps.
The Fund has $224.0 million of loans maturing in late 2018. The Fund anticipates issuing new series of private placement notes in order to refinance those maturities. The Fund has an additional $422.2 million maturing in 2019 that it expects to refinance. The 2018 and 2019 maturities carry high interest rates as they were originated during the global financial crisis, and the Fund expects its borrowing costs to decrease as these loans are retired.
ANNUAL DEBT MATURITIES ($ MILLIONS) 1
0
100
200
300
400
500
Fund Level Notes Individual Property Mortgages Pooled Property Mortgages
20202018 2019 20242021Avg. Interest
Rate 4.7% 5.7% 2.8% 4.2%
20293.9%
2027
3.7%
224.0
422.2
297.0
73.5
255.0
2023 2025 2026 2028
3.9% 3.4%
100.0
363.5
3.5% 3.6%
183.0
150.0
2022—
2030
3.7%
200.0
50.5
288.0
3.7%
DEBT DIVERSIFICATION 1
Financial Management
Floating
Unsecured 45.1%
Fixed
Secured 54.9%
12.6%87.4%
1 Amounts represent the principal balance at the Fund’s ownership share and exclude the impact of debt mark-to-market.
AMOUNT AT SHARE
($ MILLIONS)AVERAGE
INTEREST RATE
AVERAGE REMAINING TERM
(YEARS)
Unsecured Fund Level Notes 1,175 4.4% 6.2
Secured Property Mortgages 1,432 3.9% 6.4
Fixed 2,279 4.2% 6.8
Floating 328 3.4% 3.3
Total Debt (Par Value) 2,607 4.1% 6.3
Total Debt (FMV) 2,596 4.1% 6.3
6.A.1

Past performance is not indicative of future results and a risk of loss exists. Please see Notes on pages 23-24 for additional disclosure information.
DIVISION
Northeast
Mideast
Southeast
Southwest
East North Central
West North Central
Mountain
Pacific
Occupancy and Leasing
Diversification
STRUCTURE
Wholly Owned
Joint Venture
86.3%
13.7%
95.4%
1.7%
1.7%
1.1%
0.1%
Office
Apartment
Industrial
Retail
33.8%
26.4%
20.7%
19.1%
25.3%
10.9%
10.7%
11.8%
5.6%
0.7%
5.1%
29.9%
PROPERTYTYPE 2018 2019 2020 2021 2022 2023+
Office 92.9% 3.5% 8.2% 8.2% 8.7% 12.8% 58.6%
Industrial 95.7% 8.4% 9.7% 13.5% 11.5% 14.6% 42.3%
Retail 91.6% 3.7% 7.0% 11.8% 7.5% 7.1% 62.9%
Apartment 94.0% N/A N/A N/A N/A N/A N/A
Total 93.5% 6.8% 9.1% 12.3% 10.4% 13.2% 48.2%
FISCAL YEAR COMMERCIAL LEASE ROLLOVER (% OF TOTAL RENTABLE SQUARE FEET)MARCH 31, 2018 OCCUPANCY
BY GROSS REAL ESTATE VALUE
PROPERTY TYPE
13 CLARION LION PROPERTIES FUND QUARTERLY REPORT 1Q18
During the first quarter, 58 commercial leases were signed, totaling 1.1 million square feet. The Fund’s occupancy ended the quarter at 93.5%, slightly down from 93.6% last quarter. Occupancy remains strong across all property types. Industrial occupancy decreased –1.2% to 95.7%, but still remains especially strong. The decrease was attributable to two assets: 3245 Meridian Parkway in South Florida where the existing single-tenant went bankrupt and was evicted, and 7400 Hazard in Anaheim CA where its single tenant vacated at the end of its lease. Subsequent to quarter end, the Fund was able to execute a lease for 74% of the space at 7400 Hazard and an existing subtenant occupies 50% of the space at 3245 Meridian Parkway, demonstrating the strength in demand in the sector. The apartment sector remained at 94.0% occupancy from the prior quarter with no assets having either significant increases or decreases. For the office portfolio, occupancy increased minimally, +0.2% to 92.9%, driven by increases at The Overlook in Austin, where the building was leased to 100.0% from 80.0%, and The Lincoln Office, which expanded a new tenant’s space by an additional 9,000 square feet. These increases in occupancy were offset by a drop at Chevy Chase Office, where the Fund had to evict a tenant that occupied over 19,000 square feet. Retail sector occupancy increased +0.6% quarter over quarter to 91.6% as a result of executing a lease at Promenade at Sacramento Gateway in Sacramento with TJ Maxx for 21,000 square feet, bringing the property’s occupancy to 77.3%.
Operating
Leasing
Development
Re-Development
Initial Leasing
LIFECYCLE 1
1 Excludes committed future costs.
6.A.1

CLARION LION PROPERTIES FUND 14
Clarion Partners seeks exceptional investment returns by responsibly investing and managing high performance, high quality, environmentally responsible, healthy, and productive places to live, work, shop, and stay that are beneficial to our local communities. In May 2013, Clarion Partners signed the United Nations-backed Principles for Responsible Investment, strengthening our commitment to incorporating environmental, social, and governance issues into our investment decisions. Clarion is also an active corporate member of the U.S. Green Building Council and the Urban Land Institute’s Sustainable Building Council.
Across the Firm, we are committed to exploring and implementing sustainable development and operational guidelines for our investments. We have registered all applicable office buildings under the EPA Energy Star program and are also pursuing LEED (Leadership in Energy & Environmental Design) certification wherever cost-effective. We regularly assess opportunities to integrate energy efficiency improvements through our capital projects and in new developments. These projects include skylights and daylighting, reflective white roofing, energy efficient lighting, water efficient irrigation systems, low E glass, shade features, recyclable materials and shop assembled subsystems that reduce on-site waste (i.e., precast panels), low-volatile organic compound emitting materials, motion and occupancy lighting sensors, and electric vehicle charging stations. Clarion also works closely with tenants on implementing efficiency capital projects while educating them on how to operate more efficiently and cost effectively. This not only lowers costs but also enhances the tenant/landlord relationship, building loyalty to the Firm’s projects over time.
Commitment to Sustainability
First Quarter Sustainability HighlightVELO APARTMENTS, MINNEAPOLIS, MNPROPERTY HIGHLIGHTS
101-unit, urban, Class A apartment with an additional 11,697 square foot ground floor retail component.
The Property is located immediately north of downtown Minneapolis in the North Loop’s desirable Warehouse District, which is known for its architectural significance, and since the mid-1990’s, has experienced significant gentrification highlighted by the conversion of old factories and warehouses into commercial space, apartments, restaurants, bars, art galleries, and boutique retail stores.
Unit amenities include granite countertops, stainless steel appliances, espresso cabinets and in-unit washers and dryers.
Community amenities include a fitness studio, yoga studio, outdoor grilling station and a bocce ball court.
SUSTAINABILITY HIGHLIGHTS
Currently pursuing LEED Certification.
Variable frequency drives are installed on all mechanical equipment to efficiently control and reduce electrical consumption.
Low-flow plumbing fixtures reduce building usage by approximately 30%.
The Property features LED lighting, which are 52% more efficient than the previous metal halide systems.
Common area amenity lighting synced to motion sensors for optimal energy savings.
Guidance is provided to tenants on sustainable cleaning, energy efficiency, pest control, and recycling.
6.A.1

Clarion Lion Properties FundCombined Statements of Assets, Liabilities and Equity (In $ Thousands, Except Share Data - Unaudited)
MARCH 31, 2018 DECEMBER 31, 2017
ASSETS
Real estate investments, at fair value 9,732,143 9,313,035
Investments in non-consolidated joint ventures, at fair value 1 836,109 767,676
Investments in real estate loans, at fair value 79,200 79,010
Total investments 10,647,452 10,159,721
Cash and cash equivalents 144,105 313,650
Rents and other receivables, net of allowance for doubtful accounts 20,479 24,610
Notes receivable 28,389 28,304
Other assets 21,638 60,788
Total assets 10,862,063 10,587,073
LIABILITIES AND EQUITY
Liabilities:
Mortgage notes payable, at fair value 1,072,857 881,779
Senior notes payable, at fair value 1,174,674 1,188,789
Accounts payable and accrued expenses 282,200 519,853
Other liabilities 68,581 119,929
Total liabilities 2,598,312 2,710,350
Equity:
Clarion Lion Properties Fund partners’ equity 8,179,888 7,793,406
Non-controlling interests 83,863 83,317
Total equity 8,263,751 7,876,723
Total liabilities and equity 10,862,063 10,587,073
Outstanding Fund shares 5,653,594 5,470,096
Value per Fund share 1,446.83 1,424.71
Note 1: Investments in Non-consolidated Joint Ventures (In $ Thousands - Unaudited)
PARTNERSHIP ASSETS
Real estate investments, at fair value 1,179,546 1,082,041
Cash and cash equivalents 21,877 14,965
Other assets 15,116 12,840
Total assets 1,216,539 1,109,846
PARTNERSHIP LIABILITIES
Mortgage notes payable, at fair value 348,759 314,722
Other liabilities 23,920 19,489
Total liabilities 372,679 334,211
Partnership equity 843,860 775,635
Investment level adjustments (7,751) (7,959)
Total investments in non-consolidated joint ventures 836,109 767,676
Financial Statements
15 CLARION LION PROPERTIES FUND QUARTERLY REPORT 1Q18
Past performance is not indicative of future results and a risk of loss exists.Please see Notes on pages 23-24 for additional disclosure information.
6.A.1

Past performance is not indicative of future results and a risk of loss exists.Please see Notes on pages 23-24 for additional disclosure information.
Clarion Lion Properties FundCombined Statements of Operations (In $ Thousands - Unaudited)
YEAR-TO-DATE
MARCH 31, 2018 MARCH 31, 2017
REVENUES
Rental revenue 146,471 140,156
Hotel revenue 104 5,808
Interest income 3,008 1,447
Other revenue 11,105 7,613
Total revenues 160,688 155,024
EXPENSES
Real estate operating expenses 25,540 24,398
Real estate taxes and insurance 25,878 24,340
Hotel expenses 573 5,939
Other expenses 3,736 3,807
Total expenses 55,727 58,484
Net operating income 104,961 96,540
Equity income from non-consolidated joint ventures 6,300 7,023
Interest expense and other financing costs (24,701) (22,909)
Net investment income 86,560 80,654
REALIZED AND UNREALIZED GAIN (LOSS)
Realized loss on sale of real estate investments (31,518) (47,820)
Reversal of previously recorded unrealized loss on sale of real estate investments 30,673 45,110
Net realized loss on sale of real estate investments (845) (2,710)
Realized gain on sale of non-consolidated joint venture investments - 6
Unrealized appreciation on real estate investments 94,848 97,867
Unrealized appreciation on non-consolidated joint venture investments 6,393 15,607
Unrealized appreciation on real estate loans 159 -
Unrealized appreciation (depreciation) on mortgage and senior notes payable 21,445 (886)
Net realized and unrealized gain 122,000 109,884
Net Income 208,560 190,538
Portion attributable to non-controlling interests (1,516) (4,580)
Net income attributable to Clarion Lion Properties Fund 207,044 185,958
Clarion Lion Properties FundCombined Statements of Changes in Equity(In $ Thousands - Unaudited)
CLARION LION PROPERTIES FUND
NON-CONTROLLING INTERESTS TOTAL
Total equity at December 31, 2017 7,793,406 83,317 7,876,723
Contributions 370,776 - 370,776
Distributions (82,000) (970) (82,970)
Redemptions (109,338) - (109,338)
Net income 207,044 1,516 208,560
Total equity at March 31, 2018 8,179,888 83,863 8,263,751
CLARION LION PROPERTIES FUND 16
6.A.1
Past performance is not indicative of future results and a risk of loss exists. Please see Notes on pages 23-24 for additional disclosure information.
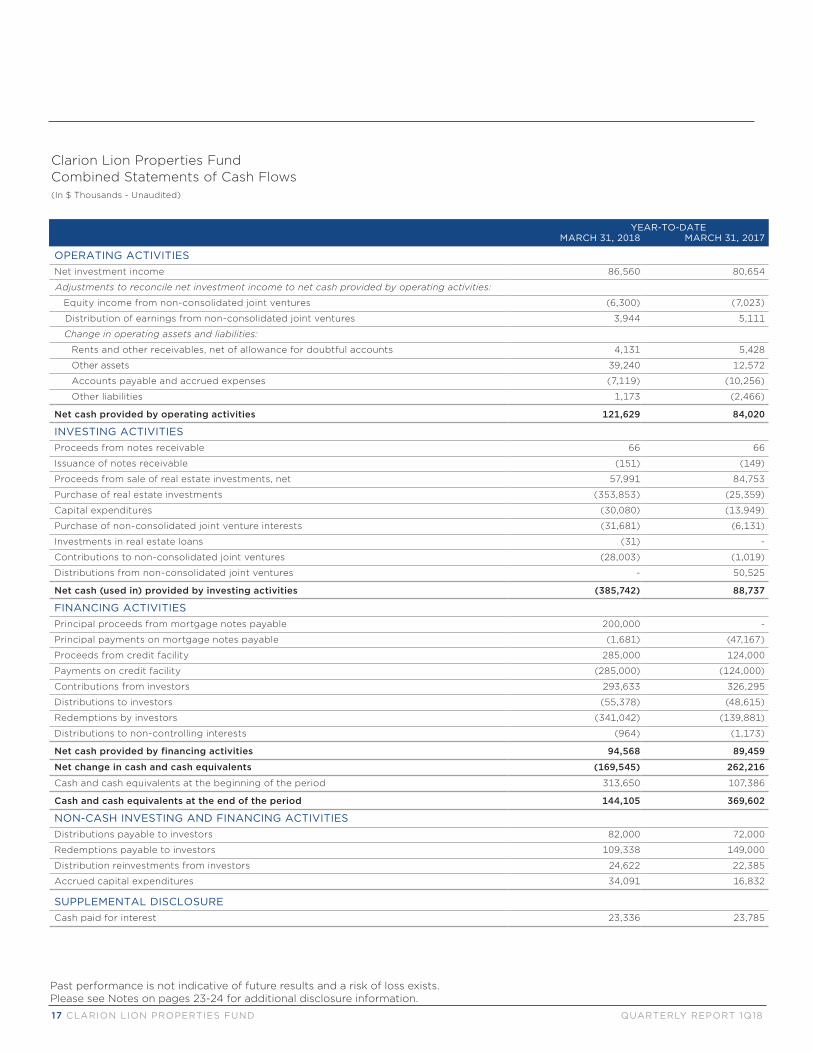
Clarion Lion Properties FundCombined Statements of Cash Flows (In $ Thousands - Unaudited)
MARCH 31, 2018 MARCH 31, 2017
OPERATING ACTIVITIESNet investment income 86,560 80,654
Adjustments to reconcile net investment income to net cash provided by operating activities:
Equity income from non-consolidated joint ventures (6,300) (7,023)
Distribution of earnings from non-consolidated joint ventures 3,944 5,111
Change in operating assets and liabilities:
Rents and other receivables, net of allowance for doubtful accounts 4,131 5,428
Other assets 39,240 12,572
Accounts payable and accrued expenses (7,119) (10,256)
Other liabilities 1,173 (2,466)
Net cash provided by operating activities 121,629 84,020
INVESTING ACTIVITIESProceeds from notes receivable 66 66
Issuance of notes receivable (151) (149)
Proceeds from sale of real estate investments, net 57,991 84,753
Purchase of real estate investments (353,853) (25,359)
Capital expenditures (30,080) (13,949)
Purchase of non-consolidated joint venture interests (31,681) (6,131)
Investments in real estate loans (31) -
Contributions to non-consolidated joint ventures (28,003) (1,019)
Distributions from non-consolidated joint ventures - 50,525
Net cash (used in) provided by investing activities (385,742) 88,737
FINANCING ACTIVITIESPrincipal proceeds from mortgage notes payable 200,000 -
Principal payments on mortgage notes payable (1,681) (47,167)
Proceeds from credit facility 285,000 124,000
Payments on credit facility (285,000) (124,000)
Contributions from investors 293,633 326,295
Distributions to investors (55,378) (48,615)
Redemptions by investors (341,042) (139,881)
Distributions to non-controlling interests (964) (1,173)
Net cash provided by financing activities 94,568 89,459
Net change in cash and cash equivalents (169,545) 262,216
Cash and cash equivalents at the beginning of the period 313,650 107,386
Cash and cash equivalents at the end of the period 144,105 369,602
NON-CASH INVESTING AND FINANCING ACTIVITIESDistributions payable to investors 82,000 72,000
Redemptions payable to investors 109,338 149,000
Distribution reinvestments from investors 24,622 22,385
Accrued capital expenditures 34,091 16,832
SUPPLEMENTAL DISCLOSURECash paid for interest 23,336 23,785
YEAR-TO-DATE
17 CLARION LION PROPERTIES FUND QUARTERLY REPORT 1Q18
6.A.1

Property List
CLARION LION PROPERTIES FUND 18
Past performance is not indicative of future results and a risk of loss exists.Please see Notes on pages 23-24 for additional disclosure information.
OFFICE
PROPERTY NAME LOCATION REAL ESTATE VALUE AT SHARE ($)
245 First Street Cambridge, MA 383,000,000
100 Fifth Avenue New York, NY 336,000,000
475 Brannan Street San Francisco, CA 275,000,000
Arboretum Gateway Santa Monica, CA 252,000,000
101 Arch Street Boston, MA 244,000,000
One Victory Park Dallas, TX 206,000,000
Sand Hill Commons Menlo Park, CA 178,666,073
Veritas Office Building Houston, TX 164,100,000
Waterway Plaza I & II The Woodlands, TX 157,000,000
60 Spear San Francisco, CA 154,000,000
10 Brookline Place Brookline, MA 144,000,000
EmeryTech Emeryville, CA 112,000,000
350 Rhode Island San Francisco, CA 110,000,000
Chevy Chase—Office Washington, DC 100,514,000
Plaza East Bellevue, WA 92,500,000
One Liberty Square Boston, MA 85,500,000
Perry Brooks Tower Austin, TX 81,700,000
One Del Mar San Diego, CA 69,600,000
The Lincoln—Office Miami, FL 65,815,000
575 Lexington 1 New York, NY 59,200,000
Ten West Corporate Center Two Houston, TX 55,400,000
Mira Vista Austin, TX 50,600,000
3150 Fairview Park Falls Church, VA 48,700,000
8777 Washington Culver City, CA 48,600,000
Arques Business Park Sunnyvale, CA 37,700,000
2901 Patrick Henry Drive Santa Clara, CA 36,800,000
8870 Washington Culver City, CA 28,091,722
Ricoh Building Malvern, PA 26,700,000
El Dorado Medical Tucson, AZ 24,300,000
American Stock Exchange—Office 2 New York, NY 20,650,000
The Overlook Austin, TX 19,300,000
1475 Dunwoody Drive West Chester, PA 18,900,000
Market Station—Office 2 Denver, CO 5,736,154
Total Office 3,692,072,949
1 Mezzanine loan investment.2 Under development.
6.A.1

19 CLARION LION PROPERTIES FUND QUARTERLY REPORT 1Q18
Past performance is not indicative of future results and a risk of loss exists.Please see Notes on pages 23-24 for additional disclosure information.
APARTMENT
PROPERTY NAME LOCATION REAL ESTATE VALUE AT SHARE ($)
Watermark Seaport Boston, MA 240,119,026
The Acadia at Metropolitan Park Arlington, VA 216,000,000
Eastchester Heights Bronx, NY 186,300,000
Columbia Town Center Columbia, MD 148,000,000
The Millennium at Metropolitan Park Arlington, VA 142,000,000
Avignon Townhomes Redmond, WA 140,000,000
1000 Jefferson Hoboken, NJ 140,000,000
Westbrooke Place Washington, DC 123,000,000
Parkway Lofts Bloomfield, NJ 118,000,000
Moda at North Bay Village North Bay Village, FL 113,000,000
Railway Plaza Naperville, IL 108,800,000
Infinity Harbor Point Stamford, CT 107,000,000
Desert Club Apartments Phoenix, AZ 98,700,000
The Station at Riverfront Park Denver, CO 87,100,000
Missions at Chino Hills Chino Hills, CA 76,500,000
Sunnyvale Kifer 1 Sunnyvale, CA 67,851,040
Montclair Residences Montclair, NJ 67,000,000
Oak View at Sonoma Hills Rohnert Park, CA 60,700,000
Lantana Ridge Austin, TX 60,500,000
Park 5940 MD Dallas, TX 57,400,000
Junction 15 Plano, TX 54,100,000
Balboa Park San Diego, CA 53,000,000
44 Berry Street Brooklyn, NY 50,700,000
Remington at Ladera Ranch Ladera Ranch, CA 44,000,000
Katahdin Woods Lexington, MA 42,500,000
The Paxon Minneapolis, MN 40,200,000
Grand on Memorial Houston, TX 33,800,000
Velo Minneapolis, MN 31,300,000
Printhouse Lofts Brooklyn, NY 30,700,000
Rochester Apartments Los Angeles, CA 29,340,000
Sunroad Centrum Apartments 2 San Diego, CA 20,000,000
1098 Gerard Avenue Bronx, NY 19,147,116
2543 Decatur Avenue Bronx, NY 18,547,346
Market Station—Apartment 1 Denver, CO 14,944,724
Azola at Magnolia Park 1 Riverview, FL 11,530,212
2608 Creston Avenue Bronx, NY 11,266,738
1065 Jerome Avenue Bronx, NY 9,272,308
2353 Crotona Avenue Bronx, NY 9,028,755
Total Apartment 2,881,347,265
1 Under development.2 B-note loan investment.
6.A.1

CLARION LION PROPERTIES FUND 20
Past performance is not indicative of future results and a risk of loss exists.Please see Notes on pages 23-24 for additional disclosure information.
INDUSTRIAL
PROPERTY NAME LOCATION REAL ESTATE VALUE AT SHARE ($)
Cranbury Station Cranbury, NJ 170,000,000
Research Tri-Center Durham, NC 155,600,000
Pacific Technology Park San Diego, CA 123,000,000
Principio Commerce Center North East, MD 118,000,000
Pompano Business Center Pompano Beach, FL 80,400,000
Northpoint Industrial Coppell, TX 79,900,000
500 Duke Drive Lebanon, TN 79,300,000
Redlands Business Center Redlands, CA 78,600,000
Carmel Mountain San Diego, CA 77,000,000
16850 Heacock Street Moreno Valley, CA 76,300,000
Mile High Distribution Center Denver, CO 72,200,000
Knott Distribution Center Buena Park, CA 62,900,000
Miraloma Distribution Center Anaheim, CA 57,000,000
Pacific Coast Park II Fife, WA 56,300,000
Fairburn Distribution Center Palmetto, GA 55,400,000
Sycamore Collection Riverside, CA 49,900,000
Whittier Industrial Whittier, CA 47,200,000
Eden Rock 10 Hayward, CA 46,700,000
Durango Commerce Center Phoenix, AZ 46,100,000
1020 Airport 100 Way Hanover, MD 42,200,000
7400 Hazard Westminster, CA 41,500,000
Beltway Northwest Houston, TX 38,800,000
Seattle Distribution Center Seattle, WA 38,600,000
University Park Tech I & II San Antonio, TX 36,100,000
Patterson Pass Business Park Tracy, CA 36,100,000
Gateway Technology Center 1 Newark, CA 34,200,000
University Park Tech III & IV San Antonio, TX 33,200,000
Turnbull Canyon Distribution Center City of Industry, CA 28,300,000
3225 Meridian Parkway Weston, FL 28,300,000
3245 Meridian Parkway Weston, FL 27,900,000
Mile High 3 Denver, CO 24,300,000
Guhn Road Distribution Center Houston, TX 23,900,000
Waters Ridge Distribution Center Lewisville, TX 23,400,000
Chino International Chino, CA 22,800,000
1 Under development.
6.A.1
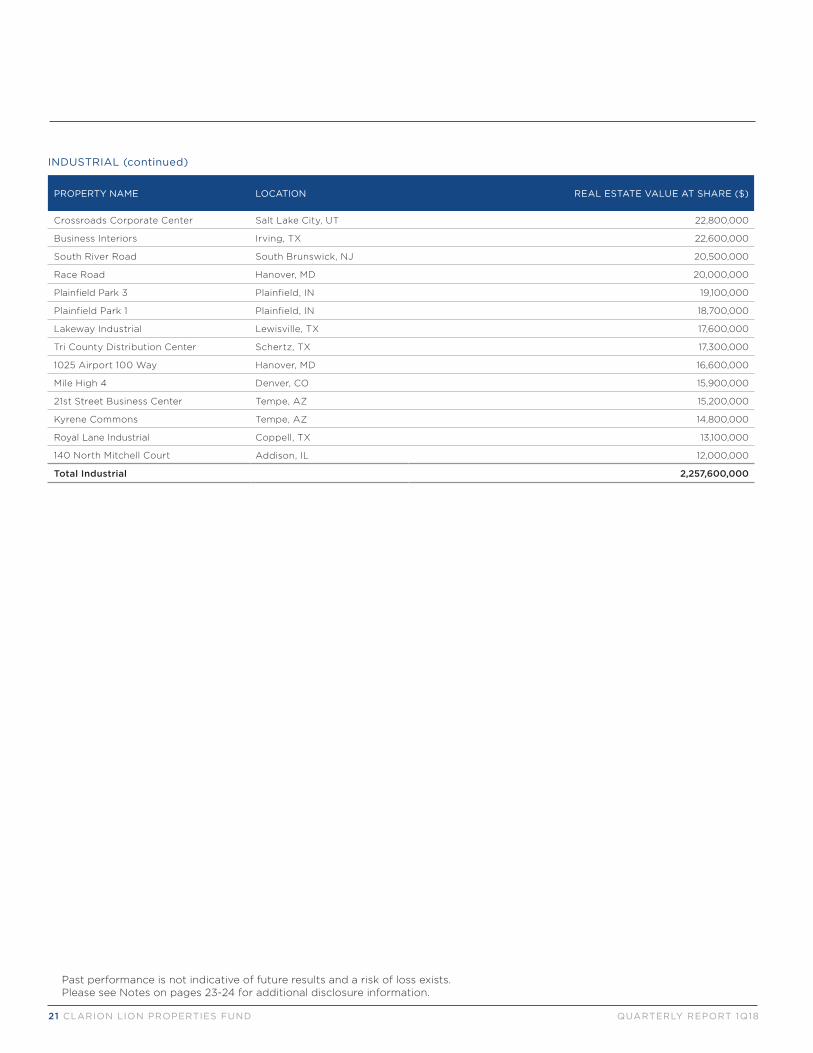
INDUSTRIAL (continued)
PROPERTY NAME LOCATION REAL ESTATE VALUE AT SHARE ($)
Crossroads Corporate Center Salt Lake City, UT 22,800,000
Business Interiors Irving, TX 22,600,000
South River Road South Brunswick, NJ 20,500,000
Race Road Hanover, MD 20,000,000
Plainfield Park 3 Plainfield, IN 19,100,000
Plainfield Park 1 Plainfield, IN 18,700,000
Lakeway Industrial Lewisville, TX 17,600,000
Tri County Distribution Center Schertz, TX 17,300,000
1025 Airport 100 Way Hanover, MD 16,600,000
Mile High 4 Denver, CO 15,900,000
21st Street Business Center Tempe, AZ 15,200,000
Kyrene Commons Tempe, AZ 14,800,000
Royal Lane Industrial Coppell, TX 13,100,000
140 North Mitchell Court Addison, IL 12,000,000
Total Industrial 2,257,600,000
21 CLARION LION PROPERTIES FUND QUARTERLY REPORT 1Q18
Past performance is not indicative of future results and a risk of loss exists.Please see Notes on pages 23-24 for additional disclosure information.
6.A.1
CLARION LION PROPERTIES FUND 22
Past performance is not indicative of future results and a risk of loss exists.Please see Notes on pages 23-24 for additional disclosure information.
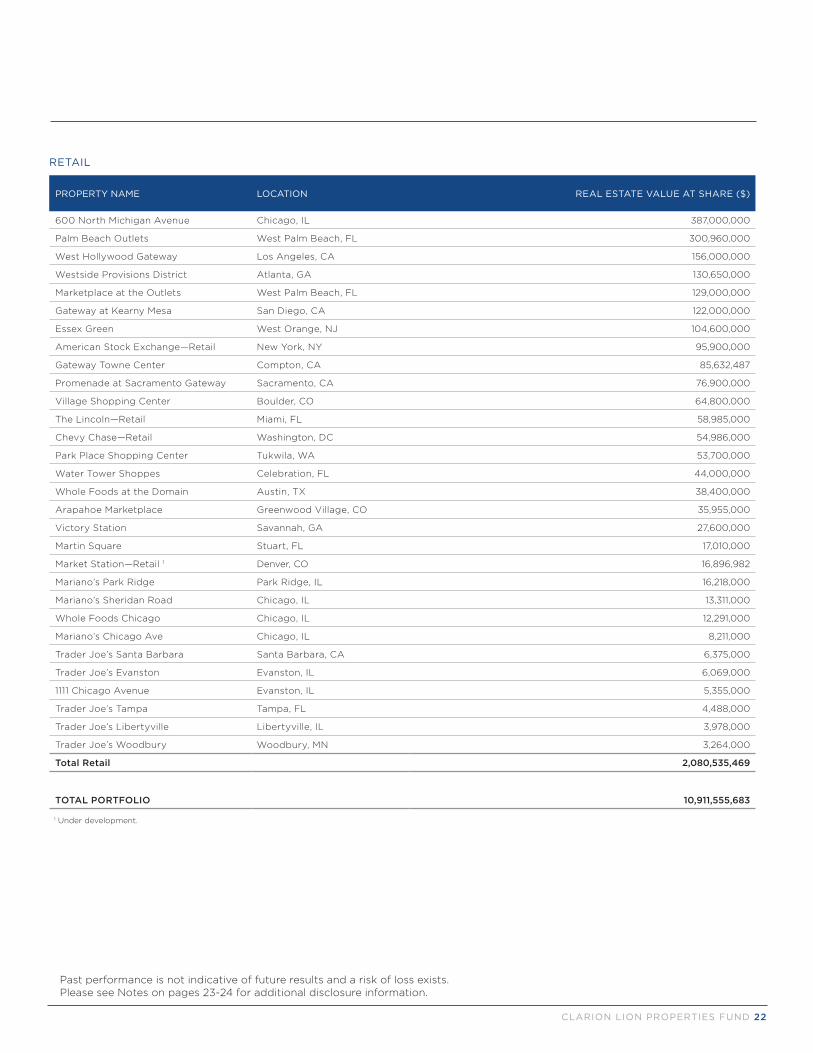
RETAIL
PROPERTY NAME LOCATION REAL ESTATE VALUE AT SHARE ($)
600 North Michigan Avenue Chicago, IL 387,000,000
Palm Beach Outlets West Palm Beach, FL 300,960,000
West Hollywood Gateway Los Angeles, CA 156,000,000
Westside Provisions District Atlanta, GA 130,650,000
Marketplace at the Outlets West Palm Beach, FL 129,000,000
Gateway at Kearny Mesa San Diego, CA 122,000,000
Essex Green West Orange, NJ 104,600,000
American Stock Exchange—Retail New York, NY 95,900,000
Gateway Towne Center Compton, CA 85,632,487
Promenade at Sacramento Gateway Sacramento, CA 76,900,000
Village Shopping Center Boulder, CO 64,800,000
The Lincoln—Retail Miami, FL 58,985,000
Chevy Chase—Retail Washington, DC 54,986,000
Park Place Shopping Center Tukwila, WA 53,700,000
Water Tower Shoppes Celebration, FL 44,000,000
Whole Foods at the Domain Austin, TX 38,400,000
Arapahoe Marketplace Greenwood Village, CO 35,955,000
Victory Station Savannah, GA 27,600,000
Martin Square Stuart, FL 17,010,000
Market Station—Retail 1 Denver, CO 16,896,982
Mariano’s Park Ridge Park Ridge, IL 16,218,000
Mariano’s Sheridan Road Chicago, IL 13,311,000
Whole Foods Chicago Chicago, IL 12,291,000
Mariano’s Chicago Ave Chicago, IL 8,211,000
Trader Joe’s Santa Barbara Santa Barbara, CA 6,375,000
Trader Joe’s Evanston Evanston, IL 6,069,000
1111 Chicago Avenue Evanston, IL 5,355,000
Trader Joe’s Tampa Tampa, FL 4,488,000
Trader Joe’s Libertyville Libertyville, IL 3,978,000
Trader Joe’s Woodbury Woodbury, MN 3,264,000
Total Retail 2,080,535,469
TOTAL PORTFOLIO 10,911,555,683
1 Under development.
6.A.1
Notes
1. Investment in the Fund entails significant risks that investors should consider before making a decision to invest. An investor should only invest in the Fund as part of an overall investment strategy and only if the investor is able to withstand total loss of investment. Investments in the Fund can only be made pursuant to the Fund’s offering documents and private placement memorandum, which investors are advised to read carefully and pay special attention to the risk factors set forth therein.
2. Returns are presented beginning April 1, 2000, the Fund’s inception date.
3. Unless otherwise indicated, returns, including ODCE Index returns are presented on a gross of fee basis and do not reflect any expenses, management fees or incentive allocations which in the aggregate may be substantial and have the effect of reducing returns. Performance measurements against the ODCE Index are on a gross basis for both Fund and ODCE performance. There is no guarantee that the Fund will realize its investment objectives or that investors will receive a return of their capital. Both gross and net returns assume income reinvestment and take into account transaction costs. Net of fee returns reflect asset management fees. The Fund’s base management fees are charged as a percentage of net asset value ranging from effective rates of 0.85% to 1.10% per annum except for certain internal investors and investors whose interest exceeds $100 million, in which case fees may be negotiated with the Fund. Management fees are billed by Clarion Partners outside of the Fund and do not impact NAV.
4. The Fund’s total appreciation return consists of two components: property-level appreciation and the impact of debt marked to market. For the quarter ended March 31, 2018, the total quarterly appreciation return was 1.50%, comprised of a 1.21% property-level appreciation return and a 0.29% debt mark-to-market return.
5. Fund returns are calculated on an investment-level basis and include leverage, cash balances and interest income from short-term cash investments. Fund returns are generally compared to the NCREIF Fund Index Open-End Diversified Core Equity (NFI-ODCE). The NFI-ODCE is a capitalization-weighted, fund-level, time-weighted return index and includes property investments at ownership share, cash balances, and leverage (i.e., returns reflect the actual asset ownership positions and financing strategy of the funds included in the index). NFI-ODCE returns are presented gross and net of fees and are for illustrative purposes only. Investors cannot invest in an index.
6. Returns presented by property type and geographic region are presented at the investment level on an unlevered basis and compared to the NCREIF Property Index (NPI), which is an unlevered benchmark. NPI returns are presented at the property-level, before advisory fees and include primarily core operating properties, excluding ownership and financing structures (i.e., returns are based on 100% of property operations and are unlevered) and are for illustrative purposes only. Investors cannot invest in an index.
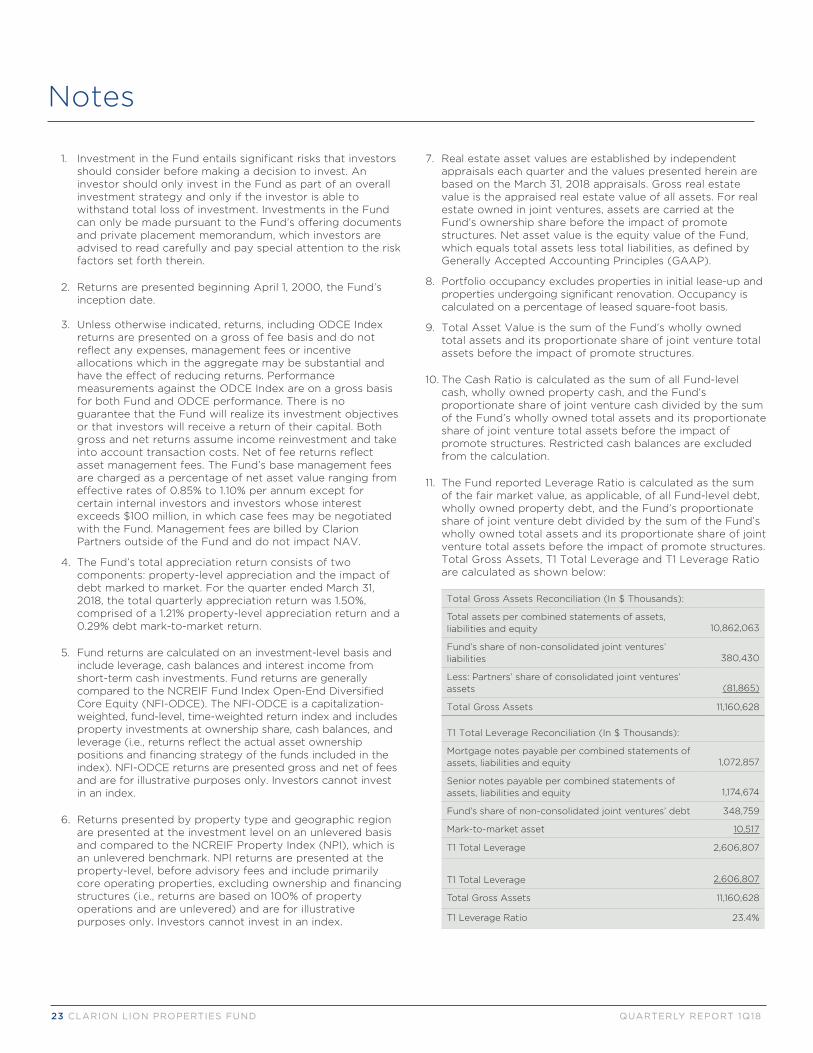
7. Real estate asset values are established by independent appraisals each quarter and the values presented herein are based on the March 31, 2018 appraisals. Gross real estate value is the appraised real estate value of all assets. For real estate owned in joint ventures, assets are carried at the Fund’s ownership share before the impact of promote structures. Net asset value is the equity value of the Fund, which equals total assets less total liabilities, as defined by Generally Accepted Accounting Principles (GAAP).
8. Portfolio occupancy excludes properties in initial lease-up and properties undergoing significant renovation. Occupancy is calculated on a percentage of leased square-foot basis.
9. Total Asset Value is the sum of the Fund’s wholly owned total assets and its proportionate share of joint venture total assets before the impact of promote structures.
10. The Cash Ratio is calculated as the sum of all Fund-level cash, wholly owned property cash, and the Fund’s proportionate share of joint venture cash divided by the sum of the Fund’s wholly owned total assets and its proportionate share of joint venture total assets before the impact of promote structures. Restricted cash balances are excluded from the calculation.
11. The Fund reported Leverage Ratio is calculated as the sum of the fair market value, as applicable, of all Fund-level debt, wholly owned property debt, and the Fund’s proportionate share of joint venture debt divided by the sum of the Fund’s wholly owned total assets and its proportionate share of joint venture total assets before the impact of promote structures. Total Gross Assets, T1 Total Leverage and T1 Leverage Ratio are calculated as shown below:
Total Gross Assets Reconciliation (In $ Thousands):
Total assets per combined statements of assets, liabilities and equity 10,862,063
Fund’s share of non-consolidated joint ventures’ liabilities 380,430
Less: Partners’ share of consolidated joint ventures’ assets (81,865)
Total Gross Assets 11,160,628
T1 Total Leverage Reconciliation (In $ Thousands):
Mortgage notes payable per combined statements of assets, liabilities and equity 1,072,857
Senior notes payable per combined statements of assets, liabilities and equity 1,174,674
Fund’s share of non-consolidated joint ventures’ debt 348,759
Mark-to-market asset 10,517
T1 Total Leverage 2,606,807
T1 Total Leverage 2,606,807
Total Gross Assets 11,160,628
T1 Leverage Ratio 23.4%
23 CLARION LION PROPERTIES FUND QUARTERLY REPORT 1Q18
6.A.1

Notes
12. Annual time-weighted returns are calculated by linking quarterly returns, using the formula below:
For annual returns, the sum of the return components may not equal the total gross return due to time-weighting (i.e., chain-linking) of quarterly returns.
13. Clarion Partners is a registered investment advisor under the Investment Advisers Act of 1940.
14. The information contained in this report has been obtained or derived from independent third party sources believed to be reliable. This report contains forward-looking statements relating to the plans, objectives, opportunities, future performance and business of the Fund and the future performance of the U.S. market generally. These forward-looking statements include statements regarding the current expectations, estimates, projections, opinions and beliefs of the Fund, as well as the assumptions on which those statements are based. Words such as “believes”, “expects”, “anticipates”, “intends”, “plans”, “estimates”, “projects”, “should” and “objective” and variations of such words and similar words also identify forward-looking statements. Such statements are forward-looking in nature and involve a number of known and unknown risks, uncertainties and other factors, and accordingly, actual results may differ materially from those reflected or contemplated in such forward-looking statements. No assurance can be given that the Fund’s investment objectives will be achieved or that investors will receive a return of their capital. Investors are cautioned not to place undue reliance on any forward-looking statements or examples included in this report and should bear in mind that past performance is not necessarily indicative of future results. None of the Fund, Clarion or any of their affiliates or principals nor any other individual or entity assumes any obligation to update any forward-looking statements as a result of new information, subsequent events or any other circumstances. Such statements speak only as of the date that they are originally made.
15. This report, including all exhibits and appendices, has been prepared and presented in compliance with the NCREIF PREA Reporting Standards, as determined by Clarion Partners.
Investment Income + Appreciation (Depreciation) Weighted Average Equity =
Beginning Net Asset Value + Time-Weighted Contributions – Time-Weighted Distributions
CLARION LION PROPERTIES FUND 24
6.A.1

REAL ESTATE INVESTMENT MANAGEMENT WWW.CLARIONPARTNERS.COM
ATLANTA
BOSTON
DALLAS
LONDON
LOS ANGELES
NEW YORK
SÃO PAULO
SEATTLE
WASHINGTON, DC
CLARION PARTNERS
230 PARK AVENUE NEW YORK, NY 10169212-883-2500
6.A.1