6a surface water assessment - supporting information · 6a surface water assessment - supporting...
TRANSCRIPT

Simandou SEIA Volume I Mine Annex 6A
6A-1
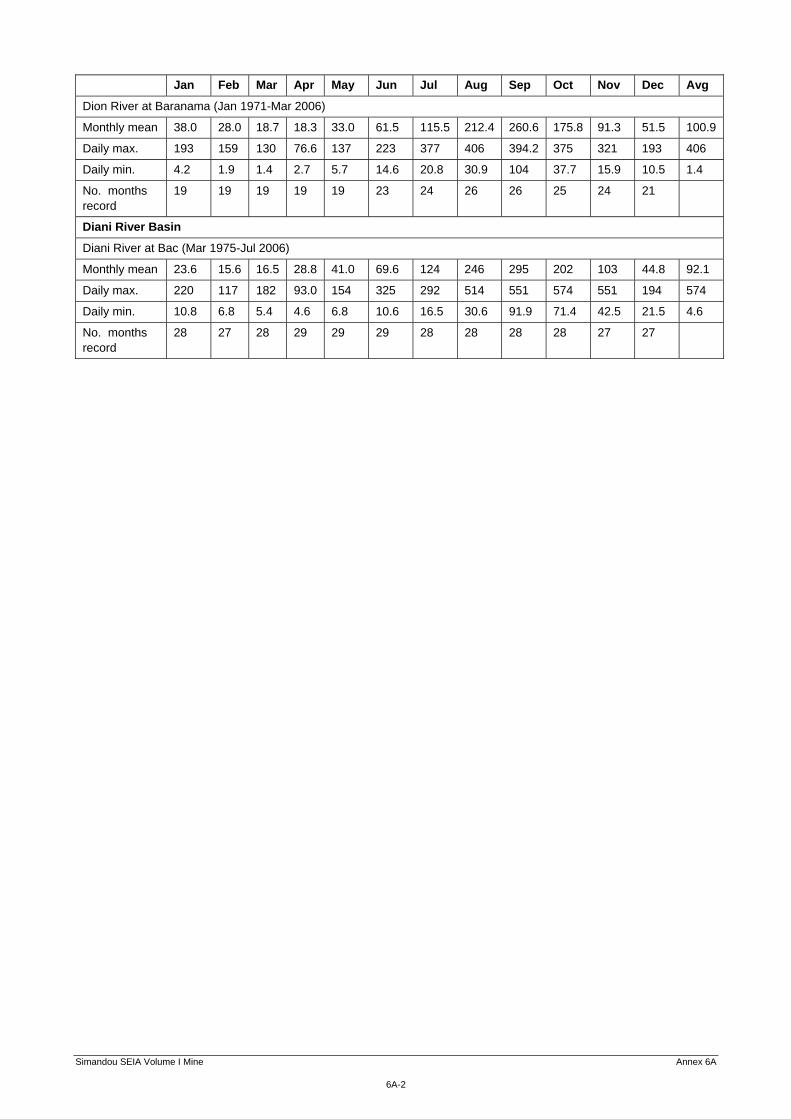
6A Surface Water Assessment - Supporting Information This annex to Chapter 6: Water Environment presents surface water baseline and modelling data that have been used in the undertaking of the impact assessment of the Simandou Mine that are not otherwise presented in the chapter. This annex presents information and data in the following sections: Section 6A.1 – Surface Water Flows; Section 6A.2 – Surface Water Quality; Section 6A.3 – Surface Water Users; and Section 6A.4 – Groundwater Modelling Results. 6A.1 Surface Water Flows The main rivers in Upper and Forest Guinea that lie downstream of the mining area are shown in Figure 6A.1 and characterised in Table 6A.1 and Figure 6A.2. The locations of the various gauging stations from which these data were compiled are shown in Figure 6A.1. As shown in Figure 6A.2, the annual hydrographs in all of the major rivers follow a similar pattern to those in Table 6A.1. Flows gradually increase following the onset of the rainy season in April / May, reach their peak around September and then tail off again to groundwater-fed baseflow conditions in January / February. The peak flows may arrive sooner in some of the smaller catchments, and the duration of the flood flow hydrograph will be longer in some of the larger catchments and also those in the south of the country where the rainfall season is more extended. Table 6A.1 Summary of Average Monthly Flows (m3/s) for Rivers Downstream of the Mine Site
Jan Feb Mar Apr May Jun Jul Aug Sep Oct Nov Dec Avg
Niger River Basin
Niger River at Tiguibery (May 1952-Dec 1979)
Monthly mean 267 139 82.1 63.5 91.7 331 1 015 2 349 3 782 3 216 1 465 569 1 114
Daily max. 644 342 254 218 487 1 840 3 440 5 230 6 700 7 170 5 630 2 080 7 170
Daily min. 65.4 36.7 15.8 15.8 20.2 36.7 137 602 1 600 949 346 150 15.8
No. months record
24 23 23 23 25 25 26 26 26 26 26 26
Milo River at Kankan (Jan 1952-Feb 2006)
Monthly mean 32.2 18.7 14.3 16.2 27.8 80.2 224 456 601 398 166 68.7 175
Daily max. 103.0 62.2 61.3 87.1 144.0 465.0 881.4 911.8 1022 1036 701.6 325.0 1 036
Daily min. 2.9 0.5 0.0 0.0 0.7 0.9 1.3 46.3 253.7 81.3 29.3 11.3 0
No. months record
47 47 46 46 46 45 45 44 45 45 45 45
Milo River at Kérouané (Aug 1970-Dec 1980)
Monthly mean 11.8 6.4 4.0 6.2 12.3 33.1 59.1 105 128 74.4 48.4 23.1 42.6
Daily max. 42.6 13.0 19.7 29.1 63.3 116 179 175 235 187 114 62.9 235
Daily min. 6.3 1.9 1.8 2.1 2.1 3.1 2.4 14.1 62.6 23.9 17.8 7.6 1.8
No. months record
3 4 5 5 6 5 6 8 8 7 7 6
Milo River at Konsankoro (Mar 1955-Dec 1980)
Monthly mean 7.8 6.2 6.8 9.2 11.8 27.4 45.8 67.9 83.9 49.9 22.9 13.0 29.4
Daily max. 24.8 21.9 40.6 58.7 128 308 341 340 385 322 177 58.7 385
Daily min. 4.2 1.3 0.9 1.0 1.6 2.0 1.6 8.8 8.2 1.6 1.6 2.8 0.9
No. months record
11 13 16 16 19 20 17 20 21 17 14 10
Simandou SEIA Volume I Mine Annex 6A
6A-2
Jan Feb Mar Apr May Jun Jul Aug Sep Oct Nov Dec Avg
Dion River at Baranama (Jan 1971-Mar 2006)
Monthly mean 38.0 28.0 18.7 18.3 33.0 61.5 115.5 212.4 260.6 175.8 91.3 51.5 100.9
Daily max. 193 159 130 76.6 137 223 377 406 394.2 375 321 193 406
Daily min. 4.2 1.9 1.4 2.7 5.7 14.6 20.8 30.9 104 37.7 15.9 10.5 1.4
No. months record
19 19 19 19 19 23 24 26 26 25 24 21
Diani River Basin
Diani River at Bac (Mar 1975-Jul 2006)
Monthly mean 23.6 15.6 16.5 28.8 41.0 69.6 124 246 295 202 103 44.8 92.1
Daily max. 220 117 182 93.0 154 325 292 514 551 574 551 194 574
Daily min. 10.8 6.8 5.4 4.6 6.8 10.6 16.5 30.6 91.9 71.4 42.5 21.5 4.6
No. months record
28 27 28 29 29 29 28 28 28 28 27 27

Faranah
Kouroussa
Kankan
Kerouane
Baro
Kissidougou
Mandiana
Tinkisso
Baranama
KérouanéDialakoro
Tiguibery
Madina
Seredo
Bac
Sérékoroba
Diamaradou
Konsankoro
M
ilo
Niandan
Milo
Tinki s soTinkisso
Nig
e r
Nige r
Tinkiss
o
Niandan
Moa
Nia ndan
Mil o
S
ankarani
S ew
a
Milo
Nig
e
r
Nig er
Ba fing
Niger
San
kara
ni
Mo a
G ouan (Bafin g)
Niger
St-Paul
M a l iM a l i
S i e r r aS i e r r aL e o n eL e o n e
C o t eC o t ed ' I v o i r ed ' I v o i r e
L i b e r i aL i b e r i a
8°0'0"W
8°0'0"W
9°0'0"W
9°0'0"W
10°0'0"W
10°0'0"W
11°0'0"W
11°0'0"W
11°3
0'0
"N
11°3
0'0
"N
10°2
0'0
"N
10°2
0'0
"N
9°1
0'0
"N
9°1
0'0
"N
8°0
'0"N
8°0
'0"N
300000
300000
400000
400000
500000
500000
600000
600000
9000
00
9000
00
1000
000
1000
000
1100
000
1100
000
1200
000
1200
000
1300
000
1300
000
Client: Taille: Titre:Légende:
Figure 6A.1
Lignes régionales de partage des eaux et réseau hydrométrique national dans la zone de la mine / Regional Watersheds and National Hydrometric Network in the Mining Area
Station hydrographique / Hydrographic Station
Station de jaugeage et d'échantillonnage de la qualité de l'eau (GIRENS) / River Gauging and Water Quality Monitoring Station (GIRENS)
Station de jaugeage (ouverte) / River Gauging Station (Open)
Station de jaugeage (fermée) / River Gauging Station (Closed)
Cours d'eau principale / Primary Watercourse
Cours d'eau secondaire / Secondary Watercourse
Cours d'eau tertiaire / Tertiary Watercourse
Bassin versant / WatershedRégional / Regional
Diani
Dion
Loffa
Milo
Niger
Frontière entre états / National Boundary
Projection: WGS 1984 UTM Zone 29N
File
: 01
312
99
Sim
and
ouG
IS_
IG_C
K\M
aps\
ER
M\H
ydro
log
y\M
ine\
Ma
y20
12_
revi
sion
s\A
nne
x_6A
\mi_
reg
Wa
ters
he
ds.m
xd
A4
G u i n e aG u i n e a
M a l iM a l i
S i e r r aS i e r r aL e o n eL e o n e
G u i n e a - B i s s a uG u i n e a - B i s s a u
S e n e g a lS e n e g a l
L i b e r i aL i b e r i a
0 50
kilomètres
Date: 06/06/2012
Dessiné par: WB
Vérifié par: TS
Approuvé par: KR
Projet: 0131299
Echelle: Comme barre d'échelle

Simandou SEIA Volume I Mine Annex 6A
6A-4
Figure 6A.2 Hydrogrammes saisonnier pour les principales rivières de la zone de la mine / Seasonal Hydrographs for Main Rivers in Mining Area

Simandou SEIA Volume I Mine Annex 6A
6A-5
The flow regime at Simandou is controlled by the seasonal rainfall regime. Figure 6A.3 shows the flow records at Whisky 1 and Whisky 2 weirs, which have catchment areas of 0.5 km2 and 0.4 km2 respectively. Also shown are daily rainfall records from Canga East rain gauge. While the wet season rainfall mostly begins in March, stream flows remain low until early July while soil moisture deficits are replenished. Flow increases from early July. Figure 6A.3 Flow Hydrographs in Whisky 1 and Whisky 2 Catchments
The increase in flow is likely to be caused by discharge from soil and groundwater stores in the hill slopes of the adjacent cangas that have been filling since the rains began. Seasonal flow remains high as long as rainfall continues. As rainfall declines in September / October the stores drain and flow recedes. The flow recession continues through the dry season, fed from the subsurface system. The ‘spikes’ in the graph are flood events which occur in response to heavy rainfall. Observations suggest that during the early and late parts of the rainy season storm hydrographs rise and recede rapidly with no substantial recessions. Overland flow close to the channels is likely to be the main mechanism generating storm hydrographs. During the middle of the rainy season hydrographs exhibit more prolonged recessions, indicating water discharging from a storage that has by then been filled. Storm flow percentages for individual storms on Whisky 1 and Whisky 2 catchments range from 5.1% to 31.2%. This range may be typical of other small mountain catchments of up to 1 km2 in area. To date no specific work has been done on lag times between start of rain or time of peak rainfall intensity and peak flow. However, lag times are typically of the order of a few tens of minutes on mountain catchments like Whisky 1 and Whisky 2. The hydrological regime of mountain streams draining Ouéléba and Pic de Fon, exemplified by the Whisky 1 and Whisky 2 records, is perennial, dominated by groundwater discharge (baseflow), and with a flashy storm runoff regime superimposed. This basic regime is maintained at stations downstream, such as the Loffa River at Foma Village (catchment area 191 km2) (Figure 6A.4).

Simandou SEIA Volume I Mine Annex 6A
6A-6
Figure 6A.4 Rainfall and Flow in the Loffa River at Foma, Pic de Fon
Baseflow (sometimes called slow flow) is normally considered to originate from the discharge of groundwater and / or soil water. Storm flow (sometimes called quick flow) is usually considered to result from overland flow, either from saturated areas close to stream channels or from slopes as a result of the exceedance of soil infiltration capacities by heavy rainfall. Some storm flow may also originate from rapid subsurface flow in the soil zone. High stream flows resulting from storm rainfall consist of storm flow. Low flow in between flood events or between one wet season and the next can be considered to be baseflow. Baseflow has been estimated for Simandou streams by separating it from the total flow hydrograph, as shown for the Loffa in Figure 6A.5. The resulting baseflow hydrographs are shown in Figure 6A.6. Figure 6A.5 Baseflow Separation for the Loffa River at Foma
0
20
40
60
80
100
120
140
160
180
2000
2
4
6
8
10
12
14
16
18
20
Daily Rainfall at Ca
nga East (m
m)
Flow
(m3/s)
0
2
4
6
8
10
12
14
16
18
20
Flow
(m3/s)
Total Flow
Baseflow

Simandou SEIA Volume I Mine Annex 6A
6A-7
Figure 6A.6 Seasonal Baseflow Hydrographs in Mine Catchments
In summary: the Western Spur River has the most constant baseflow regime of all rivers shown. This results from a
constant high discharge from groundwater storage in the Pic de Fon ore body and a buffering effect by the thick tropical forest reducing the stream flow response to rainfall in the wet season; and
other rivers which drain Pic de Fon or Ouéléba obtain varying degrees of support in the dry season from
the groundwater system within the ore bodies. The proportion of total flow made up of baseflow is a characteristic of a stream’s hydrological regime and is called the Base Flow Index (BFI). Table 6A.2 presents estimated values of BFI for the various catchments around the mine. Table 6A.2 Estimated Baseflow Index Values for Rivers in Simandou Area
River Baseflow Index Period of Record
Simandou Eastern Flank
Miya River at Nionsonmoridou 0.73 11 Aug 2007 to 29 Nov 2009
Loffa River at Canga Road 0.66 29 Nov 2007 to 17 Feb 2010
Boe River at Foma 0.61 31 Jan 2008 to 30 Dec 2009
Simandou Western Flank
Kinyeko River at Traoréla 0.81 24 Jan 2008 to 31 Jan 2010
Mala River at Traoréla 0.71 24 Jan 2008 to 30 Dec 2009
West Spur River at Mandou footpath 0.90 23 Feb 2008 to 10 Feb 2010
Whisky 2 weir 0.64 20 Nov 2005 to 1 Jan 2010
Pulowaye River at Banko 0.58 14 Feb 2008 to 30 Dec 2009
Wolou River at Banko 0.82 6 Aug 2008 to 9 Feb 2010
0.01
0.1
1
10
Aug‐07 Nov‐07 Feb‐08 May‐08 Aug‐08 Nov‐08 Feb‐09 May‐09 Aug‐09 Nov‐09 Feb‐10
Monthly Baseflow (m3/s )
Western Spur River
Kinyeko
Mala
Loffa at Canga Road
Miya River at Nionsonmoridou
Pulowaye at Banko
Wolou River at Banko
Dianiworo River at Tourela
Soumourou River at Gbonodou
Woron at Mandou
Woron River at Orono
Boe River at Foma

Simandou SEIA Volume I Mine Annex 6A
6A-8
River Baseflow Index Period of Record
Dianiworo River at Touréla 0.67 21 Feb 2008 to 30 Dec 2009
Woron River at Mandou 0.90 10 Feb 2008 to 29 Nov 2009
Woron River at Orono 0.71 16 Feb 2008 to 29 Nov 2009
Large (Regional) Rivers
Diani River at Bac Diani 0.79 1 Mar 1975 to 31 Dec 2006
Milo River at Konsankoro 0.53 1 Mar 1955 to 30 Aug 1990
Dion River at Baranama 0.88 1 Jan 1971 to 31 Mar 2006
In terms of the spatial pattern of flows across the mining area, Table 6A.3 presents an analysis of the spring survey carried out on the Pic de Fon and Ouéléba mountains in January and February 2008. Spring flow measurements are taken at the stream’s source, and are therefore more representative of baseflow than storm flow. The most significant observation is that between three and four times as much flow drains to the west as compared to the east on both mountains. In order to better understand the overall contribution to stream flows from the mountain aquifers, periodic flow measurements were performed along the length of the streams draining Pic de Fon and Ouéléba during the dry seasons of 2008 and 2009. Figure 6A.7 illustrates the flow contours derived from the 2008 dry season ‘flow accretion’ survey. Figures 6A.8 and 6A.9 summarise the results of the survey undertaken in January and February 2009, which also incorporated the wider regional stream network. Table 6A.3 Dry Season Flow in East and West Flank Springs, Jan-Feb 2008
Indicator
Pic de Fon Ouéléba
East West All East West All
Flow per spring (l/s)
0.16 0.77 0.40 0.13 0.25 0.21
Total flow (l/s)
16.5 54.3 70.6 4.4 16.5 20.9
No. springs
105 71 176 35 67 102
As shown, stream flow increases with distance downstream and the rate of increase appears to be relatively uniform to the east and west of the Ouéléba deposit. Conversely, there are significant differences in the rate of increase either side of the Pic de Fon deposit. On the west side there are specific points at which the flows increase very rapidly, notably on the Western Spur valley to the north-west and the Fokou valley to the

Simandou SEIA Volume I Mine Annex 6A
6A-9
south-west. This suggests a substantial groundwater discharge within these valleys. In all cases, there is initially a significant contribution to regional stream flows from the mountain, which diminishes downstream at a rate that depends on the growth in catchment area and the frequency and magnitude of tributary inflows. The relative importance of the mountain flow contribution reduces most quickly in the Loffa, Diani and Mala river catchments. Moreover, there is evidence of a fairly dynamic system of flow accretion and loss occurring along most of the streams moving away from the mountain. This further reduces the influence of on-hill groundwater discharges on regional stream flows downstream of the mining area.

Foma
Kankoro
CangaEast
Camp
Orono
LamandouMoribadou
Mamouroudou
Wataférédou II
Wataférédou ITraoréla Siatouro
110 15
30 35
40
35
2520
30
300
30
300
100
200150
1200
25
20
150
1
5
100
515 10
10
20
15
1
40
3530
25
20
5
1510
45
4035
30
25
20
15
11
510
8°50'0"W
8°50'0"W
8°40'0
"N
8°40'0
"N
8°30'0
"N
8°30'0
"N
505000
505000
510000
510000
515000
515000
520000
520000
9400
00
9400
00
9450
00
9450
00
9500
00
9500
00
9550
00
9550
0096
0000
Client: Taille: Titre:Légende:Figure 6A.7Ligne de courant dérivées de l’enquête 2008 d’accrétion des courants en saison sèche / Flow Contours Derived From 2008 Dry Season Flow Accretion Survey
Source d'eau répertoriée en saison sèche / Spring Locations (Dry Season Survey)Isocontour de débit (l/s) / Flow Isocontours (l/s)Agglomération / SettlementRoute principale / Primary RoadRoute secondaire / Secondary RoadRoute tertiaire / Tertiary RouteCours d'eau / WatercourseContour de mine / Mine OutlineTerril de stériles / Waste EmplacementForêt classée / Classified Forest
Projection: WGS 1984 UTM Zone 29N
File:
0131
299S
iman
douG
IS_IG
_CK\M
aps\E
RM\H
ydrol
ogy\M
ine\M
ay20
12_re
vision
s\Ann
ex_6
A\mi
_flow
_con
tours.
mxd
A4
G u i n e aG u i n e aS i e r r aS i e r r aL e o n eL e o n e
C o t eC o t ed ' I v o i r ed ' I v o i r e
L i b e r i aL i b e r i a
0 2
kilomètres
Date: 06/06/2012
Dessiné par: WB
Vérifié par: TS
Approuvé par: KR
Projet: 0131299
Echelle: Comme barre d'échelle

24.1 l/s1.3 l/s/km2
0 %
132.5 l/s1.4 l/s/km2
0 %
240.2 l/s1.8 l/s/km2
0 %
124.7 l/s3.3 l/s/km2
0 %
109.3 l/s3.5 l/s/km2
0 %
106.9 l/s6.8 l/s/km2
0 %
2884.4 l/s4.2 l/s/km2
0 %
79.4 l/s2.88 l/s/km2
99 %
152 l/s2.13 l/s/km2
93.9 %
88.4 l/s8.7 l/s/km2
72.6 %
74.2 l/s2.76 l/s/km2
86.5 %
780.1 l/s5.77 l/s/km2
16.2 %
142.1 l/s5.93 l/s/km2
88.9 %
503.5 l/s2.88 l/s/km2
38.6 %
705.8 l/s9.94 l/s/km2
27.5 %
834.2 l/s2.49 l/s/km2
79.5 % 56.4 l/s2.38 l/s/km2
139.4 %
3743.2 l/s3.35 l/s/km2
17.7 %
644.8 l/s10.04 l/s/km2
80.7 %
667.7 l/s12.95 l/s/km2
77.9 %
682.9 l/s14.88 l/s/km2
76.16 %
3718.6 l/s3.66 l/s/km2
17.8 %
161.2 l/s14.85 l/s/km2
93.7 %
Dandano
Kouankan
Touréla
Kakano
Banko
BonodouMandou
Orono
Lamandou
DiagbadouMamouroudou
Biniadou Korèla
Famoila
TraorélaMissamaridou
Vassaou
Tédou 1Gbandou-KongolaKouanko
Kamandou
FassinédouZimodou
SossavaKamiandou N.1
N.10
9°0'0"W
9°0'0"W
9°10'0"W
9°10'0"W
8°4
0'0
"N
8°4
0'0
"N
8°3
0'0
"N
8°3
0'0
"N
480000
480000
500000
500000
9400
00
9400
00
9600
00
9600
00
Client: Taille: Titre:Légende:
Figure 6A.8
2009 la saison sèche les résultats d'écoulementd'accrétion enquête (flanc ouest) /2009 Dry Season Flow Accretion Survey Results (Western Flank)
Projection: WGS 1984 UTM Zone 29N
File
: 01
312
99
Sim
and
ouG
IS_
IG_C
K\M
aps\
ER
M\H
ydro
log
y\M
ine\
Ma
y20
12_
revi
sion
s\A
nne
x_6A
\mi_
20
09D
ryS
ea
son
Flo
wA
ccre
tion_
Wes
t.m
xd
A4
G u i n e aG u i n e a
M a l iM a l i
S i e r r aS i e r r aL e o n eL e o n e
G u i n e a - B i s s a uG u i n e a - B i s s a u
S e n e g a lS e n e g a l
L i b e r i aL i b e r i a
0 4
kilomètres
Date: 06/06/2012
Dessiné par: WB
Vérifié par: TS
Approuvé par: KR
Projet: 0131299
Echelle: Comme barre d'échelle
628.9 l/s Débit / Flow rate
14.0 l/s/km2 Débit normalisé du bassin versant /
76.16 % Contribution de la montagne au débit /
Catchment Normalised Flow Rate
Flow Contribution from Mountain
Mesures de débit régional / Regional Flow Measurements
Agglomération / Settlement
Rivière dans le bassin versant colline / River in Hillside Catchment
Rivière dans le bassin versant non-colline / River in Off-Hill Catchment
Contour de mine / Mine Outline
Terril de stériles / Waste Emplacement
Route principale / Primary Road
Route secondaire / Secondary Road
Route tertiaire / Tertiary Route
Bassin versant / Catchment

57.5 l/s6.1 l/s/km2
0 %
65.4 l/s4.8 l/s/km2
0 %
411.6 l/s3.9 l/s/km2
0 %
288.9 l/s2.8 l/s/km2
0 %
202.4 l/s3.4 l/s/km2
0 %
42.7 l/s4.14 l/s/km2
32.8 %
82.3 l/s6.83 l/s/km2
93.9 %
277.8 l/s6.01 l/s/km2
50.1 %
66.8 l/s5.25 l/s/km2
105.3 %
964.1 l/s6.64 l/s/km2
33.4 %
589.2 l/s3.86 l/s/km2
52.3 %
454.3 l/s4.96 l/s/km2
67.9 %
221.2 l/s6.95 l/s/km2
68.3 %
234.3 l/s3.69 l/s/km2
64.5 %
108.4 l/s6.05 l/s/km2
145.1 %
259.8 l/s8 l/s/km2
53.6 %
161.2 l/s14.85 l/s/km2
93.7 %
63 l/s5.81 l/s/km2
111.6 %
SogbéniDomanidou
Foma
Fandou
ManankoroKankoro
KokounaKoimoridou
CangaEast
Camp
Kollako-MoussadouWawakoroBanankoroMafindouMoribadou
GoékoroMamoridouThia
Manakoro
BoubaroWataférédou II
KabakoroNiadou
Wataférédou I BobaroSiatouro
MorisangarédouBoulaydou Kéoulendou
Beyla
PiyaroKouwandala
Bangalydou NyelaTourela
SoumailadouDoukourelaSibiridou
Moussadou
KissiboulaN.1N.1
N.1
8°40'0"W
8°40'0"W
8°50'0"W
8°50'0"W
8°4
0'0
"N
8°4
0'0
"N
8°3
0'0
"N
8°3
0'0
"N
520000
520000
540000
540000
9400
00
9400
00
9600
00
9600
00
Client: Taille: Titre:Légende:
Figure 6A.9
2009 la saison sèche les résultats d'écoulementd'accrétion enquête (flanc est) /2009 Dry Season Flow Accretion Survey Results (Eastern Flank)
Projection: WGS 1984 UTM Zone 29N
File
: 01
312
99
Sim
and
ouG
IS_
IG_C
K\M
aps\
ER
M\H
ydro
log
y\M
ine\
Ma
y20
12_
revi
sion
s\A
nne
x_6A
\mi_
20
09D
ryS
ea
son
Flo
wA
ccre
tion_
Eas
t.m
xd
A4
G u i n e aG u i n e a
M a l iM a l i
S i e r r aS i e r r aL e o n eL e o n e
G u i n e a - B i s s a uG u i n e a - B i s s a u
S e n e g a lS e n e g a l
L i b e r i aL i b e r i a
0 4
kilomètres
Date: 06/06/2012
Dessiné par: WB
Vérifié par: TS
Approuvé par: KR
Projet: 0131299
Echelle: Comme barre d'échelle
Mesures de débit régional / Regional Flow Measurements
Agglomération / Settlement
Rivière dans le bassin versant colline / River in Hillside Catchment
Rivière dans le bassin versant non-colline / River in Off-Hill Catchment
Contour de mine / Mine Outline
Terril de stériles / Waste Emplacement
Route principale / Primary Road
Route secondaire / Secondary Road
Route tertiaire / Tertiary Route
Bassin versant / Catchment
628.9 l/s Débit / Flow rate
14.0 l/s/km2 Débit normalisé du bassin versant /
76.16 % Contribution de la montagne au débit /
Catchment Normalised Flow Rate
Flow Contribution from Mountain

Simandou SEIA Volume I Mine Annex 6A
6A-13
6A.2 Surface Water Quality
6A.2.1 Water Quality Standards The following international guidelines have been referenced during the course of the surface water impact assessment. International Finance Corporation (IFC) Environment, Health and Safety (EHS) Guidelines for Mining
(December, 2007). IFC General EHS Guidelines for Environmental Wastewater and Ambient Water Quality (April 2007). World Health Organisation (WHO) Guidelines for Drinking Water Quality (4th Edition, 2011). The various water quality / effluent standards that are contained in these guidelines are reproduced in Tables 6A.4 to 6A.6. In the case of the WHO guidelines, there are over 100 individual chemicals listed as having health significance in drinking water and the guidelines recommend that an appropriate sub-set is chosen for monitoring based upon local conditions. Table 6A.6 summarises the guideline standards for some the most commonly used parameters for a project in this setting, in addition to which the guideline values for the specific parameters sampled during the project water quality monitoring campaign are presented in Tables 6A.7 and 6A.8. Table 6A.4 IFC Effluent Guidelines for Mining
Pollutant Unit Guideline Value
Total Suspended Solids mg/L 50
pH S.U. 6 – 9
COD mg/L 150
BOD5 mg/L 50
Oil and Grease mg/L 10
Arsenic mg/L 0.1
Cadmium mg/L 0.05
Chromium (VI) mg/L 0.1
Copper mg/L 0.3
Cyanide mg/L 1
Cyanide Free mg/L 0.1
Cyanide WAD mg/L 0.5
Iron (total) mg/L 2.0
Lead mg/L 0.2
Mercury mg/L 0.002
Nickel mg/L 0.5
Phenols mg/l 0.5
Zinc mg/L 0.5
Temperature OC <3 degree differential
Notes: Metals concentrations represent total metals Source: Table 1, IFC EHS Guidelines for Mining, December 2010

Simandou SEIA Volume I Mine Annex 6A
6A-14
Table 6A.5 IFC Guidelines for Treated Sanitary Sewage Discharges
Pollutant Unit Guideline Value
pH S.U. 6 – 9
BOD mg/l 30
COD mg/l 125
Total nitrogen mg/l 10
Total phosphorus mg/l 2
Oil and grease mg/l 10
Total suspended solids mg/l 50
Total coliform bacteria MPN / 100 ml 400
Notes: MPN – Most probable Number Source: Table 1.3.1, IFC General EHS Guidelines for Environmental, Wastewater and Ambient Water Quality, April 2007
Table 6A.6 Selected WHO Drinking Water Guidelines
Parameter Unit Guideline Value
Total coliforms per 100 ml Zero in treated water
Cadmium mg/l 0.003
Cyanide mg/l 0.5
Mercury mg/l 0.006
Selenium mg/l 0.04
Arsenic mg/l 0.01
Fluoride mg/l 1.5
Nitrate (as NO3-) mg/l 50
Source: WHO Guidelines for Drinking Water Quality, 4th Edition, 2011
6A.2.2 Water Quality Monitoring Campaign A comprehensive baseline water quality monitoring campaign has been ongoing in the vicinity of the Pic the Fon and Ouéléba deposits and close to villages downstream since November 2006. This campaign is described in detail in the baseline reports listed in Chapter 6: Water Environment, Section 6.3. The surface water quality monitoring network is shown in Figure 6.3 of the chapter and consists of 13 spring and 24 stream sampling stations. Twice daily records of flow, water colour and turbidity were also initiated in early 2008 at 18 monitoring locations near villages, with measurements taken upstream and downstream of community water collection points. In addition, continuous monitoring of turbidity, temperature, conductivity, dissolved oxygen and pH was conducted at a number of weirs equipped with automatic systems. Detailed sampling of Total Suspended Solids (TSS) in natural stream waters was added to the programme in late 2008. In addition, 140 spot samples of water have been collected from a number of streams during or shortly after storm events for turbidity and TSS analyses. The surface water samples collected in the course of the sampling campaigns typically presented very low ionic concentrations. Due to the general lack of statistical variability within the results, the main physico-chemical results have been compiled and presented as summary statistics for springs and streams. Since surface water may be used as drinking water, standards from the World Health Organisation (WHO) Guidelines for Drinking Water Quality (4th edition, 2011) have also been presented in the tables for reference. Spring Water Quality Summary statistics for spring water quality are shown in Table 6A.7. According to the data shown, the spring water samples display the characteristics of water with very little mineralisation. Most of the parameters, including major anions and cations and trace metals, are below detection limit or present at very low

Simandou SEIA Volume I Mine Annex 6A
6A-15
concentrations. All parameters are below the WHO guideline limits, although it is apparent that the water is generally acidic in quality with a median pH value of 4.0 (1). This could be due to carbonic acid generation in low ionic strength water, but is thought more likely due to the process of sulphide oxidation as the water passes through the acid-generating phyllite materials that are abundant in the local geology (WMC 2009b). The spring samples present the lowest solute concentrations among all water samples collected in the study area. Stream Water Quality Summary statistics for stream water quality are shown in Table 6A.8. They exhibit slightly higher solute contents in comparison with upstream spring samples. Electrical conductivity readings correspond to total dissolved solids values between 2 and 100 mg/l, characteristic of essentially pure water. The pH values for the stream samples are less acidic than the very low values measured for the upstream spring samples, with a median pH value of 5.7, indicating that the acidity is emanating from the springs. The major ion and trace element concentrations pattern for stream samples is similar to the spring samples, with values measured below detection limit, or present at very low concentrations. Median concentrations in stream samples are approximately twice the median levels measured in springs. The sample concentrations measured in the stream samples also fell below WHO guidelines for all parameters. Table 6A.7 Summary of Spring Water Chemistry Across the Mine Site
Parameter Unit Method
Detection Limit
Minimum Maximum Median WHO
Guideline Limit [1]
Temperature oC - 17.9 27 21.4 -
pH pH unit - 1.2 9.6 4 -
ORP mV - -248 629 168 -
DO mg/l - 0.6 12.5 6 -
EC μS/cm - 2 22 8 -
Turbidity NTU 0.1 0.1 22.8 0.9 -
Ca mg/l 0.7 0.35 1.3 0.35 -
Na mg/l 0.005 0.093 1.26 0.23 50
K mg/l 0.03 0.04 0.96 0.215 -
Mg mg/l 0.001 0.027 0.758 0.203 -
Cl mg/l 0.03 0.015 1.35 0.135 5
SO4 mg/l 0.03 0.015 0.55 0.055 -
CO3 mg/l - 0 0 0 -
HCO3 mg/l - 6.5 0.1 1.1 -
NO3 mg/l 0.01 0.005 0.44 0.005 50
NO2 mg/l 0.01 0.005 0.005 0.005 3
PO4 (as P) mg/l 0.02 0.01 1.46 0.01 -
Ammonia mg/l 0.02 0.01 0.18 0.01 -
TOC mg/l 0.01 0.1 4.27 0.795 -
Si mg/l 0.2 0.5 4.3 3.05 -
F μg/l 10 5 400 5 1 500
Li μg/l 1 0.5 1 0.5 -
Fe μg/l 10 5 180 5 -
(1) WHO do not provide a guideline value for pH, although it is recognised as an important parameter for water supply systems. The spring and stream quality data typically fall below normal operating guidelines (6.5 to 8.5) and so would require pH adjustment within any potable water supply system.

Simandou SEIA Volume I Mine Annex 6A
6A-16
Parameter Unit Method
Detection Limit
Minimum Maximum Median WHO
Guideline Limit [1]
Mn μg/l 0.1 0.05 11.9 1.95 -
Ni μg/l 0.3 0.15 8.2 0.15 70
Ag μg/l 0.2 0.1 0.1 0.1 -
Al μg/l 2 1 77 12 -
As μg/l 0.03 0.015 0.53 0.015 10
Hg μg/l 0.2 0.1 0.1 0.1 6
Cr μg/l 0.5 0.25 0.25 0.25 50
Ba μg/l 0.1 2.1 38.7 4.15 700
Br μg/l 3 1.5 14 1.5 -
Cd μg/l 0.01 0.005 0.02 0.005 3
Cu μg/l 0 0.1 1.4 0.1 2 000
Pb μg/l 0.01 0.005 1.38 0.03 10
Sr μg/l 0.04 1.14 11.4 2.78 -
Zn μg/l 0.5 0.25 29 0.8 -
U μg/l 0.001 0.0005 0.029 0.0005 30
Be μg/l 0.1 0.05 0.05 0.05 -
Se μg/l 0.2 0.1 0.2 0.1 40
Sn μg/l 0.1 0.05 0.2 0.05 -
Co μg/l 0.005 0.0025 0.436 0.0665 -
Notes: [1] Taken from WHO guideline values for chemicals that are of health significance in drinking-water (WHO Guidelines for Drinking Water Quality, 4th Edition, 2011) - Values less than the detection limit and have been reset to half of the detection limit for purposes of calculating summary statistics. Source: Social and Environmental Baseline Study (Mine Component): Volume C – Physical Baseline, SNC Lavalin Environment, August 2010
Table 6A.8 Summary of Stream Chemistry Across Mine Site
Parameter Unit Method
Detection Limit
Minimum Maximum Median WHO
Guideline Limit [1]
Temperature oC - 15.8 25.6 20.55 -
pH pH unit - 2.1 9.1 5.65 -
ORP mV - -267 680 76.6 -
DO mg/l - 0.6 72 6.6 -
EC μS/cm - 3 140 15 -
Turbidity NTU 0.1 0.2 69.7 2.5 -
Ca mg/l 0.7 0.35 11.6 0.9 -
Na mg/l 0.005 0.12 8.98 1 50
K mg/l 0.03 0.04 10.2 0.635 -
Mg mg/l 0.001 0.14 4.86 0.7 -
Cl mg/l 0.03 0.03 7.79 0.205 5
SO4 mg/l 0.03 0.015 15.4 0.185 -
CO3 mg/l - 0 0 0 -
HCO3 mg/l - 80 1.6 5.5 -
NO3 mg/l 0.01 0.005 262 0.005 50

Simandou SEIA Volume I Mine Annex 6A
6A-17
Parameter Unit Method
Detection Limit
Minimum Maximum Median WHO
Guideline Limit [1]
NO2 mg/l 0.01 0.005 0.07 0.005 3
PO4 (as P) mg/l 0.02 0.01 15.1 0.01 -
Ammonia mg/l 0.02 0.01 0.2 0.01 -
TOC mg/l 0.01 0.4 8.25 1.5 -
Si mg/l 0.2 1.5 20.3 5.25 -
F μg/l 10 5 230 5 1 500
Li μg/l 1 0.5 2 0.5 -
Fe μg/l 10 5 2510 75 -
Mn μg/l 0.1 0.05 1 000 3.55 -
Ni μg/l 0.3 0.15 0.7 0.15 70
Ag μg/l 0.2 0.1 0.1 0.1 -
Al μg/l 2 1 64 11 -
As μg/l 0.03 0.015 0.21 0.06 10
Hg μg/l 0.2 0.1 0.1 0.1 6
Cr μg/l 0.5 0.25 0.25 0.25 50
Ba μg/l 0.1 2 209 22.1 700
Br μg/l 3 1.5 22 1.5 -
Cd μg/l 0.01 0.005 0.03 0.005 3
Cu μg/l 0.2 0.1 1.2 0.1 2 000
Pb μg/l 0.01 0.005 3.9 0.04 10
Sr μg/l 0.04 2.25 118 10.95 -
Zn μg/l 0.5 0.25 10.9 1.1 -
U μg/l 0.001 0.0005 0.155 0.005 30
Be μg/l 0.1 0.05 0.05 0.05 -
Se μg/l 0.2 0.1 0.1 0.1 40
Sn μg/l 0.1 0.05 0.05 0.05 -
Co μg/l 0.005 0.0025 2.52 0.031 -
Notes: [1] Taken from WHO guideline values for chemicals that are of health significance in drinking-water (WHO Guidelines for Drinking Water Quality, 4th Edition, 2011) - Values less than the detection limit and have been reset to half of the detection limit for purposes of calculating summary statistics. Source: Social and Environmental Baseline Study (Mine Component): Volume C – Physical Baseline, SNC Lavalin Environment, August 2010 In addition to the ongoing water quality monitoring described above a survey of village surface water drinking points was carried out in January / February 2008, which included water quality sampling. The water quality results from this survey are shown in Table 6A.9.

Simandou SEIA Volume I Mine Annex 6A
6A-18
Table 6A.9 Summary of Surface Water Use Survey at Villages Near Mine in February 2008
Village/River Faecal coliforms
(No./100 ml)
pH Cond.
(μS/cm)
Temp.
(0 C)
Diss.
Oxygen
(mg/l)
Redox
Potential
mV
Turbidity
TU
Flow
l/s
Water use Alternative water sources
Banankoro
Siankoun Gbe 220-260 6.0 57 24.1 6.3 52.6 5 48 Washing clothes, bathing, construction, drinking water, livestock watering.
Either river for washing and bathing. The tubewell with handpump and Mosque well in Banankoro village for drinking and cooking water.
Siankoum Fin 220-260 6.2 57 23.5 5.9 46.8 5 28
Banko
Pulowaye River - 6.76 18 21.5 - 48.5 <5 104 Washing clothes, bathing, construction, drinking water, livestock watering.
Tubewell with handpump, Forest Centre well and Adama Traoré well.
Foma
Loffa River 161-183 6.8 57 16.2 7.9 16.5 <5 580 Washing clothes, bathing, construction, drinking water, livestock watering.
None.
Boe River >250 6.8 42 16.5 7.3 20.3 8 38
Seniyeworo River 73-132 6.4 51 15.8 7.6 20.1 <5 8
Kakano
Soumourou River 306-310 5.7 32 22.6 7.6 78.6 15 890 Washing clothes, bathing, construction, drinking water, livestock
None.

Simandou SEIA Volume I Mine Annex 6A
6A-19
Village/River Faecal coliforms
(No./100 ml)
pH Cond.
(μS/cm)
Temp.
(0 C)
Diss.
Oxygen
(mg/l)
Redox
Potential
mV
Turbidity
TU
Flow
l/s
Water use Alternative water sources
watering.
Kotila
Torokoroko River 170-190 5.9 33 20.5 3.8 44.0 5 31 Washing clothes, bathing, construction, drinking water, livestock watering.
Whisky 1 stream.
Djitako River 180-220 6.5 108 21.6 7.1 -0.6 5 13
Lamadou
Worongbe River 2-30 6.1 14 20.9 7.8 19.2 <5 114 Washing clothes, bathing, construction, drinking water, livestock watering.
None.
Mafindou
Kouwan River 265-288 6.3 35 21.0 6.2 53.1 <8 11 Washing clothes, bathing, construction, drinking water, livestock watering.
Mamadi Camara well in Mafindou village. Korou Kony River 852-938 5.1 46 22.2 4.11 89.1 <5 -
Djibi Koni River 815-930 6.7 30 28.2 6.1 53.7 <5 1
Mandou
Woron River 58-92 6.27 20 23.10 - 157.6 <5 641 Washing clothes, bathing, construction, drinking water, livestock watering.
Two wells and a tubewell with handpump in Mandou.

Simandou SEIA Volume I Mine Annex 6A
6A-20
Village/River Faecal coliforms
(No./100 ml)
pH Cond.
(μS/cm)
Temp.
(0 C)
Diss.
Oxygen
(mg/l)
Redox
Potential
mV
Turbidity
TU
Flow
l/s
Water use Alternative water sources
Mamourdou
Woron River 122-130 6.1 34 22.4 6.1 65.1 <5 - Washing clothes, bathing, construction, drinking water, livestock watering.
Toubaboukonin River and Banankonin River, both distant from village.
Nionsomoridou
Miya River 121-135 5.8 39 19.8 7.9 55.2 <8 233 Washing clothes, bathing, construction, drinking water, livestock watering.
Three tubewells with handpumps, six properly constructed wells and six poorly constructed wells, all in Nionsomoridou Village.
Orono
Woron River - 3.2 36 22.1 7.8 373.4 <5 478 Washing clothes, bathing, construction, drinking water, livestock watering.
None.
Borongo River 129-137 5.9 40 20.5 6.3 78.9 12 -
Siatouro
Boboyba River 123-168 6.0 22 21.6 8.0 56.1 <5 64 Washing clothes, bathing, construction, drinking water, livestock watering.
None.

Simandou SEIA Volume I Mine Annex 6A
6A-21
Village/River Faecal coliforms
(No./100 ml)
pH Cond.
(μS/cm)
Temp.
(0 C)
Diss.
Oxygen
(mg/l)
Redox
Potential
mV
Turbidity
TU
Flow
l/s
Water use Alternative water sources
Touréla
Dianiworo River 190-205 5.7 28 20.0 8.5 107.0 <5 7 Washing clothes, bathing, construction, drinking water, livestock watering.
One tubewell with handpump and N'Fo Sory well in Touréla village.
Tourekonin - 5.69 28 20.08 8.53 107 – -
Traoréla
Mala River 206-220 6.2 40 23.4 6.0 39.9 32 76 Washing clothes, bathing, construction, drinking water, livestock watering.
One tubewell with handpump in Traoréla village.
Kinyeko River 536-569 4.7 16 21.2 7.2 127.3 12 63
Mokounko River 160-189 6.5 40 22.8 6.5 46 11 17
Wataférédou
Wataférédou
Farako
156-255 6.65 411 23.01 0.88 47.1 15 - Washing clothes, bathing, construction, drinking water, livestock watering.
One tubewell with handpump in Wataférédou village.
Watakonin 195-260 4.97 96 19.77 2.23 62.5 <5 -

Simandou SEIA Volume I Mine Annex 6A
6A-22
Sediment Monitoring Project investigations have revealed that early site activities already undertaken (access road and drill-pad construction in particular) have produced quantities of sediment that has been transported into streams by overland flow during storms. Figure 6A.10 shows the stream reaches which have been found to be affected, and also distinguishes in a very general way between natural and ‘disturbed’ catchments across the project area. In order to distinguish between ‘natural’ and ‘disturbed’ baseline conditions, automatic and spot sampling TSS data have been collected since early 2009 from several locations shown in Figure 6A.10. These data are presented in Table 6A.10, and Figure 6A.11 presents the variations in turbidity at Whisky 1 during storm events. As observed, periods of high turbidity are clearly associated with increased flow. The results also indicate that, whilst there is significant variability in both cases, the TSS in the surface waters from disturbed catchments is higher. Upstream versus downstream differences in turbidity have also been observed at a number of villages, suggesting an influence from the activities of the communities themselves. Similarly, the influence of communities on water colour is observed in 60% of the sampling sites, where upstream clear water, for example, turns to light brown downstream (Table 6A.11).

Domanidou
Foma
Touréla
Kakano
KankoroBanko Koimoridou
CangaEast
Camp
BonodouMandou
Orono
Lamandou MafindouMoribadou
Thia
Mamouroudou
KorèlaWataférédou II
Famoila
Wataférédou I BobaroTraoréla Siatouro
Vassaou
Boulaydou
NionsomoridouKouwandala
Kamandou
Fassinédou Bangalydou
Gbagbadou
Soumailadou
SibiridouSossava
Kamiandou
Kissiboula
Pic de Fon(1656m)
Pic duOueleba(1330m)
N.1 N.1
N.1
8°50'0"W
8°50'0"W
9°0'0"W
9°0'0"W
8°4
0'0
"N
8°4
0'0
"N
8°3
0'0
"N
8°3
0'0
"N
500000
500000
510000
510000
520000
5200009300
00
9300
00
9400
00
9400
00
9500
00
9500
00
9600
00
9600
00
9700
00
9700
00
CLIENT: Taille: Titre:Légende:
A4 Figure 6A.10
Flux affectés par le ruissellement des sédiments dans le zone minière / Streams Affected by Sediment Runoff in Mining Area
Sites d'échantillonnage des sédiments / Sediment Sampling Locations
Automatique / Automatic
Point / Spot
Haute altitudes / Highest Elevation
Contour de mine / Mine Outline
Terril de stériles / Waste Emplacement
Agglomération / Settlement
Bassin versant / Catchment
Bassin versant du Niger / Niger Watershed
Route principale / Primary Road
Route secondaire / Secondary Road
Route tertiaire / Tertiary Route
Cours d'eau principal / Primary Watercourse
Drainage possibles / Possible Drainage
Trajectoire des sediments / Stream Sediment Path
Inférée / Inferred
Observées / Observed
Pas de sédiments / No Sediment
PROJECTION: WGS 1984 UTM Zone 29N
File
: 01
312
99
Sim
and
ouG
IS_
IG_C
K\M
aps\
ER
M\H
ydro
log
y\M
ine\
Ma
y20
12_
revi
sion
s\A
nne
x_6A
\mi_
sed
ime
nt_
affe
cte
d_st
rea
ms.
mxd
0 5
kilomètres
Date: 06/06/2012
Dessiné par: WB
Vérifié par: TS
Approuvé par: KR
Projet: 0131299
Echelle: Comme barre d'échelle
G u i n e aG u i n e a
M a l iM a l i
S i e r r aS i e r r aL e o n eL e o n e
G u i n e a - B i s s a uG u i n e a - B i s s a u
S e n e g a lS e n e g a l
L i b e r i aL i b e r i a

Simandou SEIA Volume I Mine Annex 6A
6A-24
Figure 6A.11 Variations in Turbidity at Whisky 1 During Storm Events
Table 6A.10 Total Suspended Solids (TSS) in Natural and Disturbed Catchments
Percentile TSS (mg/l)
Natural catchments Disturbed catchments
95 127 374
75 (upper quartile) 51 108
50 (median) 24 36
25 (lower quartile) 5 17
5 1 3
Table 6A.11 Frequency (%) of Twice-Daily Observations of Stream Water Colour at Villages
Location Record Period
Upstream of Water use (10-20 m) Downstream of Water use (10-20 m)
Clear Light Brown
Dark Brown
Red Clear Light Brown
Dark Brown
Red
Mala at Traoréla 23 Jan-30 Nov 08
45 44 10 1 39 49 10 1
Kinyeko at Traoréla 23 Jan-30 Nov 08
52 32 6 10 42 40 9 10
Miya at Nionsomoridou 17 Jan-31 Aug 08
72 19 1 8 34 56 2 8
Loffa at Canga East
Road
1 Feb-30 Nov 08
61 28 5 6 53 36 5 6
Tamanko at Canga
East Road
13 Apr-30 Nov 08
56 29 8 7 47 37 7 9

Simandou SEIA Volume I Mine Annex 6A
6A-25
Location Record Period
Upstream of Water use (10-20 m) Downstream of Water use (10-20 m)
Clear Light Brown
Dark Brown
Red Clear Light Brown
Dark Brown
Red
Loffa at Foma
29 Jan-31 Oct 08
38 35 14 13 38 35 11 16
Boe at Foma
30 Jan-31 Oct 08
64 26 5 5 62 28 4 6
Worongbe at
Lamadou
30 Jan-30 Nov 08
89 9 2 0.2 44 55 1 0.3
Woron at
Mamourdou
20 Feb-31 Aug 08
44 51 5 0 43 52 5 0
Woron at Orono
17 Feb-31 Oct 08
71 22 2 5 70 22 2 6
Woron at Mandou
9 Feb-31 Aug 08
73 18 5 4 73 18 5 4
Pulowaye at Banko
13 Feb-31 Oct 08
49 22 27 2 41 28 29 2
Dianiworo at Touréla
20 Feb-31 Aug 08
81 3 13 3 81 4 13 2
Soumourou at Kakano 20 Feb-30 Nov 08
- - - - 18 31 32 19
Farako at Canga East
Road crossing
12 Apr-30 Nov 08
63 25 7 5 53 29 7 11
Farako at Wataférédou 23 Feb-30 Nov 08
64 19 15 2 57 21 20 2
Siankounfin at
Banankoro
16 Apr-31 Oct 08
67 17 16 0 62 19 19 0
Siankoungbe at
Banankoro
16 Apr-31 Oct 08
74 14 12 0 75 15 10 0
6A.3 Surface Water Users Table 6A.12 summarises the results of the surface water use survey that was conducted for villages in the immediate proximity of the mine, including the types of water use and flow conditions at the time of the survey. Reported water uses included domestic supply, fabricating bricks, livestock watering and fishing. In addition, a detailed survey of the quantity of surface water being used at three representative villages was carried out in February 2008. Table 6A.12 indicates that the rivers are being fairly widely used for supply purposes, but that the volumes abstracted each day are relatively small in comparison to the total daily flow in the rivers.

Simandou SEIA Volume I Mine Annex 6A
6A-26
Table 6A.12 Surface Water Use at Selected Villages in February 2008
Location Volume Collected
(litres) [1] Approximate %
daily flow volume [2] Approximate
no. of families Uses
Mafindou, 25 February 2008
Kouwan River 5 654 0.6% 14 Cooking , drinking, washing
Korou Kony River 1 025 - 3 Cooking , drinking, washing, construction
Djibi Koni River 1 275 1.5% 10 Cooking , drinking, washing, construction
Moribadou, 26 February 2008
Danako River 3 223 - 9 Cooking , drinking, washing
Djitako River 10 021 - 9 Cooking , drinking, washing, construction
Kobano River 841 - 10 Cooking , drinking, washing, construction
Plantation River 893 - 7 Cooking , drinking, washing, construction
Traoréla, 27 February 2008
Mala River 998 <0.1% 8 Cooking , drinking, washing, construction
Kinyeko River 3 012 <0.1% 10 Cooking , drinking, washing, construction
Notes: [1] These volumes were surveyed over an approximate 10 to 12 hour period during the day at each location. [2] Approximate percentages have been calculated where possible based upon the flows measured in Jan / Feb 2008, as shown in Table 6.8. Source: Baseline Hydrology Report (Mine Component), WMC, February 2009. With respect to agricultural water use, although the water point survey did not include irrigated (principally rice-growing) lands, it is possible to estimate water usage from available land use maps and knowledge of local cropping methods and crop water requirements. Chapter 6: Water Environment, Figure 6.5 shows the areas of ‘agricultural plain’ where it has been assumed that irrigated rice cultivation is taking place, and Table 6A.13 summarises the estimated irrigation water demand in May when the fields are wetted ready for transplantation. A comparison of agricultural water use estimates with the village water use data shown in Table 6A.12 suggests that the former is significantly higher, potentially by several orders of magnitude. Table 6A.13 Estimated Irrigation Demands vs Stream Flows During May
Location Irrigated Area (ha)
Estimated Irrigation Demand (m3/s)
Measured Mean Flow in
May 2008 (m3/s)
Estimated Flow in 1-in-5
Dry Year (m3/s)
Irrigation Demand as % of May flow
May 2008 Dry Year
Kinyeko at Traoréla 13.8 0.012 0.040 0.026 29 45
Woron at Orono 75.7 0.065 0.531 0.350 12 18
Woron at Mandou 122.4 0.104 0.693 0.457 15 23
Loffa at Canga East Road 38.6 0.033 0.282 0.186 12 18
Loffa at Foma 108.9 0.093 2.564 1.692 4 5
Boe at Foma 39.5 0.034 0.075 0.050 45 68

Simandou SEIA Volume I Mine Annex 6A
6A-27
6A.4 Groundwater Modelling Results The following figures summarise the preliminary groundwater modelling results that have informed the impact assessment described in Chapter 6: Water Environment, Section 6.4.1. It is stressed that the flow effects described above are all pre-mitigation (ie without taking into account any dewatering discharges) and are based on preliminary model results only. Figure 6A.12 shows the existing average (1) baseflow distribution across the various catchments that
drain the Ouéléba and Pic de Fon mining sites, as estimated by the groundwater model.
Figure 6A.13 shows the predicted total dewatering rates that will be required for the Ouéléba and Pic de Fon ore bodies over their full mine life (approximately 45 and 25 years respectively). The figure also shows the modelled reduction (shortfall) in total baseflow to the various catchments draining from the mine sites caused by dewatering, and the consequent ‘surplus’ flow that would be available assuming that all of these baseflows were replenished to their existing levels using the dewatering abstractions.
Figures 6A.14 and 6A.14 show the estimated magnitude of the effects on stream baseflows at Ouéléba and Pic de Fon in early and late mine life prior to any dewatering abstractions being discharged into the streams as part of impact mitigation.
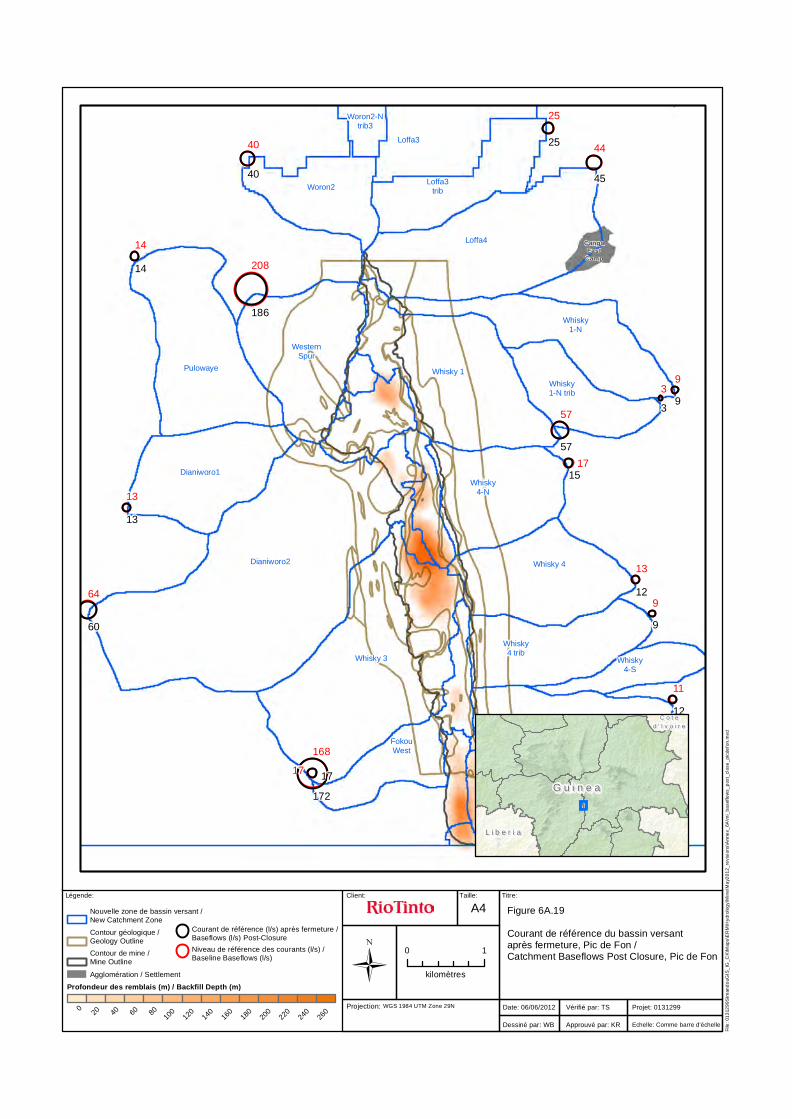
Figures 6A.16 to 6A.19 shows the estimated magnitude of the effects on streams baseflows and the
predicted formation of pit lakes following mine closure at both locations.
(1) Average conditions are represented in the model by February baseflows, which in hydrological terms are a close approximation to the average of wet and dry season conditions.

Simandou SEIA Volume I Mine Annex 6A
6A-28
Figure 6A.12 Existing Average Stream Baseflows (l/s) Estimated By Model
Ouéléba Pic de Fon

Simandou SEIA Volume I Mine Annex 6A
6A-29
Figure 6A.13 Predicted Dewatering Rates and Stream Responses

Simandou SEIA Volume I Mine Annex 6A
6A-30
Figure 6A.14 Ouéléba Modelling Results – Baseflows Following Dewatering (% Existing Baseflow)
Year 10 (Early Mine Life) Year 45 (Late Mine Life)

Simandou SEIA Volume I Mine Annex 6A
6A-31
Figure 6A.15 Pic de Fon Modelling Results – Baseflows Following Dewatering (% Existing Baseflow)
Year 10 (Early Mine Life) Year 25 (Late Mine Life)

Lamandou
Traoréla
Kinyeko
KinyekoTrib1
KinyekoTrib2
Loffa1
Mala 1
Mala 2
Mala 3
Miya1
Miya2
Miya2trib
Miya3
Miya4
Whisky 6
Woron1-N
Woron1-S
Woron2-N
Woron2-N trib1
Client: Taille: Titre:Légende:
Figure 6A.16
Position des lacs artificiels et courant des eaux de surfaces suite à la fermeture, Ouéléba /Location of Pit Lakes and Surface Water Flow Post Closure, Ouéléba
Nouvelle zone de bassin versant / New Catchment Zone
Agglomération / Settlement
Contour de mine / Mine Outline
Terril de stériles / Waste Emplacement
Terrain (mRL) / Ground (mRL)
500
600
700
800
900
1000
1100
1200
1300
1400
1500
1600
Projection: WGS 1984 UTM Zone 29N
File
: 01
312
99
Sim
and
ouG
IS_
IG_C
K\M
aps\
ER
M\H
ydro
log
y\M
ine\
Ma
y20
12_
revi
sion
s\A
nne
x_6A
\mi_
lake
s_po
st_
clo
se_
oue
leb
a.m
xd
A4
0 500
mètres
Date: 06/06/2012
Dessiné par: WB
Vérifié par: TS
Approuvé par: KR
Projet: 0131299
Echelle: Comme barre d'échelle
Direction de l'écoulement / Flow Direction
G u i n e aG u i n e a
C o t eC o t e
d ' I v o i r ed ' I v o i r e
L i b e r i aL i b e r i a

LamandouMoribadou
Wataférédou II
Traoréla Siatouro
543
20
29
16
61
26
21
18
16
32
46
53
2522
87
10 6
15
31
382
19
29
17
39
20
21
15
16
30
89
81
23
19
87
10 6
15
17Kinyeko
KinyekoTrib1
KinyekoTrib2
Loffa1
Loffa2
Loffa3
Loffa3trib
Mala 1
Mala 2
Mala 3
Miya1
Miya2
Miya2trib
Miya3
Miya4
Whisky 6
Woron1-N
Woron1-S
Woron2-N
Woron2-Ntrib1
Woron2-Ntrib2
Woron2-Ntrib3
Client: Taille: Titre:Légende:
Figure 6A.17
Courant de référence du bassin versant après fermeture, Ouéléba / Catchment Baseflows Post Closure, Ouéléba
Nouvelle zone de bassin versant /New Catchment Zone
Contour géologique /Geology Outline
Contour de mine /Mine Outline
Agglomération / Settlement
Profondeur des remblais (m) / Backfill Depth (m)
020 40 60 80
100
120
140
160
180
200
220
240
260
Projection: WGS 1984 UTM Zone 29N
File
: 01
312
99
Sim
and
ouG
IS_
IG_C
K\M
aps\
ER
M\H
ydro
log
y\M
ine\
Ma
y20
12_
revi
sion
s\A
nne
x_6A
\mi_
ba
seflo
ws_
pos
t_cl
ose
_ou
ele
ba
.mxd
A4
0 1
kilomètres
Date: 06/06/2012
Dessiné par: WB
Vérifié par: TS
Approuvé par: KR
Projet: 0131299
Echelle: Comme barre d'échelle
Courant de référence (l/s) après fermeture /Baseflows (l/s) Post-Closure
Niveau de référence des courants (l/s) /Baseline Baseflows (l/s)
G u i n e aG u i n e a
C o t eC o t e
d ' I v o i r ed ' I v o i r e
L i b e r i aL i b e r i a

CangaEast
Camp
Boe
Dianiworo1
Dianiworo2
FokouEast
FokouEast-N
FokouWest
Loffa3
Loffa3trib
Loffa4
Pulowaye
WesternSpur
Whisky 1
Whisky1-N
Whisky1-N trib
Whisky 3
Whisky 4
Whisky4 trib
Whisky4-N
Whisky4-S
Woron2
Woron2-Ntrib3
Client: Taille: Titre:Légende:
Figure 6A.18
Position des lacs artificiels et courant des eaux de surfaces suite à la fermeture, Pic de Fon /Location of Pit lakes and Surface Water Flow Post Closure, Pic de Fon
Nouvelle zone de bassin versant / New Catchment Zone
Agglomération / Settlement
Contour de mine / Mine Outline
Terril de stériles / Waste Emplacement
Projection: WGS 1984 UTM Zone 29N
File
: 01
312
99
Sim
and
ouG
IS_
IG_C
K\M
aps\
ER
M\H
ydro
log
y\M
ine\
Ma
y20
12_
revi
sion
s\A
nne
x_6A
\mi_
lake
s_po
st_
clo
se_
picd
efo
n.m
xd
A4
0 500
mètres
Date: 06/06/2012
Dessiné par: WB
Vérifié par: TS
Approuvé par: KR
Projet: 0131299
Echelle: Comme barre d'échelle
Terrain (mRL) / Ground (mRL)
500
600
700
800
900
1000
1100
1200
1300
1400
1500
1600
Profondeur de remblayage (m) / Backfill depth (m)
30 60 9012
015
018
021
024
027
030
033
036
0
Profondeur du lac (m) / Lake depth (m)
10 20 30 40 50 60 70 80 9010
011
012
013
014
015
0
Direction de l'écoulement / Flow Direction
G u i n e aG u i n e a
C o t eC o t e
d ' I v o i r ed ' I v o i r e
L i b e r i aL i b e r i a
CangaEast
Camp
Boe
Dianiworo1
Dianiworo2
FokouEast
FokouEast-N
FokouWest
Loffa3
Loffa3trib
Loffa4
Pulowaye
WesternSpur
Whisky 1
Whisky1-N
Whisky1-N trib
Whisky 3
Whisky 4
Whisky4 trib
Whisky4-N
Whisky4-S
Woron2
Woron2-Ntrib3
11
13
64
135
168
25
44
14
208
57
93
17
13
9
17
40
12
13
60
135
172
25
45
14
186
57
93
17
12
9
15
40
Client: Taille: Titre:Légende:
Figure 6A.19
Courant de référence du bassin versant après fermeture, Pic de Fon /Catchment Baseflows Post Closure, Pic de Fon
Nouvelle zone de bassin versant /New Catchment Zone
Contour géologique /Geology Outline
Contour de mine /Mine Outline
Agglomération / Settlement
Profondeur des remblais (m) / Backfill Depth (m)
020 40 60 80
100
120
140
160
180
200
220
240
260
Projection: WGS 1984 UTM Zone 29N
File
: 01
312
99
Sim
and
ouG
IS_
IG_C
K\M
aps\
ER
M\H
ydro
log
y\M
ine\
Ma
y20
12_
revi
sion
s\A
nne
x_6A
\mi_
ba
seflo
ws_
pos
t_cl
ose
_pi
cde
fon
.mxd
A4
0 1
kilomètres
Date: 06/06/2012
Dessiné par: WB
Vérifié par: TS
Approuvé par: KR
Projet: 0131299
Echelle: Comme barre d'échelle
Courant de référence (l/s) après fermeture /Baseflows (l/s) Post-Closure
Niveau de référence des courants (l/s) /Baseline Baseflows (l/s)
G u i n e aG u i n e a
C o t eC o t e
d ' I v o i r ed ' I v o i r e
L i b e r i aL i b e r i a