6a commercial arrangements and economics report
TRANSCRIPT

© Scottish and Southern Electricity Networks
6A Commercial Arrangements and Economics Report

Document Owner(s) Project / Organisation Role
Stevie Adams SSEN Senior Project Manager
Grant Allan University of Strathclyde
Fulin Fan University of Strathclyde
Ivana Kockar University of Strathclyde
Han Xu University of Strathclyde
Prepared by
NINES Commercial Arrangements and Economics Report Page 1

Contents
List of Figures 4
List of Tables 5
Executive Summary 7
1 Introduction 111.1 Project Background: 12
1.2 NINES Elements 12
1.0. NINES Commercial Context 14
2 Domestic Demand Side Management 152.1 NINES DDSM Overview 16
2.1.1 DDSM Infrastructure 16
2.1.2 Geographical Locations of DDSM Households 18
2.1.3 Behaviour of DDSM Households 19
2.2 NINES DDSM Customer Engagement 23
2.3 NINES DDSM Costs and Benefit Analysis 23
2.3.1 NINES DDSM Costs 23
2.3.2 NINES DDSM Benefits 25
2.3.3 NINES DDSM Cost – Benefit Analysis 29
3 Shetland Generators 303.1 Conventional Generators 31
3.2 “Must-take” Renewable Generators 32
3.3 Renewable Generators Connected via NINES 32
3.4 Outputs of Generators 33
4 Battery 364.1 NINES Battery Operation 37
4.2 NINES Battery Scheduled Activities 38
4.3 Commercial Arrangements with Battery 40
4.3.1 NINES Commercial Arrangements with Battery 40
4.3.2 Potential Commercial Arrangements with Battery 41
4.4 NINES Battery Costs and Benefits Analysis 42
4.4.1 NINES Battery Costs 42
4.4.2 NINES Battery Benefits 44
4.4.3 NINES Battery Cost – Benefit Analysis 45
5. Potential Participation in the UK 47
6. Economic Interventions 516.1. Project Spending on Shetland Islands 52
6.2. Domestic electricity consumption on Shetland 53
6.2.1 Household attitudes 53
6.2.2 Changes in households electricity consumption 53
6.2.3 Impacts on fuel poverty 54
6.3. Emissions from Shetland electricity consumption 55
Conclusions 57
Appendix I – Acronyms 67
Balancing Market
NINES Commercial Arrangements and Economics ReportPage 2 NINES Commercial Arrangements and Economics Report Page 3

List of Figures List of Tables
Figure 1 DDSM infrastructure
Figure 2 Geographical locations of DDSM Houses connected to telecom stations– total 223
Figure 3 Heating consumption curves of DDSM Group A in Case I & Case II
Figure 4 Heating consumption curves of DDSM Group B in Case I & Case II
Figure 5 Flexible DDSM customers and battery alleviated the curtailment by 0.26MWand 0.18MW respectively at 23:00 on 6/12/2016
Figure 6 Yearly total renewable power curtailment alleviated by the flexible DDSM customers, February 2016 – January 2017
Figure 7 Monthly total renewable power curtailment alleviated by the flexible DDSM customers, February 2016 – January 2017
Figure 8 Output power of Shetland five generators in Case I
Figure 9 Output power of Shetland five generators in Case II
Figure 10 Battery stepping down charging profile
Figure 11 Battery schedules in Case I
Figure 12 Battery schedules in Case II
Figure 13 Relationship between fuel poverty and extreme fuel poverty by Scottish local authority, 2013 – 2015
Figure 14 Carbon-intensity of average household electricity consumption on Shetland, tCO2 per average kWh consumption
Table 1 UoS learning reports
Table 2 Geographical distribution of rollout houses – total 223
Table 3 Number of households in different DDSM groups
Table 4 Costs (£) of NINES DDSM rollout and support through project phase
Table 5 Costs (£) of NINES DDSM support after project phase
Table 6 FIT payments (£) for additional export enabled by DDSM, from February 2016 to January 2017
Table 7 12 engine units in LPS
Table 8 Costs (£) of NINES battery system and support through project phase
Table 9 FIT payments (£) for additional export enabled by BESS, from September 2015 to November 2016
Table 10 Summary of NINES potential participation in the UK balancing market
Table 11 NINES project spending, by category and location
Table 12 Economic impacts of NINES expenditures on Shetland economy
Table 13 Household electricity consumption on Shetland, 2014 to 2015, levels and changes
Table 14 Annual economic impact of observed reductions in domestic electricity
consumption, (2015 prices)
17
18
21
22
27
27
28
34
34
38
39
40
55
56
14
18
20
24
25
26
31
43
45
49
52
53
54
54
NINES Commercial Arrangements and Economics ReportPage 4 NINES Commercial Arrangements and Economics Report Page 5

Executive summary
Executive summary
This report has described the commercial arrangements used by the Northern Isles New Energy Solutions (NINES) project for integrating the NINES elements into the Shetland network.
The NINES elements have been considered in this report include Domestic Demand Side Management (DDSM), connection of additional distributed renewable generators, and a large-scale energy storage battery. In addition to the commercial arrangements, this report has also delivered learnings on the economic impacts of NINES on Shetland. The economic impacts have been examined from two perspectives, which are economic interventions associated with NINES activities and operation, and wider consequences on Shetland during the development and operational phases of NINES.
At the conclusion of the project, the DDSM scheme comprised heating and hot water appliances installed in social households owned by Hjaltland Housing Association (HHA). All the homes involved in the scheme had Demand Side Management (DSM)-capable storage heaters and/or hot water tanks installed, which replaced the original appliances. These devices are also frequency responsive, which means that they can measure system frequency locally and change consumption if frequency deviates from the pre-set frequency band. Therefore, these appliances could help with maintaining the system frequency stability. Further details on the frequency responsive DSM capable devices can be found in Frequency Response Operational Effectiveness report1.
The scheduling of the DDSM households is instructed through the Active Network Management (ANM) system, which was developed by Smarter Grid Solutions (SGS). A technical infrastructure, has been introduced in section 2.1.1, was designed to enable the communication between the DDSM homes and the ANM system installed on Shetland central control room at Lerwick Power Station (LPS). In addition to the technical infrastructure, and in partnership with HHA, SSEN engaged with the DDSM customers under its engagement plan throughout the lifecycle of the NINES project. This report has summarised and described 6 core methods that the NINES project used to engage with domestic customers directly in section 2.2, which include: issue payments (as incentives for participation), website updates, hosting of local meetings, issuing of written communications, phone calls to customers, and carrying out of home visits.
The homes participating in DDSM are distributed on the Shetland Islands, and geographical locations of the DDSM homes have been presented in section 2.1.2 in this report. The majority 78% of the DDSM houses are in the centre and south of Shetland Mainland, with the rest 22% located in North Mainland and North Islands. The behaviour of the appliances in the households taking part in the DDSM trial has been reviewed in section 2.1.3, by aggregating the 18 DDSM groups into two groups based on the flexibility level of these customers. The flexibility levels refer to flexible/fixed in the scheduling of the heating devices (i.e. storage heaters and hot water tanks). The heating demand profiles of the DDSM households are studied in two cases, which are selected as one of the maximum/minimum demand days on Shetland in winter/summer 2016.
The report has also listed the detailed costs associated with rolling out the DDSM scheme in section 2.3.1, as well as the funding sources used. During the project, the total cost of the DDSM scheme and support services is £3.2 million, which is shared between SSEN and HHA, with 64.8% of the total cost covered by SSEN. SSEN’s costs are funded via Ofgem through the NINES project. In addition, there will be ongoing operational cost of £491k per year for providing services to the DDSM customers under current scope (i.e. 234 DDSM households) after the end of the project.
The NINES DSM Network Benefits report2 has concluded that moving appliances to flexible DDSM from teleswitching could reduce their maximum possible load at peak times by 0.5MW, if the devices follow the required schedule. Existing teleswitching customers will see a theoretical 10-18% lower heating consumption and better regulation of temperature. Furthermore, this report has determined that DDSM flexible appliances alleviated the curtailment of 77MWh of renewable energy (generated by North Hoo and Luggies Knowe), during the period of February 2016 till January 2017. This would correspond to North Hoo and Luggies Knowe asset owners receiving additional Feed-In Tariff (FIT) payments of £6,261.83 and £4,101.83 respectively. As the fees paid to distributed generators for their additional export were lower than the costs for the same volume of conventional generation, the renewable generation that would otherwise have been curtailed helped achieve savings in conventional generation cost of £11,621.65. Detailed benefits that DDSM customers had realised are stated in section 2.3.2.
NINES Commercial Arrangements and Economics Report Page 7

Following the calculation of the renewable energy benefits, analysis has been conducted in section 2.3.3 to illustrate the costs of achieving the benefits enabled by the DDSM flexible customers. A cost value of using the DDSM flexible customers to avoid the 77MWh renewable energy curtailment is determined as £7,360.40/MWh. During the evaluated period from February 2016 to January 2017, as pre-payment customers were moved into flexible DDSM scheduling from 26th September 2016, they helped alleviate renewable energy reduction since that time. Thus, the renewable energy curtailment alleviation is expected to be 105.7MWh if the pre-payment DDSM customers had provided flexibility for a full year, assuming the same percentage of flexible customers heating capacity is used for alleviating renewable curtailment. Adding the full year value of pre-payment customers and the subsequent reduction in renewable energy curtailment reduces the cost to £5,364.75/MWh. The total available flexibility of the heating devices (installed in the all flexible DDSM households), has been estimated to total 1GWh per annum. This value of 1GWh is calculated based on the energy requirements of the flexible customers. Considering the rules by which DDSM operates means that wherever possible appliances in the flexibly charging groups are scheduled to apply primarily at times that NINES connected renewable generators would otherwise be curtailed. If the scheduling of flexible customers heating devices fully align with renewable curtailment, the future cost of using these DDSM flexible customers to reduce renewable curtailment would be lower, at £560.94/MWh.
There are a number of generators on Shetland, including conventional generators, firm connected renewable generators, and NINES connected renewable generators connected on a managed basis and these are all described more fully in section 3.1–3.3 in this report. Among the Shetland generators, LPS and SVT provide services to support the security and stability of the network. LPS is reaching the end of its operational life and a tendering process to determine a replacement solution is currently under way.
The report also reviews current commercial arrangements for allocating network access for the NINES renewable generators that have been connected to the Shetland Network on a managed basis. The commercial arrangement currently used on Shetland to manage these connections is Last In First Off (LIFO), and current Shetland operation uses the ANM system to control the access to the network for these generators.
Outputs of five of the Shetland generators has been reviewed in this report for two case studies (i.e. the winter and summer 2016 cases), which are the same two cases used for analysing the DDSM heating profiles. The five generators analysed in section 3.4 include all three types (i.e. the conventional generators, firm connected renewable generators, and NINES connected flexible renewable generators), with the conventional generators contributing at least 50% of the total generation at any time. The renewable generators outputs are subject to the commercial arrangements and also depend on the wind availability, as well as curtailment.
A Valve-Regulated Lead-Acid (VRLA) battery was connected to the Shetland network as part of the NINES project. The battery commenced operation in February 2014. It was operated under the control of the ANM system calculated schedules from February 2014 to June 2015. Beyond June 2015, a manual schedule of the battery replaced the ANM system calculated schedule, due to issues around utilisation of the battery. The battery was manually scheduled to charge during periods of low demand and discharge to offset peak demand met by conventional generations. In addition to reducing conventional generation during peak times, the VRLA battery also enabled additional wind energy that would otherwise be curtailed due to the constraints in the network. The battery was cycled 612 times, with the total discharge power of 1.34GWh during the period of September 2014 to November 2016. Following the conclusion of the investigations into a number of failed battery cells and based on the recommendation of battery provider, the VRLA battery was removed from service in January 2017.
The battery operation is discussed in detail in Battery Operational Effectiveness report3, and this report has provided a brief overview of the scheduled battery activities in section 4.2. The charging and discharging schedules of the installed VRLA battery is analysed in the same two case studies that have been used for analysis of DDSM and generators outputs (i.e. the winter and summer 2016 cases). The scheduling of the battery succeeded in adding flexibility to NINES operation, and it followed the rules set in the manual schedule – charge during periods of low demand and discharge at peaks.
The battery sought to help to optimise and stabilise the operation of the existing islanded network by primarily helping to reduce demand peaks. It also helped to facilitate the connection of 8.545MW of new renewable generation. Potential commercial arrangement for operating the battery on Shetland has been proposed in section 4.3.2. Under this proposed arrangement the battery is owned and operated by a third party and provides contracted battery services that will assist network balancing. Under this arrangement the DNO would not be exposed to issues such as battery efficiency and reliability, however, it would face the risk that the contracted battery services may not be available when required.
The capital cost of the battery was part funded by the Department of Energy & Climate Change (DECC) via a Smart Grid Demonstration Capital Grant for £1.1m and £1m from Ofgem’s Low Carbon Network Fund Tier 1. The remainder of the costs was funded through the NINES Project. Costs associated with energy supplied by the battery are not considered separately, but are included with the LPS costs, which means there was no separate battery energy supply contract or Power Purchase Agreement (PPA) for the battery. The capital costs of the NINES battery (including battery system, network connection, installation and commissioning, communication systems, civil and building works and external assessment), as well as the ongoing operation costs have been presented in section 4.4.1. The total cost of the battery during the project, considering both capital and operational costs, is £4.12 million. Financial benefits that the battery could achieve have also been discussed and calculated in section 4.4.2 from several aspects, including reduction in fossil fuel consumption, alleviation of renewable generation curtailment, and savings in conventional generation cost. During the period from September 2015 to November 2016, the charging of the battery allowed 52.7MWh of additional renewable energy (18.1MWh at North Hoo and 34.6MWh at Luggies Knowe) to be delivered into the grid. Therefore, North Hoo and Luggies Knowe were paid for their additional generation absorbed by the battery through the FIT of £4,325.47 and £2,785.24 respectively over this period. Furthermore, the time-shifting of the renewable energy enabled by the battery saved £5,424.34 through the delivery of the renewable energy to the grid during periods of high demand (instead of conventional generation) over the period from September 2015 to November 2016.
A cost-benefit analysis of using the VRLA battery to reduce renewable energy curtailment has been carried out in section 4.4.3. A MWh cost of using the battery to alleviate the 52.7MWh renewable energy on Shetland, from September 2015 to November 2016, is evaluated to be £7,916.67/MWh. This value is based on assuming the lead acid battery has a lifetime of 15 years. The assumption of the lead acid battery lifetime is made according to the report A Good Practice Guide on Electrical Energy Storage4. Furthermore, this report has also estimated a value of theoretical cost of using a battery to alleviate curtailment. The agreement with battery provider specified that the battery warranty covers 1500 full cycles or 5 years of operation, whichever comes first. To respect the warranty term, 300 cycles/year has been assumed, and with an energy requirement of 4MWh to fully charge the battery, it could alleviate 1.2GWh renewable energy curtailment over a year. If the battery was charged using renewable energy, the cost of using the battery to reduce curtailment would be £278.14/MWh.
The solutions tested and applied throughout the NINES Project (i.e. DDSM, battery, and flexibly connected DGs) may also be used for potential participations in the GB Ancillary services markets. However, this will require a suitable connection between the GB mainland and the Shetland network. Currently, this connection is not available, but for completeness the report looks beyond the current scope of NINES, it has briefly outlined the possible future participation of the set of alternative solutions in the GB ancillary service markets in section 5.
In addition to the commercial arrangements, this report has analysed the economic impact of NINES operations and the wider benefits on Shetland, including the impact of project spend, the impact on changes in domestic electricity consumptions and fuel poverty, and the reduction of CO2 emissions. The direct NINES total project spending was £15.3 million, with 45% of the spending relating to staff costs and the rest covering equipment, IT, contractors and travel. This report has determined 2.97% of staff costs and 6.48% of non-staff costs are spent locally on Shetland. The total project spending on Shetland is calculated to be £749,250, which equals to 4.9% of the NINES direct project spending. It is worthwhile mentioning the non-staff costs include the incentive payments made to customers initially joined the DDSM scheme, which equals to a total of £43,800. This report has concluded, through Input-Output analysis, that the NINES project related expenditures produce an economic impact in the Shetland economy. The NINES expenditure added £1.023 million worth of economic output, £506,850 to the gross value added of the local economy, and raised employment by almost 17 person years of Full-Time Equivalent (FTE) employment over the project duration.
A principal intervention of the NINES project was the use of DSM technology at the household level to improve the management of the local electricity supply system. DDSM households were invited to complete a survey on their experiences. Of the nineteen surveys returned some households’ identified cheaper and more efficient energy through NINES DSM. This report therefore has considered a long-term consequence of the changes in households electricity consumption. Data from the Department for Business, Energy and Industrial Strategy (BEIS) on electricity consumption by households in the Shetland local authority is used for determining the long-term consequences. The latest data between 2014 and 2015 reports, median household electricity demand on Shetland for those customers on “economy 7” tariff fell by 1.9% between 2014 and 2015 (from 7,043kWh to 6,908kWh), while mean household electricity demand for the same tariff customers fell by 1.6%. The “economy 7” electricity consumption data is used in this report as this most closely matches the form of contract for the majority of households taking part in the DDSM trial.
NINES Commercial Arrangements and Economics ReportPage 8 NINES Commercial Arrangements and Economics Report Page 9Page 8

Furthermore, this report has modelled the economic impact of savings on energy bills when total household spending on electricity remains constant. Based on the Input-Output analysis, this report has determined the reduction in electricity spending increased 223 DDSM household income by £35 for each year of operation, and £7,950 in total per year. Moreover, the economic impact of the additional incomes on the Shetland economy is equivalent to additional £10,000 worth of economic output, £5,150 to the gross value added of the local economy, and 0.2 person years of FTE employment per year.
Fuel poverty is identified by several important determinants, including: levels of income, spending on energy, and characteristics of the domestic properties (e.g. energy efficiency rating, etc.). The level of fuel poverty is defined as where a household spends more than 10% of its disposable income (including housing benefit or income support for mortgage interest) on all household fuel use5. “Extreme fuel poverty” is defined as where households spend more than 20% of incomes on heating costs. This report has presented the latest data which shows Shetland is ranked 4th highest across the 32 local authority in Scotland, based on both measures on fuel poverty and extreme fuel poverty. This report has also shown fuel poverty level on Shetland has reduced from 53% to 52% of households living in fuel poverty6.
Domestic electricity consumption on Shetland is higher than many local authority areas due to a combination of high heating demand, and lack of access to the Gas Grid and so the use of electricity to heat properties. As the Shetland network is an islanded network, the higher than average electricity consumption is met solely by generation on the Shetland Islands. Emissions related to domestic electricity consumption have reduced with installation of new renewable technologies on the Shetland Islands, including during the NINES project.
In addition to the identified learning from the economic, emissions, fuel poverty interventions, and wider effects of the NINES projects, this report has proposed two principal items which would be useful learning for future evaluation programmes. These are:
i) the development of a baseline of energy consumption prior to the introduction of DDSM interventions on household energy consumption. This would enable a more accurate and more finely detailed assessment of the specific consequences for household energy consumption of the interventions;
ii) part of the qualitative socio-economic impacts should measure household incomes and measures of energy expenditures, which would permit analysis of specific impacts of such interventions upon fuel poverty indicators at the household levels.
This report contributes to the following Learning Outcomes (LOs) questions of the NINES project from both commercial and economics perspective, which are:
• “LO 1: How can a distribution system be securely operated with a high penetration of renewable generation?”
• “LO 4: What is the economic impact on industry participants and other stakeholders of the low carbon operation of the network?”
• “LO 5: What new commercial arrangements are needed to support a low carbon network?”
• “LO 6: What is the effect on fuel poverty, changes of attitudes, awareness and behaviours amongst consumers and the extent of the financial impact on participants?”
• “LO 8: To what extent do the new arrangements stimulate the development of, and connection to the network of more renewable generation and reduce the reliance of the area on fossil fuels?”
• “LO 9: What effect does the NINES project and it’s legacy have on Shetland’s economy and on the carbon footprint of the area?”
1
Introduction
NINES Commercial Arrangements and Economics ReportPage 10

1.1 Project Background:
In 2010, a licence obligation was put in place requiring Scottish and Southern Electricity Networks (SSEN) to present an Integrated Plan to manage supply and demand on Shetland. The Shetland Islands are not connected to the main GB electricity network and, as such, face unique electrical challenges – but also a unique opportunity to decarbonise supply. Under the licence condition, this Integrated Plan was required to demonstrate that it had identified a solution based on the lowest lifecycle costs, taking into account its environmental obligations.
As part of the Integrated Plan submission, consideration was to, amongst other things, the upgrading or replacement of Lerwick Power Station (LPS), the impact of third party generation requirements, the abundance of renewable energy resources and the future demand on Shetland. The factors influencing the supply and demand issues on Shetland necessitated an innovative approach to their management. However, with innovation comes the need to trial solutions before reaching an answer. As a result, SSEN originally proposed to split the implementation of the Integrated Plan into two phases:
Phase 1 Shetland Trial (Northern Isles New Energy Solutions ‘NINES’) – implementation of the infrastructure necessary to actively manage demand, generation, reactive compensation and energy storage assets. These elements were coordinated to maximise the amount of energy harvested from renewable generation while maintaining supply quality and security. In doing so, two principal effects are achieved:
• a reduction in maximum demand; and
• a reduction in the electricity units generated by fossil fuels
Phase 2 (Shetland Repowering) – upgrading or replacement of LPS by SSEN, taking into account the learning acquired during Phase 1 and, where appropriate, extending the Phase 1 technology.
1.2 NINES Elements
NINES was originally designed and developed to operate in conjunction, and integrate, with LPS or its replacement operated by SSEN, and was developed with the main aim of informing the optimum repowering solution. Whilst its primary objective was to trial ‘smarter’ initiatives, importantly NINES has funded elements and infrastructure that are expected to endure as part of, or alongside, the new energy solution. Central to the project has been the creation of an integrated set of models designed to anticipate the impact of NINES, covering the following themes:
• Dynamic Stability model
• Steady State model
• Unit Scheduling model
• Customer demand forecast model
• System Development optimisation model
• Strategic Risk and Operational risk model
• Shetland Economic model
• Commercial model
Facilitated by modelling and practical learning, the aims of NINES have been to:
1. Increase understanding of how best to accommodate Shetland’s significant wind potential on a small distribution network; and
2. Increase understanding of how the existing and known future demand on the island can be best managed on a constrained, isolated system.
These models served to predict the behaviour of the energy systems on Shetland, and to validate each of the key elements of NINES as they were added. Following this validation process, these models have been used to inform the development of the New Energy Solution realised through the competitive process. With the successful operation of NINES, the infrastructure and knowledge to reduce the peak capacity requirement for any replacement solution to a level dependent on the particular assets connected, and the characteristics of the new solution has been determined. The NINES project assets are described below.
1. 1MW battery at Lerwick Power StationA 1MW battery acts as an energy storage system on the Shetland Network. In addition to facilitating the connection of new renewables, the battery assists in optimising and stabilising the operation of the existing island network by helping to reduce demand peaks. The battery has helped to accommodate the connection a significant amount of new renewable generation that would otherwise not have been able to connect.
2. Domestic demand side management with frequency response
As part of the wider NINES benefits, Hjaltland Housing Association contracted with Glen Dimplex to install advanced storage heating and water heating in 234 existing homes. These new storage and water heaters (which replaced existing traditional storage heaters) were provided through Hjaltland and ERDF (European Regional Development Fund) funding and have been specifically designed to use a much more flexible electrical charging arrangement. This new charging arrangement is determined based upon the predicted demand, weather forecasts, availability of renewables and any other network constraints. This initial roll out was intended to help gauge the effectiveness of storage and demand side response at the domestic level.
The heaters incorporate additional insulation to minimise heat loss and are fitted with programmable timers to allow users much better control of temperature and operating times when compared with conventional storage and water heating systems. The new heating system is designed to be more efficient, while giving the customer full control of both temperature and operating time and allowing for charging at times that best suit the network.
As stated in section 2.1, due to social housing has a relatively high turnover in occupancy, this has had a continuing impact on the overall number of consented properties. This, at the time of this report, 223 DDSM households remain in the scheme.
3. Renewable generationShetland has some of the richest renewable resources in Europe and there is significant interest on the islands to connect a range of new renewable generators. There is a mix of wind and tidal generators currently connected that range in scale from 45kW up to 4.5MW. However, before the advent of NINES these generators could not connect to the network due to the underlying voltage and stability constraints. Connecting more renewable generation, which is unavoidably intermittent, would have exacerbated these problems.
To address this, NINES has trialled an active network management regime which has offered renewable connections to developers. In return, they are required to give their agreement to being constrained when the system cannot accommodate their generation. The measures that have been developed and trialled under NINES are reducing this constraint by being able to actively provide demand when there is renewable resource available.
Indeed, these arrangements could be necessary even if Shetland is to become electrically connected to the mainland at some point in the future. If a single mainland link is damaged, this could result in a prolonged outage, which would mean that Shetland would once again be electrically islanded. Therefore the prospect of and ability to constrain will remain for generators on Shetland, albeit on a less frequent basis.
4. Active Network Management (ANM) systemThis is the NINES project’s nerve centre: it monitors the different parameters affecting the network, including embedded constraints, frequency stability and weather and manages an appropriate response. It responds to, and tunes, the models which are being developed to monitor and understand how new storage assets will behave. By creating flexible demand on the island progress has been made in exploiting and maximising Shetland’s wind generation potential on an islanded basis, and in reducing the generated output from replacement thermal generation.
A key driver for the trial has been to develop an understanding how these technologies work and interact in a real-life environment. The learning from NINES has demonstrated that in general terms (with the exception of additional renewables), all NINES technologies predominately involve energy shifting rather than energy reduction.
The following report is one of a number of related reports undertaken by the research team, led by University of Strathclyde (UoS) and focuses on the NINES commercial arrangements, as well as impacts on economic, emissions and fuel poverty on Shetland. This report covers the learnings regarding commercial arrangements related to Domestic Demand Side Management (DDSM), generators, a battery, and an Active Network Management (ANM) system. In addition to the commercial arrangements, the report covers the impact of the NINES project on local economic and environmental indicators during the project period.
An overview of commercial arrangements for different solutions currently used in the NINES project is provided in this report. The commercial arrangements considered include the arrangements currently in place with DDSM, generators and battery. These arrangements have been developed to ensure that customers, DG investors, and battery operators (or/and owners) are enticed to help achieve objectives of the NINES project, which are briefly outlined above. This report also discusses a potential arrangement that may be utilised by SSEN for procuring future battery operation/services.
1. Introduction
NINES Commercial Arrangements and Economics ReportPage 12 NINES Commercial Arrangements and Economics Report Page 13

In addition, the capital and operational costs of the rollout of DDSM scheme and the large-scale VRLA battery in the project is summarised in this report, together with the benefits brought by these two elements. The benefits are achieved through alleviating renewable energy curtailment, which include the savings in conventional generation cost and additional payments to the renewable asset owners. The costs of using DDSM flexible customers and battery to reduce the renewable energy curtailment are calculated based on these benefits. Furthermore, the report outlines potential costs of using the DDSM and battery in order to enable renewable energy curtailment reduction.
Furthermore, this report analyses economic intervention associated with NINES operations, and wider economic and environmental consequences, as well as measured changes in fuel poverty levels, observed on the Shetland Islands area during the development and operational phases of NINES. In this report specific interventions during NINES are separated into project spending and changes in household electricity demand. These are the primary consequences of the NINES programme. The wider economic and environmental consequences are examined using economic modelling approaches in this report. The wider consequences include economic (based on specific interventions during NINES), environmental, and fuel poverty impacts and changes on Shetland.
The operational effectiveness and associated learnings regarding the above technologies are covered in separate learning reports produced by UoS, as listed in Table 1. These UoS learning reports are available publicly through the NINES website7.
1.3. NINES Commercial Context
All customers on the Shetland Islands have the same rights as GB customers, to choose a supplier and select the appropriate contracts/rates provided by that supplier. In addition to these rights customers who agreed to allow SSEN to flexibly charge their appliances had the right opt in/out of the DDSM scheme at any time.
Since the Shetland Islands are electrically isolated from the GB system, electricity generation costs are significantly higher there. Thus, under the Shetland term8 SSEN is allowed to recover some of the costs of generating electricity on Shetland from all of its customers through its license9. Ofgem has agreed that the ongoing costs associated with the operation and maintenance of the remaining assets trialled in the NINES up to April 2019 will be recovered as part of the enduring solution costs. Discussions on future costs up to 2023 are currently underway.
NINES UoS Reports
DSM: Customer Impact
DSM: Infrastructure
DSM: Network Benefits
Battery: Operational Effectiveness
Frequency Response: Customer Impact
Frequency Response: Operational Effectiveness
ANM: Operational Effectiveness
ANM: Functional Design Report
Commercial Arrangements and Economics Report
UoS Knowledge & Learning Report
Table 1 NINES UoS learning reports
2
Domestic Demand Side Management
NINES Commercial Arrangements and Economics ReportPage 14

To help meet this requirement HHA contracted with Glen Dimplex to install new Demand Side Management (DSM) compatible heating systems in 234 homes on Shetland and SSEN arranged for a communications and management system to be installed to manage the energy demand of these appliances. Heater charging is controlled by using an Active Network Management (ANM) system. The ANM system schedules generation from the wind farms, to help balance peaks and troughs in electricity demand and generation dynamically. The system also reduces conventional fossil fuels generation and allows more intermittent renewable generation to be connected to the network.
2.1 NINES DDSM Overview
In Phase 1 of NINES project, the original plan was to include 750 socially owned homes into the DDSM scheme, in partnership with Hjaltland Housing Association (HHA) and Shetland Islands Council. However, Shetland Islands Council (with over 500 households) chose to opt out of the project at the end of 2012. This resulted in the DDSM scheme being rolled out to 234 HHA owned homes. Social housing has a relatively high turnover in occupancy, and this has had a continuing impact on the overall number of consented properties at any point in time as with each change in tenancy comes the need to obtain consent and agreement from the customers for their heating requirements to remain under the control of the ANM. The turnover of tenants has created a number of administrative challenges and throughout the project SSEN with the assistance of HHA continued to engage with new tenants who have moved into these properties, although in some cases customers either did not respond or elected to opt out of participation11. Thus, at the time of this report, 223 DDSM households, distributed throughout the Shetland Isles, remain in the scheme. These participating homes are divided into 18 DDSM groups, which are then aggregated into two main scheduling groups.
2.1.1 DDSM Infrastructure
To replace the original conventional storage heaters and water tanks, new Glen Dimplex space storage heating and hot water tanks were installed by HHA in the 234 DDSM homes. These energy storage appliances are capable of receiving remote signals every 15 minutes through the DDSM communication infrastructure, and thus allow a more fl exible energy consumption by changing the delivery and amount of energy that is required at diff erent times of the day. The DDSM infrastructure, shown in Figure 1, includes a transceiver that is installed within each heating device and communicates with the Glen Dimplex Home Hub. The Home Hub manages the energy requirements of each of the DDSM devices in the house, and is connected to a Local Interface Controller (LIC). LICs in turn exchange data between households and Element Manager (EM). The EM is responsible for aggregating and communicating data to the ANM control system at the Lerwick control centre that is operated by SSEN and sending control signals between ANM and the LIC. This ANM system is responsible for management and coordination of Distributed Generator (DG) outputs, as well as DDSM and battery so to maintain secure system operation. More detailed information on DDSM infrastructure can be found in DSM Infrastructure report12.
The signals that the DDSM appliances receive instruct them when and how to operate, while also enabling them to send feedback information regarding their status, e.g. if they are charging, are on stand-by, etc. This communication and control enable the DDSM homes to provide capabilities for demand side management. In addition, the installed heating devices are frequency responsive, so that they can, automatically and independently of signals sent by ANM, stop charging if the system frequency drops, or start charging if system frequency rises above the specifi ed limits. Thus, the frequency responsive heaters can help system operator maintain the balance between the demand and supply and therefore, maintain system frequency and security.
As part of Phase 1 of the Integrated Plan for Shetland, submitted to Ofgem in 201110 SSEN were required to provide the infrastructure necessary to actively manage demand, generation, reactive compensation and energy storage assets including water and space heaters to store energy in the form of heat.
2. Domestic Demand Side Management
In addition to following signals sent via the ANM system, the appliances are also enabled to consider the comfort level of occupiers in the households. These DSM capable devices are confi gured to reach and maintain a target room temperature level set by the users. Based on the energy use during the previous day, and in order to ensure the specifi c comfort level required by each participating DDSM household, an algorithm embedded within the heating devices calculates the Daily Energy Requirements (DERs) required to meet the customers requirements in terms of temperature settings and heating periods.
EM gathers the DER calculation results from each household via the LIC throughout the day. The EM then aggregates the DER values according to pre-determined and confi gurable scheduling groups, and sends this information to the ANM at about 23:54, which uses them for the next day scheduling calculations. Once the schedule is determined, the ANM provides an energy delivery schedule to the EM, the EM in turn de-aggregates and forwards instructions to the LIC and the LIC (via the Home Hub) instructs each of the appliances. In normal operation the schedule of the heating appliances in each household (i.e. set points of the space heaters and water tanks) will follow the instructions of ANM DDSM schedule however deviations may occur if the customer decides to override the provided schedule, or in the case of appliances being called to action in relation to a frequency deviation event.
Figure 1 DDSM infrastructure13
NINES Commercial Arrangements and Economics ReportPage 16 NINES Commercial Arrangements and Economics Report Page 17

2.1.2 Geographical Locations of DDSM Households
The geographical locations of the 223 DDSM homes that are distributed on the Shetland Islands are summarised in Table 2, and the number of DDSM households connected to telecom stations are illustrated in Figure 2. The majority (78%) of the rollout houses are in the centre and south of Shetland Mainland, with 63% in the main towns of Lerwick and Scalloway (Table 2). Because of the concentration of DDSM homes in the central towns, most of these houses are supplied by just two substations. However, given that all the DDSM houses were already electrically heated, and the original heaters were replaced by new Glen Dimplex heaters as part of the NINES project, there is unlikely to be additional loading on any of the substations12.
The West Mainland and the North Islands are the most remote and difficult to access physically from LPS and access to houses in these districts for installation and maintenance can be difficult and time-consuming. In many of these areas the mobile phone signal is weak: the installation engineers had to telephone the NINES Project Team to check that the LIC was communicating with the EM, and the time it took to find a place with a mobile signal also added to the resource impact of servicing these houses12.
Area Community Houses
Centre Bressay, Lerwick, Scalloway, 141
South Mainland Burra, Cunningsburgh, Scatness, Virkie 34
West Mainland Bixter, Sandness, Walls 14
North Mainland Brae, Sullom 11
North Islands Unst, Whalsay 23
Table 2 Geographical distribution of rollout houses – total 223
Figure 2 Geographical locations of the 9 communication hubs
2.1.3 Behaviour of DDSM Households
The DDSM households were separated into groups within the EM to facilitate the management and control of DDSM households, as discussed below. Although the management of any remaining flexible demand on Shetland after the end of NINES project is out of the scope of this report, learning regarding how to group DDSM households and how to schedule these groups is expected to be useful for future Shetland Island system operation arrangements that are currently being tendered and assessed. This section reviews the DDSM behaviour based on aggregated groups under the ANM scheduling system.
2.1.3.1 DDSM Groups
There are 18 groups defined for the DDSM homes in the scheduling system. Grouping of the 223 households considers a variety of factors12, with three major factors being:
• The type of devices installed in the households, i.e. storage heaters or hot water tanks, as the two devices have different consumption profiles;
• The type of meter installed in the households, with around 1/3 of DDSM homes having pre-payment meters;
• The tariff arrangements in the households, as the tariffs used in each household are required not to change when the customers opt in to participate in the DDSM scheme.
18 DDSM groups have been created to utilise the flexibility of the heating devices and to take account of customer preferences. The 18 groups comprise 9 groups of storage heaters and 9 groups of hot water tanks and are further subdivided to take account of whether the appliances in the homes receive their energy via either flexible or fixed schedules. For the purpose of analysis in this report, the 18 groups under NINES DDSM scheme have been aggregated into 2 DDSM groups. The aggregation is based on the DDSM flexibility levels defined for the 18 groups. Details of the two aggregated DDSM groups are:
• Group A – Flexible DDSM customers are those households that have accepted their heating appliances will be charged at times that suit the requirements of the network. This group includes a sub group of customers who are on a pre-payment tariff. These customers have been identified as the use of pre-payment tariffs and it is therefore important to monitoring the impact of flexible charging to ensure these customers do not experience any unplanned expense that their credit could be used up for heating storage.
Before these customers were introduced to flexible charging an analysis to determine the potential effects of flexible charging on these customers was carried out by SSEN. The results of this analysis concluded that there would be minimal impact on these potentially vulnerable customers. As a result, on the 5th September 2016 SSEN wrote to all of the pre-payment customers informing them of the intention to flexibly charge the appliances in their homes but advised them to contact SSEN if they had any queries/concerns over this. No comments were received on the intended changes from the customers, so flexible charging commenced in these homes on 26th September 201611. Subsequently, no issues or concerns were raised by these customers in relation to unexpected expenditure.
• Group B – Fixed DDSM customers are the customers who have opted not to have their heating appliances charged at times that suit the requirements of the network. Customers in this group are identified as ‘Opt-out’ DDSM customers. These customers have appliances that are able to be controlled by DSM but have chosen not to be part of the NINES project. Of the 29 fixed DDSM customers, six properties are not wired on a ‘24hour circuit supply14’, which means they are not able to participate in flexible scheduling. Customers who chose not to consent to take part in DDSM will still provide some network benefits to the network, as they are available to be flexibley charged within their existing tariff period (“fixed” rather than “dynamic” DDSM). In addition, the appliances are frequency responsive1 and are therefore capable of providing network stability benefits when frequency events occur11.
NINES Commercial Arrangements and Economics ReportPage 18 NINES Commercial Arrangements and Economics Report Page 19

The number of households aggregated in these two groups prior to and after the 26th September 2016 is summarised in Table 3.
2.1.3.2. DDSM Heating Demand Profiles
The DDSM data from the storage heaters and hot water tanks, including the number of devices reporting, heating profiles and DERs, is communicated through the Home Hub to LIC which uploads them into EM. EM aggregates the DDSM data for the 18 groups and sends this information to the ANM control system. The ANM then determines the overall energy requirements and schedules the delivery of the energy at times that best suit the network. During daily normal DDSM operation, flexible/fixed DDSM customers receive flexible/fixed active schedules which is calculated by ANM and issued through EM, respectively. However, in the event that the communication between the ANM and EM or between the EM and LIC is lost, each of the 18 groups has a default schedule15 which is issued daily by the ANM and also held locally at the LIC. The default schedule is followed until communication resumes.
The heating demand profiles (including both storage heater and hot water tanks) for the aggregated
2 DDSM groups are presented in Figure 3 and Figure 4 for two case studies in 2016,
• Case I: One of the maximum demand/generation output days on Shetland in winter 2016: on 28th January 201616
• Case II: One of the minimum demand/generation output days on Shetland in summer 2016: on 23rd July 201617
The behaviours of each aggregated group for these two cases are analysed below. Further activities of the generators outputs and battery for the same case studies are presented in sections 3.4 and 4.1, respectively.
It can be observed from Figure 3 that the appliances in Group A received their required power at different times in these two case studies. The amount of power consumed in winter and summer periods varies. In winter (Case I), the minimum power consumption of flexible consumers is about 35kW and maximum at around 330kW. During summer (Case II), the appliances consume between 25kW and 150kW. The total heating consumption of Group A in Case I is 1.88MWh, while it is 0.9MWh in Case II. As expected, during the summer, the heating consumption is lower than that in winter. As the consumption of the fully flexible DDSM customers can be scheduled at different times (i.e. flexible in time), the time when peak demand occurs also varies between the two case studies. The peak of Group A in Case I occurs during 0am – 3am and from 10 pm until the end of the day. During summer Group A has smaller peaks, and they occur between 0am – 5:30am with a flat consumption during the rest of the day. The summer peak is lower and lasts a relatively short time, compared to a winter consumption, which is expected since customer energy needs for space heating are significantly reduced in summer with hot water heaters predominantly contributing to the flexible load curve.
Prior to 26th September 2016
Group A – Flexible DDSM customers 109
Group B – Fixed DDSM customersPre-payment customers
11687
‘Opt-out’ customers 29
Since 26th September 2016
Since 26th September 2016
Group A – Flexible DDSM customers (Pre-payment customers moved to Group A) 194
Group B – Fixed DDSM customers 29
Table 3 Number of households in different DDSM group14
Figure 3 Heating consumption curves of DDSM Group A in Case I & Case II 16 17
The appliances in Group B have their energy requirements delivered via a fixed schedule and thus their aggregate load curve differs from that of appliances in Group A, as indicated in Figure 4. In Case I, the peak heating demand of the Group B appliances is around 150kW, while in Case II it around 90kW. The total heating consumption of Group B in Case I is approximately 1.78MWh, and in Case II the value is about 1.27MWh. The total heating consumption of Group B in
the summer is about 70% of that in winter, it is thought that this relatively small reduction in summer demand is in large part due to the climate on Shetland, which results Shetland customers uses more energy for electric heating in summer. In addition, the minimum consumption of fixed customers is zero in July, while it is around 10kW in January. Customers in the Group B also have different charging times for the space heating devices and hot water tanks. The charging time for
NINES Commercial Arrangements and Economics ReportPage 20 NINES Commercial Arrangements and Economics Report Page 21

these DSM-capable devices on fixed schedules is distributed into the morning, afternoon, and nighttime during a 24 hour period. Depending on the weather, the charging activity of these devices may vary (e.g., it would require less heating in summer than that in winter). It can be observed that the peak heating demand of the Group B occurs at similar time periods in summer and winter.
The peak occurs approximately 0am – 3am (Group B in Case II does not have a peak during this time), 4am, 10am – 12pm (Group B in Case II has a shorter peak at around 11 am), 4pm, and 6pm – 9pm (Group B in Case II has a shorter peak between 6pm and 8pm). This is due to fixed charging time settings for the heating devices in Group B.
Figure 4 Heating consumption curves of DDSM Group B in Case I & Case II 16 17
It can be observed that the flexible customers (i.e. customers aggregated as Group A) have different shapes of the heating profiles, while the fixed Group B has similar peaks during a day. In addition, since the majority of DDSM customers are included in the flexible group currently, this would provide additional flexibility into the Shetland operation.
2.2 NINES DDSM Customer Engagement
Following the withdrawal from the Project by Shetlands Islands Council (SIC) in 2012, SSEN proposed to recruit 500 private domestic customers to provide DDSM. This required the development of an Open Market Model. SSEN took the view of using the withdrawal of SIC as an opportunity to expand the offering of DSM beyond the social housing market. In order to achieve a DSM offering which would be suitable to the open market, SSEN developed a sustainable Market Model for DDSM on Shetland, which could be used to attract different customer types, i.e. private home owners and private landlords.
The NINES project has applied six core methods of engaging with customers throughout the Project, these are listed below:
• Issue PaymentsA participating HHA customer received a £100 participation payment 6 months after installation of the DSM-capable heating devices, under the condition that it allowed continuous collection and analysis of data for at least those 6 months. SSEN is responsible for the participation payments, and the payments are made directly to end users.
• Website UpdatesThe NINES project website is updated regularly by SSEN, and includes information on project progress, latest news, and in addition has a ‘contact us’ facility. The full suite of Knowledge and Learning Reports detailed in Table 1 have also been uploaded to this site. This ensures Shetland customers, as well as any other stakeholders and interested parties, are informed with the latest updates of the NINES project, and participating customers can obtain the details of contact so to make direct requests regarding any issues with the DDSM scheme.
• Hosting of Local MeetingsAt an early stage local community meetings were held by SSEN and HHA, with the aim of providing customers with an overall background of the NINES project, and to provide an opportunity for these communities to ask relevant questions.
• Issuing of Written CommunicationWritten communications are in the format of letters. The written communication between SSEN, HHA, and customers includes welcome packs, press releases, consent letters, opt-out forms, heating devices user manuals, newsletters and surveys.
• Initiate Phone CallsThe phone calls are mainly used for arranging home visits and responding to customer queries where appropriate.
• Carry Out Home VisitsHome visits were used from time to time to respond to issues that customers raised and to ensure that new tenants were aware of the way the appliances can be set to meet their requirements in terms of heat and hot water.
During the lifecycle of the NINES project, ongoing communication was made between customers and SSEN. The benefit of the ongoing communication was to maintain customers’ interest in the DDSM scheme and to keep customers informed of latest project updates. Moreover, customers were encouraged to inform the project team of their circumstances changes and their feedbacks.
HHA tenants joining the NINES DDSM engagement scheme had the same rights as any other Shetland customers in terms of being able to choose their preferred supplier, however, if the tenant opted for a tariff that was not compatible with the NINES arrangements they would no longer be able to participate in DDSM as part of the NINES project. In addition, the participating HHA households could choose to opt out and conclude their participation at any time. At the request of customers and at change of tenancy the data collection process required to provide flexible charging was stopped by SSEN.
2.3. NINES DDSM Costs and Benefit Analysis
The costs of the NINES DDSM scheme are presented in detail in section 2.3.1, including the costs of rolling out DDSM and DDSM ongoing support costs after the NINES Project ended, while the benefits that could be achieved by the DDSM are discussed in section 2.3.2. A cost-benefit analysis for the DDSM flexible customers is provided in section 2.3.3, which additionally considers the potential cost value that could be achieved in the future if the heating capacity of these flexible customers would be contributed to absorbing the curtailed renewable energy.
2.3.1. NINES DDSM Costs
This section provides an overview of the DDSM scheme costs over a 3.5-years roll-out period and a summary of costs related to the implementation of DDSM trial. Table 412 overleaf lists the costs of the DDSM trial design, development, roll-out, as well as the operational support cost caused by DDSM customer services.
NINES Commercial Arrangements and Economics ReportPage 22 NINES Commercial Arrangements and Economics Report Page 23

The total cost of the DDSM scheme and support services is £3.2 million, which is shared between SSEN and HHA. SSEN’s costs are funded via Ofgem through the NINES project. HHA managed the costs associated with the Glen Dimplex appliances, including installation and tenant liaison. Thus, HHA contributes approximately 35.2% of the total cost. In addition, 49% of the costs are related to the design, specification, development, and delivery of the DDSM communication infrastructure. The remaining part of the costs is used for interactions with customers, including incentives and customer service support. Average total cost for each of the DDSM homes is £13,818, with SSEN paying £8,860 per house.
To provide services to the DDSM customers, there are ongoing operational support costs that, under the current scope, occur every year after the end of the project. The operational costs for the following years, as estimated by SSEN, are summarised in Table 5. The ongoing operational support costs contain communications network, customer service unit, IT support and maintenance work carried out by contractors. Total ongoing operational support cost will be £491k per year for all customers. It is assumed that 20% of houses will be visited every year for the maintenance carried out by contractors. Therefore, the average ongoing operational support cost for each DDSM households is £2,098 per year, with SSEN paying £1,970 per house per annum.
2.3.2. NINES DDSM Benefits
The NINES DDSM benefits are considered from two aspects:
i) benefits to individual DDSM customers
ii) benefits that the DDSM could bring to Shetland network
The benefits to individual DDSM customers are summarised as incentive payments and reduction in heating consumption. The benefits that the DDSM could bring to Shetland network is illustrated through the amount of renewable generation curtailment alleviated by flexible DDSM customers, based on which additional benefits to the renewable asset owners and savings in the conventional generation cost are determined.
Benefits for DDSM customersFinancial incentives were offered to customers when they consented to continuous collection and analysis of data by SSEN. A one-off payment of £100 was payable to the participated customers six months after installation and sign up, under the condition that the data collection process was allowed for at least six months. An additional £50 was paid to the existing customers that agreed to install independent monitoring18. Following this initial payment no further financial incentives were offered to customers however this has had no detrimental effect on the sign up rates for customers changing tenancy or re-joining.
The majority (77%) of the current DDSM houses were on either Total Heating, Total Control or Domestic Economy and Heating Load tariffs controlled via teleswitches which allow a low rate supply at any time of the day defined by the system operator2. The NINES DDSM: DSM Network Benefits report2 has concluded that moving houses from teleswitching to flexible DDSM could reduce their maximum possible load at peak times by 0.5MW, assuming the devices follow schedules. Existing teleswitching customers could see a theoretical reduction in heating consumption in the region of 10–18% and better regulation of temperature within their homes.
Total (£) Cost per house (£) Funded by Notes
Direct costs at houses
In house devices 471,726 2,016 HHA Dimplex space storage heating and hot water tanks
In house installation 628,274 2.685 HHA
LICs & communications setup 149,360 638 NINES Home hubs, comms, LICs, and home hub replacements
Incentive payments 23,650 101 NINES Each customer that opted in was paid £100, and those with independent monitoring received an additional payment of £50 each.
1,273,010 5,440
Direct costs – shared infrastructure
EM development & Airwave comms
£600,000 £2,564 NINES EM, LIC, and Airwave commsDesign, development, and test costs
Communications license and support
£858,000 £3,667 NINES £286k for 3 years
Database development £25,000 £107 NINES
Servers & related infrstructure £50,000 £214 NINES Server development
IT network £50,000 £214 NINES Hardware and IT serviceSpecification, design, and delivery
£1,583,000 £6,766
Operational support
Tenant liaison £45,000 £192 Shared between HHA and NINESHHA – 2 FTE NINES – 0.3 FTE
2.3 Full-time Equivalent (FTE)
Customer Service unit £245,000 £1,047 NINES DDSM Customer support/queries team Up to3 FTE for 3.5 years
IT support – in house & third party
£87,500 £374 NINES 3.5 years at £25k/year
£377,500 £1,613
Grand total £3,233,510 £13,818
Total per year (£) Cost per house per year (£) Funded By
Communications network 286,000 1,222 NINES
Customer Service unit 150,000 641 NINES
IT support 25,000 107 NINES
Contractor Maintenance 30,000 128 HHA
Grand Total 491,000 2098
Table 4 Costs (£) of NINES DDSM rollout and support through project phase12
Table 5 Costs (£) of NINES DDSM support after project phase12
NINES Commercial Arrangements and Economics ReportPage 24 NINES Commercial Arrangements and Economics Report Page 25

Additional Renewable generationAs detailed in ANM: Functional Design, Infrastructure & Comms report19, the functional ANM system consisting of Smarter Grid Solutions (SGS) Balance and SGS Power Flow was commissioned in February 2015. SGS Balance utilises wind forecast data to determine profiles for ANM Controlled Generation (ACG). The flexibly connected distributed generation, referred to as ACG in this report is introduced in section 3.3. Controllable demand was then scheduled to alleviate constraints identified in the scheduling process. Where ACG is forecast to be constrained, controllable demand is applied in order of largest DER to smallest. The remainder of each DER and the battery energy requirement are then allocated in the next steps of the algorithm (fill troughs).
The flexible demand Group A includes DDSM groups 1 and 2. In addition, the pre-payment customers DDSM groups 3, 4, 7, and 8 were moved from inflexible to flexible scheduling on 26 September 2016. Over the period from 2 February 2016 to 31 January 2017 during which North Hoo and Luggies Knowe were connected on the network, the reduction in ACG curtailment provided by each flexible demand is evaluated.
Figure 5 provides an example explaining how the battery and DDSM increased the constraint on renewable generation and alleviate the curtailment. As Figure 5 shows, flexible DDSM and the battery alleviated the curtailment of renewable generation by 0.26MW and 0.18MW respectively at 23:00 on 6/12/2016 where the DER-based order of flexible DDSM customers being applied was group 1, 3, 2, 4, 7 and 8.
It is estimated that around 77MWh of renewable energy curtailment has been alleviated by DDSM groups, over the period from February 2016 to January 2017.The amount of ACG curtailment (in MWh) alleviated by each group for the period under review is shown in Figure 6. Group 1 and 2 alleviated 66.8MWh renewable energy reduction during the evaluated one-year period. Since Group 3, 4, 7 and 8 (as pre-payment customers) were moved to flexible scheduling at the end of September 2016, these customers reduced 10.2MWh renewable curtailment, from September 2016 to January 2017. Moreover, the total amount (MWh) of reduction in ACG curtailment achieved by each group in each month are plotted in Figure 7, where it can be observed that the pre-payment customers were moved to flexible demand at the end of September 2016. Furthermore, the renewable generation curtailment alleviated through flexible DDSM customers for each ACG, i.e. North Hoo and Luggies Knowe, over the evaluated period is shown in Table 6.
Benefits to DGs Received through Feed-in TariffFrom the perspective of renewable asset owners, reductions in ACG curtailment achieved by flexible DDSM customers will bring additional benefits. The benefits of bringing additional ACG onto the network primarily consist of Feed-In Tariff (FIT): a ‘generation tariff’ which is a fixed price (p/kWh) dependent on the technology type and installation size; and an ‘export tariff’ that is a bonus payment (p/kWh) of surplus electricity exported to the network. The ACG has the opportunity to decline the ‘export tariff’ and negotiate their own Power Purchase Agreements (PPAs) with electricity suppliers. In this section, the ‘export tariff’ is used to provide an estimate of potential earnings by generators for energy exported into the network. As presented in Table 6, the ACG curtailment alleviated by the flexible DDSM customers was estimated to be approximately 26.1MWh at North Hoo and 50.9MWh at Luggies Knowe over the period from February 2016 to January 2017. Based on the ‘generation tariff’ and ‘export tariff’ rates (p/kWh) published by Ofgem20 21, the fees paid to North Hoo and Luggies Knowe for their additional export (Table 6) are estimated to be approximately £6,261.83 (‘generation tariff’ £4,979.17 and ‘export tariff’ £1,282.66) and £4,101.83 (‘generation tariff’ £1,606.14 and ‘export tariff’ £2,495.69) respectively.
Figure 5 Flexible DDSM customers and battery alleviated the curtailment by 0.26MW and 0.18MW respectively at 23:00 on 6/12/2016
Figure 6 Yearly total renewable power curtailment alleviated by the flexible DDSM customers, February 2016 – January 2017
NINES Commercial Arrangements and Economics ReportPage 26 NINES Commercial Arrangements and Economics Report Page 27

Savings in the conventional generation cost Operating with ANM calculated schedules, approximately 77MWh energy used to charge the DDSM was supplied by ACG. Otherwise, the 77MWh energy absorbed by DDSM groups would have been derived from conventional generation. Therefore, the application of the DDSM can not only bring additional benefits to renewable asset owners but also reduce the conventional generation cost. An estimated cost for conventional generation on Shetland in the period evaluated is £200/MWh which includes all usage, spinning reserve, fuel and maintenance. The cost of conventional generation displaced by 77MWh ACG was approximately £15,400, which was £5,036.34 higher than the total FIT payment for the additional ACG absorbed by the DDSM. Considering the electricity suppliers apportion the FIT costs to all their electricity customers, only the export rate is part of the Shetland costs. Therefore, the fees paid to ACG for their additional energy exported to the grid through PPA were estimated to be approximately £3,778.35. The application of the DDSM saved £11,621.65 through absorbing the additional ACG which would otherwise be curtailed over the period from February 2016 to January 2017.
2.3.3 NINES DDSM Cost – Benefit Analysis
The cost of using the DDSM heating devices to reduce the curtailment of renewable generation is introduced in this section.
To calculate a total cost of installation and maintenance of the heating devices, it is assumed that the storage heaters and hot water tanks have a lifetime of 20 years (this is in line with HHA’s heater replacement programme), and the DDSM scheme would continue to operate on Shetland over the same period. As a result, the lifetime total cost of the DDSM scheme is about £11.34 million.
As calculated above in the DDSM Benefits (section 2.3.2), flexible DDSM customers helped alleviate 77MWh of renewable curtailment, in the period of February 2016 to January 2017. Thus, the cost of alleviating the renewable curtailment through flexible DDSM would be £7,360.40/MWh.
Since 26 September 2016, 6 of the 18 DDSM customer groups are identified to be able to alleviate renewable curtailment. Considering that the pre-payment customers (group 3, 4, 7 and 8) were moved into the flexible scheduling on 26th September 2017, the cost could be reduced if these groups had provided flexibility for this one-year period (February 2016 to January 2017). It is calculated in the DDSM Benefits (section 2.3.2) that group 1 and 2 flexible customers have alleviated 66.8MWh renewable energy reduction in the evaluated one-year period, and pre-payment customers has reduced 10.2MWh renewable curtailment from September 2016 to January 2017. Through assuming the same percentage of flexible customers heating capacity is used for alleviating renewable curtailment, it is expected these 6 groups of flexible customers could alleviate 105.7MWh renewable curtailment over one year, provided that the pre-payment customers were moved to the flexible scheduling at the beginning of the period under review. The cost of using flexible DDSM to reduce renewable generation curtailment is expected to be £5,364.75/MWh, which represents a decrease of 27% assuming the pre-payment customers provided flexibility for a full year.
As mentioned above, a DER value is produced for each DDSM household to ANM every day at around 23:54, and then used by the ANM to produce a delivery schedule for the next day. The DERs of these flexible groups, including the pre-payment customers moved into flexible groups, are estimated to total 1GWh in one year. The rules by which DDSM operates mean that wherever possible appliances in the flexibly charging groups are scheduled to apply primarily at times that NINES connected renewable generators would otherwise be curtailed. This leads to a reduced estimated cost of renewable energy curtailment to £560.94/MWh, under the condition the scheduling of the flexible customers heating devices perfectly aligns with the times when renewable energy is curtailed.
As the NINES Project has now officially closed there is no possibility of adding to the number of customers participating in DDSM. In theory, however, if more homes were participating this would lead to more alleviation of otherwise constrained renewable generation which in turn would lead to a reduction in the estimated cost of renewable energy curtailment noted above.
Figure 7 Monthly total renewable power curtailment alleviated by the flexible DDSM customers, February 2016 – January 2017
Table 6 FIT payments (£) for additional export enabled by DDSM, from February 2016 to January 2017
Wind Farm Time Period Additional Export (MWh)
Generation Payment (£) Export Payment (£) Total Payment (£)
North HooFeb 16 –Mar 16 1.47 276.78 71.29
6261.83Apr 16 – Jan 17 24.67 4702.39 1211.37
Luggies Knowe
Feb 16 – Mar 16 3.25 101.38 157.604101.83
Apr 16 – Jan 17 47.62 1504.76 2338.09
NINES Commercial Arrangements and Economics ReportPage 28 NINES Commercial Arrangements and Economics Report Page 29

This section introduces generators currently operating on the Shetland Islands. These generators include both conventional and renewable generators, with capacities ranging from 45kW to 67.7MW. The renewable generators are connected under two different commercial arrangements, which are ‘must-take’ (i.e. not curtailable) and flexibly connected (i.e. curtailable).
3. Shetland Generators
Unit Number Station Engine Type Rated Output (MW)
3 A Diesel Engine 4.6
4 A Diesel Engine 4.6
5 A Diesel Engine 4.6
8 A Diesel Engine 3.5
10 A Diesel Engine 4.6
11 A Diesel Engine 4.6
13 A Diesel Fuelled Gas Turbine 5
14 A Diesel Fuelled Gas Turbine 5
21 B Waste-Heat Steam Turbine 2.1
22 B Diesel Engine 8.1
23 B Diesel Engine 8.1
24 B Diesel Engine 12.7
Table 7 12 engine units in LPS
3.1 Conventional Generators
Two conventional generators currently exist, which are Lerwick Power Station (LPS) and Sullom Voe Terminal (SVT). These generators supply most of the Shetland demand, LPS was commissioned in 1953 and consists of 12 diesel engine sets of varying sizes as detailed in Table 7.
The total maximum output of LPS is 67.7MW. And the station also is a major contributor to system stability on Shetland. The reserve of Shetland electricity network is currently achieved by appropriate scheduling of the available generators to meet demand with sufficient reserve capacity to provide a secure supply. The generation output at LPS is required to be at least 40% of the overall Shetland demand. In addition, the number of engines of LPS online provides necessary margin and allows stability limits for N-1 operation. The 12 engine units at LPS are split across two “stations” eight in A’ station’ and four in ‘B’ station’, as presented in Table 7. ‘B’ station engines are used as baseload and run continuously for long periods of time, while ‘A’ station engines are used for covering the peak demand and may only be switched on shorter timescales22.
3
Shetland Generators
NINES Commercial Arrangements and Economics Report Page 31
Typical running regime of LPS engine units is an A’ and B’ station set in summer. In Winter, this is more likely to be two B’ Station engines. An additional A’ Station set may be started up to cover peak demand23.
LPS is reaching the end of its operational life, and Ofgem required SSEN to deliver a market based solution for replacement of this asset through a competitive tendering process. The tendering process was started in May 2016, with bidders responding with detailed proposals to address one or more of the following “lots of services”24:
• Reliable Provision of Availability and Energy
• Intermittent Provision of Energy
• Reduction of Energy Consumption
• Provision of Additional Services
A tender evaluation process is under way, with support from a number of specialist consultants. SSEN will present the preferred solutions for consultation to Ofgem in summer 201725 and contracts are expected to be signed later in 2017 if regulatory approval is granted26.
The future asset owner(s) that will replace LPS will require new commercial agreements to be in place with the system operator on Shetland in order to maintain the secure and stable operation.
SVT is a large-scale oil terminal located in the northwest of the Shetland Mainland, which has an installed capacity of 100MW. It consists of 4 large gas turbines connected in parallel, with each of the turbines having a rating of 25MW, only two of the units are in operation at any time. SVT is operated by a third party and although its main role is to supply the internal demand of the oil terminal, a portion of the SVT output is procured by SSEN to meet part of the islands energy demand. This SVT export is subject to both commercial and network constraints, and varies between 15MW and 5MW all year around. The gas turbines at SVT also help balance the Shetland network, and SVT provides the majority of spinning reserve capability to the Shetland system. The gas turbines at SVT provide first response to frequency deviations. Two key scenarios are studied by Frequency Response Operational Effectiveness report1, which are when SVT is online and offline. The aim of that study was to investigate the effectiveness of frequency response in the Shetland network when a sudden loss of renewable generation happened. Under the scenario when SVT is online, the frequency response of the system is examined under maximum demand, average demand, and minimum demand situations.
The Frequency Response Operational Effectiveness report1 concludes that better frequency response is observed when the gas turbines at SVT are online as they can provide quick response to any change in system frequency.
3.2 “Must-take” Renewable Generators
The first renewable generator on Shetland was Burradale wind farm, which was commissioned in 200024. Burradale wind farm is a privately-owned wind farm which has an installed capacity of 3.68MW.
It consists of two 850kW turbines and three 660kW turbines. The three 660kW turbines were installed in 2000, and the two 850kW turbines were installed in 2003. Burradale wind farm is located in the centre of Shetland mainland, just a few miles outside of Lerwick. Burradale is connected under a ‘must-take’ arrangement. The average annual capacity factor of Burradale is around 52%, which is very high compared to that of most European wind farms which are typically around 20%.
The Ollaberry wind farm was commissioned in 2014, and is located in the North mainland24. This wind farm is also privately owned and has a capacity of 180kW, with one 80kW and one 100kW turbine27. The power output of Ollaberry is also ‘must-take’.
It is worth noting that prior to the NINES Project, despite the significant wind and tidal reserves on Shetland there was no possibility of increasing the amount of renewable generators connected to the Shetland network.
3.3 Renewable Generators Connected via NINES
In addition to Burradale and Ollaberry wind farm, five renewable generators with a total capacity of 8.545MW have been commissioned on Shetland via a managed connection controlled by the NINES ANM. These are (in order of connection date):
• Cullivoe Tidal (45kW trial tidal turbine)
• North Hoo, (500kW)
• Luggies Knowe Windfarm (3MW)
• Shetland Tidal (500kW)
• Garth Windfarm (4.5MW)
All of these generators are connected under flexible commercial arrangements, which means the power output can be curtailed according to the requirements of the Shetland network. The main reasons that cause restricted DG access on Shetland include,
• The Shetland network is unique as it is isolated from the GB mainland network, and therefore the Shetland demand must be met by its own supply.
• Limitations on the Shetland circuits might lead to power transfer constraints on the network
• Limitations on the available generation at SVT
• Limitations on energy storage
• Varying Shetland demand and wind generation.
The key to managing these conditions and ensuring generation is utilised wherever possible is the operation of the ANM.
The NINES managed renewable generators on Shetland are connected under Last In First Off (LIFO) arrangement. For generators connected under LIFO arrangement based on their position in the NINES queue, the first generator in the queue will be the first to be offered to generate on to the Shetland network and will be the last to be disconnected. A stack position in LIFO order (i.e. the order of curtailment) is determined by the order of acceptance of the connection offer and will not be affected by any additional generators that connect at a later date. The flexibly connected DGs on Shetland are referred as ACG in this report.
To summarise, the outputs of LPS and SVT can be controlled and scheduled, while the output of Burradale and Ollaberry wind farm is non-controllable and ‘must-take’. The outputs of the flexibly connected renewable DGs are controlled by ANM and can be curtailed when needed. The ANM system schedules the setpoints of the controllable (i.e. flexibly connected) DGs by implementing a series of constraint rules that have been applied to the algorithm within the ANM, in order to maintain network integrity. The outputs of the flexibly connected controllable distributed generators are thus limited by their active set-points, which are determined based on real-time data combined with the constraint rules. More details on the ANM constraint rules can be found in the Battery Operational Effectiveness report3, ANM Operational Effectiveness report28, and ANM: Functional Design, Infrastructure & Comms report19.
3.4. Outputs of Generators
Generation outputs on Shetland including LPS, SVT, Burradale, Luggies Knowe and North Hoo are analysed here for two critical days during winter and summer seasons in 2016. Note that the Garth wind farm was connected and commissioned in March 2017, therefore is not included in this analysis and the Shetland Tidal Array generator was under test during this period of time and therefore was not generating consistently. The same two case studies identified in section 2.1.3.2 for evaluating the DDSM heating profiles are used here to illustrate generation outputs, i.e.
• Case I: One of the maximum demand/generation output days on Shetland in winter 2016: on 28 January 201629
• Case II: One of the minimum demand/generation output days on Shetland in summer 2016: on 23 July 201630
The power outputs of the five generators, for these two case studies are presented in Figure 8 and Figure 9. LPS and SVT are the conventional generators, the output of Burradale wind farm is a ‘must – take’, while Luggies Knowe and North Hoo wind farm have a flexible connection and can be curtailed if needed as described above. As mentioned above, access rules of flexible connected renewable generators are provided on a LIFO basis, with the stack order of each of the ANM controlled distributed generators given in section 3.3.
Outputs of the five generators analysed here are presented in Figure 8 for Case I. The total maximum output of these generators is 40.54MW at 1pm on 28th January 2016, and throughout the day (from around 3 am till midnight) their combined output does not drop below 30MW. LPS produces over half of the Shetland supply in Case I. The maximum output of LPS is around 26MW, which is about 38% of its capacity, while the maximum SVT generation is at about 13MW, which is approaching its commercial contractual upper limit on power export of 15MW. For most of the time in Case I, Burradale wind farm generates at 3.68MW, which is its maximum capacity. Similar activity can be observed for Luggies Knowe wind farm, which generates at its maximum capacity (3MW) for the majority of time in Case I. Its output drops below 2MW during a small number of off – peak time slots, e.g. 2:45am – 3:30am and 10:15am – 11:15am. North Hoo wind farm also generates at around its maximum capacity of 0.5MW during the Case I.
Figure 9 shows the activities of the generators in Case II, on 23 July 2016. The maximum generation during that day is about 18MW at 4:30pm, which is around half of the maximum of total generation output in Case I. The minimum value during Case II is around 13MW at 4:45am, which is close to the overall minimum demand on Shetland at around 11MW7.
NINES Commercial Arrangements and Economics ReportPage 32 NINES Commercial Arrangements and Economics Report Page 33

The total output power of the generators exceeds 16MW between 9am and 6:45pm in Case II, which is very low compared to the similar time period in Case I.
In Case II, LPS supplies approximately half of the total generators’ outputs, with the maximum output of LPS of 9.5MW at around 10:15am. The output power of LPS fluctuates between 7.5MW and 9.5MW with an average output at around 9MW. Export of SVT is relatively stable throughout the day (except a slight dip at 4:30am) and is around 6 – 8MW, which is about 40% – 50% of its maximum export limit. Due to commercial constraints, minimum export limit of the SVT is 5MW, it occurs from 2:30am – 5am in Case II.
Furthermore, Burradale wind farm generates around 0.3MW throughout the day, with the maximum generation of 0.6MW at 4:45 am. Also, it can be noted from the Figure 9, that Luggies Knowe wind farm generates at 12am, 7:30am – 8:45am, 2:15pm – 6:45pm, and 11pm – 11:30pm, which corresponds to the peak times in Case II. North Hoo does not generate at all during this day. The low generation outputs of the Luggies Knowe and the North Hoo wind farm are due to insufficient demand on the island during that day, which causes the ANM to issue curtailment instructions to these two generators.
The Shetland network is an islanded network which means the total generation output must match the islands’ demand. LPS contributes to approximately half of the generations in Case II, while it has a higher percentage during Case I. Levels of SVT exports depend on the seasons, but in both case studies the same export constraints have to be satisfied. The ‘must-take' arrangement of Burradale wind farm enables it to produce at its full capacity (subject to wind availability), or receive a constraint payment if it has to be curtailed. On the other hand, Luggies Knowe and North Hoo are under flexible connections, which means the outputs of these two wind farms are curtailable as could be seen in Case II.
Figure 9 Output power of Shetland five generators in Case II30
Figure 8 Output power of Shetland five generators in Case I29
NINES Commercial Arrangements and Economics ReportPage 34 NINES Commercial Arrangements and Economics Report Page 35

A Battery Energy Storage System (BESS) has been utilised on NINES with the expectation that it could help to meet a number of the project objectives.
4. Battery
Principally these are:
• reduce the overall demand to be met by conventional generation at LPS by discharging the battery during periods of peak demand,
• reduce the output of conventional generation at LPS, and smooth the demand profile on Shetland by charging the BESS at periods of low demand and discharging at periods of high demand,
• minimise the levels of curtailment for renewable generators connected via the NINES ANM by using surplus renewable energy to charge the BESS where possible.
4.1 NINES Battery Operation
Initially, a 1MW 6MWh NAS battery was planned to be installed at LPS. However, after an incident involving the same technology in Japan31, and after consideration of the risk assessment, SSEN concluded that due to safety concerns related to the location of this installation at LPS, NAS was no longer a suitable technology to be used on Shetland32. In September 2013, agreement was reached with Ofgem to replace the NAS battery with a 1MW 3MWh Valve-Regulated Lead-Acid (VRLA) battery. The battery system comprised in part of 3,168 individual cells. This BESS was duly installed and was commissioned in February 2014.
During the period between February 2015 and May 2015, ANM calculated schedules were used to manage the charging and discharging of the BESS however during this period issues were identified with the operational impact of the ANM calculated schedules which resulted in unsatisfactory utilisation of the battery (47.2% utilisation evaluated exclusive of outages)3. Following the identification of these issues the battery a decision was taken to utilise the BESS via manual scheduling. The principal aims of the manual scheduling were to:
a) discharge during periods of high demand to reduce the demands met by conventional generations;
b) charge at times of low demand.
In the first full year of operation33, approximately 288 cycles were achieved taking into account the number of days when maintenance of the battery was carried out, and the battery not being utilised over weekends during the early stages of operation. Throughout the project timeframe, the battery was maintained twice a year, in March and September. In the period of operation from September 2014 to November 2016, the battery was cycled 612 times, with the total discharge power of 1.34GWh during this time3.
As the battery was manually scheduled to be charged during periods of low demand and discharged during peak times, it contributed its full capacity when the demand reached its maximum value, i.e. it released 3MWh of energy to reduce the conventional generation output during peak times. Typically, a battery has a minimum State of Charge (SOC), which is imposed by the battery manufacturer and the VRLA battery system used in the NINES project is configured such that the minimum level of SOC was configured to be 45% of the battery capacity. The maximum SOC the battery can reach is 100% of its capacity.
The charging of the battery, was carried out at times when Shetland system experienced minimum demand. The charging regime was delivered at a rate of 1MW every 15 minutes until SOC reaches 80%. Once the SOC reached 80%, the rate of battery charging per 15 minutes was reduced to 660kW, once the SOC reached 90%, the rate of charging at each 15 minutes was further reduced to 330kW. Therefore, it typically took around 6 hours for the battery to reach a fully charged state. This stepping down charging profile (Figure 10) is carried out so to regulate the charging current flowing into the battery.
4
Battery
NINES Commercial Arrangements and Economics Report Page 37

In addition to reducing conventional generation outputs during periods of high demand, the role of the BESS is to enable additional integration of renewable generators connected via the NINES ANM. The operation of the BESS operating under ANM control could theoretically allow up to 4MWh of renewable generation each day that would otherwise be curtailed. Curtailment rules and their influence on outputs of generators are explained and discussed in detail in the Battery Operational Effectiveness report3, ANM Operational Effectiveness report28, and ANM: Functional Design, Infrastructure & Comms report19.
On 16 January 2017 an incident occurred whereby 2 cells were found to have failed. Investigations into the cause of this incident were carried out by SSEN, S&C Electric Ltd, the contractor chosen by SSEN to supply and install the battery and ancillary systems, and Yuasa, a contractor to S&C who manufactured the battery cells. These investigations resulted in the identification of an additional 370 cells in various level of deteriorating charging capacity.
Following the conclusion of these investigations and at the recommendation of S&C Electric Ltd, the battery was removed from service.
4.2 NINES Battery Scheduled Activities
The charging and discharging schedules of the installed VRLA battery have been analysed for the same two case studies that have been used for analysis of DDSM (in section 2.1.3.2) and generators outputs (in section 3.4), i.e.,
• Case I: One of the maximum demand/generation output days on Shetland in winter 2016: on 28 January 201629
• Case II: One of the minimum demand/generation output days on Shetland in summer 2016: on 23 July 201630
Battery charging and discharging schedule for the Case I is given in Figure 11. Note that positive values of power (MW) indicate that the battery is charging, while negative values are when the battery is discharging. The maximum charging and discharging power rates in every 15 minutes are both at 1MW, and the charging rate follows the stepping down profile when the battery SOC reaches certain levels, as illustrated in Figure 10. It can be observed that in both case studies the operation of the battery follows the manual battery schedule, i.e. the battery charges during the off peak time when demand is low, and it discharges at the peak demand.
The battery starts charging from the beginning of the day, and from 1 am the charging power started to decrease as the value of SOC is increasing. As mentioned above, the stepping down of the battery charging power is used to regulate the input charging current. The battery is set to discharge to reduce peak demand met by conventional generators. It discharges at 1MW during each 15-minutes time interval for a maximum of 3 hours. The 12 slots of discharging can be noted in Figure 11 from
12:30pm – 1:30pm and 3:15pm – 5:30pm during peak time periods in Case I. At the end of the day, the battery starts its charging activity when the demand is lower and the renewable generators (Burradale, Luggies Knowe, and North Hoo wind farm) output at their full capacities. Details on the generators outputs can be found in section 3.4.
Figure 11 Battery schedules in Case I29
Figure 10 Battery stepping down charging profile
The battery schedules in summer Case II are presented in Figure 12. The battery starts charging when the demand is lower at the beginning of the day. The charging power of the battery steps down during the charging process from 490kW, to 270kW, to 140kW, until the battery is fully charged. At the time of Case II (on 23rd July 2016), the battery was temporally limited to 50% due to operational concerns. Thus, the maximum charging and discharging power of the battery is reduced to 0.5MW. During the day, the battery discharges during several 15-minutes time slots at 500kW, and it discharges approximate 1.5MWh energy in the day of Case II, from 10am to 6pm. At the end of the day, the battery starts its charging activity at 0.5MW from 10:30pm till the end of the day.
NINES Commercial Arrangements and Economics ReportPage 38 NINES Commercial Arrangements and Economics Report Page 39

To conclude, the figures show the battery discharges during periods of maximum generation and hence alleviates the output of conventional generation at LPS and charges during the off peak time when the outputs of generators are comparatively low. The battery also charges at the end of both case studies when the curtailable ACG is available, which means the battery is reducing the curtailment of flexibly connected DGs. As a result, it can be observed that the scheduling of the battery succeeded in adding flexibility to smoothen the peak demand and to utilise intermittent generation. According to the Battery Operational Effectiveness report3, under the schedule derived by a new real-time algorithm which is currently under development and aims to charge the battery in response to ACG curtailment, the battery has the potential to avoid up to an additional 4MWh of renewable generation that would be otherwise curtailed during each full cycle.
4.3. Commercial Arrangements with Battery
The commercial arrangement with the VRLA battery is reviewed in this section. The battery was operated by the Distributed Network Operator (DNO), i.e. SSEN. A battery contract was signed between SSEN and S&C Electric, and it clearly defined the role and responsibility of each party involved. Furthermore, potential commercial arrangements with the future operation of battery on Shetland are discussed below.
4.3.1. NINES Commercial Arrangements with Battery
The battery in NINES contributed towards the improved utilisation of renewable generations, i.e reduction of curtailment (details could be found in section 4.4.2), which is important on Shetland considering the abundance of the wind resource. The large-scale VRLA battery was part funded by Department of Energy & Climate Change (DECC) via a Smart Grid Demonstration Capital Grant for £1.1m and £1m from Ofgem’s Low Carbon Network Fund Tier 1. The remainder was funded through the NINES Project on Shetland, and it was operated by SSEN. The VRLA battery was operated under DNO operation arrangement. Under DNO operation arrangement a battery can be used to assist in the management of the network, by helping to reduce peak load, fill troughs during period of low demand, absorb renewable curtailment, etc.
A Battery contract was signed between SSEN and S&C Electric. The roles and responsibilities of each party were determined in the contract, with S&C Electric being responsible for the design, supply and installation of the NINES battery storage system at LPS. The NINES BESS consisted of system transformer, power conversion system, and battery control system as well as several other ancillary elements such as Heating, Ventilating, and Air-Conditioning (HVAC) etc. SSEN own and operate the battery.
Figure 12 Battery schedules in Case II30
As mentioned in section 4.1, the original battery contract between SSEN and S&C Electric stated that a 1MW 6MWh NAS battery would be installed. After an incident involving the same technology in Japan31, and due to safety concerns related to the location of this installation at LPS, SSEN concluded that NAS was no longer a suitable technology to be used on Shetland32. An alternative 1MW 3MWh VRLA battery was installed with the conditions of the original contract remaining in place.
Under the NINES battery operation, the costs associated with energy production via the battery was included within the LPS costs, which means there is no separate battery energy supply contract or PPA for the battery.
With such arrangement, it is vital for the DNO to consider the costs of the battery system and the benefits that the battery could help to achieve during daily operations. The costs associated with the installation and operation of the NINES battery are presented in section 4.4.1, together with the benefits that were achieved by the battery during the project phase. Moreover, a cost value of using the battery to alleviate the renewable energy is calculated based on the costs and benefits, it is presented in section 4.4.3.
4.3.2 Potential Commercial Arrangements with Battery
In addition to the NINES commercial arrangements for operating the battery on Shetland, a future scenario of potential third party ownership operation/contracted battery service arrangements that would help system balancing have also been considered.
Under the contracted battery service arrangement, the battery would be owned and operated by a third party. A contract is necessary for this kind of commercial operation, and agreements should be made between the network operator and battery owner for a number of services which will assist system balancing. A recommended process for acquiring such commercial operation would start from tendering to all the potential battery service providers. The battery services that would be considered will be decided by the network operator, i.e. assessed based on the battery performance, technical documentations, and safety aspects. A contract should be used to define the services that the battery will provide, the services provision time period, the payment terms, etc. The contract could be similar to the GB National Grid STOR (Short-Term Operating Reserve) arrangement, consisting of availability payment and utilisation payment.
If the battery is operated under the third party ownership arrangement, DNO is exposed to the risk that flexibility will not be available when required. The third party may purchase and sell energy to external markets, e.g. wholesale, spot markets, or the balancing mechanism. As the battery is operated by the third party, the third party will compare all the offered price in the markets. If the market prices are at the similar level with the network operator system balancing, the battery owner will operate it as required by the network operator. However, the network operator might need to choose other services when the market prices are higher or the operator has to pay a higher price to procure the battery services. However, the DNO is not exposed to the battery efficiency, reliability issues etc. under the third party ownership operation.
An example of a commercial arrangement that may be suitable in this regard has been developed by SSEN and is known as Constrained Managed Zones (CMZ).
CMZ is a geographic region served by an existing network where network requirements related to peak electrical demand are met through the use of demand reducing or demand shifting techniques, such as Demand Side Response and Energy Storage. These CMZ techniques can be offered as a managed service to SSEN by a CMZ supplier.
CMZ techniques do not seek to increase capacity but will reduce or time-shift demand to avoid capacity constraints.Since capacity constraints only occur at periods of maximum demand, and only if an outage coincides, CMZ techniques need only be available during pre-defined Service Windows and may only be called upon should an outage coincide.
SSEN expects CMZ suppliers to manage post-outage peak demand constraints. CMZ techniques must be reliable and will be subject to additional test operations throughout the year to ensure satisfactory performance. When not required for CMZ operation, and within the limitation of any connection agreement, suppliers would be free to operate or trade these techniques as appropriate.
Areas have been selected for analysis on the basis that they are forecast by the load estimates to exceed their firm capacity during the RIIO-ED1 period.
Currently, there is no connection between the Shetland Isles and the GB mainland, which means that batteries operating on the Shetland network have to be installed locally. If a connection between the isles and GB mainland is built, this may enable additional locations for third party energy storage owners to provide such services to the Shetland network and also could allow, batteries installed on Shetland to operate in GB markets.
NINES Commercial Arrangements and Economics ReportPage 40 NINES Commercial Arrangements and Economics Report Page 41

4.4 NINES Battery Costs and Benefits Analysis
The costs associated with the NINES battery are presented in details in section 4.4.1, including the capital costs of the battery system and the battery operation costs, while the benefits that could be achieved by the NINES VRLA battery is discussed in section 4.4.2. A cost-benefit analysis for the 1MW 3MWh VRLA battery is provided in section 4.4.3, which also considers the potential theoretical scale that could be achieved in the future.
4.4.1 NINES Battery Costs
This section gives a detailed breakdown of the NINES battery costs, including its capital costs and operational costs related to the battery system, battery network connection, building costs, and maintenance support. The Shetland battery was funded by a number of funding sources. The capital cost of the battery was partly funded by DECC via a Smart Grid Demonstration Capital Grant and Ofgem’s Low Carbon Network Fund Tier 1. The remainder of the costs was funded through the NINES Project. The VRLA battery is placed in a separate purpose built building32 within the footprint of LPS. An HVAC system was required to be designed and installed due to the heat characteristics of the lead acid cells32. Costs associated with the connection of the BESS to the Shetland network have been considered along with communications to enable the data transmission between the battery and Lerwick control room.
The total cost of the battery throughout its operation in the NINES project is £4.12 million. The total battery system cost, which includes the large-scale VRLA battery, the battery control system, the battery ventilation system, the fire response system, and the installation and commissioning cost, is £3.13 million. This is about 76% of the total battery costs under the NINES project.
The battery maintenance support was covered under warranty. The warranty period was 5 years/1500 cycles. The cost of maintaining the battery building is around £1,500 per annum. Moreover, the IT support for the whole battery system is £10,000 each year. For reasons previously discussed following the advice from the battery supplier, the battery was removed from operation in January 2017.
Total Notes
Direct costs – NINES battery system & Connections
Battery 1,550,000 The VRLA battery cost
Auxiliary system, BESS (Battery Energy Storage System) Installation and Commissioning
1,580,000 Battery control system, battery HVAC system, Fire response system, & BESS installation and commissioning
Network connection 65,000
Communication systems 20,000
Civil & building works 700,000 Battery building cost
External Assessment 59,000 External assessment and validation of the safety case for the battery technologies
3,974,000
Operational support
Battery maintenance support 0 Covered by warranty, warranty is 5 year or 1500 cycles (depends on which is met first)
Battery building maintenance cost 3,750 £1,500 per annum for 2.5 years
SSEN labour 112,500 £45,000 per annum for 2.5 years
IT support 25,000 £10,000 per annum for 2.5 years
141,250
Grand total 4,115,250
Table 8 Costs (£) of NINES battery system and support through project phase
NINES Commercial Arrangements and Economics ReportPage 42 NINES Commercial Arrangements and Economics Report Page 43

4.4.2. NINES Battery Benefits
The benefits that the VRLA battery could achieve are presented in a number of aspects, including the reduction in the fuel consumption, alleviating the curtailment of renewable generation and savings in the conventional generation cost.
Fuel reductionThe conventional generation used to charge the battery during periods of low demand is stored in the battery and delivered back to the grid at times of peak demand. Operating in this way and factoring in energy losses due to the 75% round-trip efficiency of the (BESS), the time-shifting of conventional generation enabled by the battery results in flatten power outputs and thus allow for a more efficient operation of generating units at LPS.
Furthermore, charging the battery increases the ACG limit by the same volume as the charge rate under the up-to-date constraint rules. Constraints on ACG are likely to be most prevalent at times of low demand. When the charging period coincides with high ACG curtailment, the BESS would alleviate ACG curtailment and absorb the additional ACG export which is then injected into the network during periods of high demand subject to a round-trip efficiency of the BESS. The time-shifting of ACG provided by the BESS promotes the utilisation of renewable generation and also reduces the fuel consumption of conventional generation units.
Savings in conventional generation cost by time-shifting of conventional generationThe cost of conventional generation generally varies with time, being higher during periods of high demand and lower during the off-peaks. Due to the BESS operating with a round-trip efficiency of 75%, x MWh of conventional generation absorbed by the BESS at off-peak times will be converted into 0.75x MWh of discharged electricity during periods of high demand Price
peak. Given the cost per unit of conventional generation
during periods of high demand and that for during periods of low demand Price
of , the savings in conventional generation
cost through the time-shifting of conventional generation enabled by the battery may be calculated as:
where the ‘savings’ would be positive when
Note that this is not how the arrangements currently work, but the savings in conventional generation costs have been realised through the time-shifting of the conventional generators outputs. In addition, this may be considered in the future arrangements.
Additional renewable generationUnder the current Constraint Rules (CTRs), charging the battery at periods of low demand can increase the limit on ACG export. Though the manual schedule for the battery was not optimised for alleviating the ACG constraints, the charging periods that coincided with high ACG curtailment provided additional headroom for ACG to inject electricity into the network which would otherwise be curtailed. As calculated in Battery Operational Effectiveness report3, over the period from September 2015 to November 2016, the total import of the BESS was 0.94GWh, where the charging allowed approximately 52.7MWh of additional ACG (i.e. 18.1MWh at North Hoo and 34.6MWh at Luggies Knowe) to be delivered to the grid, as detailed in Table 9.
As was noted in Section 2.3.2, the ACG would be paid for their additional generation through the feed-in tariff (FIT), including the ‘generation tariff’ and the ‘export tariff’. A generator can choose to accept the ‘export tariff’ or decline it in favour of negotiating their own PPAs with electricity supplier. The ‘export tariff’ is used here to provide a reasonable estimate. Based on the estimated volume of additional ACG export absorbed by the battery, as illustrated in Table 9, North Hoo and Luggies Knowe received £4,325.47 (‘generation tariffs’ £3,439.47 and ‘export tariff’ £886.00) and £2,785.24 (‘generation tariffs’ £1,090.58 and ‘export tariff’ £1,694.66) respectively over the period evaluated3.
A new real-time control algorithm is currently under development, this will charge the battery at the times ACG is curtailed. It is evaluated in Battery Operational Effectiveness report3 that the energy used to charge the battery may be primarily supplied by the additional ACG export which would otherwise be curtailed. With the connection in March 2017 of 4.5MW ACG at Garth Windfarm and therefore the doubling of renewable generation connected via NINES, the advantages of the real-time algorithm in alleviating the ACG curtailment via NINES may come into sharp focus.
Pricepeak
1.33 Priceoff
Wind Farm Time Period Additional Export (MWh)
Generation Payment (£) Export Payment (£) Total Payment (£)
North HooSept 15 – Mar 16 5.35 1,007.41 259.48
4,325.47Apr 16 – Nov 16 12.76 2,432.06 626.52
Luggies Knowe
Sept 15 – Mar 16 5.36 167.23 259.962,785.24
Apr 16 – Nov 16 29.22 923.35 1,434.70
Table 9 FIT payments (£) for additional export enabled by BESS, from September 2015 to November 20163
Savings in conventional generation cost by time-shifting of ACG Subject to an approximate 75% round-trip efficiency of the BESS, 52.7MWh of additional ACG absorbed by the BESS was converted into 39.5MWh of electricity injected into the network during periods of high demand. The cost of conventional generation displaced by additional ACG during periods of high demand was estimated to be approximate £7,905 (i.e. £200/MWh x 39.5MWh), which was £794.29 higher than the FIT payment for the additional ACG absorbed by the BESS. Considering only the export payment (i.e. £886 for North Hoo and £1,694.66 for Luggies Knowe) is part of the Shetland costs, the time-shifting of ACG enabled by the BESS saved £5,424.34 through delivering the absorbed ACG to the grid during periods of high demand over the period from September 2015 to November 2016.
Following the commissioning of the 4.5MW Garth windfarm in March 2017, the overall connected capacity of ACG on the Shetland network connected via NINES has now reached 8.545MW. It is anticipated that the majority of access to the network is taken up by generators with higher stack position. Therefore, when the real-time control algorithm is implemented to schedule the BESS, it will be likely that the 4MWh energy used to charge the BESS is mainly supplied by the generators with higher priorities in the LIFO stack, which would cost approximately £300 based on an approximate average rate (£75/MWh) for Garth and Luggies Knowe. The 4MWh charged energy is then delivered to the grid during periods of high demand, reducing 3MWh conventional generation which would otherwise cost around £600 (i.e. £200/MWh x 3MWh). Therefore, the time-shifting of ACG enabled by the BESS would save £300 in a full cycle and approximately £90,000 per annum based on completing the expected 300 full cycles per annum.
As was noted in Battery Operational Effectiveness report3, a projected 30.54% growth in the annual average price of Brent oil would increase the conventional generation cost as the majority of the conventional generation cost is fuel consumption. The growth in fuel prices will increase the savings in conventional generation cost achieved by the time-shifting of ACG enabled by the BESS.
4.4.3. NINES Battery Cost – Benefit Analysis
The cost of using the large-scale battery to reduce the curtailment of ACG generation is presented in this section, including the cost value during the period from September 2015 to November 2016, and theoretical costs based on a battery continuing to operate on Shetland beyond the timeframe of NINES.
To calculate a total cost of installation and maintenance of the battery system, the lifetime of the lead acid battery is assumed to be 15 years, which is based on the information contained in the A Good Practice Guide on Electrical Energy Storage report produced by the EA Technology4. The warranty period of the battery means maintenance is covered for a 5-years time, and the extendable warranty extension is estimated to be £18,500 per annum. As a result, the lifetime total cost of the battery is about £5 million.
As calculated in Battery Operational Effectiveness report3 and mentioned in section 4.4.2, the NINES VRLA battery enabled 52.7MWh of additional renewable energy to be utilised by the Shetland network over the period from September 2015 to November 2016. This leads to a cost value at £7,916.67/MWh of using the NINES battery to alleviate renewable energy.
Savings = Pricepeak
x 0.75x MWh – Priceoff
X x MWh
NINES Commercial Arrangements and Economics ReportPage 44 NINES Commercial Arrangements and Economics Report Page 45

The large-scale VRLA battery is now switched off following the recommendation of S&C Electric Ltd. However, it is worthwhile to calculate a theoretical ‘scale-up’ figure to illustrate the potential cost of continuously using the battery in future Shetland operation. The potential cost of utilising the battery is likely to drop in the future due to the following reasons:
• The battery was not charged in full cycles during certain periods between September 2015 and November 2016. It could have alleviated more renewable energy curtailment if it was charged in full cycles;
• The battery was manually scheduled during the period evaluated. The manual schedules were not optimised to alleviate the ACG curtailment. SSEN is developing a new real-time algorithm which primarily aims to charge the battery in direct response to the ACG curtailment, this real-time algorithm is due to be applied in the ANM system in 2017. The real-time control algorithm was evaluated in Battery Operational Effectiveness report3 Based on a series of historic data at times of low demand where ACG was curtailed for majority of the time, under the real-time algorithm the electricity absorbed by the battery would all be from additional ACG export which would otherwise be curtailed;
• Garth windfarm was connected to the network in March 2017. The connection of Garth via NINES control adds up to an additional 4.5MW of renewable energy capacity to the network. The advantage of the real-time algorithm would bring in alleviating the ACG curtailment may be fully exploited as the total renewable energy capacity on Shetland connected via NINES is 8.545MW, meaning that all the energy used to charge the battery may be supplied by ACG export which would otherwise be curtailed.
The battery could operate a full cycle of charging and discharging for 300 days in a year when respecting the warranty term and excluding the days that the battery is off-duty for the purpose of maintenance. If the NINES battery charges 4MWh each day when the battery runs a full cycle, as configured in the new real-time algorithm, the battery could charge 1.2GWh renewable energy that would be otherwise curtailed in one year. The potential cost scale of using the VRLA battery to reduce renewable energy curtailment would be lower at £278.14/MWh.
5
Potential participation in the UK Balancing
Market
NINES Commercial Arrangements and Economics ReportPage 46

It discusses the potential of NINES solutions to participate and provide services to the UK balancing service market. All the service provisions are subject to establishing a connection to the UK energy network.
There are two potential categories of participants in the UK balancing market, which are Balancing Mechanism Units (BMUs) and non-BMUs.
Non-BMUs refers to small transmission and distribution generation and demand. National Grid allows the aggregation of small size non-BMUs to meet the entry size requirements, in order to participate in the balancing market.
The NINES solutions considered in this section include DDSM, Distributed Generators (DGs), and the 1MW 3MWh VRLA Battery installed. These can all be categorised as non-BMUs. Table 10 below summarises NINES potential participations in the UK balancing market. The services underlined in the table are currently under trial stage.
Shetland network is unique, as it is not connected with GB mainland electricity network. Although an islanded network is currently functioning on Shetland, this section looks beyond the current scope of the Shetland operation.
5. Potential participation in the UK Balancing Market
Table 10 Summary of NINES potential participation in the UK balancing market
Table 10 Summary of NINES potential participation in the UK balancing market continued
NINES Potential Participation
Balancing Services
DDSM DGs Battery Services Entry Size Requirement
Response Time Service Provision Duration
Payment Structure
Frequency Response Services
Mandatory Frequency Response
Mandatory,3-5% governor droop characteristic
Low Frequency:Primary, ≤ 10sSecondary, ≤ 30s
High Frequency:≤ 10s
N/A • Holding Payment
• Response Energy Payment
Firm Frequency Response (FFR)
10MW Low Frequency:Primary, ≤ 10sSecondary, ≤ 30s
High Frequency:≤ 10s
N/A • Availability Payment
• Nomination Fee
Optional:
• Window Initiation Fee
• Tendered Window Revision Fee
• Response Energy Fee
NINES Potential Participation
Balancing Services
DDSM DGs Battery Services Entry Size Requirement
Response Time
Service Provision Duration
Payment Structure
Frequency Response Services
FFR Bridging 1MW ≤ 10s ≥ 30s • Availability Payment
• Nomination Fee
• Response Energy Fee
Frequency Control by Demand Management (FCDM)
3MW ≤ 2s ≥ 30mins • Availability Payment
Enhanced Frequency Response
1MW ≤ 1s TBC • Availability Payment
Reserve Services
Fast Reserve 50MW ≤ 2mins ≥ 15mins • Availability Payment
• Holding Fee
• Utilisation Payment
Short Term Operating Reserve (STOR)
3MW ≤ 4hrs ≥ 2hrs • Availability Payment
• Utilisation Payment
STOR Runway 3MW ≤ 4hrs ≥ 2hrs • Availability Payment
• Utilisation Payment
Enhanced Optional STOR
3MW ≤ 20mins ≥ 2hrsSTOR evening time
• Utilisation Payment
NINES Commercial Arrangements and Economics ReportPage 48 NINES Commercial Arrangements and Economics Report Page 49

6
Economic Interventions
NINES Potential Participation
Balancing Services
DDSM DGs Battery Services Entry Size Requirement
Response Time
Service Provision Duration
Payment Structure
System Security Services
Transmission Constraint Management
• Potential providers will be approached by National Grid
• If there is sufficient competition, National Grid will seek to contract via a market mechanism
• In other circumstances, bilateral contracts will be entered into with service providers.
• Settlement Period Fee
• Utilization Fee
• Fuel prices & power prices
Demand Side Balancing Reserve
1MW ≥ 2hrs ≥ 1hr ≤ 4hrs
• Utilisation Payment
• Optional Set Up Fee
• Administration Fee
System Security Services
Intertrip Service requirements are specific to the location of intertrip
• Capability Payment
• Trip Payment
Reactive Power Services
Enhanced Reactive Power Service
The reactive capability must exceed the minimum technical requirement as set out in the Grid Code35
• Available Capability Payment
• Synchronised Capability Price
• Utilisation Price
Demand Side Response
Demand Turn Up
N/A ≤ 5mins
Day ≥ 3hrs9hrs ≤Night≤ 9.5hrs
• Availability Payment
• Utilisation Payment
Table 10 Summary of NINES potential participation in the UK balancing market continued
NINES Commercial Arrangements and Economics ReportPage 50

In addition, the wider consequences of the specific interventions associated with the NINES project are examined. The wider consequences include the economic, environmental and fuel poverty impacts and changes observed on the Shetland Islands area during the development and operational phases of NINES.
6.1 Project Spending on Shetland Islands
The NINES project had a total project spend of £15.3 million. Of this, £6.9 million was related to staff costs, while £8.4 million was spent on non-staff costs, covering equipment, IT, contractors and travel. Critical for the economic impact of these expenditures on Shetland is the “local content”, i.e. that proportion of expenditure which is made in the local (Shetland) economy. SSEN figures on the project spending, including that proportion spent in the Shetland economy, are given in Table 11.
This section presents the economic interventions associated with NINES activities and operation, which are separated into project spending and household electricity demand. These are the primary consequences of the NINES programme.
6. Economic Interventions
Total (£) Shetland (£) Shetland content (%)
Labour costs 6,897,000 205,000 2.97
Non-labour costs 8,403,000 544,250 6.48
Total 15,300,000 749,250 4.90
Table 11 NINES project spending, by category and location36
Notes: Values in £ are rounded to the nearest 50
Notes: Values in £ are rounded to the nearest 50
Output (£) Gross Value Added (£) FTE employment
Labour costs 257,450 132,100 4.1
Household payments 54,500 28,000 0.9
Non-labour costs 711,404 346,800 11.9
Total 1,023,350 506,850 16.9
Table 12 Economic impacts of NINES expenditures on Shetland economy39
We find that NINES expenditures added a total of £1.023 million worth of economic output, £507,000 to the Gross Value Added of the local economy and raised employment by almost 17person years of FTE employment over its duration.
6.2 Domestic electricity consumption on Shetland
A principal intervention of the NINES project is to use demand side management technology at the household level to improve the management of the local electricity supply system. In this section, we first discuss survey evidence on the response of households to these interventions, and then look at the change on Shetland households’ electricity consumption during the period of NINES and the economic impact of this change. At last of this section, the impact on fuel poverty observed on the Shetland Islands area during the development and operational phases of NINES is discussed.
6.2.1. Household attitudes
We consider the sample of 234 households that received specific interventions in domestic demand side response with frequency response technologies, each of which was a property of HHA. University of Strathclyde analysis identifies specific features of the properties within which the technologies were installed: first, they were newer than the housing stock on Shetland as a whole – 83% of homes receiving the intervention were built since 1982; second, the most common housing type subject to the intervention were flats (40% of the rollout); third, the intervention properties were typically better insulated than Shetland houses as a whole with, for instance, 70% of properties having cavity wall insulation.
Households that received new DSM equipment during NINES were invited to complete survey feedback on their experience. This offers a view on how households viewed their experiences of the process, and the impacts that it had made on their domestic energy behaviours and energy prices.
From household surveys, we note that some households’ identified cheaper and more efficient energy through NINES DSM. It is therefore appropriate to consider – in addition to the short-term effect above – a long-term consequence of NINES of lower energy consumption, and reduced energy bills for households on Shetland.
6.2.2. Changes in households electricity consumption
To identify the longer-term economic impact of NINES, we explore the consequences of lower household spending on energy brought about by better management of the local grid. As a calibration for the change in household electricity consumption produced by NINES, and therefore spending on electricity due to the DSM element, we use data from BEIS40 (the Department for Business, Energy and Industrial Strategy) on electricity consumption by households in the Shetland local authority.
Data is available for Shetland households’ annual electricity consumption. This identifies consumption averages for customers on “economy 7” tariffs or “standard” tariffs. We use the “economy 7” electricity consumption data as this most closely matches the form of contract for the majority of households which saw interventions through NINES.
The latest data reports that between 2014 and 2015, median household electricity demand on Shetland for those customers on “economy 7” tariff fell by 1.9% between 2014 and 2015 (from 7,043kWh to 6,908kWh), while mean household electricity demand for the same tariff customers fell by 1.6%. Median and mean household electricity consumption for all domestic customers on Shetland fell by 0.8% and 1.0% respectively in the same period. These data are shown in Table 13.
Breaking down the non-labour costs further, expenditures were made on travel, and goods and services from local firms. Total spending in the Shetland economy associated with the NINES project was £749,250, roughly 4.9% of the total project expenditure.
The project related expenditures given in Table 11 produced an economic impact in the Shetland economy. The purchasing of items from businesses based on Shetland required those businesses to increase their output which, in turn, drove further economic activity in other local businesses, and so on. As the demand for (further) local goods and services expands, additional economic activity is stimulated throughout the Shetland economy37.
In addition to an impact through the stimulation firms’ demands for other firm’s inputs, there is a secondary route to economic impact which arises through additional incomes. Expanded output raises incomes of workers, who make local purchases, driving additional economic impacts. We can estimate the economic impact of this spending on the Shetland economy through the use of Input-Output analysis. This widely used economic method explicitly takes account of the interlinkages between industrial sectors and between household incomes and consumption to estimate the knock-on consequences of specific interventions.
Here, we examine the total multiplier impacts of the spending on Shetland associated with the NINES project, using an Input-Output table for Shetland38. We use project level information on the category of spending to stimulate an increase in demand for the output of that sector or activity on Shetland.
Table 12 shows the estimated economic impacts of project-related expenditures on the Shetland economy. We calculate the impact on output, Gross Value Added and Full-Time Equivalent (FTE) employment.
NINES Commercial Arrangements and Economics ReportPage 52 NINES Commercial Arrangements and Economics Report Page 53
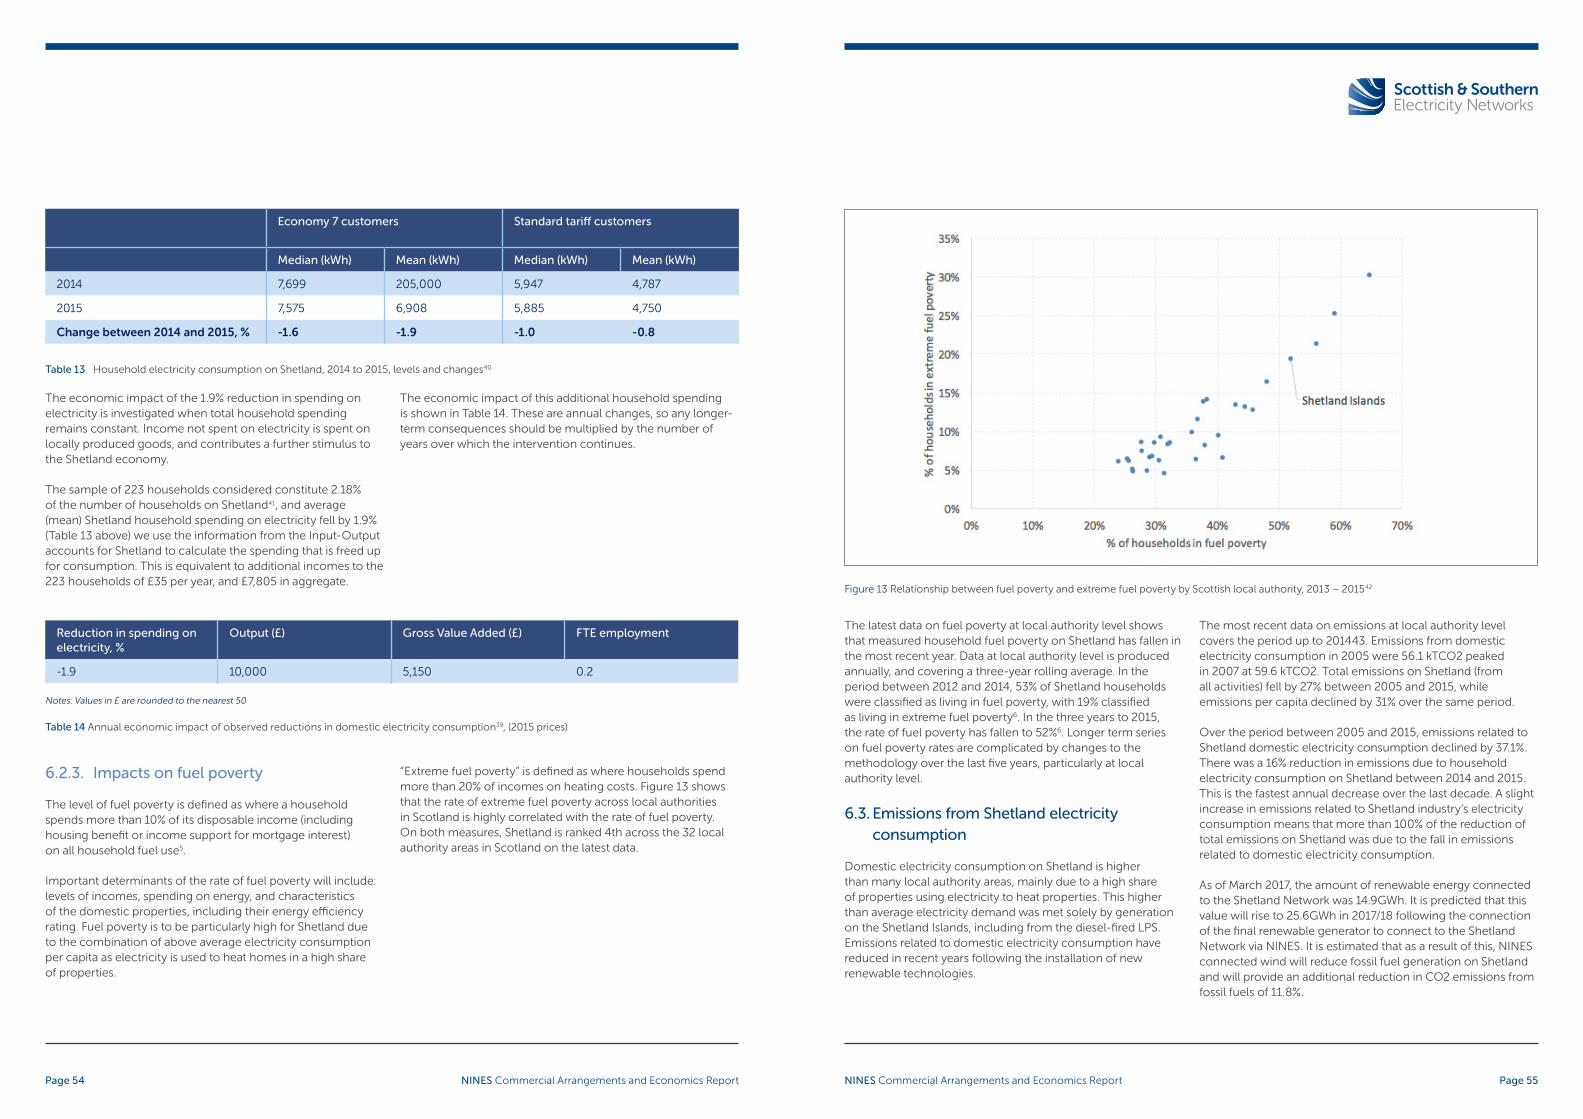
The economic impact of the 1.9% reduction in spending on electricity is investigated when total household spending remains constant. Income not spent on electricity is spent on locally produced goods, and contributes a further stimulus to the Shetland economy.
The sample of 223 households considered constitute 2.18% of the number of households on Shetland41, and average (mean) Shetland household spending on electricity fell by 1.9% (Table 13 above) we use the information from the Input-Output accounts for Shetland to calculate the spending that is freed up for consumption. This is equivalent to additional incomes to the 223 households of £35 per year, and £7,805 in aggregate.
The economic impact of this additional household spending is shown in Table 14. These are annual changes, so any longer-term consequences should be multiplied by the number of years over which the intervention continues.
6.2.3. Impacts on fuel poverty
The level of fuel poverty is defined as where a household spends more than 10% of its disposable income (including housing benefit or income support for mortgage interest) on all household fuel use5.
Important determinants of the rate of fuel poverty will include: levels of incomes, spending on energy, and characteristics of the domestic properties, including their energy efficiency rating. Fuel poverty is to be particularly high for Shetland due to the combination of above average electricity consumption per capita as electricity is used to heat homes in a high share of properties.
“Extreme fuel poverty” is defined as where households spend more than 20% of incomes on heating costs. Figure 13 shows that the rate of extreme fuel poverty across local authorities in Scotland is highly correlated with the rate of fuel poverty. On both measures, Shetland is ranked 4th across the 32 local authority areas in Scotland on the latest data.
Economy 7 customers Standard tariff customers
Median (kWh) Mean (kWh) Median (kWh) Mean (kWh)
2014 7,699 205,000 5,947 4,787
2015 7,575 6,908 5,885 4,750
Change between 2014 and 2015, % -1.6 -1.9 -1.0 -0.8
Table 13 Household electricity consumption on Shetland, 2014 to 2015, levels and changes40
Table 14 Annual economic impact of observed reductions in domestic electricity consumption39, (2015 prices)
Notes: Values in £ are rounded to the nearest 50
Reduction in spending on electricity, %
Output (£) Gross Value Added (£) FTE employment
-1.9 10,000 5,150 0.2
The latest data on fuel poverty at local authority level shows that measured household fuel poverty on Shetland has fallen in the most recent year. Data at local authority level is produced annually, and covering a three-year rolling average. In the period between 2012 and 2014, 53% of Shetland households were classified as living in fuel poverty, with 19% classified as living in extreme fuel poverty6. In the three years to 2015, the rate of fuel poverty has fallen to 52%6. Longer term series on fuel poverty rates are complicated by changes to the methodology over the last five years, particularly at local authority level.
6.3. Emissions from Shetland electricity consumption
Domestic electricity consumption on Shetland is higher than many local authority areas, mainly due to a high share of properties using electricity to heat properties. This higher than average electricity demand was met solely by generation on the Shetland Islands, including from the diesel-fired LPS. Emissions related to domestic electricity consumption have reduced in recent years following the installation of new renewable technologies.
The most recent data on emissions at local authority level covers the period up to 201443. Emissions from domestic electricity consumption in 2005 were 56.1 kTCO2 peaked in 2007 at 59.6 kTCO2. Total emissions on Shetland (from all activities) fell by 27% between 2005 and 2015, while emissions per capita declined by 31% over the same period.
Over the period between 2005 and 2015, emissions related to Shetland domestic electricity consumption declined by 37.1%. There was a 16% reduction in emissions due to household electricity consumption on Shetland between 2014 and 2015. This is the fastest annual decrease over the last decade. A slight increase in emissions related to Shetland industry’s electricity consumption means that more than 100% of the reduction of total emissions on Shetland was due to the fall in emissions related to domestic electricity consumption.
As of March 2017, the amount of renewable energy connected to the Shetland Network was 14.9GWh. It is predicted that this value will rise to 25.6GWh in 2017/18 following the connection of the final renewable generator to connect to the Shetland Network via NINES. It is estimated that as a result of this, NINES connected wind will reduce fossil fuel generation on Shetland and will provide an additional reduction in CO2 emissions from fossil fuels of 11.8%.
Figure 13 Relationship between fuel poverty and extreme fuel poverty by Scottish local authority, 2013 – 201542
NINES Commercial Arrangements and Economics ReportPage 54 NINES Commercial Arrangements and Economics Report Page 55

The recent link between emissions and domestic electricity consumption on Shetland is shown in Figure 14. Taking the ratio of CO2 emissions from domestic electricity consumption40 to average domestic electricity consumption43, the carbon intensity of domestic electricity consumption has fallen significantly in 2013 and 2015.
Emissions on Shetland associated with industrial use of electricity have also significantly reduced in recent years. Over the period between 2005 and 2015, CO2 emissions associated with the use of electricity in firms and industry on Shetland has fallen by 46.0%. As with electricity consumption by households, emissions associated with industrial use of electricity have fallen sharply in recent years, despite a small increase between 2014 and 2015 (this was however more than offset by the fall in emissions from domestic electricity consumption). Combining the reduced emissions from the consumption of electricity in domestic with industrial use of electricity, DECC43 statistics reveal that between 2012 and 2015 there is a decline of 31.4 ktCO2, equivalent to a reduction in CO2 emissions of 10.9%.
Figure 14 Carbon-intensity of average household electricity consumption on Shetland, tCO2 per average kWh consumption40 43
Conclusions
NINES Commercial Arrangements and Economics ReportPage 56
From the commercial perspective, this report has reviewed the commercial arrangements used by the NINES project to introduce and utilise the NINES elements in the Shetland network. The NINES elements included in this report are DDSM, flexibly connected DGs, a 1MW 3MWh VRLA battery and an Active Network Management system. In addition to the review of the commercial arrangements, the heating profiles of the DDSM customers, the power outputs of five Shetland generators, and the scheduled activities of the battery are studied in two cases. Each of the two cases represents one of the maximum/minimum demand/generation outputs days on Shetland in summer/winter 2016, respectively. Through the case studies, the report illustrates how the NINES elements and their commercial arrangements have influenced operational practices.
The capital and operational costs of the rollout of DDSM scheme and the large-scale VRLA battery in the project have been listed and summarised in section 2.3.1 and 4.4.1 respectively, together with the funding resources that supported the NINES project spending on these two elements. The benefits brought by the DDSM flexible customers and the battery to the Shetland network have been evaluated and presented in section 2.3.2 and 4.4.2, including the savings in conventional generation cost and additional benefits to the renewable asset owners through alleviating renewable energy curtailment. The cost of using DDSM flexible customers and battery to reduce the renewable energy curtailment has been calculated based on the benefits in section 2.3.3 and 4.4.3. Furthermore, potential cost values of the future utilisation of the DDSM and battery in order to enable renewable energy curtailment reduction have been discussed in this report.
At the conclusion of the project, the DDSM scheme had 223 households participating, these homes are owned by HHA. The heating devices installed in the DDSM houses are remotely controlled and responsive to the signals sent through the ANM system. The 223 households are distributed on the Shetland Islands, with the majority 78% are in the centre and south of Shetland Mainland and the rest 22% located in North Mainland and North Islands. The DDSM customers were engaged directly in the NINES project through six core methods which have been listed in section 2.2, namely; issuing payments (as incentives for participation), website updates, hosting of local meetings, issuing of written communications, phone calls to customers, and carrying out of home visits. Through the analysis of the DDSM customers’ behaviour, it can be observed that the flexible customers would provide additional flexibility into the Shetland operation. Note that the level of flexibility cannot be guaranteed for a number of reasons, e.g. communications, customer behaviour, SOC of appliances, seasonal variations, and etc.
The total cost of the DDSM scheme and operational support throughout the project is £3.2 million, with the total ongoing operation support cost being £491k per annum after the end of the project. A breakdown of these costs is detailed in section 2.3.1. The costs are shared between SSEN and HHA, where SSEN’s costs are funded via Ofgem through the NINES project. SSEN contributed 64.8% of total DDSM costs during the project and providing 93.9% of ongoing operation support costs. The report has determined the DDSM flexible customers, from February 2016 to January 2017, alleviated 77MWh of renewable generation (from North Hoo and Luggies Knowe). Because of the alleviation, the wind farm asset owners would have received an estimated FIT payments of £6261.83 (North Hoo) and £4101.83 (Luggies Knowe). A cost value of using the DDSM customers to reduce the renewable curtailment is evaluated as £7,360.40/MWh for the 77MWh renewable energy alleviation in section 2.3.3. However, if the pre-payment customers had provided flexibility for a full year (as they were moved into flexible scheduling on 26 September 2016), the reduction in renewable curtailment is expected to have been 105.7MWh through assuming the same percentage of flexible customers heating capacity is used for alleviating renewable curtailment.
This report discusses two aspects of the NINES project, including the commercial arrangements and the economic impacts of NINES on Shetland.
Conclusions
The cost of using flexible customers to reduce renewable energy curtailment is therefore reduced to £5,364.75/MWh. The total available flexibility of the heating devices (installed in the all flexible DDSM households), is estimated to be 1GWh/year. Considering the rules by which DDSM operates mean that wherever possible appliances in the flexibly charging groups are scheduled to apply primarily at times that NINES connected renewable generators would otherwise be curtailed. If the scheduling of flexible customers heating devices perfectly align with renewable curtailment and the level of flexibility is available, the future cost of using these DDSM flexible customers to reduce renewable curtailment would be lower, at £560.94/MWh.
This report has also provided an overview of the Shetland generators in section three, which include conventional generators, ‘must-take’ renewable generators, and flexibly connected renewable DGs connected via the NINES Project. The commercial arrangements with the Shetland conventional generators, i.e. LPS and SVT, ensure the provision of the secure and stable operation on Shetland network. The New Energy Solution for Shetland tendering process is currently under evaluation and new commercial arrangement will be required between the potential asset owner(s) and SSEN (as the system operator on Shetland) to keep the secure and stable network operation. The NINES project has enabled additional renewable capacity with the introduction of flexibly connected renewable DGs. The flexibly connected DGs are connected under LIFO arrangements, and they are controlled by the ANM system. Outputs of five generators have been reviewed using the same case studies (i.e. the summer and winter cases in 2016). The Shetland network is a closed energy system, and the total generation output must replicate the islands’ demand. It can be observed from the case studies that the conventional generators (LPS and SVT) output at least 50% of the total generation, while the output of the renewable generators are subject to the commercial arrangements and also depend on the wind/tidal availability, as well as curtailment.
A 1MW 3MWh VRLA battery was installed on Shetland during the NINES project, and the battery operation has been reviewed in section 4.1. Except for four months from February to May 2015 during which the ANM system calculated schedules were used, the battery was manually scheduled. During these times the battery was scheduled to discharge during periods of high demand so reducing conventional generations and charge at periods of low demand smoothing the demand curve and allowing conventional generators to operate more efficiently. In the period of operation from September 2014 to November 2016, the battery was cycled 612 times, with the total discharge power of 1.34GWh. Following the recommendation of battery provider, the battery was removed from service in Jan 2017.
This report has briefly reviewed the battery schedule charging and discharging activities in the same two cases (i.e. the summer and winter 2016 cases) used for analysing the DDSM behaviour and generator outputs, in section 4.2. It can be concluded that the scheduling of the battery succeeded in adding flexibility on Shetland operation.
The capital cost of the battery was part funded by DECC via a Smart Grid Demonstration Capital Grant for £1.1m and £1m from Ofgem’s Low Carbon Network Fund Tier 1. The remainder was funded through NINES and was operated by SSEN to help meet the needs of the Shetland network. Detailed costs have been presented in section 4.4.1. The battery production cost has been included within the LPS costs. Potential commercial arrangements that could be applied to battery operation in the future have been proposed in this report. Under contracted battery service arrangements, a scenario whereby the battery is owned and operated by a third party providing contracted services that will assist network balancing has been noted in section 4.3.2. Under that arrangement the DNO is not exposed to issues such as battery efficiency and reliability. The total costs of the NINES battery during the project time, including the capital costs and operational support costs, is £4.12 million. This report has determined 52.7MWh renewable energy (North Hoo and Luggies Knowe) curtailment was avoided by the battery from September 2015 to November 2016, in section 4.4.2. Therefore, North Hoo and Luggies Knowe received additional FIT payment of £4325.47 and £2785.24, respectively. A MWh cost of using the battery to reduce the amount of 52.7MWh renewable energy curtailment is calculated at £7,916.67/MWh by assuming, amongst other aspects, the lead acid battery has a lifetime of 15 years. This report has evaluated, in section 4.4.3, that the battery has the potential to alleviate 1.2GWh renewable energy reduction per annum if it uses all its capacity to avoid the curtailment. Thus, a theoretical potential figure of using the battery to alleviate renewable energy reduction is estimated to be £278.14/MWh.
Possible future participation of the NINES connected elements (i.e. DDSM, flexibly connected DGs, and battery) in the GB ancillary service market has been briefly summarised in section five, should the potential link between Shetland and GB mainland be realised.
From the economics perspective, this report has analysed the economic interventions associated with NINES activities and operation, and wider economic, environmental, and fuel poverty impact of NINES operation on Shetland. The specific interventions of the NINES project include project spending and changes in household electricity demand. The wider consequences of these interventions have been investigated using the economic modelling technique of Input-Output
NINES Commercial Arrangements and Economics ReportPage 58 NINES Commercial Arrangements and Economics Report Page 59

analysis in this report. This report has presented the wider consequences through illustrating impacts and changes observed on the Shetland Islands area during the development and operational phases of NINES. In addition to the learnings from the economic, emissions and fuel poverty interventions and wider effects of the NINES projects, two principally items are discussed and proposed for future evaluation programmes.
The total NINES project spend was £15.3 million, with £6.9 million was related to staff costs and £8.4 million covering non-staff costs, which are equipment, IT, contractors and travel. The non-staff costs also include incentive payments made to each of the households who were originally part of the scheme. This report has evaluated 2.97% of staff costs and 6.48% of non-staff costs are spent locally on Shetland. Total spend on Shetland is 4.9% of the total project expenditure, equivalent to £749,250. This report has determined, through Input-Output analysis, the NINES project related £749,250 expenditure added £1.023 million worth of economic output, £506,850 to the gross value added of the local economy, and raised employment by almost 17 person years of FTE employment over the project duration.
A principal intervention of the NINES project is to use DSM technology at the household level to improve the management of the local electricity supply system. DDSM households were invited to complete survey feedback on their experience of participating in DDSM. This report has summarised the survey results, and some households reported cheaper and more efficient energy through NINES. Thus, this report has considered a long-term consequence of the change in households’ electricity consumption based on the Shetland household electricity consumption data from BEIS. The latest 2014 – 2015 data reports median household electricity demand on Shetland for those customers on “economy 7” tariff fell by 1.9% between 2014 and 2015 (from 7,043kWh to 6,908kWh. The “economy 7” electricity consumption data is used in this report as this most closely matches the form of contract for the majority of households which saw interventions through NINES. Based on the reduction of electricity consumption, this report has calculated, through the Input-Output analysis, the reduction in electricity spending increased 223 DDSM household income by £35 for each year of operation, and £7,950 in total per year. Moreover, the economic impact of the additional incomes on the Shetland economy is equivalent to additional £10,000 worth of economic output, £5,150 to the gross value added of the local economy, and 0.2 person years of FTE employment per year.
Fuel poverty is particularly high for Shetland due to electricity being used to heat homes in a high proportion of properties and the high cost of fuels in off-grid properties. This report has presented the latest data which shows Shetland ranks fourth highest for measured fuel poverty (and extreme fuel poverty) across the 32 local authority in Scotland. However, as showed in this report, fuel poverty levels on Shetland have reduced in the latest data6, from 53% to 52% of households living in fuel poverty. This is equivalent to a net change of 86 Shetland households being taken out of fuel poverty.
Emissions related to domestic electricity consumption have reduced in recent years with installation of new renewable technologies during the NINES project. This report has summarised between 2014 and 2015, CO2 emissions from Shetland associated with household electricity consumption fell by 16%. The report also highlights the predicted additional reduction in CO2 emissions via the NINES connected renewable generators which significantly contributes to the downward trend in emissions.
Appendix 1
Acronyms
NINES Commercial Arrangements and Economics ReportPage 60

ACG Controlled Generation
ANM Active Network Management
BEIS The Department for Business, Energy and Industrial Strategy
BESS Battery Energy Storage System
BMUs Balancing Mechanism Units
CMZ Constrained Managed Zones
CTRs Constraint Rules
DECC Department of Energy & Climate Change
DERs Daily Energy Requirements
DDSM Domestic Demand Side Management
DGs Distributed Generators
DNO Distributed Network Operator
DSM Demand Side Management
EM Element Manager
ERDF European Regional Development Fund
FAI Fraser of Allander Institute
FCDM Frequency Control by Demand Management
FFR Firm Frequency Response
FTE Full-Time Equivalent
HHA Hjaltland Housing Association
HVAC Heating, Ventilating, and Air-Conditioning
LIC Local Interface Controller
LIFO Last In First Off
LO Learning Outcomes
LPS Lerwick Power Station
NINES Northern Isles New Energy Solutions
PPA Power Purchase Agreement
SGS Smarter Grid Solutions
SIC Shetlands Islands Council
SOC State of Charge
STOR Short Term Operating Reserve
SVT Sullom Voe Terminal
UoS University of Strathclyde
VRLA Valve-Regulated Lead-Acid
Footnotes
1 UoS frequency response work package learning report, NINES Frequency. 7, 19, 32 response: operational effectiveness report, 2017, University of Strathclyde
2 UoS DDSM work package learning report, NINES DDSM: DSM Network 7, 25 Benefits Report, 2017. University of Strathclyde / ESRU
3 UoS Battery work package learning report, NINES Battery: operational 8, 33, 37, 38, 40, 44, 45, 46 effectiveness report, 2017, University of Strathclyde
4 A Good Practice Guide on Electrical Energy Storage, December 2014, 9, 45 EA Technology, available at [online]: eatechnology.com/news-and- resources/news/electrical-energy-storage-good-practice-guide
5 Fuel poverty in Scotland, March 2015, Scottish Parliament. Available [online] 10, 54 at parliament.scot/ResearchBriefingsAndFactsheets/S4/SB_15-13_Fuel_ Poverty_in_Scotland.pdf
6 Scottish House Condition Survey Local Authority Tables 2012 to 2014, 10, 55, 60 January 2016, available [online] at gov.scot/Topics/Statistics/SHCS/ keyanalyses/LAtables2014
7 SSEN NINES Website: ninessmartgrid.co.uk 14, 33
8 Shetland Consultation: A New Energy Solution for Shetland, October 2014, 14 Scottish and Southern Energy Power Distribution
9 Consultation on Scottish Hydro Electric Power Distribution (SSEH’s) 14 Shetland Energy Costs recovery arrangements, October 2014, Ofgem
10 Proposals for the development of the Integrated Plan for Shetland, 2011, 16 Ofgem, available [online] at ofgem.gov.uk/Networks/ElecDist/Policy/ Documents1/Phase%201%20Consultation%20Aug%202011.pdf
11 Email communication from Stevie Adams, March 2017, SSEN 16, 19
12 UoS DDSM work package learning report, NINES DDSM: DSM 16, 18, 19, 23, 24,25 Infrastructure Report, 2017. University of Strathclyde / ESRU
13 DDSM Infrastructure Slide from Stevie Adams, March 2017, SSEN 17
14 DDSM Groups email query from UoS March 2017, Karen Halley, 19, 20 March 2017, SSEN
15 Default Schedules by Group, 2013, SSEN 20
16 Data based on NINES EM Group aggregated data 9 jan 16 20, 21, 22 to 21 feb 2016, 2016, SSEN
17 Data based on NINES EM Group aggregated data extract 20, 21, 22 2 Feb 16 to 1 Aug 16, 2016, SSEN
NINES Commercial Arrangements and Economics Report Page 63NINES Commercial Arrangements and Economics ReportPage 62
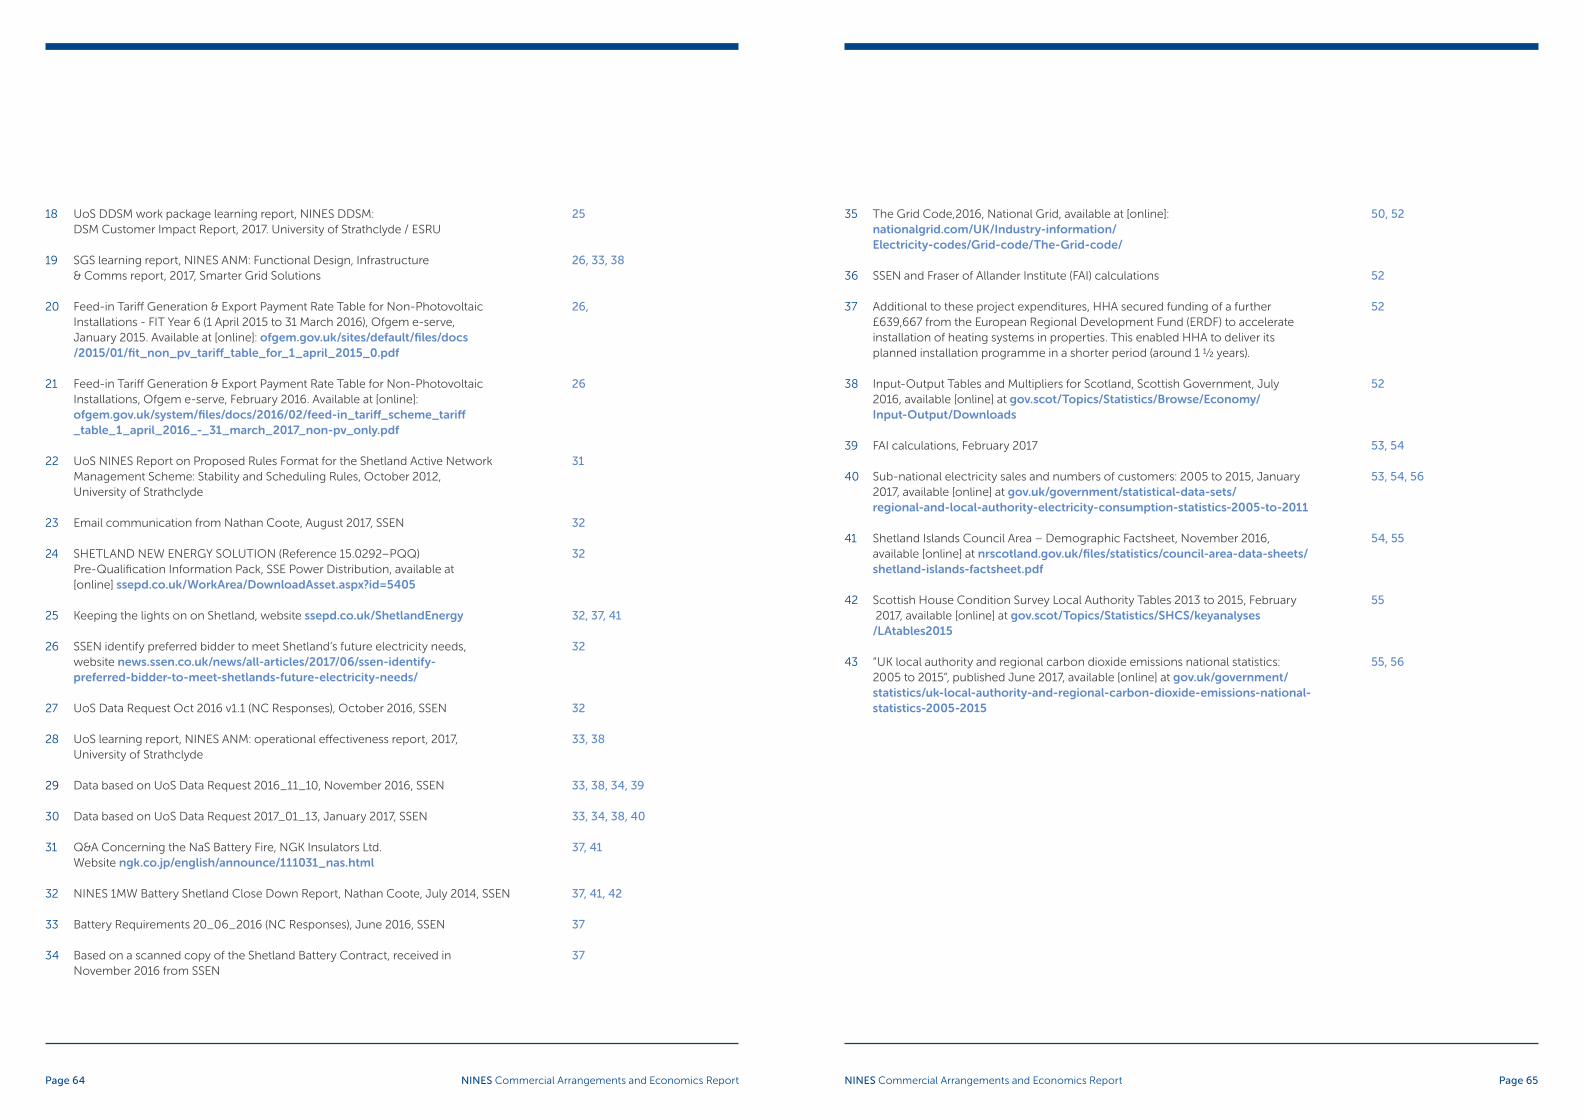
18 UoS DDSM work package learning report, NINES DDSM: 25 DSM Customer Impact Report, 2017. University of Strathclyde / ESRU
19 SGS learning report, NINES ANM: Functional Design, Infrastructure 26, 33, 38 & Comms report, 2017, Smarter Grid Solutions
20 Feed-in Tariff Generation & Export Payment Rate Table for Non-Photovoltaic 26, Installations - FIT Year 6 (1 April 2015 to 31 March 2016), Ofgem e-serve, January 2015. Available at [online]: ofgem.gov.uk/sites/default/files/docs /2015/01/fit_non_pv_tariff_table_for_1_april_2015_0.pdf
21 Feed-in Tariff Generation & Export Payment Rate Table for Non-Photovoltaic 26 Installations, Ofgem e-serve, February 2016. Available at [online]: ofgem.gov.uk/system/files/docs/2016/02/feed-in_tariff_scheme_tariff _table_1_april_2016_-_31_march_2017_non-pv_only.pdf
22 UoS NINES Report on Proposed Rules Format for the Shetland Active Network 31 Management Scheme: Stability and Scheduling Rules, October 2012, University of Strathclyde
23 Email communication from Nathan Coote, August 2017, SSEN 32
24 SHETLAND NEW ENERGY SOLUTION (Reference 15.0292–PQQ) 32 Pre-Qualification Information Pack, SSE Power Distribution, available at [online] ssepd.co.uk/WorkArea/DownloadAsset.aspx?id=5405
25 Keeping the lights on on Shetland, website ssepd.co.uk/ShetlandEnergy 32, 37, 41
26 SSEN identify preferred bidder to meet Shetland’s future electricity needs, 32 website news.ssen.co.uk/news/all-articles/2017/06/ssen-identify- preferred-bidder-to-meet-shetlands-future-electricity-needs/
27 UoS Data Request Oct 2016 v1.1 (NC Responses), October 2016, SSEN 32
28 UoS learning report, NINES ANM: operational effectiveness report, 2017, 33, 38 University of Strathclyde
29 Data based on UoS Data Request 2016_11_10, November 2016, SSEN 33, 38, 34, 39
30 Data based on UoS Data Request 2017_01_13, January 2017, SSEN 33, 34, 38, 40
31 Q&A Concerning the NaS Battery Fire, NGK Insulators Ltd. 37, 41 Website ngk.co.jp/english/announce/111031_nas.html
32 NINES 1MW Battery Shetland Close Down Report, Nathan Coote, July 2014, SSEN 37, 41, 42
33 Battery Requirements 20_06_2016 (NC Responses), June 2016, SSEN 37
34 Based on a scanned copy of the Shetland Battery Contract, received in 37 November 2016 from SSEN
35 The Grid Code,2016, National Grid, available at [online]: 50, 52 nationalgrid.com/UK/Industry-information/ Electricity-codes/Grid-code/The-Grid-code/
36 SSEN and Fraser of Allander Institute (FAI) calculations 52
37 Additional to these project expenditures, HHA secured funding of a further 52 £639,667 from the European Regional Development Fund (ERDF) to accelerate installation of heating systems in properties. This enabled HHA to deliver its planned installation programme in a shorter period (around 1 ½ years).
38 Input-Output Tables and Multipliers for Scotland, Scottish Government, July 52 2016, available [online] at gov.scot/Topics/Statistics/Browse/Economy/ Input-Output/Downloads
39 FAI calculations, February 2017 53, 54
40 Sub-national electricity sales and numbers of customers: 2005 to 2015, January 53, 54, 56 2017, available [online] at gov.uk/government/statistical-data-sets/ regional-and-local-authority-electricity-consumption-statistics-2005-to-2011
41 Shetland Islands Council Area – Demographic Factsheet, November 2016, 54, 55 available [online] at nrscotland.gov.uk/files/statistics/council-area-data-sheets/ shetland-islands-factsheet.pdf
42 Scottish House Condition Survey Local Authority Tables 2013 to 2015, February 55 2017, available [online] at gov.scot/Topics/Statistics/SHCS/keyanalyses /LAtables2015
43 “UK local authority and regional carbon dioxide emissions national statistics: 55, 56 2005 to 2015”, published June 2017, available [online] at gov.uk/government/ statistics/uk-local-authority-and-regional-carbon-dioxide-emissions-national- statistics-2005-2015
NINES Commercial Arrangements and Economics Report Page 65NINES Commercial Arrangements and Economics ReportPage 64
0345 300 2315
www.ssen.co.uk/innovation
Registered in Scotland No SC213460. Scottish Hydro Electric Power Distribution plc is a member of the SSE Group.