699 final_moule
TRANSCRIPT

Exploring Pro-Environmental
Lifestyles & Values in Canada
by
Danette E.W. Moulé
B.A. (Policy Studies), Mount Royal University, 2007
Project Submitted in Partial Fulfillment of the
Requirements for the Degree of
Master of Resource Management
Report No. 605
in the
School of Resource & Environmental Management
Faculty of Environment
Danette E.W. Moulé 2015
SIMON FRASER UNIVERSITY
Spring 2015

ii
Approval
Name: Danette Erin Woodsworth Moulé
Degree: Master of Resource Management
Report No.: 605
Title: Exploring pro-environmental lifestyles and values in Canada
Examining Committee: Chair: Nelly Bouevitch Master of Resource Management Candidate
Jonn Axsen Senior Supervisor Assistant Professor
Rachael Shwom Supervisor Assistant Professor, School of Environmental and Biological Sciences Rutgers University
Date Defended/Approved:
January 21, 2015
iii
Partial Copyright Licence

iv
Ethics Statement

v
Abstract
Lifestyle can be defined as distinctive patterns of related actions or practices. A pro-
environmental (or “green”) lifestyle might consist of several actions, such as recycling,
conserving home energy use, or buying a hybrid vehicle. Engagement in lifestyle might
be related to an individual's values, as well as other factors such as income and age. I
use data collected from a representative sample of 1,216 Canadians to answer the
following questions: i) what is green lifestyle and how does it fit in with other lifestyle
practices? ii) What are the different types of green lifestyles? and iii) how do different
core values influence citizen engagement in green lifestyles? Using factor analysis on
data relating to activity engagement, I find that engagement in pro-environmental
activities forms a unique lifestyle—separate from other lifestyles such as outdoor
recreation. A second factor analysis on respondent engagement in specific green
behaviours identifies 11 distinct pro-environmental lifestyles, including home electricity
conservation, recycling, and purchasing efficient technologies. Finally, I use regression
analysis to find that values are linked to lifestyle, where biospheric values are positively
associated with engagement in 4 of the 11 pro-environmental lifestyles. Traditional
values are positively associated with engagement in 2 of the pro-environmental
lifestyles, and one lifestyle is associated with egoistic values. Other personal factors also
help to explain green lifestyle engagement, including income, age, and type of residence
(urban, suburban or rural). Future research may seek to understand the conditions,
contexts, and motivations behind behaviour more thoroughly, in addition to
understanding how societal influence affects behaviour in various parts of the world.
Keywords: Lifestyle; sustainability; climate change; environmental values; pro-environmental behaviour

vi
Acknowledgements
I’d like to acknowledge my family who’ve been there for me during the challenging
process of completing my Master’s, and who have supported me 100%. I’d also like to
acknowledge my friends who’ve supported me, and helped me by discussing ideas
related to my project, providing feedback on my work, and listening when I needed it. I’d
like to acknowledge Dr. Jonn Axsen for working with me so diligently over the past
couple of years, being thorough with and attentive to my work, and forcing me to do
better. And I’d like to acknowledge Dr. Rachael Shwom for providing support and
guidance through this process, despite being at a distance. Finally, I’d like to
acknowledge the entire REM faculty and student body for the experience I’ve had here. I
have made life-long friends through REM, and have had invaluable experiences. Thank
you.

vii
Table of Contents
Approval .......................................................................................................................... ii Partial Copyright Licence ............................................................................................... iii Ethics Statement ............................................................................................................ iv Abstract ........................................................................................................................... v Acknowledgements ........................................................................................................ vi Table of Contents .......................................................................................................... vii List of Tables ................................................................................................................. viii List of Acronyms ............................................................................................................. ix
Chapter 1. Introduction ........................................................................................... 10 1.1. An overview of theories of pro-environmental behaviour ....................................... 10 1.2. Pro-environmental lifestyle ................................................................................... 12 1.3. Relating values to pro-environmental lifestyle ....................................................... 13 1.4. Research objectives ............................................................................................. 15
Chapter 2. Methods.................................................................................................. 16 2.1. Survey sample ...................................................................................................... 16 2.2. Survey instrument and questions .......................................................................... 19 2.3. Factor Analysis ..................................................................................................... 22 2.4. Regression Analysis ............................................................................................. 23 2.5. Study limitations ................................................................................................... 26
Chapter 3. Results ................................................................................................... 27 3.1. General lifestyle sectors ....................................................................................... 27 3.2. Pro-enviromental lifestyle sectors ......................................................................... 31 3.3. Pro-environmental lifestyles and biospheric values ............................................... 35
Chapter 4. Discussion ............................................................................................. 40 4.1. General lifestyle sectors ....................................................................................... 40 4.2. Pro-environmental lifestyle sectors ....................................................................... 41 4.3. Linking engagement in pro-environmental lifestyles to values ............................... 42 4.4. Linking engagement in pro-environmental lifestyles to contextual factors ............. 44
Chapter 5. Conclusion ............................................................................................. 46
References 47

viii
List of Tables
Table 2.1. Representativeness of our survey sample versus Canadian population statistics ................................................................................ 18
Table 2.2. Questions used to examine lifestyle ....................................................... 20
Table 2.3. Questions that enquired into values ....................................................... 21
Table 2.4. Independent variables used in regression analysis ................................ 24
Table 3.1. Rotated Factor Matrix solution for General Lifestyle Sectors .................. 29
Table 3.2. Rotated Factor Matrix solution for Pro-environmental Lifestyle Sectors ................................................................................................... 33
Table 3.3. Pro-environmental lifestyles regression results ...................................... 37
Table 3.4. Independent Variables found to be significantly correlated with the 11 Lifestyle Factors ................................................................................ 39

ix
List of Acronyms
PEB Pro-Environmental Behaviour
PEL Pro-Environmental Lifestyle

10
Chapter 1. Introduction
There are many different activities that can be perceived as “pro-environmental”,
including recycling, cycling rather than driving a vehicle, purchasing a hybrid or electric
vehicle, buying organic food, using reusable bags, and so on. Engagement in and
perceptions of these activities vary across individuals. It is useful to understand these
differences in perceptions, to better understand behaviour and why certain people
engage in some pro-environmental behaviours and why others do not. Understanding
behaviour in this way will help clarify how Canadian citizens might broaden their uptake
of pro-environmental behaviours and practices, and in turn how environmental policy
might shape citizen behaviour.
In addition to perceptions, certain constraints may limit people from engaging in
pro-environmental activities, such as their income level or their access to supporting
infrastructure (e.g. recycling facilities). However, some subset of people demonstrate
that they are willing to engage in pro-environmental behaviours (PEB), even when these
behaviours are less cost-effective (at least in the short-term). The reasons for these
choices are varied, which we explore in this research project.
1.1. An overview of theories of pro-environmental behaviour
A behavioural model provides a conceptual and theoretical framework for
carrying out empirical research on patterns and influences of human behaviour
(Jackson, 2005). A variety of models have been developed to help understand
behaviour. Some models draw from the field of psychology, and focus more on
characteristics of the individual. Other models draw from sociology, looking at social

11
influences and context. A number of behavioural models combine insights from both
psychology and sociology.
One example of a social psychology-based model is the Values-Beliefs-Norms
(VBN) theory (Stern et al., 1998). This model focuses on the link between values and
environmental decisions. Values are theorised to influence our worldview about the
environment, which in turn influences our beliefs about the consequences of
environmental change, which in turn influences our perceptions of our ability to reduce
threats to those things we value. These factors also influence our norms about taking
environmental action (Dietz et al., 2005). Abrahamse & Steg (2011) used the VBN
theory to investigate the relationship between values and energy use, and found that
variables such as tradition (or security) values, power (or achievement) values, and
openness to change values were statistically associated with energy use within the
home. However, the VBN theory misses other potentially important explanatory
variables, such as income and the greater social context.
An example of a more sociological model is the Social Practices Model, which
combines a focus on the role of the individual with “proper treatment of the equally
important role of social structure” (Spaargaren, 2003). ‘Social practices’ can be defined
as a theory seeking to determine the link between practices and context in social
situations. It aims to integrate the individual with his or her surrounding environment,
while examining how context relates to common practices that the individual might
undertake (Herndl & Nahrwold, 2000). Within the Social Practices Model, human
behaviour is analysed in terms of the combination of values and social practices (i.e.
lifestyle), and the responsibility of the individual for environmental action within his or her
life is analysed in terms of the options available (i.e. the ease with which people can
transition to pro-environmental options within different sectors of his or her life)
(Spaargaren, 2003). Schelly (2014) used this model to explore the effect of various
government incentives to reduce electrical usage in the home, given individuals’ pre-
conceived environmental values. Her goal was to see how incentive programmes
affected day-to-day electrical usage (i.e. whether the programmes were sensitive
enough to daily life to encourage decreased electrical usage). She found that individuals’
environmental values can be reinforced, or negated, depending on the framing of the
policy (Schelly, 2014).

12
1.2. Pro-environmental lifestyle
My research focus is on pro-environmental lifestyles (PEL). Lifestyles are
clusters of related activities which might collectively correspond with a particular aspect
of identity or core values. A PEL may be comprised of several related activities that are
perceived to somehow be beneficial to the environment. Engagement in a PEL might be
related to an individual's values, as well as other factors such as income and education.
This research is guided by lifestyle theory, which posits that identities and, therefore,
lifestyles are in a constant “state of negotiation” (Axsen et al., 2012), influenced by social
interactions and through life experience. Lifestyle theory combines elements of the
psychological and sociological approaches mentioned in the previous section.
In their 2012 study, Axsen et al. investigated whether engaging in a general PEL
coincides with other lifestyle types. The authors conducted a survey of 711 households
in San Diego, California and used factor analysis to investigate how engagement in PEL
related to other types of lifestyle, such as activities relating to career, outdoor recreation
and spirituality. According to their findings, PEL forms a unique lifestyle, separate from
engagement in other lifestyles. Further, the authors demonstrate how this measure of
engagement in PEL can be used to forecast which consumers may transition toward
adopting and using new pro-environmental technologies, and what their motivations
might be in doing so.
Whitmarsh and O’Neill (2010) looked at how often people engage in a range of
PEBs, and what factors influence engagement in those behaviours. They collected data
via a postal survey of 551 people in the UK, and used Principle Component Analysis and
regression to explore respondents’ stated engagement in various PEBs. The authors
found that pro-environmental behaviours can be separated into seven different
categories of PEB, which correspond with the idea of PEL explored by Axsen et al.
(2012). Regression analyses indicated that having a pro-environmental identity was
positively associated with engagement in waste reduction, regular water and domestic
energy conservation, and eco-shopping and eating—but not associated with one-off
domestic energy conservation actions, eco-driving, political actions, or reducing car use
and flights. Having strong concern about climate change was associated with
engagement in two of the pro-environmental lifestyles: political action and energy and
water conservation. Interestingly, general pro-environmental concern (as measured by
13
New Environmental Paradigm (NEP) score) and income were not related to any of the
pro-environmental behaviours listed above.
A study by Barr et al. (2011) also looked at the PEBs that people in the UK might
undertake, and whether concern for climate change motivates these behaviours. The
authors conducted a survey with 202 people in the UK, then conducted focus groups
with a subset of respondents to further probe the issues, and finally conducted in-depth
interviews with 12 respondents. Through cluster analysis, they identified three clusters of
respondents: ii) those who undertook the whole range of environmental actions with the
greatest frequency; ii) those who tended to be conscious consumers, buying organic
food, composting, and buying environmentally-friendly products, but tended to recycle
and conserve energy and water less often than other clusters; and iii) those who tended
to save energy in the home, but tended to make environmentally-friendly purchases,
compost, and buy organic less often than others. The authors found that climate change
was a relatively minor motivation for pro-environmental behaviour—people tended to be
motivated by factors such as “not wasting” and “using resources carefully” mentalities,
as well as convenience.
These studies confirm the idea that people can combine related PEBs into
different lifestyle types. Results also suggest that there is not just a singular PEL, but
potentially several versions across a given population. We want to understand what
these different types of PELs are amongst Canadians, and how they relate to pro-
environmental motivations (or core values).
1.3. Relating values to pro-environmental lifestyle
This study explores engagement in different PELs, and explores the different
motivations behind these lifestyles – which pro-environmental behaviours and lifestyles
are associated with environment-oriented values? Values can be defined as “(a)
concepts or beliefs, (b) about desirable end states or behaviours, (c) that transcend
specific situations, (d) guide selection or evaluation of behaviour and events, and (e) are
ordered by relative importance” (Schwartz and Bilsky, 1987, p. 551). Values are typically
invoked by the individual when making difficult choices; however, once a decision
becomes routine, individuals may not continue to consult their values, rather operating in

14
the realm of habit (Dietz et al., 2005). We focus on values instead of attitudes because,
by definition, values are more stable across a variety of contexts and decisions. In
particular, biospheric and altruistic values tend to be correlated with pro-environmental
behaviours, though this can vary by context.
In their 1995 study, Stern et al. explored the relationship between values and
pro-environmental behaviour by conducting a survey of 199 Virginian (U.S.A.) residents,
chosen randomly from the phone book. The authors asked questions about respondents’
environmental values, and whether respondents would be willing to undertake certain
pro-environmental actions, such as pay extra tax to protect the environment or take
political action. Factor analysis was used to group correlated environmental beliefs, then
regression was used to gain insight into the relationship between beliefs and behaviour.
They found that individuals with biospheric values, as well as individuals who scored
highly on the NEP scale, were more likely to undertake certain PEBs, such as writing a
letter to the government supporting policies that stop the loss of tropical forest, and
policies that reduce the use of fossil fuels. NEP score was also associated with
willingness to pay a tax to protect tropical forests.
In contrast to Stern et al.’s (1995) findings that pro-environmental values are
correlated with PEB, there can be other motivations for engagement in PEBs. Evans and
Abrahamse (2009) concluded that some PEBs are undertaken for more practical
reasons. They conducted a survey of English citizens who see themselves living more
“sustainably” than the average citizen, and found that motives for PEB engagement
often have nothing to do with environmental values or concern. Frugality and practicality
were two of the reasons respondents gave for reducing consumption, and health
concerns led some people to learn about sustainable living practices.
In summary, research suggests that engagement in some PEBs can be
associated with individual characteristics such as pro-environmental identity,
environmental concern, and biospheric and altruistic values. We also see that some
PEBs are motivated by non-environmental concerns, such as health and financial
savings. Further, PEB engagement can be affected by income and convenience. We
seek to further explore these patterns among Canadian citizens by analyzing data
collected through a web-based survey instrument.

15
1.4. Research objectives
As explained above, we use lifestyle theory to explore the idea of lifestyle among
Canadian citizens. In particular, we focus on the following research objectives:
(i) How do pro-environmental lifestyles fit with other lifestyle practices?
(ii) What are the different types of pro-environmental lifestyles?
(iii) How do different core values influence citizen engagement in pro-
environmental lifestyles?

16
Chapter 2. Methods
The research team designed a survey to explore the research questions stated in
Chapter 1. The survey built upon a survey previously designed by Axsen et al. (2012),
borrowing some questions from that survey, adapting some, and adding new questions
authored by the research team. Questions were also included based on the New
Environmental Paradigm (Dunlap & Van Liere, 1978) and the Schwartz Value Survey
(Schwartz & Bilsky, 1987).
2.1. Survey sample
My sample included 1,216 Canadians, drawn from every province and territory
except Nunavut .The survey was administered through the aid of a market research
company, Decision Analyst. Respondents were individuals who were pre-registered in
Decision Analyst’s Web-panel to periodically complete surveys. This limited our sample
to those with access to a computer and the internet. British Columbia & Alberta were
intentionally over-sampled in order to allow for regional comparisons. A French version
of the survey was made available for French-speaking Canadians.
The sample was collected in February 2013, and data was delivered by Decision
Analyst to researchers via a spreadsheet. Survey respondents are anonymous to the
researchers, and are identified in the database with a unique ID number. In total,
approximately 17,400 individuals from Decision Analyst’s Web-panel were invited to
complete the survey. Of the 17,400, 1,220 completed it. Finally, 4 were deleted from the
sample due to poor quality data, leaving our final sample of 1,216. The regional split of
these respondents is as follows: 239 respondents were British Columbia residents, 175
from Alberta, 30 from Saskatchewan, 39 from Manitoba, 337 from Ontario, 307 from

17
Quebec, 27 from New Brunswick, 31 from Nova Scotia, 4 from Prince Edward Island, 16
from Newfoundland, 1 from the Yukon, and 1 from the North West Territories.
Table 2.1 shows the representativeness of our sample, depicting distributions by
province of residence, age, gender, education and income compared to 2011 Canadian
population statistics. Ontario is under-represented, while BC and AB are over-
represented, but as mentioned above, this oversampling was done purposefully in order
to allow for regional comparisons. The sample is biased in several other ways: males are
slightly over-represented; the age-group 19-29 is under-represented, while the age-
groups between 30 & 70 are all over-represented; College and University Grads are
slightly under-represented, while those with degrees above a Bachelor’s (Master’s,
Doctorate, or Professional degree) are over-represented; and lower income individuals
are under-represented, while higher income is over-represented. Despite these slight
biases, the degree of variation in this sample seems to be sufficient for this study’s
exploratory statistical analyses.

18
Table 2.1. Representativeness of our survey sample versus Canadian population statistics
Category Canadian Census Data Our Survey
Province of residency
Alberta 11.1% 14.4%
B.C. 13.3% 19.7%
Manitoba 3.6% 3.9%
New Brunswick 2.2% 2.4%
Newfoundland 1.5% 1.4%
N.W.T. 0.1% 0.1%
Nova Scotia 2.7% 2.6%
Nunavut 0.1% 0.1%
Ontario 38.7% 27.8%
P.E.I. 0.4% 0.3%
Quebec 23.1% 25.3%
Saskatchewan 3.1% 2.5%
Yukon 0.1% 0.1%
Sex
Male 49.5% 57%
Female 50.5% 43%
Age
19 to 29 14.0% 8.5%
30 to 39 13.5% 17.7%
40 to 49 13.5% 18.8%
50 to 59 14.7% 24.6%
60 to 69 10.6% 22%
70 or older 10.1% 8.5%
Education Level1
HS Graduate 23.2% 21.2%
Uni and College Grad 46.2% 38.5%
≥ Masters, Prof Degree 2.7% 7.3%
Income
Less than $10,000 14.5% 1.8%
$10,000 - $20,000 18.9% 5.6%
$20,000 - $49,000 37.1% 31.4%
$50,000 - $99,000 22.5% 36.2%
$100,000 or more 6.9% 14.7%
1http://www12.statcan.gc.ca/nhs-enm/2011/as-sa/99-012-x/2011001/tbl/tbl01-eng.cfm

19
2.2. Survey instrument and questions
The survey enquired into Canadians’ lifestyles, values, opinions on various
environmental issues and policies, and attitudes toward pro-environmental technology;
however, only certain questions – detailed in Table 2.2 – were used to answer my
research questions. The survey was divided into six sections:
1. Household activities 2. Other activities 3. New technologies 4. Global issues 5. Values 6. Household details
Lifestyle questions built upon a survey previously designed by Axsen et al.
(2012) and are summarized in Table 2.2. Each of the lifestyle engagement questions
stated an activity, and asked the respondent to indicate their frequency of engagement
(a five point scale ranging from “never” to “very frequently”). There were 47 questions
relating to general lifestyle, including activities relating to career, hobbies, and personal
development. Five of these questions related specifically to environment, including
“thinking about protecting the environment,” “trying to help the environment through daily
actions,” “attending environmental meetings,” “engaging in environmental conservation
activities,” and “promoting environmental conservation.” The survey also included 45
questions relating specifically to different pro-environmental activities or behaviours
(PEBs), which are summarized in the second row of Table 2.2.

20
Table 2.2. Questions used to examine lifestyle
Question title Question as stated in the survey
List of activities Choices
General Lifestyle Activities
We are interested in understanding how you use your time and what types of activities you are typically involved in. Think of how you spend your waking hours in a given month.
How frequently do you engage in the following activities?
47 total, including: Career, Studying, Managing Money, Travelling, Time With Family and Animals, Shopping, Preparing Food, Sports, Hobbies, Time With Friends, Personal Development or Religious Activities, Volunteering, Gardening, Housework, New Technology, Politics, and Environmental Activities
“Never”, “Rarely”, “Occasionally”, “Frequently”, “Very Frequently”, and “N/A” (“N/A” was recoded to “Never” prior to data analysis)
Pro-environmental Lifestyle Activities
How often do you engage in each of the following activities?
45 total, including: Buying High Efficiency Household Items, Buying Local and Organic Food or Growing Your Own, Buying Locally-Produced Goods, Buying Used or Recycled Goods, Recycling and Composting, Buying Environmentally Friendly Products, Reading Product Labels Prior to Purchasing, Avoiding Excess Packaging, Fixing Something Rather Than Buying New, Sharing Products With Others, Minimising Water Use, Minimising Energy Use, Reducing Vehicle Use, Supporting Pro-Environmental Candidates in Elections, Donating to Charities, Participating in Environmental Activities, and Talking to Children about Food & Environmental Issues
“Never”, “Rarely”, “Occasionally”, “Usually”, “Always” and “I never have the opportunity” (“I never have the opportunity” was recoded to “Never” prior to data analysis)
The survey also measured two potential determinants of pro-environmental
behaviour: environmental concern and values (Table 2.3). Environmental concern was
elicited in the survey by including a brief, eight-item version of the New Environmental
Paradigm (NEP) scale (Cordano et al., 2003) and a shorter, more environmentally-
relevant version of Schwartz’s value scale (Stern et al., 1998). The NEP scale is widely
used as a measure of acceptance of a pro-environmental worldview, and has been
found to be most accurately described as a measure of environmental concern or
awareness of consequences (Stern et al., 1995).

21
We elicited respondent values with a shortened version of Schwartz’s value
scale, which includes twelve value statements asking respondents to “indicate how
important each value is as a guiding principle in your life.” The twelve statements relate
to four core value categories that have been found to be particularly important in relation
to pro-environmental behaviour: biospheric, traditional, altruistic, and egoistic values
(Stern et al., 1998). The full question statements are depicted in Table 2.3.
Table 2.3. Questions that enquired into values
Question List of activities Choices
NEP scale (environmental concern):
Please indicate your level of agreement with the following statements. (Cordano et al., 2003)
When humans interfere with nature, it often produces disastrous consequences
The so-called “ecological crises” facing humankind has been greatly exaggerated
The balance of nature is very delicate and easily upset
Humans are severely abusing the environment
Humans have the right to modify the natural environment to suit their needs
If things continue on their present course, we will soon experience a major ecological catastrophe
Plants and animals have as much right as humans to exist
Humans were meant to rule over the rest of nature
“Strongly Disagree”, “Disagree”, “Undecided or Neutral”, “Agree”, and “Strongly Agree”
Stern et al.’s value scale:
Consider each set of the items below and indicate how important each value is as a guiding principle in your
life. (Stern et al., 1998)
Traditional values
Family security, safety for loved ones
Honouring parents and elders, showing respect
Self-discipline, self-restraint, resistance to temptation
Biospheric values
Respecting the earth, harmony with other species
Protecting the environment, preserving nature
Unity with nature, fitting into nature
Altruistic values
Equality, equal opportunity for all
-Social justice, correcting injustice, care for the weak
- A world at peace, free of war and conflict
Egoistic values
Being influential, having an impact on people and events
Being authoritative, leading or commanding
Wealth, material possessions, money
“Not At All Important,” “A Little Important,” “Somewhat Important,” “Very Important”
22
Finally, the survey also included a number of demographic questions to use as
additional explanatory variables in the regression analysis, including income, education,
type of area in which one lives (rural, urban, or suburban), and political party affiliation.
2.3. Factor Analysis
I use factor analysis to achieve my first two research objectives. Factor analysis
can identify patterns in empirical data by grouping correlated variables into a smaller
number of factors, and has been used in previous analyses of lifestyle practices seeking
to identify groupings of practices, such as the importance of lifestyle variables to
residential neighbourhood choice (Bagley and Mokhtarian, 1999), and the links between
lifestyle (reflective of socio-environmental values and attitudes) and environmental action
in and around the home (Barr and Gilg, 2006). Factor analysis can also help to reveal if
engagement in pro-environmental practices is significantly associated with other lifestyle
practices, or is independent, thus representing a unique “pro-environmental” lifestyle
sector (Axsen et al., 2012).
Here, factor analysis was used to a) assess how a pro-environmental lifestyle
(PEL) generally fits in with other lifestyle practices, and b) characterise different types of
PELs. Both groups of questions (general lifestyle activities and pro-environmental
lifestyle activities, as summarised in Table 2.2) were analysed independently. We first
conducted oblique and orthogonal extraction, and compared results. Oblique extraction
allows for correlation of the factors (the angle between the axes is not fixed during
rotation) while orthogonal extraction does not allow for correlation of factors (the angle
between the axes is fixed at 90 degrees during rotation) (Timmerman, 2005). Oblique is
argued by some to be a superior method due to allowing for correlations (Costello &
Osborne, 2005; Fabrigar et. al, 1999), but results can be more difficult to interpret.
Comparing results from both extraction methods, the results were similar enough to
justify using orthogonal rotation (the literature supports this if results from both extraction
methods are similar – see Fabrigar et. al, 1999 and Leandre et. al, 1999). For both factor
analyses I used orthogonal extraction--specifically I utilized the Principal Axis Factoring
with Varimax rotation specification in SPSS 17.0. Factor rotation means that each factor
has been rotated until it defines a distinct cluster of interrelated variables (Rummel,
1970).

23
I used a number of tests to determine the appropriate number of factors,
including the scree plot test, eigenvalues > 1, and interpretability of factors (Costello &
Osborne, 2005). The scree plot test involves examining the scree plot and finding the
point where the scree plot straightens out (i.e. there is a marked change in the line’s
pattern). This point indicates the maximum number of factors to extract (Child, 1990,
Fabrigar et al., 1999). The eigenvalues greater than 1 test involves choosing to retain as
many factors as there are eigenvalues equal to or greater than 1 (Fabrigar et. al, 1999).
And the interpretability test involves examining different factor results and choosing the
solution that makes the most sense. All three tests were used together in order to
choose the appropriate number of factors, however given the exploratory nature of this
project, I focused most on interpretability.
2.4. Regression Analysis
I use linear regression analysis to address my third research objective. Linear
regression is a method of analysis that models the relationship between a dependent
variable, and one or more independent, explanatory variable(s). Data are modelled using
linear predictor functions, and model parameters are estimated from the data.
I use the factors that resulted from the PEL activity questions as dependent
variables in a series of multiple regression analyses—these factors can also be
described as pro-environmental lifestyles (PELs) or “lifestyle sectors”. Table 2.4 details
the independent variables that were used in those regressions, as well as how we
treated each variable, and what the hypothesised relationship is between each variable
and with engagement in PEBs more generally. In particular, my analysis focuses on the
four core values (biospheric, altruistic, egoistic and traditional) as key independent
variables to see which values are associated with engagement in different PELs, when
controlling for other factors. In other words, performing this multiple regression analysis
allows me to identify which motivations (values) and contextual factors (demographics)
correspond with engagement in different PELs.

24
Table 2.4. Independent variables used in regression analysis
Variables Type of variable
Categories or explanation
Hypothesised relationship with engagement in
PEL
Age Continuous ?
Education Nominal Categories: College or University Graduate; Grad School; Other +
Income Continuous +
Sex Nominal Categories: Male; female ?
Number of people in the household Continuous -
Province of origin Nominal Categories: AB; BC; ON; QC; Other BC: +
AB: -
Type of area in which one lives (urban, suburban, rural)
Nominal Categories: Urban; Suburban; Rural ?
Work status Nominal Categories: Student; Employed; Retired; Other Student: +
Employed: ?
Retired: +
Other: ?
Values Continuous Four composite variables: Biospheric; Traditional; Altruistic; Egoistic
Calculation: adding the totals in each category to achieve a total sum out of 12 (12 representing the highest level for that category).
Biospheric: +
Traditional: -
Altruistic: +
Egoistic: -
New Environmental Paradigm (NEP) score
Continuous Composite variable
Calculation: assigning a value between -2 and 2 to each question option, from most environmentally-friendly answer to least environmentally-friendly answer. The score was the sum of all 8 questions.
+
Opinions on global warming Nominal 1 = Believe “global warming is a serious problem, and immediate action is +

25
Variables Type of variable
Categories or explanation
Hypothesised relationship with engagement in
PEL
necessary”; 0 = Anything else
Liminality score (openness to change)
Continuous Composite variable
Calculation: sum of scores across 9 questions, similar to NEP score.
+
Self-proclaimed climate change knowledge
Continuous +
How often one votes Continuous +
Political party affiliation Nominal Categories: Conservative Party; New Democratic Party; Liberal Party; Bloc Québécois; Green Party
Conservative: -
NDP: +
Liberal: +
Bloc Québécois: +
Green: +

26
2.5. Study limitations
There are several limitations to this study. Data was collected via an internet survey,
which limits our sample to people with computers, with internet access, and who are proficient
enough to complete a survey online. Our sample also only included people who are already pre-
registered to participate in surveys through a marketing research company. In addition, certain
regions were not well represented in our study (i.e. the territories). Another limitation was the
use of self-reported behaviours, which implies that people know themselves well enough to
accurately report on lifestyle engagement and values, and that people are being honest. As with
any method of data analysis, exploratory factor analysis has limitations, such as the subjectivity
of researcher decisions in running and interpreting a factor analysis (Beavers et al., 2013;
Henson & Roberts, 2006; Tabachnick & Fidell, 2001). In addition, there is debate in the
literature about using orthogonal versus oblique rotation, and the different methods of rotation
(Costello & Osborne, 2005; Fabrigar et al., 1999; Bryant & Yarnold, 1989; Beavers et al., 2013).
We utilised the most widely used and most interpretable method, but it is not necessarily the
method that will provide the most accurate results. Finally, the treatment of variables will affect
results, such as treating age or income as continuous variables, which does not allow for non-
linear relationships to emerge.

27
Chapter 3. Results
This section details the results of all three analyses conducted with this sample of
Canadian citizens: a) using factor analysis to learn how pro-environmental lifestyle fits with other
lifestyle practices, b) using factor analysis to show the different types of pro-environmental
lifestyles, and c) using regression analysis to explore how different core values are associated
with citizen engagement in different pro-environmental lifestyles.
3.1. General lifestyle sectors
As explained in Section 2.3., I use several tests to determine the number of factors. The
“eigenvalue greater than one” test and the scree plot both suggests 12 factors. However, after
running a number of analyses and analysing multiple solutions, I chose 10 factors based on
interpretability—which was my primary criterion for the factor solution (Table 3.1). Two
variables, “Travelling other than work” and “Playing video games”, do not load onto any factors.
I label these factors according the variables that they strongly load onto, that is, where
the factor loading is generally greater than 0.4. I summarise these factors below:
o Factor 1: Technology – Respondents with high engagement in this lifestyle (factor) more frequently engage in activities relating to researching, shopping, talking about, and working with or using new technologies.
o Factor 2: Spirituality and Giving – Respondents with high engagement in this lifestyle (factor) more frequently engage in activities relating to religion, meditation, exploring spirituality, personal development, volunteering, or giving to charity.
o Factor 3: Career and Success – Respondents with high engagement in this lifestyle (factor) more frequently engage in activities relating to their career and developing career skills, studying, and commuting to and travelling for work. This group also spends significant time focusing on other sources of income generation and personal development.

28
o Factor 4: Environmental – Respondents with high engagement in this lifestyle (factor) more frequently engage in activities relating to helping the environment through daily actions, thinking about how to protect the environment, and engaging in and promoting environmental conservation. They spend some time attending environmental meetings, although this loading was relatively low at .320.
o Factor 5: Home-improvement – Respondents with high engagement in this lifestyle (factor) more frequently engage in activities relating to gardening (for food and aesthetic reasons), renovating the home, and decorating the home.
o Factor 6: Recreation – Respondents with high engagement in this lifestyle (factor) more frequently engage in activities relating to partaking in outdoor and indoor sports and recreation, spends time in nature, and spends time with friends (likely because they tend to do these activities with friends).
o Factor 7: Home-making – Respondents with high engagement in this lifestyle (factor) more frequently engage in activities relating to shopping for the home, doing housework, decorating the home, and preparing food.
o Factor 8: Active in Social Issues – Respondents with high engagement in this lifestyle (factor) more frequently engage in activities relating to following current events, discussing politics, taking part in politics, and attending environmental meetings (higher loading than the Environmental Practice factor at .376).
o Factor 9: Family – Respondents with high engagement in this lifestyle (factor) more frequently engage in activities relating to family, and taking care of family.
o Factor 10: Indoor Home Leisure – Respondents with high engagement in this lifestyle (factor) more frequently engage in activities relating to indoor hobbies such as arts and crafts, reading for leisure, watching TV & movies, and using the internet. Spending time with friends also grouped here, but was low at .306.
The general lifestyle categories (factors) seen in this factor solution are consistent with
those found by Axsen et al. (2012), including technology-, spirtuality- and career-oriented
lifestyles. Similar to Axsen et al. (2012), I find that the pro-environmental factor (lifestyle)
emerged as a factor that was separate from other lifesyles and activities, which four of the five
variables strongly load onto as expected. Interestingly, the “attending environmental meetings”
variable is not strongly associated with other pro-environmental activities, and has a slightly
stronger association with being active in social or plolitcal issues (Factor #8).

29
Table 3.1. Rotated Factor Matrix solution for General Lifestyle Sectors
Activities relating to: #1:
Tech.
#2: Spirit/ Giving
#3: Career
#4: Enviro.
#5: Home-Improv
e- ment
#6: Recrea
- tion
#7: Home-making
#8: Social Issues
#9: Family
#10: Indoor Home
Communalities
Researching New Tech. TechsTechnologies
.790 .697 Shopping for New Tech. .819 .773
Using New Tech. .792 .710
Talking About New Tech. .810 .758
Working With New Tech. .703 .579
Personal Development .374 .322 .398
Religion .728 .554
Meditation .723 .581
Exploring Your Spirituality .840 .751
Volunteering .505 .407
Giving To Charity .470 .327
Main Career .675 .487
Other Sources Of Income .404 .200
Developing Career Skills .774 .653
Studying .538 .354
Commuting To Work .614 .401
Travelling For Work .601 .427
Thinking About Enviro. .788 .705
Trying To Help the Enviro. .733 .622
Attending Enviro. Meetings .320 .376 .516
Engaging In Enviro. Conservation
.535 .479
Promoting Enviro. Conservation .674 .634
Gardening Decoration .776 .706
Gardening Food .723 .594
Renovating House .598 .496

30
Activities relating to: #1:
Tech.
#2: Spirit/ Giving
#3: Career
#4: Enviro.
#5: Home-Improv
e- ment
#6: Recrea
- tion
#7: Home-making
#8: Social Issues
#9: Family
#10: Indoor Home
Communalities
Doing Housework .529 .430
Decorating Home .496 .358 .510
Spending Time In Nature .575 .511
Outdoor Sports and Recreation .776 .699
Indoor Sports and Recreation .599 .451
Shopping for Food .778 .644
Shopping (Non Food) .554 .436
Preparing Food .474 .305
Following Current Events .440 .317
Taking Part in Politics .627 .614
Discussing Politics .696 .591
Taking Care Of Family .742 .649
Spending Time With Family .849 .796
Indoor Hobbies .325 .272
Reading For Leisure .346 .243
Watching TV & Movies .581 .381
Using Internet Leisure .582 .409
Spending Time With Friends .331 .306 .309
Travelling Other Than Work .200
Playing Video Games .193
Total Variation 8.136 6.562 6.474 5.581 4.938 4.623 4.223 3.784 3.266 3.014

31
3.2. Pro-enviromental lifestyle sectors
I conducted a second factor analysis to investigate the different types of pro-
environmental lifestyles (PELs) that may exist, this time using the 45 PEL sectors questions.
The eigenvalues and scree plot tests suggested that the 11 factor solution was optimal. This 11-
factor solution also made the most sense intuitively so I consider it to also be interpretable
(although the 9 factor solution was a close second in terms of interpretability). One variable,
“Hang clothes to dry”, did not load onto any factor.
Table 3.2 depicts the 11 factor solution, where I labelled each factor according to the
variables that it strongly loads onto.
o Factor 1 – Home Conservation: Activity variables that grouped here include turning off the tap when doing dishes, soaping up, brushing teeth, minimising the number of baths and showers, reducing air conditioning use, reducing hot water temperature, turning down the heat, turning off lights when not in use, shutting off electrical appliances when not in use, and minimising water use in the yard. Using the washer and dryer only when full and avoiding excess packaging both loaded here as well, but only weakly so (.338 and .304, respectively). This PEL includes activities that are targeted at general water and electricity conservation.
o Factor 2 – Food Conscious: Variables that grouped here include buying organic food, buying fair-trade food, buying food from a farmer’s market, buying local food, eating a veggie diet, eating organic, free-range food, buying environmentally-friendly cleaners, reading product labels, avoiding excess packaging, and supporting environmental politicians.
o Factor 3 – Avoid New Purchasing: Variables that grouped here include avoiding excess packaging, buying used products, making own products instead of buying, fixing something rather than buy new, and trading or sharing with others instead of buying own.
o Factor 4 – Electricity Conservation: Variables that grouped here include using the washer and dryer only when full, turning off lights when not in use, and shutting off electrical appliances when not in use. Using a reusable bag and preparing one’s own food also loaded here, but only weakly (0.424 and .307 respectively). These activities are primarily concerned with electricity conservation, whether for environmental or financial reasons (motivation cannot be determined by the factor analysis).
o Factor 5 – Political Environmental: Variables that grouped here include supporting environmental politicians, attending pro-environmental meetings, and participating

32
in environmental activities. This factor represents social environmentalism, especially through politics, and being active in getting involved.
o Factor 6 – Nature Educator: Variables that grouped here include growing one’s own food, talking to kids about how food grows and where it comes from, and discussing environmental issues with kids. Buying food at a farmer’s market also grouped here, but only weakly (.306). This group of activities represents a concern with educating younger ones, through discussion and demonstration (growing one’s own food).
o Factor 7 – Efficiency Purchasing: Variables that grouped here include buying high efficiency lights, buying energy efficient appliances, and buying an efficient vehicle. This factor represents either concern about energy use, or concern about saving money associated with energy use.
o Factor 8 – Charitable Donator: Variables that grouped here include donating furniture and clothing to charity. This consistently came out as its own factor. This factor represents either a) trying to reduce waste through donating to charity, or b) trying to help out those less fortunate.
o Factor 9 – Recycling: Variables that grouped here include reusing paper and glass, using recycling bins, composting, and buying recycled products. These activities are primarily concerned with minimising waste production, at least in theory.
o Factor 10 – Reduce driving: Variables that grouped here include more often using transit or carpooling, or walking or cycling instead of driving.
o Factor 11 – Buy local: Variables that grouped here include buying local foods, buying environmentally-friendly cleaners, buying recycled products, buying from a local store, and turning off the tap when doing dishes and soaping up. Buying food from a farmer’s market also loaded here, but only weakly (.303). These activities are concerned with buying local and water conservation, but also with waste reduction (buying recycled products) and toxin reduction (environmentally friendly cleaners).
This analysis showed that there are 11 different pro-environmental lifestyle sectors that
Canadians may engage in. The variables within a given factor are strongly related with one
another, but engagement in the different lifestyles (factors) are not correlated with one another.
Therefore, these results support the notion that there are a variety of PELs across Canadian
citizens, and we have identified 11 of these lifestyles.

33
Table 3.2. Rotated Factor Matrix solution for Pro-environmental Lifestyle Sectors
#1:
Home con-
serve.
#2: Food cons- cious
#3: Avoid new purchase
#4: Electric
con- serve.
#5: Politic-
al enviro.
#6: Nature
educator
#7: Efficiency purchase
#8: Do-nate
#9:
Re- cycling
#10: Reduce driving
#11: Buy local
Comm- unalities
Turn Off Tap Soaping Up .599 .321 .528
Turn Off Tap Brushing Teeth .593 .427
Min # Baths Showers .566 .397
Reduce Air Cond .484 .314
Reduce Hot H2O Temp .610 .508
Turn Down Heat .596 .481
Min H2O Use Yard .450 .391
Turn Off Tap Dishes .501 .444 .525
Washer Dryer Only Full .338 .344 .349
Buy Organic Food .766 .668
Buy Fair Trade Food .550 .456
Eat Veggie Diet .555 .395
Eat Org Free Range Food .809 .739
Buy Env Cleaners .387 .380 .574
Read Product Labels .346 .336
Buy Food Farmers Market .356 .306 .303 .466
Avoid Excess Packaging .304 .351 .347 .492
Buy Used Products .651 .505
Make Own Products .670 .612
Fix Rather Than Buy New .546 .451
Trade Or Share Instead Of Buy
.611 .539
Turn Off Lights .342 .652 .598
Shut Off Elec Appliances .369 .467 .399

34
#1:
Home con-
serve.
#2: Food cons- cious
#3: Avoid new purchase
#4: Electric
con- serve.
#5: Politic-
al enviro.
#6: Nature
educator
#7: Efficiency purchase
#8: Do-nate
#9:
Re- cycling
#10: Reduce driving
#11: Buy local
Comm- unalities
Use Reusable Bag .424 .365
Prepare Own Food .307 .264
Support Env Politicians .342 .374 .466
Attend Pro Env Meetings .768 .773
Participate In Env Activities .701 .688
Talk To Kids About Food .777 .736
Discuss Env With Kids .605 .602
Grow Own Food .361 .334
Buy High Efficiency Lights .587 .442
Buy Energy Efficient Appliances
.705 .624
Buy Efficient Vehicle .443 .333
Donate Furniture To Charity .684 .634
Donate Clothes To Charity .745 .673
Reuse Paper Glass .420 .392
Use Recycling Bins .412 .418
Compost .539 .446
Use Transit or Carpool .744 .600
Walk or Cycle .585 .423
Buy Recycled Products .347 .360 .578
Buy Local Foods .330 .449 .503
Buy From Local Store .339 .336
Hang Clothes To Dry .256
Total Variation 8.289 7.028 5.759 4.048 4.034 3.759 3.727 3.479 3.050 2.898 2.894

35
3.3. Pro-environmental lifestyles and biospheric values
To achieve the third research objective, I estimated a total of 11 regressions – one for
each of the PELs (factors) identified in the previous section. I used the independent variables
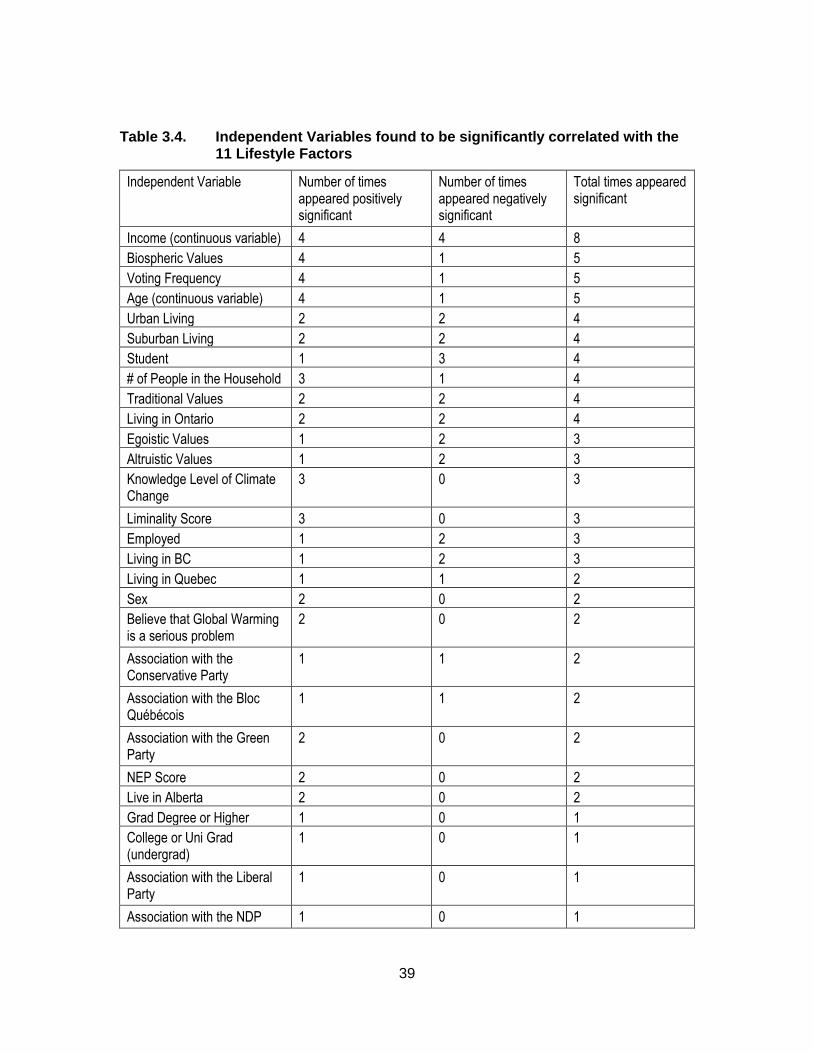
explained in Section 2.4. Table 7 shows comprehensive results from the 11 regressions. Table
8 shows the number of times that each independent variable was significant across the 11
regressions, and whether the relationship in lifestyle engagement was positive or negative.
Of the four value categories, the Biospheric values variable is most frequently found to
be statistically significant among the 11 regressions models, and is found to be a positive
predictor of respondent engagement in four lifestyles: Home Conservation, Food Conscious,
being a Nature Educator, and Recycling. It is a negative predictor of engagement in the Buy
Local lifestyle (at a 95% confidence level). Interestingly, the New Environmental Paradigm
(NEP) score (a measure of environmental concern) is a positive predictor of Buy Local.
Biospheric Values is unrelated to respondent engagement in the other six PEL sectors.
Traditional Values is significant four times, and Egoistic and Altruistic Values both
appear significant three times. Traditional Values is positively associated with the Electricity
Conservation lifestyle and Efficiency Purchasing lifestyle, and negatively associated with Food
Conscious and Political Environmental lifestyles. Egoistic Values is positively associated with
the Political Environmental lifestyle, while Altruistic Values is negatively associated with that
factor. Egoistic Values is, in contrast, negatively associated with the Efficiency Purchasing
lifestyle and the Recycling lifestyle. Altruistic Values is also negatively associated with Avoid
New Purchasing, and positively correlated with Buy Local. Efficiency Purchasing is positively
correlated with higher income and liminality.
Across the 11 regressions, income is the demographic variable that is most frequently
found to be statistically significant among the regression models, followed by voting frequency,
and age. Among the least statistically significant variables are education level and political party
association.
In particular, income seems to be an important contextual variable. It is a positive
predictor of respondent engagement in four lifestyles: Home Conservation, Nature Educator,

36
Efficiency Purchasing, and Recycling. Income is also a negative predictor of four lifestyles:
Avoid New Purchasing (indicating that higher income purchases new more often), Electricity
Conservation, Political Environmental (higher income is less environmentally politically active),
and Reduce Driving.
Voting frequency and age are both positively associated with the PEL factors four times
and negatively associated once. Knowledge Level of Climate Change appears significant three
times (positive in all three cases). Environmental concern, as indicated by the New
Environmental Paradigm (NEP) score, is positively associated with two PELs. Province of
residence is not clearly positively nor negatively associated with any PELs, although living in
British Columbia did appear negatively associated in two models, and only positively correlated
once.

37
Table 3.3. Pro-environmental lifestyles regression results
Model
1. Home conserve.
(R2 = .097)
2. Food conscious
(R2 = .136)
3. Avoid new purchase
(R2 = .075)
4. Electric conserve
(R2 = .134)
5. Political Enviro.
(R2 = .137)
6. Nature Educator
(R2 = .216)
7. Efficiency Purchase
(R2 = .111)
8. Donator
(R2 = .113)
9. Re- cycling
(R2 = .068)
10. Reduce Driving
(R2 = .254)
11. Buy Local
(R2 = .113)
Values (Continuous)
Biospheric Values 0.203** 0.257** 0.021 -0.035 0.035 0.092* -0.02 0.084 0.111* 0.021 -0.087*
Traditional Values 0.02 -0.164** 0.031 0.137** -0.122** 0.02 0.141** -0.035 0.016 -0.018 0.038
Altruistic Values 0.012 -0.036 -0.105** 0.039 -0.077* -0.028 -0.035 0.008 -0.055 -0.017 0.096*
Egoistic Values 0.014 0.033 0.064 -0.054 0.16** 0.024 -0.093** 0.008 -0.08* 0.036 0.059
Environmental variables
NEP Score (cont.) -0.024 -0.025 0.014 0.065 -0.062 -0.065 0.062 0.025 -0.037 0.07* 0.12**
Liminality Score (cont.) -0.025 0.171** 0.046 -0.011 0.054 0.008 0.075* 0.042 -0.017 0.018 0.093**
Believe global warming is a serious problem (dummy) 0.11** 0.002 -0.039 -0.056 0.076* -0.037 0.066 0.009 0.043 -0.044 -0.007
Believe air pollution is a serious problem (dummy) 0.066 0.009 0.035 -0.025 -0.037 0.043 -0.055 0.016 0.031 0.063 0.004
Climate Change Knowledge (cont.) -0.045 0.066* 0.014 0.089** 0.061 0.041 0.044 -0.016 0.001 0.086** 0.04
Demographics
Income (continuous) 0.096** 0.04 -0.105** -0.13** -0.079* 0.074* 0.208** 0.036 0.072* -0.136** 0.057
Voting Frequency (cont.) 0.009 -0.09** 0.029 0.077* 0.078* -0.028 0.034 0.106** 0.034 0.037 0.075*
Respondent Age (cont.) -0.017 0.123** -0.077 0.152** 0.122** -0.066 0.002 0.092* 0.032 -0.302** 0.072
Sex (male = 0; female = 1) -0.036 0.052 0.053 0.084** -0.058 0.02 -0.058 0.184** 0.028 0.046 -0.01
# In Household (cont.) -0.022 0.02 -0.03 -0.032 0.039 0.356** -0.036 0.069* 0.093* -0.099** -0.044
Student (Dummy) -0.027 0.084** -0.003 0.003 0.031 -0.1** -0.049 -0.091** 0.049 -0.024 -0.082*
Employed (Dummy) -0.05 -0.002 -0.011 0.049 0.111** -0.1** -0.001 0.015 0.064 -0.002 -0.116**
Retired (Dummy) -0.006 -0.052 -0.056 -0.016 0.088 -0.067 0.038 0.038 0.068 -0.019 -0.031
University Grad (dummy) -0.025 0.063* 0.031 -0.001 0.037 -0.03 0.003 0.016 0.027 -0.008 -0.055
Grad School (dummy) 0.06 0.007 0.056 -0.029 0.046 -0.012 -0.026 0.008 -0.002 0.078** -0.053

38
Model
1. Home conserve.
(R2 = .097)
2. Food conscious
(R2 = .136)
3. Avoid new purchase
(R2 = .075)
4. Electric conserve
(R2 = .134)
5. Political Enviro.
(R2 = .137)
6. Nature Educator
(R2 = .216)
7. Efficiency Purchase
(R2 = .111)
8. Donator
(R2 = .113)
9. Re- cycling
(R2 = .068)
10. Reduce Driving
(R2 = .254)
11. Buy Local
(R2 = .113)
Region (dummy)
Alberta 0.004 -0.015 0.04 0.105** 0.001 -0.029 -0.053 0.074* -0.021 0.039 -0.013
British Columbia -0.01 0.017 -0.029 0.174** 0.033 -0.093* -0.09* 0.035 0.055 0.049 -0.044
Ontario 0.03 -0.036 -0.005 0.188** 0.069 -0.112** -0.021 0.046 0.135** 0.072 -0.098*
Quebec 0.028 -0.044 -0.124** 0.129** -0.008 0.01 -0.086 0.088 0.043 0.017 -0.056
Urban -0.097* 0.064 -0.073 -0.066 -0.07 -0.077* 0.022 0.171** -0.022 0.35** -0.072
Suburban -0.019 0.059 -0.063 -0.048 -0.102* -0.038 0.041 0.164** 0.063 0.127** -0.164**
Political affiliation (dummy)
Conservative -0.037 -0.006 0.094** -0.074* 0.027 -0.028 0.006 0.006 0.032 -0.054 0.032
NDP -0.01 0.04 0.051 0.031 0.05 0.071* 0.034 -0.058 -0.032 0.018 -0.002
Liberal -0.041 0.02 0.032 0.009 0.104** 0.011 -0.012 -0.009 0.048 0.034 0.003
Bloc Québécois -0.032 0.016 0.05 0.022 0.014 0.016 0.067* 0.003 -0.067* 0.031 0.028
Green Party -0.034 0.115** 0.102** 0.006 0.049 0.017 -0.016 0.028 -0.017 0.015 -0.013
*Sig. < .05 **Sig. < .01
39
Table 3.4. Independent Variables found to be significantly correlated with the 11 Lifestyle Factors
Independent Variable Number of times appeared positively significant
Number of times appeared negatively significant
Total times appeared significant
Income (continuous variable) 4 4 8
Biospheric Values 4 1 5
Voting Frequency 4 1 5
Age (continuous variable) 4 1 5
Urban Living 2 2 4
Suburban Living 2 2 4
Student 1 3 4
# of People in the Household 3 1 4
Traditional Values 2 2 4
Living in Ontario 2 2 4
Egoistic Values 1 2 3
Altruistic Values 1 2 3
Knowledge Level of Climate Change
3 0 3
Liminality Score 3 0 3
Employed 1 2 3
Living in BC 1 2 3
Living in Quebec 1 1 2
Sex 2 0 2
Believe that Global Warming is a serious problem
2 0 2
Association with the Conservative Party
1 1 2
Association with the Bloc Québécois
1 1 2
Association with the Green Party
2 0 2
NEP Score 2 0 2
Live in Alberta 2 0 2
Grad Degree or Higher 1 0 1
College or Uni Grad (undergrad)
1 0 1
Association with the Liberal Party
1 0 1
Association with the NDP 1 0 1

40
Chapter 4. Discussion
This section discusses the results of analysis in relation to the literature, broken
down according to my three research questions:
1. How does pro-environmental lifestyle (PEL) fit with other lifestyle practices? 2. What are the different types of PELs? and 3. How do different core values influence citizen engagement in PELs?
4.1. General lifestyle sectors
My results from the General Lifestyle Sectors section of analysis indicate that
engagement in pro-environmental activities forms a unique lifestyle—a general PEL that
is separate from other lifestyles, which is consistent with the exploratory findings of
Axsen et al. (2012). Therefore, living a PEL in general does not necessarily fit in with
other Canadian lifestyle practices. The general PEL I identify with this Canadian sample
includes five types of activities: thinking about protecting the environment, trying to help
the environment through daily actions, promoting environmental conservation, engaging
in environmental conservation activities, and, to a lesser extent, attending environmental
meetings. Interestingly, the “attending environmental meetings” activity variable loaded
quite low on the pro-environmental factor in all factor solutions that I explored. This
finding suggests that attending environmental meetings may be more politically-
motivated, undertaken by those engaged in political activities and lifestyles (as
represented by Factor #8 in Table 3.1). Factor #8 describes those who are active in
political-oriented activities, and it is this lifestyle that is associated with attendance at
pro-environmental meetings. It is also interesting that the “recreation” lifestyle (Factor #6
in Table 3.1), was not associated with the PEL, showing no evidence that there is an

41
association between engagement in lifestyles relating to spending time in nature and
lifestyles relating to protecting nature.
The other (non-environmental) lifestyle factors identified in this study are
generally consistent with Axsen et al. (2012), including the “Tech-explore” and “Outdoor-
active” factors, which correspond with the “Technology” and “Recreation” factors
identified in the present study.
4.2. Pro-environmental lifestyle sectors
Within the general PEL identified in the first factor analysis, there are several
different subcategories of PEL sectors, indicating that one universal PEL does not exist.
In other words, there are a variety of different lifestyles that might be perceived as “pro-
environmental” by Canadian citizens. Specifically, we identify the following PELs :
o Factor 1: “Home conservation” encompasses activities that are oriented toward general water and electricity conservation.
o Factor 2: “Food conscious” represents activities related to buying organic and environmentally-friendly household food and products.
o Factor 3: “Avoid new purchasing” includes activities that avoid the need to purchase “new” products, such as purchasing used products, or fixing broken products.
o Factor 4: “Electricity conservation“ includes activities relating to electricity conservation, such as turning off lights when not in use.
o Factor 5: “Political environmental” includes activities such as attending environmental meetings and taking part in environmental activities.
o Factor 6: “Nature educator” represents activities relating to educating children about food and environmental activities.
o Factor 7: “Efficiency purchasing“ activities include the purchase of energy efficient appliances, light bulbs and vehicles.
o Factor 8: “Charitable donator” includes activities relating to donating furniture and clothes to charity.
o Factor 9: “Recycling” activities include recycling materials, reusing, and composting.
42
o Factor 10: “Reduce driving” represents engagement in transportation methods other than driving a vehicle alone, including taking transit, carpooling, walking, or cycling.
o Factor 11: “Buy local” includes activities related to buying “local” products, as well as several other activities such as water conservation, buying recycled products and buying environmentally friendly cleaners.
Studies by Whitmarsh and O’Neil (2010) and Barr et al. (2011) support my
general finding that what is considered to be a PEL can vary across respondents . In
particular, Whitmarsh & O’Neill (2010) conducted a factor analysis with U.K. survey data
and found seven groupings of Pro-Environmental Behaviours (PEBs). Their “Regular
water and domestic energy conservation” factor corresponds with my “Home
Conservation” factor; their “Eco-shopping and eating” factor closely corresponds with my
“Food Conscious” factor; their “Political actions” factor corresponds with my “Political
Environmental” factor; their “One-off domestic energy conservation actions” coincides
with our “Efficiency Purchasing” factor ; their “Waste reduction” factor corresponds with
“Recycling”, “Home Conservation”, and “Avoid New Purchasing” factors; and their
“Reducing car use and flights” somewhat corresponds with my “Reduce Driving” factor.
My present analysis finds four additional factors, which are Electricity Conservation,
Nature Educator, Donate, and Buy Local. I likely find these additional factors because
my survey instrument specified 45 different PEBs, whereas Whitmarsh and O’Neil
(2010) specified only 26 activities in their survey.
4.3. Linking engagement in pro-environmental lifestyles to values
Much literature finds that engagement in PEBs is generally associated with
biospheric and altruistic values, including Stern et al. (1995). After estimating regression
models for respondent engagement in each of the 11 pro-environmetal lifestyle factors
that we identify, I discover that Biospheric Values are only positively associated with
engagement in a subset of these PELS, namely Home Conservation, Food Conscious,
being a Nature Educator, and Recycling. However engagement in several of the PELs I
identify are not associated with Biospheric Values--Avoid New Purchasing, Electricity

43
Conservation, Political Environmental, Efficiency Purchasing, Charitable Donator, and
Reduce Driving.
This pattern is similar to Whitmarsh & O’Neill (2010), who found that pro-
environmental self-identity and environmental concern (NEP) is associated with
engagement in only some PELs. They found that pro-environmental identity is
associated only with eco-shopping and eating, waste reduction, and regular water and
domestic energy conservation, but a pro-environmental identity was not associated with
one-off domestic energy conservation actions, eco-driving, political actions, or reducing
car use and flights. Clearly, engagement in PEL can be associated with a variety of
motivations—not just an interest in protecting the environment.
I find that several other values can be significant predictors of PEB. Traditional
values is positively associated with engagement in Electricity Conservation and
Efficiency Purchasing lifestyles—both of which are not associated with biospheric values
or environmental concern. Interestingly, engagement in these lifestyles can also
correspond to cost savings, suggesting that respondents may engage in such activities
for financial reasons and not likely for pro-environmental reasons. Traditional values are
negatively correlated with Food Conscious and Political Environmental lifestyles. In
contrast, Stern et al. (1995) found that Traditional Values were negatively related to all
pro-environmental behaviours, although not significantly.
Egoistic Values is positively associated with Political Environmental lifestyle,
while it is negatively correlated with Efficiency Purchasing and Recycling. The latter two
results are not surprising, as egoistic values are generally found to have a negative or
non-significant association with pro-environmental behaviours. It is interesting that
political environmental lifestyles are found to be correlated with egoistic values. Stern et
al. (1995) found that egoistic values are negatively correlated with taking political action
for the environment, but positively correlated with willingness to write a letter to the
government supporting policies to reduce the use of fossil fuels, and to stop the loss of
tropical forests. The present finding is a novel one that probably warrants future research
attention.

44
The New Environmental Paradigm (NEP) score is a measure than can represent
the respondent’s level of environmental concern. I found NEP score to be only
significantly associated with engagement in the Buy Local lifestyle. Similarly, Whitmarsh
& O’Neill (2010) found NEP did not predict engagement in any PEBs. Rather, they found
that pro-environmental self-identity is a stronger motivation for behaviour than
environmental concern. It seems that in both studies, once the stronger predictor is
controlled for (biospheric values or pro-environmental identify) the NEP variable
becomes insignificant.
4.4. Linking engagement in pro-environmental lifestyles to contextual factors
While I find that values and environmental concern can help to explain citizen
engagement in some PELs, clearly there are other important factors that matter, such as
context. For example, Whitmarsh & O’Neill (2010) comment that individuals may be
“unable to translate their pro-environmental self-identity into consistent pro-
environmental behaviours due to lack of available options” (Whitmarsh & O’Neill, 2010,
p. 312). For this reason, my regression models also controlled for several contextual
factors, some of which helped to explain engagment in pro-environmental lifestyles.
Income is the variable that is most frequently significant across the models that
were estimated. Having a higher income was positively associated with several PELs:
Home Conservation, Nature Educator, Efficiency Purchasing, and Recycling. In the case
of Efficiency Purchasing, energy efficient appliances and devices typically have greater
up-front costs, which would likely deter lower income households from purchasing them.
With regard to Recycling, it could be that higher income households tend to live in
homes and neighbourhoods with more accessible recycling facilities.
Where income was negatively correlated with the dependent variable included
Avoid New Purchasing (indicating that higher income households purchases new
products more often), Electricity Conservation, Political Environmental (higher income
household are less engaged in environmental meetings and activities), and Reduce
Driving. It seems to make sense that lower income households are more likely to focus

45
on conserving energy, and also more likely to use transportation alternatives other than
driving a single occupancy vehicle. These findings on the importance of household
income are consistent with previous literature (Whitmarsh, 2009; Evans & Abrahamse,
2009). For example, Whitmarsh (2009) concluded that, in Hamsphire, England, energy
conservation is likely motivated more by financial or health considerations than out of
concern for climate change. However, Sanquist et al. (2012) found that, in the United
States, income is not a good predictor of energy consumption--rather, other contextual
factors accounted for the greatest variation in electricity consumption, such as climate,
household size, and computer or television usage.

46
Chapter 5. Conclusion
This study demonstrates that engagement in pro-environmental activities forms a
unique lifestyle—separate from other lifestyles. Moreover, there are many different
versions of pro-environmental lifestyles—I identify 11 categories Individual values can be
associated with lifestyle, where engagement in 5 of the 11 pro-environmental lifestyles is
positively associated with biospheric or altruistic values. Egoistic and Traditional Values
are also related to 3 pro-environmental lifestyle categories. Other personal factors also
help to explain pro-environmental lifestyle engagement, including income, age, and type
of residence (urban, suburban or rural). Therefore, changes in Canadians’ values are not
necessarily the only way to increase engagement in pro-environmental lifestyles—nor is
it likely to be the best way. Future research may seek to understand the conditions,
contexts, and motivations behind consumer behaviour more thoroughly, in addition to
understanding how societal influence affects behaviour in various parts of the world.

47
References
Abrahamse, W. & Steg, L.(2011). Factors related to household energy use and intention to reduce it: The role of psychological and socio-demographic variables. Human Ecology Review, 18(1), 30-40.
Axsen, J., TyreeHageman, J., & Lentz, A. (2012). Lifestyle practices and pro-environmental technology. Ecological Economics, 82, 64–74.
Bagley M. & Mokhtarian P. (1999). The role of lifestyle and attitudinal characteristics in residential neighborhood choice. Transportation and traffic theory: Proceedings of the 14th International Symposium on Transportation and Traffic Theory. Pergamon Press, Oxford, pp 735–758.
Barr, S. & Gilg, A. (2006). Sustainable lifestyles: Framing environmental action in and around the home. Geoforum, 37, 906-920.
Barr, S., Shaw, G., & Coles, T. (2011). Sustainable lifestyles: sites, practices, and policy. Environment and Planning, 43(12), 3011–3029.
Beavers, A., Lounsbury, J., Richards, J., Huck, S., Skolits, G., & Esquivel, S. (2013). Practical Considerations for Using Exploratory Factor Analysis in Education Research. Practical Assessment, Research & Evaluation, 18(6), 1-13.
Bryant, F. B., & Yarnold, P. R. (1989). A measurement model for the student version of the Jenkins Activity Survey. Journal of Personality Assessment, 53, 188-191.
Child, D., 1990. The essentials of factor analysis, second edition. London: Cassel Educational Limited.
Cordano, M., Welcomer, S., & Scherer, R. (2003). An analysis of the predictive validity of the new ecological paradigm. Journal of Environmental Education, 34, 22–28.
Costello, A. B. & Osborne, J. W. (2005). Best Practices in Exploratory Factor Analysis : Four Recommendations for Getting the Most From Your Analysis. Practical Assessment, Research & Evaluation, 10(7), 1-9.
Dietz, T., Fitzgerald, A., & Shwom, R. (2005). Environmental Values. Annual Review of Environment and Resources, 30, 335-372.

48
Dunlap, R. & Van Liere, K. (1978). The “New Environmental Paradigm": A proposed measuring instrument and preliminary results. The Journal of Environmental Education, 9, 10-19.
Evans, D. & Abrahamse, W. (2009). Beyond rhetoric: The possibilities of and for 'sustainable lifestyles'. Environmental Politics, 18, 486-502.
Fabrigar, L. R., Wegener, D. T., MacCallum, R. C., & Strahan, E. J. (1999). Evaluating the use of exploratory factor analysis in psychological research. Psychological Methods, 4(3), 272-299.
Henson, R.K. & Roberts, J.K. (2006). Use of exploratory factor analysis in published research: common errors and some comment on improved practice. Educational and Psychological Measurement, 66, 393-416.
Herndl, C. G., & Nahrwold, C. A. (2000). Research as social practice: a case study of research on technical and professional communication. Written Communication, 17(2), 158-296.
Jackson, T., 2005. Motivating Sustainable Consumption: A Review of Evidence on Consumer Behaviour and Behavioural Change. Sustainable Development Research Network, University of Surrey, Guildford, Surrey, UK.
Rummel, R., 1970. Applied Factor Analysis. Northwestern University Press.
Sanquist, T. F., Orr, H., Shui, B., & Bittner, A. C. (2012). Lifestyle factors in U.S. residential electricity consumption. Energy Policy, 42, 354–364.
Schelly, C. (2014). Implementing renewable energy portfolio standards: The good, the bad, and the ugly in a two state comparison. Energy Policy, 67, 543-551.
Schwartz, S. H. & Bilsky, W. (1987). Toward a Universal Psychological Structure of Human Values. Journal of Personality and Social Psychology, 53, 550-562.
Spaargaren, G. (2003). Sustainable consumption: A theoretical and environmental policy perspective. Society & Natural Resources, 16, 687-701.
Stern, P. C., Dietz, T., & Guagnano, G.A. (1995). The New Ecological Paradigm in Social-Psychological Context. Environment and Behavior, 27(6), 723–743.
Stern, P.C., Dietz, T., & Guagnano, G.A. (1998). A brief inventory of values. Educational & Psychological Measurement, 58, 984–1001.
Tabachnick, B. & Fidell, L. (2001). Using multivariate statistics. Needham Heights: Allyn & Bacon.

49
Timmerman, M. (2005). Factor Analysis. Paper published at Heymans Institute for Psychology, Rijksuniversiteit Groningen, Netherlands, February 5, 2005.
Whitmarsh, L. (2009). Behavioural responses to climate change: asymmetry of intentions and impacts. Journal of Environmental Psychology, 29, 13–23.
Whitmarsh, L. & O’Neill, S. (2010). Green identity, green living? The role of pro-environmental self-identity in determining consistency across diverse pro-environmental behaviours. Journal of Environmental Psychology, 30(3), 305–314.
Wilson, C. & Dowlatabadi, H. (2007). Models of Decision Making and Residential Energy Use. Annual Review of Environment and Resources, 32, 169-203.