697 design and simulation of a poly(vinyl alcohol
TRANSCRIPT
Design and simulation of a poly(vinyl alcohol)–bacterialcellulose nanocomposite mechanical aortic heart valveprosthesisH Mohammadi1*, D Boughner1,2, L E Millon1, and W K Wan1,3
1Department of Biomedical Engineering, Faculty of Engineering, The University of Western Ontario, London, Ontario,
Canada2London Health Sciences Center, London, Ontario, Canada3Department of Chemical and Biochemical Engineering, The University of Western Ontario, London, Ontario, Canada
The manuscript was received on 31 July 2008 and was accepted after revision for publication on 21 April 2009.
DOI: 10.1243/09544119JEIM493
Abstract: In this study, a polymeric aortic heart valve made of poly(vinyl alcohol) (PVA)–bacterial cellulose (BC) nanocomposite is simulated and designed using a hyperelastic non-linear anisotropic material model. A novel nanocomposite biomaterial combination of 15 wt%PVA and 0.5 wt% BC is developed in this study. The mechanical properties of the synthesizedPVA–BC are similar to those of the porcine heart valve in both the principal directions. Todesign the geometry of the leaflets an advance surfacing technique is employed. A Galerkin-based non-linear finite element method is applied to analyse the mechanical behaviour of theleaflet in the closing and opening phases under physiological conditions. The model used inthis study can be implemented in mechanical models for any soft tissues such as articularcartilage, tendon, and ligament.
Keywords: finite element method, mechanical heart valves, poly(vinyl alcohol), bacterialcellulose, soft tissue, anisotropy, non-linearity
1 INTRODUCTION
Trileaflet polymeric heart valve (HV) prostheses have
been considered an effective alternative replace-
ments for failed HVs as they have a similar geometry
and structure to those of the native valve. Based on
this similarity, they have better haemodynamics with
lower pressure gradient, central flow, and larger
orifice area compared with the bileaflet mechani-
cal counterparts. The most important features for
a polymer to be employed in HV prostheses are
biocompatibility, haemocompatibility, and resis-
tance to calcifications, with mechanical properties
similar to those of the native HV tissue. The main
problems with polymeric HVs are failure due to
tearing and calcification of the leaflets under high
dynamic tensile bending stress and oxidative reac-
tions with blood [1]. From a structural and mechan-
ical properties point of view, it has been hypothe-
sized that valve leaflet material fabricated from fibre-
reinforced composite material that mimics the native
valve leaflet structure and properties will optimize
leaflet stresses and decrease tears and perforations
[1]. Materials that have been considered over the
past years including poly(tethrafluroethylene), poly
(vinyl chloride), segmented poly(urethane), silicon
rubber, and poly(ether urethane urea) all have
shortcomings in fatigue life and calcification com-
plications [1–4].
Mechanical modelling is an effective tool to
analyse and optimize the design of prosthetic HVs.
In early studies, isotropic models and later aniso-
tropic and time-dependent models with higher
degrees of complexity were considered to simulate
the dynamics of HVs and the stress on leaflets in
both the closing and the opening phases of the
cardiac cycle [5–14]. Li et al. [15] and Luo et al. [16]
*Corresponding author: Department of Biomedical Engineering,
Faculty of Engineering, The University of Western Ontario,
London, Ontario N6A 5B9, Canada.
email: [email protected]
697
JEIM493 F IMechE 2009 Proc. IMechE Vol. 223 Part H: J. Engineering in Medicine
at UNIV OF WESTERN ONTARIO on January 28, 2016pih.sagepub.comDownloaded from
presented a non-linear anisotropic model for por-
cine HV and analysed the effect of geometry and
non-linearity of the tissue mechanical properties on
stress distribution in a porcine HV. De Hart et al. [17]
studied the effect of collagen fibres on the me-
chanics and haemodynamics of a trileaflet aortic
valve using numerical methods. Recently, Kim et al.
[18] have provided a new approach using a Fung-
type elastic constitutive model for pericardial bio-
prosthetic HVs accounting for anisotropy and hy-
perelasticity of the HV leaflets.
Bacterial cellulose (BC) and poly(vinyl alcohol)
(PVA) (a hydrophilic biocompatible polymer) as an
anisotropic nanocomposite have valuable character-
istics for biomedical applications [19]. Millon and
Wan et al. [20] reported a material properties match
between PVA and porcine aortic root, but this was
not the case for the HV leaflets [20]. Guhados et al.
[21] measured the elastic modulus of a single
bacterial cellulose fibre using atomic force micro-
scopy, indicating that the stiffness of BC fibres was
sufficient for reinforcement of PVA sheets.
In this study an anisotropic and non-linear finite
element (FE) model is implemented to study the
mechanical behaviour of leaflets in a PVA–BC HV
prosthesis under physiological conditions. Also, a
methodology to design trileaflet aortic HV pros-
theses is presented.
2 METHOD
2.1 Experimental set-up
PVA, 99+ per cent hydrolysed and with a molecular
weight of 146 000–186 000, was used for the solution
preparation. A suspension of 0.877 wt% BC in
distilled water was used, which was produced in
shake flasks by fermentation process using the
bacterium Acetobacter xylinum, as described by
Guhados et al. [21]. Dry PVA and distilled water
were added to the BC suspension to obtain a 15 wt%
PVA with 0.5 wt% BC mixture. The PVA–BC solu-
tion was transferred into three aluminium moulds
and placed in a heated–refrigerated circulator (VWR
model 1180S), which cycled the moulds once be-
tween 20 uC and 220 uC at 0.1 uC/min to give cycle
1 samples, following the same procedure reported by
Millon and Wan. [20]. To create the maximum
anisotropy in the longitudinal direction, an initial
strain of 75 per cent was applied for all three
samples, as reported in reference [19]. The cycle 1
samples were transferred and stretched, while pla-
cing an extra sample of non-stretched PVA–BC
hydrogel (cycle 1) in the moulds as controls. The
moulds were cycled, using the above-mentioned
freeze–thaw cycle procedure, and a mould was
removed at the end of cycles 2, 4, and 6.
The testing equipment consists of a servohydraulic
testing machine (Instron 8872) equipped with a 1 kgf
load cell. After measuring the sample thickness,
testing was carried out inside a Plexiglas tank filled
with distilled water kept at 37 uC. All the specimens
were secured on to tissue grips (about 10mm grip to
grip), and tensile tests were performed at a strain
rate of 40mm/s to a maximum of 60 per cent strain.
Prior to the tensile tests, all specimens were pre-
conditioned with ten loading and unloading cycles
with an amplitude of 5 cm (peak-to-peak valve of
10 cm) and a frequency of 2 cycles/s.
The mechanical properties of biological tissues are
strain or loading rate dependent owing to their
viscoelastic nature. Biological tissues typically be-
come stiffer with increasing strain rate. As such,
predetermined and tightly controlled strain or load-
ing rates must be maintained during testing. Further,
many biological tissues in their normal state are
preconditioned (e.g. the ligament) while many are
not (e.g. the brain). For a tissue that has not been
preconditioned, its response to load or displacement
from one cycle to the next will not be similar and
hence results will not be consistent. Depending
on the type of tissue being tested or the response
of interest (e.g. sudden impact or fatigue failure),
preconditioning as part of the testing protocol may
or may not be necessary.
2.2 Constitutive model
This section describes the development of a con-
stitutive model for the modelling of a leaflet
structure made from PVA–BC as a soft anisotropic
material. The constitutive model describes the
necessary mechanical behaviour of the biomaterial
used, such as non-linear behaviour, large deforma-
tion, anisotropy, and distinct behaviour in tension.
This approach is based on the theory of a large strain
in continuum mechanics using a strain energy
density function in both circumferential and long-
itudinal directions separately (Fig. 1).
The key idea is to define a stress energy density
function from which the stress can be derived by
taking the partial derivatives conjugate to the strain.
In theory, the selection of such a strain energy
density function is unlimited and arbitrary and
NASTRAN supports most of the generic strain energy
density functions. A choice was made to use a
698 H Mohammadi, D Boughner, L E Millon, and W K Wan
Proc. IMechE Vol. 223 Part H: J. Engineering in Medicine JEIM493 F IMechE 2009
at UNIV OF WESTERN ONTARIO on January 28, 2016pih.sagepub.comDownloaded from
complete second-order polynomial form because it
appears that five terms are sufficient for the present
application. One advantage of the polynomial mat-
erial model, in this case, is that it approximates
all the testing data nicely. Additionally, for theore-
tical simplicity, hyperelastic materials are assumed
to be incompressible. An incompressible material
will cause volumetric locking that requires special
treatment on element formulation. This limits the
choice of element types for stress analysis on a
nearly incompressible hyperelastic material to first-
order solid elements, structural elements, and
second-order solid elements.
2.3 The Mooney–Rivlin hyperelastic model
This model is defined by a strain energy density
function given as a function of principal strains,
which are also called strain invariants. The Mooney–
Rivlin model can be written in the form
W~X‘i,j~0
aij I1{3ð Þi I2{3ð Þj, a00~0 ð1Þ
where I1 and I2 are the first and second strain
invariants respectively and aij represents the model
constants. As it is assumed that the material used in
this study is soft and incompressible, I35 1. It can be
noted that I3 is the same as J.
ANSYS 9.0 was used for the Mooney–Rivlin
material model calculation. The nine coefficients
are obtained by curve fitting the three recommended
material characterization experiments. ANSYS allows
the input of either the hyperelastic constants or the
test data. When test data are used as the input,
ANSYS calculates the hyperelastic constants and
provides a quick graphical comparison of the mat-
erial model response and the experimental data.
The constants aij are determined by the true stress–
strain curve obtained from the uniaxial tensile tests.
The least-squares error to be minimized during data
fitting is based on absolute errors defined as
Rj j~Xi
a’i{aið Þ2 ð2Þ
where |R| is the absolute error, ai9 is the measured
datum, and ai is the calculated datum. Equation (2)
must be satisfied in order to ensure that the uniaxial
data fit the obtained data. To calculate the absolute
error a short custom code was applied.
2.4 Model constants
The material used for the artificial HV is PVA matrix
reinforced by BC nanofibres; this is classified as an
anisotropic short-fibre-reinforced nanocomposite.
The engineering values of the strain–stress curve
of PVA–BC are curve fitted by the equation [19]
s~y0za ebezc ede ð3Þ
where s is the engineering stress, e is the non-
uniform engineering strain, and y0, a, b, c, and d are
fitting parameters (listed in Table 1). The elastic
modulus as a function of strain was calculated as the
first derivative of equation (3) with respect to strain.
For statistical comparisons, a two-way analysis of
variance was performed, which is consistent with the
statistical analysis performed previously [19, 20].The engineering data are now transformed into the
true strain–stress curve (Fig. 2) for both circumfer-
ential and longitudinal directions.
To determine the constants in equation (1) from
the uniaxial tests, the stress–strain curve is converted
to the strain energy density function by minimizing
the absolute error presented in equation (2) using a
non-linear regression analysis. The true stress–strain
curves measured separately in the circumferential
and longitudinal directions were curve fitted into
three categories of the Mooney–Rivlin models with
two, three, and five parameters. The constants of
equation (1) for circumferential and longitudinal
directions are given in Tables 2 and 3 respectively.
These tables also outline the absolute errors with
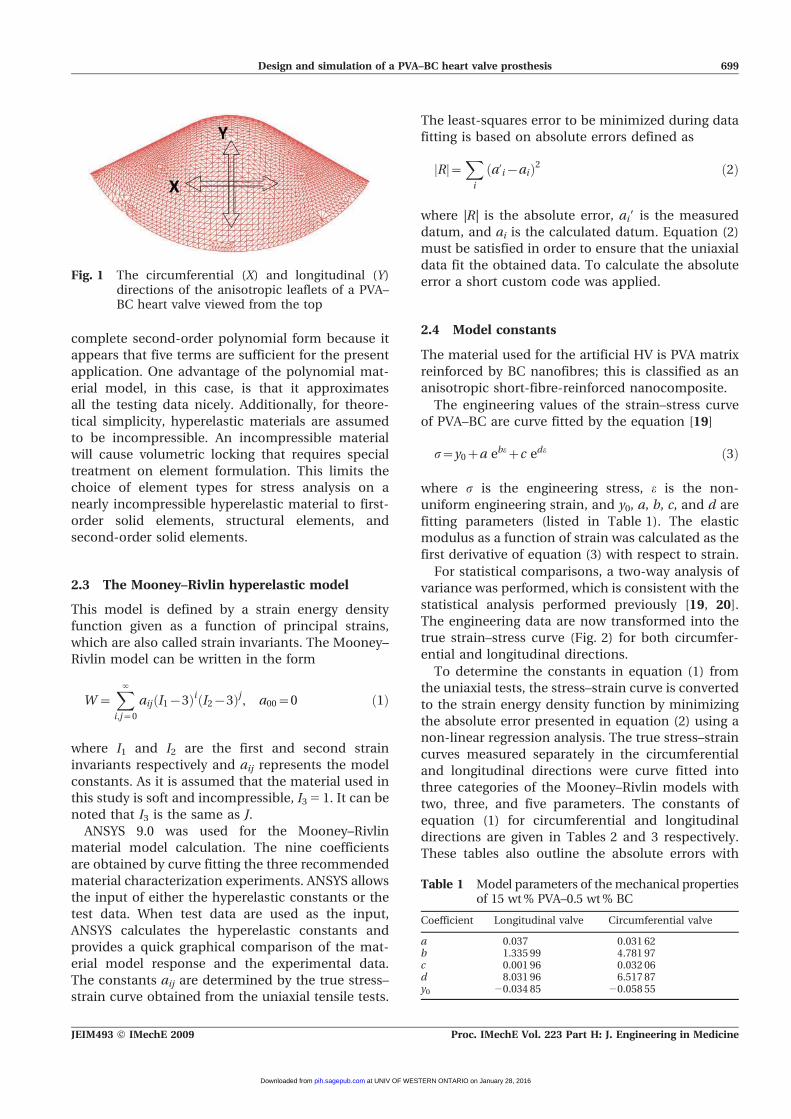
Fig. 1 The circumferential (X) and longitudinal (Y)directions of the anisotropic leaflets of a PVA–BC heart valve viewed from the top
Table 1 Model parameters of the mechanical propertiesof 15 wt% PVA–0.5 wt% BC
Coefficient Longitudinal valve Circumferential valve
a 0.037 0.031 62b 1.335 99 4.781 97c 0.001 96 0.032 06d 8.031 96 6.517 87y0 20.034 85 20.058 55
Design and simulation of a PVA–BC heart valve prosthesis 699
JEIM493 F IMechE 2009 Proc. IMechE Vol. 223 Part H: J. Engineering in Medicine
at UNIV OF WESTERN ONTARIO on January 28, 2016pih.sagepub.comDownloaded from

each constitutive model when fitted to the experi-
mental data. The parameter shown in Tables 2 and 3
describe the Mooney–Rivlin models, with various
numbers of model constants.
2.5 Advance surfacing technique for the geometryof the HV
The free form of the HV leaflet refers to the curved
line defining the free edge of the leaflet in contact
with the two adjacent leaflets when viewed from the
top. Revolution of this curve about the longitudinal
axis of the aorta where each incremental rotation of
the curve about the axis intersects the free edge
forms the curve surface in both the longitudinal and
the circumferential directions. Besides the leaflet
geometry, other design parameters such as the
thickness of the leaflet, which is not necessarily
uniform, the diameter of the valve, the width of the
posts of the stent, and the material properties of
the leaflet and stent all have roles in the valve’s
mechanical behaviour.
In the literature, a special conicoid demonstrated
poor leaflet opening characteristics and a high
opening pressure gradient [22]. An ellipsoid of
revolution has been demonstrated to have a re-
stricted selection of the major axis and eccentricity
of the ellipsoid as determined by the height of the
valve [23]. A paraboloid of revolution with the focus
at the base of valve was unacceptable because the
radius of curvature of the leaflet is lower at the base
of the leaflet, which inhibits valve opening [23]. A
closed leaflet with an elliptical geometry in the radial
direction and hyperbola in the circumferential
direction has been reported to have regurgitation
and leakage volume lower than both St. Jude
bileaflet mechanical and St. Jude prosthetic valves
with an equivalent valve size [24]. Leat and Fisher
[23] reported a new geometry for the design of
polyurethane leaflet HVs. The geometry termed the
alpharabola has a radius of curvature that increases
from the centre of the leaflet at the free edge towards
the base of the valve and perimeter of the leaflet to
improve the opening characteristics of the HV [22]. A
more recent approach reported by Jiang et al. [22]
used the revolution of the arc subtending two
straight lines. Using this approach, PVA trileaflet
valves with a smaller apex opening and reduced gap
between adjacent leaflets were achieved [22]. The
problems with the Jiang et al. model are, first, the
gap between the two adjacent leaflets and, second, a
relatively large orifice area in the centre of the HV
which may compromise valve performance. Also,
the use of hyperbolic function makes reaching the
desired leaflet geometry impossible. More impor-
tantly, this design did not take into account the
mechanical properties of the materials used.
In this section, a new design of a trileaflet HV
based on the anisotropic PVA–BC material proper-
ties is described. This design addresses the problems
related to the Jiang et al. design by, first, developing
Fig. 2 The true strain–stress curve obtained from theexperimental tensile test for the anisotropic 15wt% PVA–0.5 wt% BC
Table 2 The hyperelastic parameters for the different types of Mooney–Rivlin model for thelongitudinal direction
a10 a01 a20 a11 a02 Absolute error (%)
Two parameters 20.144 20.13 0 0 0 4.16Three parameters 20.446 0.499 0.0330 0 0 1.47Five parameters 23.906 4.095 27.240 272.51 50.882 0.15
Table 3 The hyperelastic parameters for the different types of Mooney–Rivlin model for thecircumferential direction
a10 a01 a20 a11 a02 Absolute error (%)
Two parameters 1.365 21.374 0 0 0 3.38Three parameters 2.790 3.053 2.396 0 0 0.98Five parameters 226.778 28.001 184.86 2492.57 346.379 0.07
700 H Mohammadi, D Boughner, L E Millon, and W K Wan
Proc. IMechE Vol. 223 Part H: J. Engineering in Medicine JEIM493 F IMechE 2009
at UNIV OF WESTERN ONTARIO on January 28, 2016pih.sagepub.comDownloaded from

a new approach to define valve leaflet geometry,
second, minimizing the apex opening, and, third,
incorporating the mechanical and material proper-
ties of the anisotropic PVA–BC material into the
design process.
2.5.1 Bezier surface
The Bezier surface is formed as the Cartesian
product of the blending functions of two orthogonal
Bezier curves. A Bezier surface is a weighted sum of
n+ 1 in the u direction and m+ 1 in the v direction of
control points P0,0,…, Pij, where the weights are the
polynomials [25]
Part A of this equation is called the blending
function since it blends the control points to form
the Bezier curve. This function is always a poly-
nomial one degree less than the number of the
control points. Part B is the control points in
the u and v directions. A Bezier surface is chosen
in this study since Bezier surfaces do not pass
through any of the control points except those
located at the boundaries. One important advan-
tage of Bezier surfaces is that the surface is always
contained within the convex framework of the
control points and it never oscillates widely away
from the control points. To design the leaflet
geometry, first the boundaries of the HV leaflet,
which consist of the commissure and the free
edges, are designed and then a limited number of
control points are used to produce the desired
Bezier surface.
There are two ways to describe the fully closed
form of the HV leaflet to obtain the necessary control
points to create the geometry: first, by mapping the
leaflet geometry of a trileaflet bioprosthetic valve,
which can be achieved using a coordinate measur-
ing machine with a laser scanning system (e.g. 3D
Digital Corp, three-dimensional (3D) scanner cyber-
ware) or other digitizing systems [22], and, second,
by deriving the necessary control points from the
equations used in the Jiang et al. [22] model. The
second option is chosen as the equations for the
leaflet geometry are already available to us. As the
number of control points increases, it is necessary to
have higher-order polynomials and possibly factor-
ials. Hence, an efficient algorithm for this conversion
is highly desired. Degree reduction of a Bezier
surface is a process in which one Bezier polynomial
is approximated by another of lower degree. The
process of degree reduction is carried out by
minimizing the L2 norm between the two surfaces
(the Jiang et al. model and the current model). The
degree reduction of Bezier surfaces is considered as
solving the inconsistent linear system using the
least-squares method demonstrated in Fig. 3. Fig-
ure 4 shows the order reduction of the concave
shape of the leaflet geometry as a Bezier-type surface
by changing the number of control points in an
evaluation process. The six Bezier subsurfaces con-
structed to create the HV leaflet geometry using 50
control points are shown in Fig. 4. The first version
of this model is produced in computer aided design
(CAD) software, Mechanical Desktop 2006, using the
six Bezier subsurfaces assembled in Fig. 5(a). The
number of vertices in this wireframe is 51 (Fig. 5(b))
including 22 boundary vertices which consist of nine
vertices on the free edge and 15 on the commissure
edge, with 29 central control points optimally
distributed all over the surface of the leaflet. The
first derivative is matched as the tangent at the
boundaries of the subsurfaces at the end of one
f x, yð Þ~Xni~1
n
i
� �1{xð Þn{ixi
Xmj~1
m
j
� �1{yð Þm{j
|fflfflfflfflfflfflfflfflfflfflfflfflfflfflfflfflfflfflfflfflfflfflfflfflfflfflfflfflfflfflfflfflfflfflfflffl{zfflfflfflfflfflfflfflfflfflfflfflfflfflfflfflfflfflfflfflfflfflfflfflfflfflfflfflfflfflfflfflfflfflfflfflffl}A
yj Pi, j
B
?x, y [ 0, 1½ �
Fig. 3 Developing the leaflet geometry using a 363 tensor product: (a) degree evaluation (r5 1);(b) degree of evaluation (r5 2); (c) repeated degree evaluation r
ð4Þ:
Design and simulation of a PVA–BC heart valve prosthesis 701
JEIM493 F IMechE 2009 Proc. IMechE Vol. 223 Part H: J. Engineering in Medicine
at UNIV OF WESTERN ONTARIO on January 28, 2016pih.sagepub.comDownloaded from

piece must be along the next piece (C1) but second-
order continuity (C2) is not necessary.
2.5.2 The final model
To form the final model, starting with the geometry of
the leaflet, the free and commissure edges can be
tailored as desired. One of the advantages of this
approach is the elimination of gap between the two
adjacent leaflets in the first stage of the design of the
final geometry of the valve leaflets. Also, the free-edge
design is based on the use of the biomaterial, i.e. PVA–
BC. This is applicable by applying the FE model to
ensure that the orifice area is reasonably small when
the valve is fully closed (end of diastole). By manip-
ulating the control points on the free edge and
analysing the new geometry with the FE procedure
shown in Fig. 6, it is ensured that the orifice area
at the centre of the valve is sufficiently small when
it is fully closed. Finally, a CAD model of free-
form leaflet geometry using a Bezier-type surface
is designed, which is shown in Fig. 7. The stent
dimensions were replicated from the Medtronic
Mosaic aortic bioprosthetic model 305 [26]. The
dimensions used for the stent are given in Table 4.
Fig. 4 The Bezier subsurfaces for the construction of the leaflet geometry
Fig. 5 (a) The assembled Bezier patches concerning the surface parameters, e.g. the tangentplane, normal vectors as illustrated in the figure; (b) the final wire frame model
702 H Mohammadi, D Boughner, L E Millon, and W K Wan
Proc. IMechE Vol. 223 Part H: J. Engineering in Medicine JEIM493 F IMechE 2009
at UNIV OF WESTERN ONTARIO on January 28, 2016pih.sagepub.comDownloaded from

In order to improve the surface quality, as the final
refinement of the surface, Bezier curves were
adjusted through a trial-and-error process by
relocating, removing, or interpolating the control
points. The present 3D CAD model was then
created by using a command to be converted to a
shell in any available CAD software, e.g. command
Shell of I-Deas in which a uniform thickness is
required to produce a shell through the designed
Bezier surface. We used Mechanical Desktop V2005i
CAD software to produce the surfaces. The final
model consists of three identical leaflets, with each
leaflet being symmetrical about its own midline
between the top of the free edge to the midpoint of
the commissure of the leaflet shown in Fig. 7. In
this section, an advance surfacing technique is
introduced for complicated geometries such as HV
leaflets that are more refined compared with the
former designs as it is reproducible, computation-
ally fast, easy to manipulate, and easy to combine
with other segments or other surfaces. This
approach when used in combination with material
properties and a finite element method (FEM)
solution can provide an optimum design of me-
chanical HVs and other medical devices and this is
the approach that was taken.
2.6 The finite element model
2.6.1 FEM software and anisotropy
Mechanical modelling of soft tissues using hyper-
elastic anisotropic elements is not available directly
in any FE commercial software. The material model
used in the anisotropic PVA–BC nanocomposite,
Fig. 6 Flow chart scheme to correct the leafletgeometry in an iteration process. Aor is com-pared with the total opening area and is set tozero when the ratio of Aor to the total area is lessthan 5 per cent
Fig. 7 The final geometry of the PVA–BC heart valve. The gaps between the two adjacent leafletshave been eliminated and the orifice area in the middle of the valve will be less than 5 percent of the total orifice area of the valve in the fully closed position
Table 4 Dimensions of the heart valve stent
Valve size (outer diameter of the stent) 30.0mmOrifice diameter (inner diameter of the stent) 28.0mmSewing ring diameter 35.0mmValve height 17.5mmAortic protrusion (valve height minus the height ofthe saddle arc on the sewing ring)
14.5mm
Design and simulation of a PVA–BC heart valve prosthesis 703
JEIM493 F IMechE 2009 Proc. IMechE Vol. 223 Part H: J. Engineering in Medicine
at UNIV OF WESTERN ONTARIO on January 28, 2016pih.sagepub.comDownloaded from

consisting of an isotropic PVA matrix reinforced with
BC homogeneously embedded in the circumferential
direction similar to the distribution of collagen fibres
in the aortic HV leaflet. The principal axes are
defined in directions parallel and perpendicular to
the BC fibres. In the material model, the fibres are
assumed to behave like ropes since they cannot
withstand a bending moment. Available elements
that possess such properties in commercial FE
software are spar elements. The PVA matrix is
described by the Mooney–Rivlin model for isotropic
hyperelastic material. This can be solved using the
commercial FE software package ANSYS. In the FE
mesh the diameter of individual spar elements for
each PVA matrix is calculated as the BC volume
fraction in a composite Voigt model (Fig. 8).
2.6.2 Boundary conditions
(a) Leaflet contact. The contact surfaces and the
corresponding force are determined by interactive
computation of a pushback force which is calcu-
lated on nodes. To characterize the kinematics of
the contact, two symmetrical leaflets are defined
whose surfaces are qs1 and qs2 in 3D space, as
shown in Fig. 9. The distance from each point on
the leaflet from the central plane is defined by a
scalar function g(x), which is the ‘gap’ function.
Assuming frictionless contact, the contact force
must be normal to the surface of the leaflets. The
normal vector is a partial derivative of g(x) with
respect to the spatial coordinates. Thus, the con-
tact force is [27]
Fn~Lg xð ÞLx
~F +g ð5Þ
The penalty method replaces the contact force
with the penalty eFg, as shown in Fig. 10. As in the
FEM, all forces must be discretized into a nodal
equivalent force; the contact force in the penalty
formulation is discretized as [27]
Fig. 8 Anisotropy through a hybrid element, a combination of an isotropic hyperelastic element,and a spar element oriented in the circumferential direction
Fig. 9 (a) geometry of the leaflets to be solved for a pushback contact solution; (b) surfacesbefore and after contact; (c) penalty method to contact force
704 H Mohammadi, D Boughner, L E Millon, and W K Wan
Proc. IMechE Vol. 223 Part H: J. Engineering in Medicine JEIM493 F IMechE 2009
at UNIV OF WESTERN ONTARIO on January 28, 2016pih.sagepub.comDownloaded from

F conte ~
ðLsc
eFg +g Ne x1, x2ð Þ da ð6Þ
where eFg Hg is the contact penalty force, Ne is the
shape function, qsc is the contact area, da is the
element area, and Fconte is the nodal equivalent
contact force on node e.
(b) Load and displacement boundary conditions. The
leaflets are assumed to be located in a cylindrical
conduit withmaterial properties of the aortic root. The
aortic side of the HV is assumed to be under a uniform
systolic pressure of 120mmHg. The pressure incre-
ment is Dpn~P1N , where P* is the maximum systolic
pressure and N is the number of increments.
(c) Finite element model specifications. The geome-
try is covered with eight-node quadrilateral non-
linear hyperelastic 3D shell elements reinforced with
3D non-linear spar elements uniformly distributed
in the circumferential direction. Grid independence
checks show a node number of 14 904 and an
element number of 10 798 are sufficient for the
present model. The element properties and the FE
model used in this study are listed in Table 5 and
Fig. 10 respectively.
3 RESULTS
The mechanical response of porcine HV in both
principal directions were compared against the
anisotropic 15 wt% PVA–0.5 wt% BC samples
(Fig. 11), which was one of the stiffest materials
for a possible match of the tensile properties for
the tissue replacement applications [28]. Although
a close match was not obtained for HV tissues
previously, both principal directions of the aniso-
tropic PVA–BC sample (75 per cent initial strain and
cycle 4) fall within the circumferential and radial
curves, around the physiological range, as seen in
Fig. 12. This hydrogel displays higher tensile stress
than HV at low strains (less than 20 per cent), with
Fig. 10 The FE model of the PVA–BC heart valve in (a) an isometric view and (b) a top viewincluding the leaflets, stent, and sewing ring
Table 5 Specifications of the elements for the BC–PVAheart valve with the criteria for an aspect ratioless than 5, a warp angle less than 7, a skewangle (for 95 per cent of elements) less than30, and a taper (for 95 per cent of elements)greater than 0.8
Test Worst case (total failed) Location
Aspect Maximum, 4.141(0) StentWarp Maximum, 9.151(2) StentSkew Maximum, 62.373(324) StentTaper Minimum, 0.542(326) Stent
Fig. 11 Comparison of anisotropy of porcine heartvalve (both directions) and 15 wt% PVA–0.5wt% BC nanocomposite with 75 per centinitial strain (cycle 4). Longitudinal and per-pendicular directions in the PVA–BC nano-composite correspond to the circumferentialand radial directions in the porcine leaflettissue respectively. The physiological range ofstrain is between 20 per cent and 30 per cent
Design and simulation of a PVA–BC heart valve prosthesis 705
JEIM493 F IMechE 2009 Proc. IMechE Vol. 223 Part H: J. Engineering in Medicine
at UNIV OF WESTERN ONTARIO on January 28, 2016pih.sagepub.comDownloaded from
the circumferential HV samples drastically increas-
ing their modulus at larger strains (greater than 20
per cent), surpassing that of any PVA–BC hydrogel
tested. This high-stiffness anisotropic PVA–BC nano-
composite would be a better match for the aniso-
tropic behaviour of HV than any isotropic biomat-
erials.
Based on the geometry and the FE model devel-
oped, calculations were performed to assess the
distribution and magnitude of mechanical stresses
and bending moment on the HV leaflet. In addition,
valve dynamics were examined as a function of the
cardiac cycle.
3.1 Valve thickness
The thickness of the heart valve leaflet is not uniform
and varies over a range from 0.1mm to 1.4mm [15].
In the current design, it is assumed that the leaf-
lets are of uniform thickness. The criteria used to
determine the thickness of the leaflet are based on
the critical values of principal stresses and bending
moments reported for the porcine aortic heart valve
by Li et al. [15]. Using those criteria, it was found that
the thickness of 0.7mm provides the closest match by
performing a parametric study on the leaflet with a
thickness starting from 0.1mm to 1.1mm.
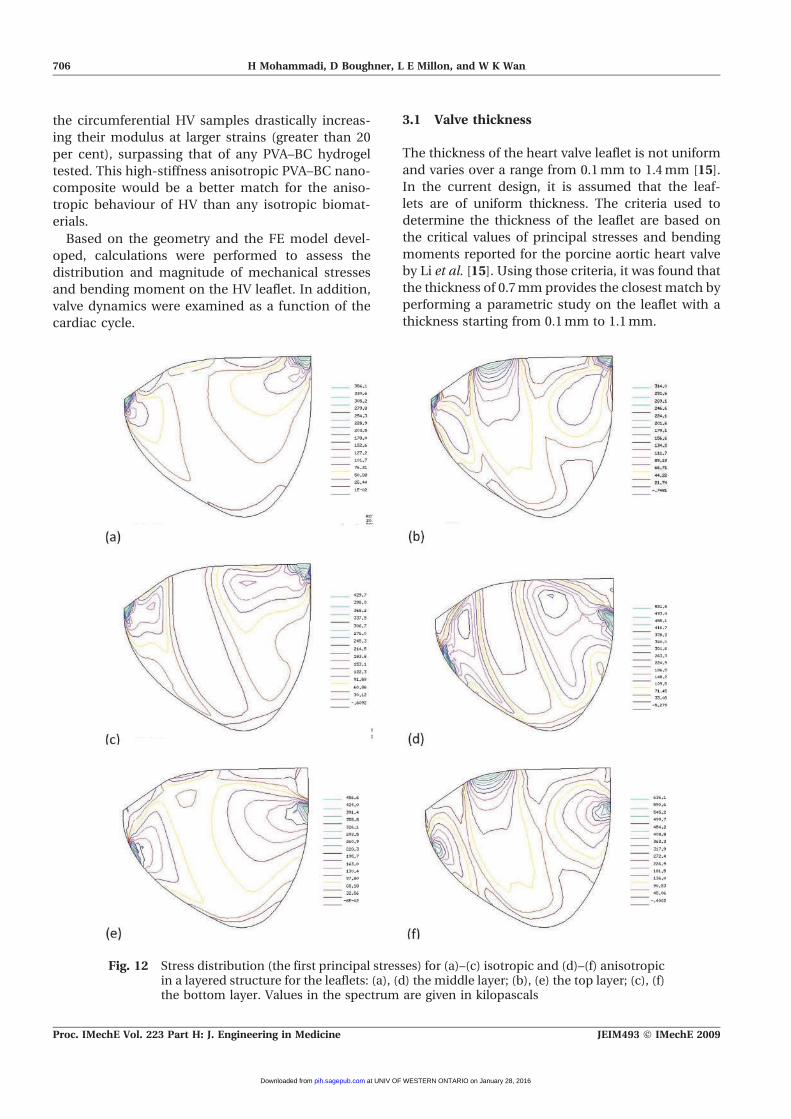
Fig. 12 Stress distribution (the first principal stresses) for (a)–(c) isotropic and (d)–(f) anisotropicin a layered structure for the leaflets: (a), (d) the middle layer; (b), (e) the top layer; (c), (f)the bottom layer. Values in the spectrum are given in kilopascals
706 H Mohammadi, D Boughner, L E Millon, and W K Wan
Proc. IMechE Vol. 223 Part H: J. Engineering in Medicine JEIM493 F IMechE 2009
at UNIV OF WESTERN ONTARIO on January 28, 2016pih.sagepub.comDownloaded from

3.2 Distribution of principal stresses on theleaflet
The stress distribution and maximum principal
stresses on leaflets are shown in Fig. 12 for the
isotropic and anisotropic models. In the isotropic
model, the maximum principal stress is located at
the corners of the leaflets where free and commis-
sure edges intersect. If the leaflet is assumed to be a
layer structure including top, middle, and bottom
layers as is the case for aortic HV leaflet tissue, the
maximum principal stresses in these layers for the
isotropic model will be 314 kPa, 356 kPa, and 429 kPa
(Figs 12(a), (b), and (c) respectively).
In the anisotropic model, locations of high
stress zones and the maximum stress values are
significantly different (Figs 12(d), (e), and (f)). The
maximum principal stresses are 636 kPa, 486 kPa,
and 531 kPa in a layered structure. It can be seen
that, although the maximum principal stresses for
the layered structure are similar in both models,
there are significant differences in the locations
of these stress distributions on the HV leaflets
composed of PVA–BC nanocomposite. Li et al.
[15] reported similar locations and values for
high-stress regions in porcine HV leaflets using
an anisotropic model. These results further re-
Fig. 13 The correspondence between (a) the maximum or minimum principal stress and (b) thehighest or lowest collagen fibre content [29]. The values in the colour bar are inkilopascals
Fig. 14 The distribution of the tensile bending moment per unit length on leaflets (a) when thevalve is fully closed and (b) when the valve is widely open. The values are given inmillinewtons
Design and simulation of a PVA–BC heart valve prosthesis 707
JEIM493 F IMechE 2009 Proc. IMechE Vol. 223 Part H: J. Engineering in Medicine
at UNIV OF WESTERN ONTARIO on January 28, 2016pih.sagepub.comDownloaded from

inforce the validities of the present anisotropic
FE model.
As the first attempt in the study of mechanical
behaviour of HVs under physiological conditions,
also the results of the locations of the high-stress
zones in the present anisotropic model and the
organization of collagen fibres in terms of their
distribution and concentration in the porcine HV
leaflet were compared. Since collagens are a load-
bearing matrix protein, its fibres are used to
strengthen the leaflet structure. It would be expected
that regions that experience high stresses would be
reinforced with high concentration of collagen
fibres. As seen in Fig. 13, there is a close correspon-
dence between the high–low-stress zone simulated
in our model shown in Fig. 13 and the distribution of
collagen fibres in the porcine aortic HV leaflet. In
contrast with the anisotropic model, the result for
the isotropic model shown in Figs 12(a), (b), and
(c) indicate that the maximum principal stress
regions do not correspond to the regions of high
collagen fibre densities (Fig. 13(b)).
3.3 Bending moment
In the anisotropic model, the effective bending
moment per unit length is computed from the
Cauchy stress tensor in the top and bottom layers
of the leaflets in the opening (Fig. 14(a)) and closing
(Fig. 14(b)) phases. For the closing phase, the crucial
zone is located under contact areas with the
maximum value of 4.89mNmm/mm. In the open-
ing phase, the maximum bending moment is
7.54mNmm/mm located close to the commissure
edge on the midline. The distributions of the bend-
ing moment calculated for the closing phase are in
agreement with those of the Li et al. [15] model (less
than 8 per cent error). It is also consistent with
collagen fibre distributions in an aortic HV leaflet
shown in Fig. 13(b).
Fig. 15 The valve motion during the closing and opening phases: (a) when the valve is fullyclosed and the contact area has its maximum value; (b) when the contact area is stilldeveloping and the small orifice area in the middle of the valve is becoming smallerowing to the deformation of the leaflets; (c) the initial situation; (d)–(f) the openingphase when the structure of the leaflets becomes geometrically unstable
708 H Mohammadi, D Boughner, L E Millon, and W K Wan
Proc. IMechE Vol. 223 Part H: J. Engineering in Medicine JEIM493 F IMechE 2009
at UNIV OF WESTERN ONTARIO on January 28, 2016pih.sagepub.comDownloaded from

3.4 Valve dynamics
Figure 15 indicates the dynamic valve motion during
systole and diastole in the anisotropic PVA–BC model.
The contact area, the deformation of HV, and the
geometry of the leaflets were simulated in the opening
and closing phases. Figure 15(a) is when the valve is
fully closed and the contact area is at its maximum
value. Figure 15(b) is when the contact area is still
developing and the small orifice area in the middle of
the valve becomes closed owing to deformation of the
leaflets. Figure 15(c) indicates the initial state of the
cardiac cycle. Figures 15(d), (e), and (f) show the
progressive stages of the opening phase when the leaf-
lets undergo large displacement and become geo-
metrically unstable, e.g. buckling. Simulation of the
stages in the opening phase has also been validated
with the ultrasound images of the aortic HV. The initial
state of the valve when the HV leaflets start to open is
shown in Fig. 16(a). The formation of a boomerang
shape of the free edges in the beginning of the opening
phase is shown in Fig. 16(b). The formation of the
triangular shape and the hexagonal shape of free edges
are also shown in Figs 16(c) and (d) respectively.
The FE model developed on the basis of the
anisotropic PVA–BC material simulates the proper
distribution and location of principal stresses and
bending moments that correspond well to the
collagen fibres distribution in the porcine aortic
valve leaflet tissue. Moreover, it also predicts the
close performance of an anisotropic PVA–BC-based
trileaflet mechanical aortic valve to that of the native
aortic HV. This model would be valuable for the
design of trileaflet mechanical HVs based on hyper-
elastic and anisotropic material.
4 CONCLUSION
A trileaflet mechanical HV based on the PVA–BC
nanocomposite material has been designed. A new
hybrid element which is a combination of hyper-
elastic non-linear isotropic elements and 3D mem-
brane spar elements has been developed to analyse a
trileaflet PVA–BC nanocomposite mechanical HV
prosthesis mechanically. The new PVA–BC nano-
composite material was designed to possess similar
mechanical properties to the porcine HV leaflet. The
stress pattern, maximum principal stresses, Cauchy
stress tensor, and distribution of bending moments
in the closing and opening phases have been
calculated. Contact between the adjacent leaflets,
the orifice area located in the middle of the valve at
each step, the geometrical instability in the opening
phase, and the minimum thickness of the leaflets for
the PVA–BC mechanical HV were computed for use
in improving the design of mechanical HVs.
Fig. 16 The comparison of the FEM results and the ultrasound images in support of thesimulation in the opening phase: (a) the initial state of opening phase; (b) theboomerang shape of the free edges at the beginning of the opening phase; (c) thetriangular shape of the free edges; (d) the hexagonal shape of the free edges whichclosely match the ultrasound images
Design and simulation of a PVA–BC heart valve prosthesis 709
JEIM493 F IMechE 2009 Proc. IMechE Vol. 223 Part H: J. Engineering in Medicine
at UNIV OF WESTERN ONTARIO on January 28, 2016pih.sagepub.comDownloaded from

The results indicate a significant difference be-
tween the mechanical behaviours of the isotropic
and the anisotropic models. The anisotropic model
is consistent with the actual porcine aortic HV and
accurately predicts the distribution of collagen fibres
in the HV leaflet tissue. Li et al. [15] reported that the
maximum bending moment is located under the
contact area in the closing phase and Burriesci et al.
[14] reported that the high bending moment area is
near the commissure edge in the opening phase.
These data in the literature further validate the
present results.
In the design and modelling of the anisotropic
PVA–BC nanocomposite-based trileaflet mechanical
HV, the material parameters input was limited to
two, namely the elastic moduli of the composite in
two orthogonal directions. This limitation arose
because only uniaxial tensile testing was performed,
as a biaxial testing facility is not available in the
present authors’ laboratory. Improvements can be
made by obtaining a full set of the necessary
material properties parameters including the shear
modulus and Poisson’s ratios. However, biaxial
testing on the composite material will be required.
Future work should consider the acquisition of these
parameters as they are relevant not only to mechan-
ical HV design but also to other soft tissue-related
devices and in tissue engineering.
ACKNOWLEDGEMENTS
The authors thank the Integrated ManufacturingTechnology Institute and the Virtual EnvironmentTechnology Centre for providing technical supportsand facilities to achieve this project. The authors alsothank the Canadian Institutes of Health Research forfunding this project.
REFERENCES
1 Mackay, T. G., Wheatley, D. J., Bernacca, G. M.,Fisher, A. C., and Hindle, C. S. New polyurethaneheart valve prosthesis: design, manufacture andevaluation. Biomaterials, 1996, 17, 1857–1863.
2 Nistal, F., Garcia-Martinez, V., Arbe, E., Fernan-dez, D., Artinano, E., Mazorra, F., and Gallo, I. Invivo experimental assessment of polytetrafluor-oethylene trileaflet heart valve prosthesis. J. Thor-acic Cardiovascular Surg., 1990, 99, 1047–1081.
3 Knierbin, B., Rosarius, N., Unger, A., Reul, H., andRau, G. CAD design, stress analysis and in vitroevaluation of three leaflet blood-pump valves. J.Biomed. Engng, 1992, 14, 275–286.
4 Wijsmuller, E. G., Yu, L. S., Yuan, B., Bishop, N.D., and Kolff, W. J. Development of a new inflowvalve for a 20 cc semisoft ventricle: preliminaryresults. Int. J. Artif. Organs, 1990, 13, 503–508.
5 Mohammadi, H., Klassen, R. J., and Wan, W. K. Afinite element model on effects of impact load andcavitation on fatigue crack propagation in mechan-ical bileaflet aortic heart valve. Proc. IMechE, PartH: J. Engineering in Medicine, 2008, 222(7), 1115–1125. DOI: 10.1243/09544119JEIM432.
6 Gould, P. L., Cataloglu, A., Dhatt, G., Chattopad-hyay, A., and Clark, R. Stress analysis of the humanaortic valve, computers and structures. Comput.Structs, 1973, 3, 377–384.
7 Krucinski, S., Vesely, I., and Dokanish, M. A.Numerical simulation of leaflet flexure in biopros-thetic valve mounted on rigid and expansiblesterns. J. Biomech., 1993, 26, 929–943.
8 Patterson, E. A., Howard, I. C., and Thornton, M.A. A comparative study of linear and nonlinearsimulations of the leaflets in a bioprosthetic heartvalve during the cardiac cycle. J. Med. EngngTechnol., 1996, 20, 95–108.
9 Grande, K. J., Cochran, R. P., and Reinhall, P. G.Finite element analysis of aortic heart valve spar-ing: influence of graft shape and stiffness. IEEETrans. Biomed. Engng, 2001, 48, 647–654.
10 Beck, A., Thubrikar, M. J., and Robicsek, F. Stressanalysis of the aortic valve with and without sinusesof valvular. J. Heart Valve Dis., 2001, 10, 1–11.
11 Mohammadi, H., Ahmadian, M. T., and Wan, W.K. Time-dependent analysis of leaflets in mechan-ical aortic bileaflet valve in closing phase using thefinite strip method. J. Med. Engng Phys., 2006, 28,122–133.
12 Rousseau, E. P. M., Sauren, A. A. H. J., and Hout,M. C. V. Elastic and viscoplastic material behaviourof fresh and glutaraldehyde-treated porcine aorticvalve tissue. J. Biomech., 1983, 16, 339–348.
13 Sripathi, V. C., Kumar, R. K., and Balakrishnam,K. R. Further insights into normal aortic heart valvefunctions; rule of compliant aortic root on leafletopening and valve orifice area. Ann. Thoracic Surg.,2004, 77, 844–851.
14 Burriesci, G., Haward, I. C., and Patterson, E. A.The stress/strain and fatigue behaviour of glutar-aldehyde preserved heart valve tissue. J. Biomech.,1999, 10, 707–724.
15 Li, J., Lou, X. Y., and Kuang, Z. B. A nonlinearanisotropic model for porcine heart valves. J.Biomech., 2001, 34, 1279–1289.
16 Luo, X. Y., Li, W. G., and Li, J. Geometrical stressreduction factors in anisotropic porcine heartvalves. Trans. ASME, J. Biomech. Engng, 2003, 125,735–744.
17 De Hart, J., Peters, G. W. M., Schreurs, P. G. J., andBaaijens, F. P. T. Collagen fibers reduce stressesand stabilize motion of aortic valve leaflets duringsystole. J. Biomech., 2004, 37, 303–311.
18 Kim, H., Jia, L., Sacks, M. S., and Chandran, C. B.Dynamic simulation precardial bioprosthetic valve
710 H Mohammadi, D Boughner, L E Millon, and W K Wan
Proc. IMechE Vol. 223 Part H: J. Engineering in Medicine JEIM493 F IMechE 2009
at UNIV OF WESTERN ONTARIO on January 28, 2016pih.sagepub.comDownloaded from

function. Trans. ASME, J. Biomech. Engng, 2006,128, 717–727.
19 Millon, L. E., Mohammadi, H., and Wan, W. K.Anisotropic polyvinyl alcohol for cardiovascularapplications. J. Biomed. Mater. Res. B; Appl. Bio-mater., 2006, 79, 305–311.
20 Millon, L. E. and Wan, W. K. The polyvinyl alcohol– bacterial cellulose as a new nanocomposite forbiomedical applications. J. Biomed. Mater. Res. B;Appl. Biomater., 2006, 79, 245–253.
21 Guhados, G., Wan, W. K., and Hutter, J. Measure-ment of the elastic modulus of single bacterialcellulose fibers using atomic force microscopy.Langmuir, 2005, 21, 6642–6646.
22 Jiang, H., Campbell, G., Boughner, D., Wan, W.K., and Quantz, M. Design and manufacturing ofpolyvinyl alcohol cryogel tri-leaflet heart valveprosthesis. J. Med. Engng Phys., 2003, 24, 267–277.
23 Leat, M. E. and Fisher, J. A synthetic leaflet heartvalve with improved opening characteristics. Med.Engng Phys., 1994, 16, 470–476.
24 Mercer, J. I., Benedicty, M., and Bahnson, H. T.The geometry and construction of the aortic
leaflet. J. Thoracic Cardiovascular Surg., 1973, 65,511–518.
25 Gerald, F. Curves and surfaces for computer aidedgeometric design: a practical guide, 1993 (AcademicPress, New York).
26 Yoganathan, A. P., Eberhardt, C., and Walker, P.G. Hydrodynamic performance of the MedtronicFreestyle aortic root bioprosthesis. J. Heart ValveDis., 1994, 3, 571–580.
27 Keiser, R., Muller, M., Heidelberger, B., Teschner,M., and Gross, M. Contact handling for deformablepoint-based objects. In Proceedings of Vision,Modelling, Visualization (VMV’04), Stanford, USA,2004, pp. 315–322.
28 He, Z., Xi, B., Zhu, K., and Hwang, N. H. C.Mechanisms of mechanical heart valve cavitation:investigation using a tilting disk valve model. J.Heart Valve Dis., 2001, 10, 666–674.
29 The Heart Valve Lab, The University of WesternOntario, What does a real heart look like? Dissect-ing a porcine (pig) heart (continued), 1997, avail-able from http://heartlab.robarts.ca/dissect/dissection2.html.
Design and simulation of a PVA–BC heart valve prosthesis 711
JEIM493 F IMechE 2009 Proc. IMechE Vol. 223 Part H: J. Engineering in Medicine
at UNIV OF WESTERN ONTARIO on January 28, 2016pih.sagepub.comDownloaded from