6.4 vessel transportation - millennium bulk terminals · 6.4 vessel transportation ......
TRANSCRIPT

U.S. Army Corps of Engineers Chapter 6. Operations:
Affected Environment and Project Impacts
Millennium Bulk Terminals—Longview Draft NEPA Environmental Impact Statement
6.4-1 September 2016
6.4 Vessel Transportation This section describes vessel transportation and safety in the study area, and potential impacts on
vessel transportation from construction and operation of the proposed export terminal.
6.4.1 Regulatory Setting
Conventions, regulations, statutes, and guidelines relevant to vessel transportation are summarized
in Table 6.4-1.
Table 6.4-1. Conventions, Regulations, Statutes, and Guidelines for Vessel Transportation
Convention, Regulation, Statute, Guideline Description
International
International Convention for the Safety of Life at Seas
Required safety standards for international ships for construction, navigation, life-saving, communications, and fire equipment. Also referred to as SOLAS.
International Convention for the Prevention of Pollution from Ships (MARPOL 73/78)
International convention covering prevention of pollution of the marine environment by ships from operational or accidental causes.
International Ship and Port Facility Security Code
Security-related requirements for governments, port authorities, and shipping companies.
International Maritime Solid Bulk Cargoes Code
Procedures for bulk cargo carriers.
International Regulations for Preventing Collisions at Sea, 1972
Rules on safe navigation for vessels in international waters. Also referred to as 72 COLREGS.
Standards of Training, Certification, and Watchkeeping 1978 revised in 1995 and 2010
Standards for training, certification, and watchkeeping requirements for seafarers.
Federal
Inland Navigational Rules Act of 1980 (Public Law 96-591) known as “Rules of the Road” (33 CFR 84-90)
Navigation rules for U.S. waters.
46 USC (Shipping) Chapter 33 (Inspection) Consolidates the laws governing the inspection and certification of vessels by the U.S. Coast Guard.
Ports and Waterways Safety Act of 1972
(33 USC 1221 et seq.)
Provides for the protection and “safe use” of a U.S. port (includes the marine environment, the navigation channel, and structures in, on, or immediately adjacent to the navigable waters) and for the protection against the degradation of the marine environment.
Maritime Transportation Security Act of 2002 (46 USC 701). Relevant regulations are 33 CFR 101 and 105.
Requirements for maritime security.

U.S. Army Corps of Engineers
Chapter 6. Operations: Affected Environment and Project Impacts
Millennium Bulk Terminals—Longview Draft NEPA Environmental Impact Statement
6.4-2 September 2016
Convention, Regulation, Statute, Guideline Description
Maritime Transportation Act of 2004. Amended 311(a) and (j) of the Federal Water Pollution Control Act. Relevant regulations are 33 CFR 151, 155, and 160.
Requires cargo vessel owners or operators to prepare and submit oil discharge response plans.
Federal Water Pollution Control Act, as amended by Section 4202 of the Oil and Pollution Act of 1990 (33 USC 1321). Relevant regulations are the National Oil and Hazardous Substances Pollution Contingency Plan (40 CFR 300) and 33 CFR 155.5010–5075.
Requires non-tank vessels to prepare and submit oil or hazardous substance discharge response plans when operating on the navigable waters of the United States.
The Act to Prevent Pollution from Ships (33 USC 1901 et. seq.)
Implementing U.S. legislation for MARPOL and Annexes I and II.
Maritime Transportation Act of 2004; and the Coast Guard and Maritime Transportation Act of 2006
Requires cargo vessel owners or operators to prepare and submit oil or hazardous substance discharge response plans.
33 CFR 80-82 International Navigation Rules
33 CFR, 46 CFR, and 49 CFR These regulations incorporate international laws to which the United States is signatory as well as various classification society and industry technical standards governing the inspection, control, and pollution prevention requirements for vessels.
Washington State
Washington State Bunkering Operations (WAC 317-40) (RCW 88.46.170)
Establishes minimum standards for safe bunkering (transfer of fuel to a vessel) operations.
Washington State Oil Spill Contingency Plan Requirements (WAC 173-182) (RCW 88.46, 90.56, and 90.48)
Requires cargo vessels 300 or more gross tons be covered by a contingency plan for the containment and cleanup of oil.
Washington State Vessel Oil Transfer Advance Notice and Containment Requirements (WAC 173-184)
Requires facility or vessel operators who transfer oil to provide the state with a 24-hour advance notice of transfer.
Washington State Cargo Vessel Boarding and Inspection (WAC 317-31)
Cargo vessels 300 or more gross tons shall submit a notice of entry at least 24 hours before the vessel enters state waters and be subject to boarding and inspection by state inspectors to ensure compliance with accepted industry standards.
Oregon State
OAR 856-010-0003 through 0060 and 856-030-0000 through 0045 (Statutory Authority: ORS Title 58 Chapter 776).
Oregon State Board of Maritime Pilots Rules for pilotage of vessels in Oregon state waters, including the Columbia River.
Local
There are no local laws and regulations relevant to vessel transportation.
Notes: SOLAS = International Convention for the Safety of Life at Seas; COLREGS = International Regulations for Proventing Collisions at Sea; MARPOL = International Convention for the Prevention of Pollution from Ship; STCW = Standards of Training, Certification, and Watchkeeping; USC = United States Code; CFR = Code of Federal Regulations; WAC = Washington Administrative Code; OAR = Oregon Administrative Rule; ORS = Oregon Revised Statute

U.S. Army Corps of Engineers
Chapter 6. Operations: Affected Environment and Project Impacts
Millennium Bulk Terminals—Longview Draft NEPA Environmental Impact Statement
6.4-3 September 2016
6.4.2 Study Area
The study areas for vessel transportation are the same for both the On-Site Alternative and Off-Site
Alternative. The study area for direct impacts is the area surrounding the proposed docks where
vessel maneuvering and loading would occur. The study area for indirect impacts includes the
waterways used by, or that could be affected by vessels calling at the project areas. It includes the
lower Columbia River from the mouth of the river upstream to Vancouver, Washington,1 and the
Willamette River upriver to the Port of Portland. These study areas are consistent with the Corps’
NEPA scope of analysis Memorandum for Record (February 14, 2014), adjusted to reflect specific
conditions near the project areas.
6.4.3 Methods
This section describes the sources of information and methods used to evaluate the potential
impacts of construction and operation of the proposed export terminal.
6.4.3.1 Information Sources
The following sources of information were used to identify the potential impacts of the terminal on
vessel transportation in the study areas. Information for the vessel traffic analysis was also obtained
from stakeholder interviews.
Detailed vessel traffic data from the Columbia River Bar Pilots (Bar Pilots) included in
information provided by the Applicant (URS Corporation 2014) was validated during a meeting
with the Bar Pilots. This information and other data obtained from the pilots are the basis for
historical vessel traffic type and volumes. Washington State Department of Ecology (Ecology)
Vessel Entries and Transits (VEAT) data were used for comparison with the Bar Pilot data.
The Columbia River Pilots (River Pilots) representatives provided information on vessel traffic
management within the Columbia River and vessel docking issues for the existing dock (Dock 1)
at the project area for the On-Site Alternative.
Merchants Exchange of Portland, Oregon (PDXMEX), provided Automatic Identification System
(AIS) data and a synopsis of its operations.
Port of Portland provided information on the LOADMAX channel reporting and forecasting
system.
Coast Pilot 7 (Pacific Coast: California, Oregon, Washington, Hawaii, and Pacific Islands) (National
Oceanic and Atmospheric Administration 2014) and the Lower Columbia Region Harbor Safety
Plan (Lower Columbia Region Harbor Safety Committee 2013) provided information on the
vessel transportation characteristics of the study area.
The following data were used as part of the risk analysis.
AIS data to establish baseline (2014) vessel types, sizes, routes, and transit frequencies between
the Columbia River mouth and Longview.
1 For purposes of this EIS, the lower Columbia River ends at the landward limit of the Territorial Sea, which is a line drawn between the seaward tips of the North Jetty and South Jetty. The Port of Vancouver is the furthest upriver port receiving large commercial vessels.
U.S. Army Corps of Engineers
Chapter 6. Operations: Affected Environment and Project Impacts
Millennium Bulk Terminals—Longview Draft NEPA Environmental Impact Statement
6.4-4 September 2016
Historical data on vessel incidents and severity, based on the U.S. Coast Guard (USCG) Marine
Information for Safety and Law Enforcement (MISLE) database for 2001 to 2014.
Data on reported oil spills within the Columbia and Willamette Rivers from the following three
databases for the period between January 1, 2004, and December 31, 20142: USCG MISLE
database, Ecology’s Environmental Report Tracking System (ERTS) database, which records all
incidents reported to the state, and Ecology’s Spills Program Incident Information (SPIIS)
database, which records spills reported to the state.
6.4.3.2 Impact Analysis
The following methods were used to evaluate the potential impacts of the On-Site Alternative, Off-
Site Alternative, and No-Action Alternative on vessel transportation.
The vessel transportation route, navigational considerations, historical and current vessel traffic
patterns, and the systems in place to monitor and control vessel traffic along the route were
described based on information gathered through the sources described in Section 6.4.3.1,
Information Sources.
Construction-related impacts were qualitatively assessed based on the relative increase in
activity in and around the project areas and the potential to disturb ongoing vessel
transportation.
Operations-related impacts at the project areas (direct impacts) were qualitatively evaluated in
terms of the increased potential for vessel-related incidents to occur.
Operations-related impacts during vessel transit (indirect impacts) were evaluated both
qualitatively and quantitatively to determine the potential for increased risks. Historical vessel
incident data were evaluated to characterize the nature and magnitude of vessel incidents on
the Columbia River to the project areas. This information was used to provide context for
interpreting operational impacts.
The potential for vessel incidents (i.e., allisions,3 collisions, groundings, and fire/explosions by
project-related vessels during transit) was modeled for existing conditions, the On-Site
Alternative, Off-Site Alternative, and No-Action Alternative. The potential for allisions during
transit was qualitatively assessed.
The incident frequencies were estimated using the Marine Accident Risk Calculation System
(MARCS) model and were limited to the area evaluated in the study (DNV GL 2016).
The number of trips for non-project-related vessels were derived from 2014 AIS data for all
vessel types. An increase of 1% per year was applied to the 2014 AIS data through 2028 for
the No-Action Alternative. The number of vessels with the proposed export terminal was
added to this total to determine the incremental increase in the likelihood of the modeled
incidents occurring.
To provide context for understanding the relative consequences of a collision, grounding or
allision incident, a survey of USCG Marine Information for Safety and Law Enforcement (MISLE)
2 When the information from these three datasets were combined all duplicate entries were removed and only incidents with actual reported spills of petroleum or petroleum products were considered in the development of the baseline oil spill frequency for the study area. 3 An allision occurs when a vessel strikes a fixed structure, such as a dock or a vessel at berth.

U.S. Army Corps of Engineers
Chapter 6. Operations: Affected Environment and Project Impacts
Millennium Bulk Terminals—Longview Draft NEPA Environmental Impact Statement
6.4-5 September 2016
database was conducted for years 2001 to 2014. This period was chosen because it covers over
99% of all reported collision, grounding, and allision incidents in the dataset. Data surveys were
conducted for the national dataset and for the study area separately to test for differences in the
distribution of incident severity between the two.
Increased risks of bunker oil spills were addressed quantitatively and qualitatively.
The potential for a bunker oil spill to occur as the result of an incident was modeled using
the Naval Architecture Package (NAPA model) (DNV GL 2016). The model estimates oil
outflow volumes based on the number of damaged cargo tanks and interaction with tidal
influences.
The potential for releases to occur during bunkering was qualitatively assessed based on the
relative increase in vessel traffic.
6.4.4 Affected Environment
This section addresses the environment in the study areas. The analysis includes the natural and
built environment, types and volumes of vessel traffic, vessel traffic management, vessel incident
frequency and severity, and incident management and response systems.
6.4.4.1 Natural and Built Environment
This section describes the marine environment and facilities and other physical features relevant to
marine navigation in the study area. Figure 6.4-1 illustrates the location of the features discussed in
this section.
Marine Environment
Conditions in the Pacific Ocean near the mouth of the Columbia River can vary greatly depending on
the time of year. Prevailing winds and seasonal patterns have the greatest effect on offshore
conditions. Longshore currents that generally flow to the north in winter and to the south in
summer also affect vessel navigation, although not as much as tidal current and river flows.
Although winds are strongest in late fall and winter, they seldom reach gale force along the
Columbia River. The strongest winds are usually out of the south or southwest. Wind flow is
generally from the east through southeast in winter. Spring and summer typically have northwest
and west wind patterns and can clash with river outflows. The volume of water flowing from the
Columbia River and the force of impact with ocean conditions can combine to create daunting sea
conditions. Fog is a hazard during late summer and fall.
Columbia River Bar
The Columbia River Bar is seaward of the mouth of the Columbia River (Figure 6.4-1). The bar is
about 3 miles wide and 6 miles long. The bar is where the energy of the river's current dissipates
into the Pacific Ocean, often as large standing waves (1 meter/3.28 feet or more) (Jordan pers.
comm. B). The waves result from the bottom contours of the bar area as well as the mixing of fresh
and saltwater and environmental conditions.
U.S. Army Corps of Engineers
Chapter 6. Operations: Affected Environment and Project Impacts
Millennium Bulk Terminals—Longview Draft NEPA Environmental Impact Statement
6.4-6 September 2016
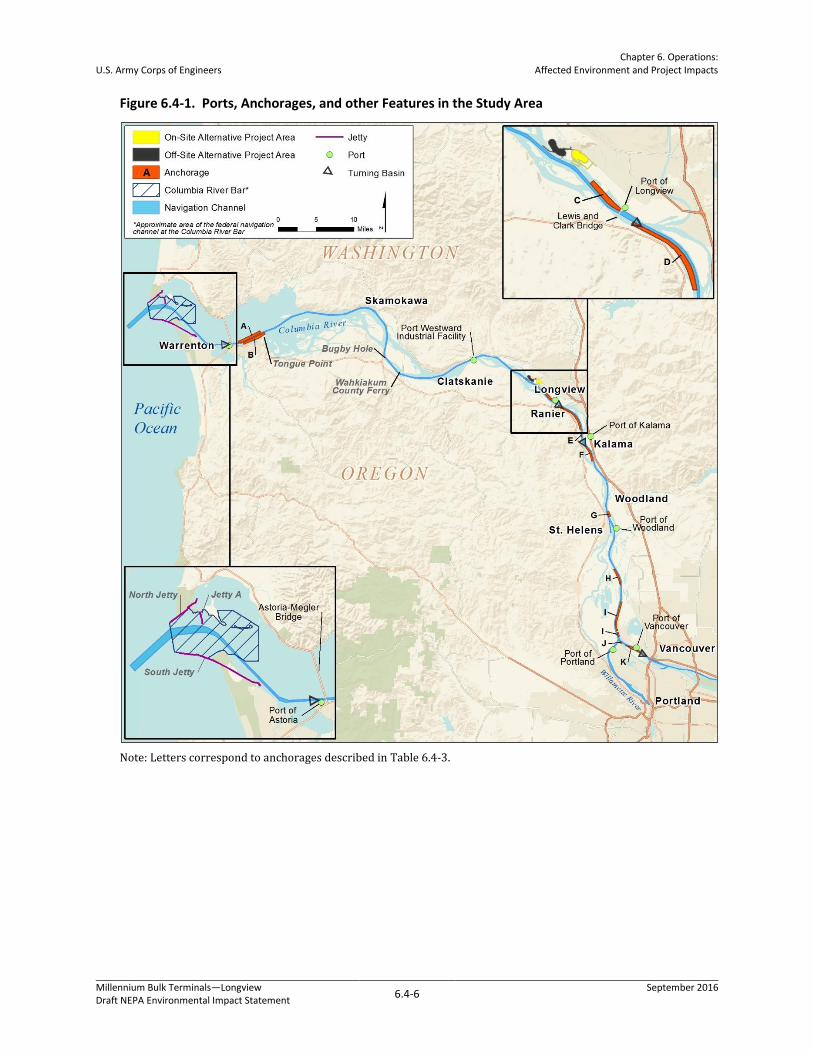
Figure 6.4-1. Ports, Anchorages, and other Features in the Study Area
Note: Letters correspond to anchorages described in Table 6.4-3.
U.S. Army Corps of Engineers
Chapter 6. Operations: Affected Environment and Project Impacts
Millennium Bulk Terminals—Longview Draft NEPA Environmental Impact Statement
6.4-7 September 2016
Tide, current, swell, and wind—direction and velocity—all affect the bar conditions. There are two
full tidal current ebb and flood cycles each day, and conditions at the bar can change drastically in a
very short time period with the tidal flow. Worst-case conditions typically occur when onshore
winds and tidal ebb combine with the river flow; when this happens, the effects can change
unpredictably in a very short time as the tidal flow cycles (National Oceanic and Atmospheric
Administration 2014).
Columbia River
The tidal range at the mouth of the Columbia River is approximately 5.6 feet with mean higher high
water measured at 7.5 feet in 2013 (National Oceanic and Atmospheric Administration 2014). At
Portland and Vancouver the tidal range is approximately 2.3 feet with mean higher high water
measured at 8.7 feet in 2013 (NOAA tides and water levels station 9440083). Typically tidal
influence reaches as far as the Portland/Vancouver area. However, tidal effects can be felt to as far
as 140 miles upriver under low-flow conditions (National Oceanic and Atmospheric Administration
2015).
Navigation Channel
The Oregon–Washington border follows the Columbia River (Figure 6.4-1). The navigation channel
in the study area includes two U.S. Army Corps of Engineers (Corps) projects: the Columbia and
Lower Willamette River Project and the Mouth of the Columbia River Project. The navigation
channel is described by the three following areas.
Mouth of the Columbia River. The portion of the channel at the mouth of the Columbia River,
referred to as the Columbia River Bar, is 6 miles long, extending 3 nautical miles4 into the Pacific
Ocean from the mouth of the river to 3 miles upriver. This segment of the channel varies from
2,000 feet wide and 55 feet deep to 640 feet wide and 48 feet deep. Waters in this area are
considered treacherous and large vessels require a licensed pilot.5 The Corps maintains three
jetties at the mouth of the Columbia River (Figure 6.4-1) to help keep the channel at the mouth
of the river clear.
Columbia River. From the upriver extent of the bar (river mile 3) to Vancouver (river mile
106.5), the channel is generally maintained to a depth 43 feet and a width of 600 feet (U.S. Army
Corps of Engineers 2015a).6
Willamette River. Along the lower 11.6 miles of the Willamette River, the channel has a depth
of 40 feet.
Traffic in the channel moves in a two-way pattern: one lane inbound and one lane outbound.
Although some areas of the navigation channel are dredged into rock, the channel sides consist
primarily of loose, unconsolidated sediment.
4 Offshore distances are recorded in terms of nautical miles and inshore distances and river distances are given in terms of statute miles. 5 Oregon Administrative Rule 856-010-0060 exempts the following vessels from compulsory pilotage on the Columbia River Bar: (a) Foreign fishing vessels not more than 100 feet or 250 gross tons international; (b) Recreational vessels not more than 100 feet long. 6 Near Vancouver, depth varies between 35 and 43 feet and width varies between 400 and 500 feet.
U.S. Army Corps of Engineers
Chapter 6. Operations: Affected Environment and Project Impacts
Millennium Bulk Terminals—Longview Draft NEPA Environmental Impact Statement
6.4-8 September 2016
Ports
Table 6.4-2 lists the ports in the study area with berthing for large vessels along with their locations
and facilities. Figure 6.4-1 shows the locations of these ports.
Table 6.4-2. Port Facilities in the Study Area
Port Location Facilities
Port of Astoria, OR RM 12 Three deep-draft berths; additional berths for small commercial fishing vessels and research vessels; two marinas and a boatyard; two anchorages
Port of St. Helens, Port Westward Industrial Facility, near Clatskanie, OR
RM 53 Port Westward Industrial facility. One dock and one deep-water berth
Port of Longview, WA RM 65 Eight marine terminals containing a total of eight berths
Port of Kalama, WA RM 75 Seven marine terminals: two grain elevators, one general cargo dock, one barge dock, one liquid bulk facility, one lumber barge berth, and one deep-draft wharf
Port of Portland, OR RM 100 Four marine terminals containing a total of 18 berths
Port of Vancouver, WA RM 106.5 Four marine terminals containing a total of 13 berths
Notes: RM = river mile
Anchorages and Turning Basins
Vessels anchor within the Columbia River system for a variety of reasons, planned (e.g., to take on
fuel, to wait for a berth) or unplanned (e.g., mechanical repairs, to wait for better weather
conditions). In anticipation of this need, USCG has designated 11 locations for vessels to anchor
(Table 6.4-3). Each location has specific characteristics with which vessel masters, crews, and pilots
must be familiar. Corps regulations establish the operational rules for the anchorages, including a
requirement that vessels desiring to anchor must contact the pilot office managing the anchorage to
request a position assignment. The Bar Pilots manage Astoria North and Astoria South anchorages.
The River Pilots manage the anchorages upriver from Astoria.
Bunkering7 operations are normally permitted in all anchorages. The Lower Vancouver and Upper
Vancouver anchorages are the only anchorage areas maintained by the Corps as part of the
Columbia River navigation channel. The other designated anchorages are at sites identified as
naturally deep locations, although shoaling does occur to some extent and dredging is occasionally
necessary.
Four turning basins are located in the study area (Figure 6.4-1). Turning basins are generally wider
areas along a channel dredged to the same depth as the channel where vessel masters and pilots
have maneuvering room to turn vessels for the purposes of pointing the bow of the vessel in the
direction of transit. Only the Longview turning basin, which is located at river mile 66.5 and
encompasses the proposed berths at the project area for the On-Site Alternative, can accommodate
Panamax-sized vessels.
7 The transfer of fuel onto a vessel.
U.S. Army Corps of Engineers
Chapter 6. Operations: Affected Environment and Project Impacts
Millennium Bulk Terminals—Longview Draft NEPA Environmental Impact Statement
6.4-9 September 2016
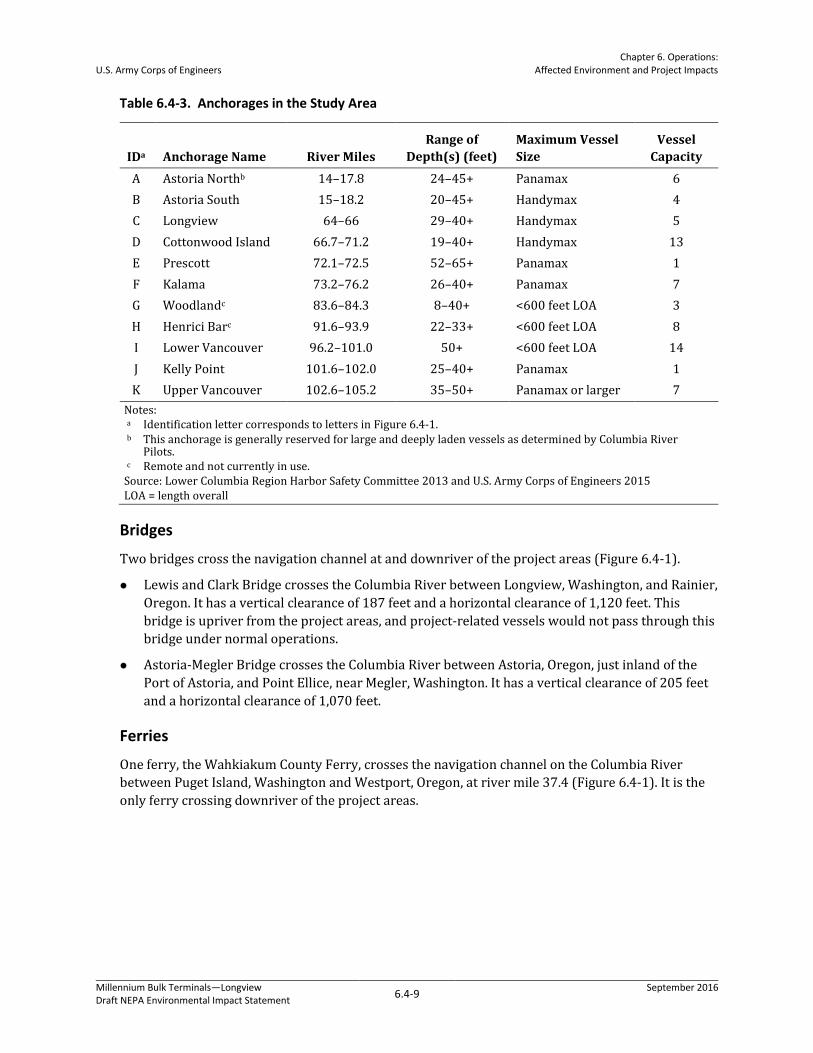
Table 6.4-3. Anchorages in the Study Area
IDa Anchorage Name River Miles
Range of
Depth(s) (feet)
Maximum Vessel
Size
Vessel
Capacity
A Astoria Northb 14–17.8 24–45+ Panamax 6
B Astoria South 15–18.2 20–45+ Handymax 4
C Longview 64–66 29–40+ Handymax 5
D Cottonwood Island 66.7–71.2 19–40+ Handymax 13
E Prescott 72.1–72.5 52–65+ Panamax 1
F Kalama 73.2–76.2 26–40+ Panamax 7
G Woodlandc 83.6–84.3 8–40+ <600 feet LOA 3
H Henrici Barc 91.6–93.9 22–33+ <600 feet LOA 8
I Lower Vancouver 96.2–101.0 50+ <600 feet LOA 14
J Kelly Point 101.6–102.0 25–40+ Panamax 1
K Upper Vancouver 102.6–105.2 35–50+ Panamax or larger 7
Notes: a Identification letter corresponds to letters in Figure 6.4-1. b This anchorage is generally reserved for large and deeply laden vessels as determined by Columbia River
Pilots. c Remote and not currently in use.
Source: Lower Columbia Region Harbor Safety Committee 2013 and U.S. Army Corps of Engineers 2015 LOA = length overall
Bridges
Two bridges cross the navigation channel at and downriver of the project areas (Figure 6.4-1).
Lewis and Clark Bridge crosses the Columbia River between Longview, Washington, and Rainier,
Oregon. It has a vertical clearance of 187 feet and a horizontal clearance of 1,120 feet. This
bridge is upriver from the project areas, and project-related vessels would not pass through this
bridge under normal operations.
Astoria-Megler Bridge crosses the Columbia River between Astoria, Oregon, just inland of the
Port of Astoria, and Point Ellice, near Megler, Washington. It has a vertical clearance of 205 feet
and a horizontal clearance of 1,070 feet.
Ferries
One ferry, the Wahkiakum County Ferry, crosses the navigation channel on the Columbia River
between Puget Island, Washington and Westport, Oregon, at river mile 37.4 (Figure 6.4-1). It is the
only ferry crossing downriver of the project areas.
U.S. Army Corps of Engineers
Chapter 6. Operations: Affected Environment and Project Impacts
Millennium Bulk Terminals—Longview Draft NEPA Environmental Impact Statement
6.4-10 September 2016
6.4.4.2 Vessel Traffic
Vessels transiting the lower Columbia River include commercial cargo, fishing, and passenger
vessels; recreational vessels; and service vessels (including tugs, pilot boats, and USCG vessels), as
well as a small number of other vessels such as military ships, research vessels, and industrial
construction vessels. The cargo vessels and large passenger vessels (cruise ships) are generally
restricted to the navigation channel and maintain a predictable two-way traffic pattern (one lane
inbound and one lane outbound). For the purposes of this EIS, cargo vessels (ships and barges) and
cruise ships are referred to as large commercial vessels. The other vessels are generally not
restricted to movement in the navigation channel. For the most part, these vessels are more agile
and less predictable in their movements. Data sources and availability regarding these two broad
categories of vessels differ. For these reasons, the following discussion of vessel traffic has been
separated into two sections: Large Commercial Vessels and Other Vessels.
Large Commercial Vessels
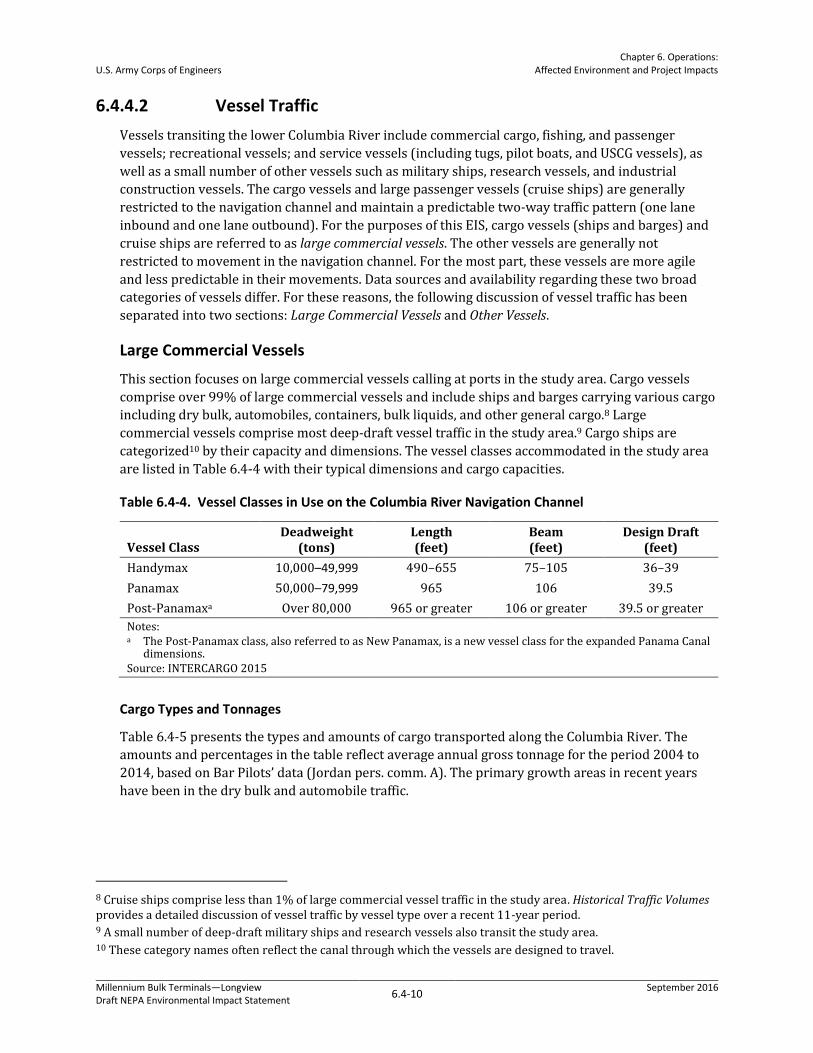
This section focuses on large commercial vessels calling at ports in the study area. Cargo vessels
comprise over 99% of large commercial vessels and include ships and barges carrying various cargo
including dry bulk, automobiles, containers, bulk liquids, and other general cargo.8 Large
commercial vessels comprise most deep-draft vessel traffic in the study area.9 Cargo ships are
categorized10 by their capacity and dimensions. The vessel classes accommodated in the study area
are listed in Table 6.4-4 with their typical dimensions and cargo capacities.
Table 6.4-4. Vessel Classes in Use on the Columbia River Navigation Channel
Vessel Class Deadweight
(tons) Length (feet)
Beam (feet)
Design Draft
(feet)
Handymax 10,000–49,999 490–655 75–105 36–39
Panamax 50,000–79,999 965 106 39.5
Post-Panamaxa Over 80,000 965 or greater 106 or greater 39.5 or greater
Notes: a The Post-Panamax class, also referred to as New Panamax, is a new vessel class for the expanded Panama Canal
dimensions. Source: INTERCARGO 2015
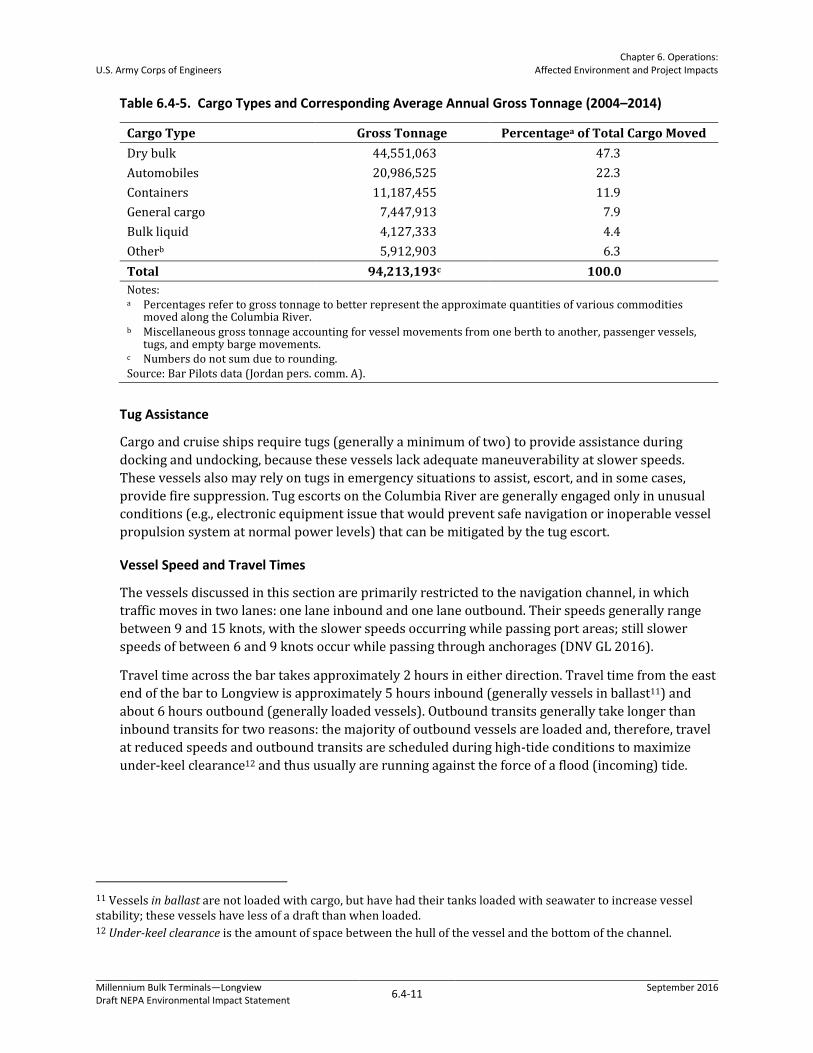
Cargo Types and Tonnages
Table 6.4-5 presents the types and amounts of cargo transported along the Columbia River. The
amounts and percentages in the table reflect average annual gross tonnage for the period 2004 to
2014, based on Bar Pilots’ data (Jordan pers. comm. A). The primary growth areas in recent years
have been in the dry bulk and automobile traffic.
8 Cruise ships comprise less than 1% of large commercial vessel traffic in the study area. Historical Traffic Volumes provides a detailed discussion of vessel traffic by vessel type over a recent 11-year period. 9 A small number of deep-draft military ships and research vessels also transit the study area. 10 These category names often reflect the canal through which the vessels are designed to travel.
U.S. Army Corps of Engineers
Chapter 6. Operations: Affected Environment and Project Impacts
Millennium Bulk Terminals—Longview Draft NEPA Environmental Impact Statement
6.4-11 September 2016
Table 6.4-5. Cargo Types and Corresponding Average Annual Gross Tonnage (2004–2014)
Cargo Type Gross Tonnage Percentagea of Total Cargo Moved
Dry bulk 44,551,063 47.3
Automobiles 20,986,525 22.3
Containers 11,187,455 11.9
General cargo 7,447,913 7.9
Bulk liquid 4,127,333 4.4
Otherb 5,912,903 6.3
Total 94,213,193c 100.0
Notes: a Percentages refer to gross tonnage to better represent the approximate quantities of various commodities
moved along the Columbia River. b Miscellaneous gross tonnage accounting for vessel movements from one berth to another, passenger vessels,
tugs, and empty barge movements. c Numbers do not sum due to rounding. Source: Bar Pilots data (Jordan pers. comm. A).
Tug Assistance
Cargo and cruise ships require tugs (generally a minimum of two) to provide assistance during
docking and undocking, because these vessels lack adequate maneuverability at slower speeds.
These vessels also may rely on tugs in emergency situations to assist, escort, and in some cases,
provide fire suppression. Tug escorts on the Columbia River are generally engaged only in unusual
conditions (e.g., electronic equipment issue that would prevent safe navigation or inoperable vessel
propulsion system at normal power levels) that can be mitigated by the tug escort.
Vessel Speed and Travel Times
The vessels discussed in this section are primarily restricted to the navigation channel, in which
traffic moves in two lanes: one lane inbound and one lane outbound. Their speeds generally range
between 9 and 15 knots, with the slower speeds occurring while passing port areas; still slower
speeds of between 6 and 9 knots occur while passing through anchorages (DNV GL 2016).
Travel time across the bar takes approximately 2 hours in either direction. Travel time from the east
end of the bar to Longview is approximately 5 hours inbound (generally vessels in ballast11) and
about 6 hours outbound (generally loaded vessels). Outbound transits generally take longer than
inbound transits for two reasons: the majority of outbound vessels are loaded and, therefore, travel
at reduced speeds and outbound transits are scheduled during high-tide conditions to maximize
under-keel clearance12 and thus usually are running against the force of a flood (incoming) tide.
11 Vessels in ballast are not loaded with cargo, but have had their tanks loaded with seawater to increase vessel stability; these vessels have less of a draft than when loaded. 12 Under-keel clearance is the amount of space between the hull of the vessel and the bottom of the channel.
U.S. Army Corps of Engineers
Chapter 6. Operations: Affected Environment and Project Impacts
Millennium Bulk Terminals—Longview Draft NEPA Environmental Impact Statement
6.4-12 September 2016
Existing Vessel Traffic and Distribution
Figure 6.4-2 depicts activity by vessel type at eight locations (Figure 6.4-3) on the lower Columbia
River based on 2014 AIS data (DNV GL 2016). The categories shown in Figure 6.4-2 that apply to
large commercial vessels are Cargo Ships, Passenger (cruise ships and other large commercial
passenger vessels), and, Tug/Tug with Barge.13 As shown in the figure, vessel activity is greatest
near the mouth of the Columbia River. Much of this increased activity is related to service and
fishing vessel activity. Cargo ship activity is fairly consistent between Longview and the mouth of the
river.
Existing Port Activity
Characterizing existing port activity is another way to understand large commercial vessel activity.
Types and uses of vessels calling at ports in the study area (Figure 6.4-1) are described below.
Port of Astoria primarily receives cruise ships, loggers and other cargo vessels, and other types
of vessels (e.g., USCG, pollution control, commercial fishing, and recreational vessels). The port
reports approximately 230 vessel calls 14 at the Waterfront and Tongue Point berths in 2015
(McGrath pers. comm.).
Port of St. Helens, Port Westward Industrial Facility receives tankers and tank barges.
Port of Longview receives cargo ships and barges transporting various types of general and bulk
cargo, including steel, lumber, logs, grain, minerals, alumina, fertilizers, pulp, paper, wind energy
components, and heavy-lift cargo. The port reported 222 vessel calls in 2015 with a 5-year
average of 205 vessel calls per year (Hendriksen pers. comm.).
Port of Kalama receives cargo ships and barges primarily transporting grain, but also liquid bulk
chemicals and general cargo. The Port reported 205 vessel calls in 2014 (Port of Kalama 2015).
13 Because barges do not have AIS receivers, barge numbers are captured as part of the tug data. The tug numbers include tugs traveling independently and tugs towing or pushing barges. Only the latter are considered large commercial vessels. The number of tug and barge units (cargo barges), including ATBs, entering and exiting the river are best represented by transits recorded for the Ilwaco locations; the increased tug activity in the upriver portions of the study area, especially near Longview and Wauna, likely represents tugs traveling independently to provide docking services and tugs shifting cargo barges between ports. 14 A call represents a visit to a port terminal. A vessel call typically results in two vessel transits: one inbound and one outbound.

U.S. Army Corps of Engineers
Chapter 6. Operations: Affected Environment and Project Impacts
Millennium Bulk Terminals—Longview Draft NEPA Environmental Impact Statement
6.4-13 September 2016
Figure 6.4-2. Number of Transits per Location by Vessel Type (2014 AIS Data)
Figure 6.4-3. Vessel Data Location Points
U.S. Army Corps of Engineers
Chapter 6. Operations: Affected Environment and Project Impacts
Millennium Bulk Terminals—Longview Draft NEPA Environmental Impact Statement
6.4-14 September 2016
Port of Portland receives cargo ships (mostly Handymax and Panamax) and barges, cruise ships,
and other vessel types (e.g., other commercial passenger vessels, dredges, pollution control
vessels, USCG). The cargo vessels transport all types of cargo. The port reported 513 and
352 vessel calls in 2014 and 2015, respectively (Myer pers. comm.).
Port of Vancouver receives cargo ships (Handymax and Panamax) and barges transporting
grain, scrap steel, automobiles, petroleum products, other dry and liquid bulk cargo, and other
products. The port also receives commercial passenger vessels (not cruise ships) and dredges.
The port reported 450 vessel calls per year in 2014 and 2015 (Ulgum pers. comm.).
Historical Traffic Volumes
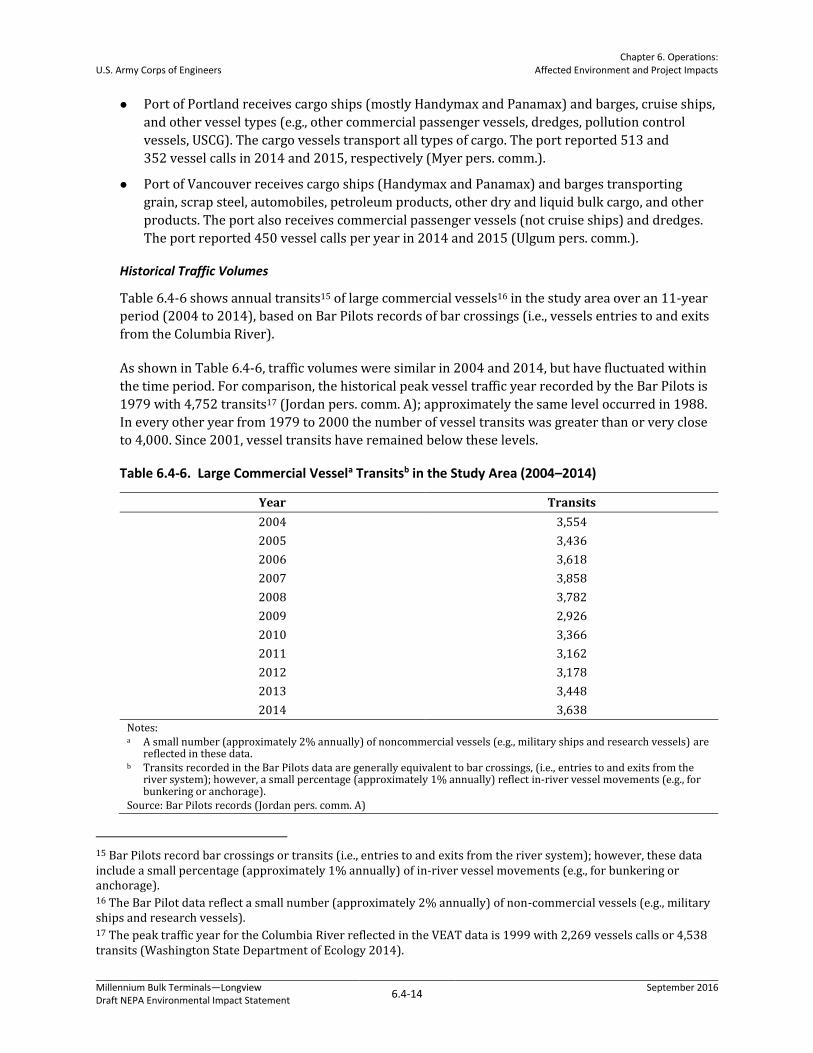
Table 6.4-6 shows annual transits15 of large commercial vessels16 in the study area over an 11-year
period (2004 to 2014), based on Bar Pilots records of bar crossings (i.e., vessels entries to and exits
from the Columbia River).
As shown in Table 6.4-6, traffic volumes were similar in 2004 and 2014, but have fluctuated within
the time period. For comparison, the historical peak vessel traffic year recorded by the Bar Pilots is
1979 with 4,752 transits17 (Jordan pers. comm. A); approximately the same level occurred in 1988.
In every other year from 1979 to 2000 the number of vessel transits was greater than or very close
to 4,000. Since 2001, vessel transits have remained below these levels.
Table 6.4-6. Large Commercial Vessela Transitsb in the Study Area (2004–2014)
Year Transits
2004 3,554
2005 3,436
2006 3,618
2007 3,858
2008 3,782
2009 2,926
2010 3,366
2011 3,162
2012 3,178
2013 3,448
2014 3,638
Notes: a A small number (approximately 2% annually) of noncommercial vessels (e.g., military ships and research vessels) are
reflected in these data. b Transits recorded in the Bar Pilots data are generally equivalent to bar crossings, (i.e., entries to and exits from the
river system); however, a small percentage (approximately 1% annually) reflect in-river vessel movements (e.g., for bunkering or anchorage).
Source: Bar Pilots records (Jordan pers. comm. A)
15 Bar Pilots record bar crossings or transits (i.e., entries to and exits from the river system); however, these data include a small percentage (approximately 1% annually) of in-river vessel movements (e.g., for bunkering or anchorage). 16 The Bar Pilot data reflect a small number (approximately 2% annually) of non-commercial vessels (e.g., military ships and research vessels). 17 The peak traffic year for the Columbia River reflected in the VEAT data is 1999 with 2,269 vessels calls or 4,538 transits (Washington State Department of Ecology 2014).

U.S. Army Corps of Engineers
Chapter 6. Operations: Affected Environment and Project Impacts
Millennium Bulk Terminals—Longview Draft NEPA Environmental Impact Statement
6.4-15 September 2016
Although vessel traffic volumes have been considerably lower since 2004 compared to earlier years,
vessel sizes and total cargo tonnages have increased. The overall decrease in vessel traffic levels can
be attributed to general economic conditions and the deepening of the Columbia River channel. The
deepening of the Columbia River channel from 40 to 43 feet has allowed larger vessels with greater
drafts to call at river ports, and vessels that previously had to be light-loaded can now be loaded to
deeper drafts. This has resulted in the need for fewer, but larger, vessels to move a given volume of
cargo; this is especially the case for the dry bulk cargo vessels that make up a high percentage of the
river traffic (Krug and Myer pers. comm.; Amos pers. comm.; Jordan pers. comm. B).
Of the vessel transits recorded by the Bar Pilots (2004 through 2014), cargo ships constitute the
largest percentage of vessel traffic in the lower Columbia River (around 90% on average); while
barges represent 3 to 10% and cruise ships less than 1%, on average. Approximately 3%, consists of
a mixture of other vessel types.18 These cargo ships can be broken down further into specific vessel
types, based on the Bar Pilots records. Figure 6.4-4 shows transits by vessel type within the cargo
ship category. Dry cargo ship transits represent over half (between 50 and 60%) of the cargo ship
traffic annually. The remainder (in descending order of magnitude) were automobile carriers,
general cargo ships, container ships, and tankers.
Figure 6.4-4. Percentage of Annual Cargo Ships by Vessel/Cargo Type (2004–2014)
18 Vessels categorized as other include vessels recorded in Bar Pilots data as miscellaneous (occasional military vessel, research vessels, industrial/marine construction, dredges), bunkers, shipyard, and shifts.
0
500
1,000
1,500
2,000
2,500
3,000
3,500
4,000
2004 2005 2006 2007 2008 2009 2010 2011 2012 2013 2014
Tran
sits
General Cargo Tanker Dry Bulk Auto Container
U.S. Army Corps of Engineers
Chapter 6. Operations: Affected Environment and Project Impacts
Millennium Bulk Terminals—Longview Draft NEPA Environmental Impact Statement
6.4-16 September 2016
Vessel Traffic Management
Management of vessel traffic in the study area is primarily a real-time activity involving the pilots,
vessel masters, and PDXMEX.19 Large commercial vessel traffic moves along the navigation channel
in a two-way pattern: one lane inbound and one lane outbound. This simplistic layout constitutes
the foundation of the traffic management system. Oversight and active participation in the traffic
management involves coordination of all river stakeholders, including USCG, Corps, Ecology, Oregon
Department of Environmental Quality (DEQ), pilots, shipping agents, terminal operators, tug
operators, and other associations and services. Large commercial vessels area must adhere to
international and inland rules (72 COLREGS and Rules of the Road, respectively), described in
Section 6.4.1, Regulatory Setting. These rules are intended to facilitate safe maritime travel.
Large commercial vessel traffic is also managed with pretransit planning, pilotage requirements (i.e.,
the use of a licensed bar and river pilot), and pilotage tools that monitor real-time vessel traffic and
data on current weather and tidal conditions. These vessel traffic management activities are
discussed in detail in the NEPA Vessel Transportation Technical Report.
Other Vessels
Other vessels include commercial fishing, recreational, smaller commercial passenger, and service
vessels. These vessels are generally much smaller than the vessels discussed in the previous section
and have different activity and transit patterns. Most can move about the river without being
restricted to the navigation channel.
Commercial Fishing
The Columbia River is divided into six commercial fishery management zones; of these, Zones 1
through 3, and a portion of Zone 4 occur in the indirect impacts study area (NOAA Fisheries 2016).
The commercial fisheries in these zones are managed by the states of Oregon and Washington.
Zones 1 through 3 support important commercial shad, anchovy, herring, smelt, and salmon
fisheries. Commercial fishers deploy gillnets, tangle-nets, or seines depending on species, season,
and zone. Several coastal, nearshore, and offshore open-ocean fisheries, including groundfish,
halibut, salmon, albacore, pacific whiting, sardines, and shellfish (primarily Dungeness crab and pink
shrimp) are present within or adjacent to the indirect impacts study area. Activities range from
harvesting to delivery to shore-based processors, depending on the fishery. The mouth of the
Columbia River is the busiest part of the study area for commercial fishing vessel traffic, though
numbers of operating vessels fluctuate by season and license by fishery.
Tribal Fishing
The treaties of 1855 between the United States and individual tribal governments reserved tribal
rights to fish, hunt, and gather traditional foods and medicines throughout ceded lands identified
within the treaties. The Columbia River and its tributaries support a variety of tribal resources,
including six species of salmon and Pacific lamprey, which have been a reliable and important
source of food and trade items to tribes of the Columbia River Compact. The Confederated Tribes
19 The Merchants Exchange of Portland (PDXMEX) is an information and communication center for ports and stakeholders along the Columbia River. It provides a monitoring system to allow users to locate vessels in the study area and operates a dispatch center to assist in coordinating with River and Bar Pilot dispatch centers to ensure proper vessel traffic management. PDXMEX is also a central point of contact for vessel agents, who provide necessary shore-side services for vessels.
U.S. Army Corps of Engineers
Chapter 6. Operations: Affected Environment and Project Impacts
Millennium Bulk Terminals—Longview Draft NEPA Environmental Impact Statement
6.4-17 September 2016
and Bands of the Yakama Nation, Confederated Tribes of the Umatilla Indian Reservation,
Confederated Tribes of Warm Springs, and Nez Perce Tribe are the tribes in the Columbia River
Basin with reserved rights to anadromous fish in treaties with the United States (Columbia River
Inter-Tribal Fish Commission 2016). Tribal fishing resources are described in more detail in Chapter
4, Section 4.5, Tribal Treaty Rights and Trust Responsibilities.
Recreational Fishing and Boating
The Columbia and Willamette Rivers are popular areas for recreational boating (motorized and non-
motorized), fishing, and other recreational activities (Port of Portland 2010). Over 30 water access
and boat launch sites along the Columbia and Willamette Rivers within the indirect impacts study
area provide public and private river access for recreational boating and fishing. A section of the
Columbia River Water Trail is located in the project area.
Commercial Passenger Vessels
Commercial passenger (non-cruise ship) vessels transit from one port to another within the
Columbia River; they include a range of vessels up to 100 gross tons carrying from six to over
150 passengers. Examples of these vessels include the Portland Spirit and Columbia Gorge
Sternwheeler, which provide dinner cruises and day trips, respectively, and the Wahkiakum County
ferry, the only ferry on the lower Columbia River, which shuttles passengers and up to 12 cars at a
time between Puget Island, Washington and Westport, Oregon.
Service Vessels
Service vessels, including military, law enforcement, search and rescue, pilot, pollution control, and
tugs operate throughout the study area and could be found anywhere on the lower Columbia River
at any time. The vessel types and activities are summarized below.
USCG vessels are used for search and rescue, maritime law enforcement, boating safety, Aids to
Navigation, and homeland security.
Oregon State Police and Washington State Police operate vessels to coordinate the enforcement
of commercial fishery and sport angling regulations, and for special investigations.
Pilot vessels are used to transport Bar and River Pilots to large vessels for pilotage duties. The
Bar Pilots make approximately 3,600 vessel crossings of the bar each year. River Pilots pilot
vessels upriver from Astoria.
Three marine spill response vessels are staged in the study area at the Port of Astoria.
Tugs operating in the study area include those towing or pushing barges from or to destinations
beyond the study area and those from tug companies located along the Columbia River.
Dredges are used to maintain the navigation channel by removing excess sand, silt, and mud that
naturally settles to the bottom and on the sides of the channel over time.
Maritime Law Enforcement
The USCG is the primary federal maritime law enforcement agency on the Columbia River. Oregon
State Police and Oregon county law enforcement also patrol the Columbia River (Oregon.gov 2016).

U.S. Army Corps of Engineers
Chapter 6. Operations: Affected Environment and Project Impacts
Millennium Bulk Terminals—Longview Draft NEPA Environmental Impact Statement
6.4-18 September 2016
6.4.4.3 Ship Casualty Survey
The information presented in this section is based on data obtained from the USCG MISLE database
and covers all available data from 2001 through 2014. The data are collected for 26 vessel incident
types and are not predictive of cargo vessel casualties. Three primary incident types—collision,
allision, and a combination of grounding/set adrift—are representative of the navigational incidents
that could occur and compare best to the results of the incident modeling (Table 6.4-7).
The database notes the severity of each incident and describes potential vessel damage. Table 6.4-8
presents the outcome distribution in three categories—total loss,20 damaged, and undamaged—for
marine incidents that took place between the Columbia River mouth and the Port of Portland. The
results of these data survey are very similar to those from nationwide incidents in that
approximately two-thirds of incidents resulted in no damage, one-third in some damage, and slightly
less than 3% in total loss.
Table 6.4-7. Incident Severity by Incident Type for Study Area (Total Incidents, 2001–2014)
Damage Status Total Loss
(% of Total) Damaged
(% of Total) Undamaged (% of Total) Total
Allision 3 (5%) 24 (43%) 29 (52%) 56
Collision 1 (5%) 9 (47%) 9 (47%) 19
Grounding /Adrift 1 (1%) 16 (21%) 59 (78%) 76
Totala 5 (3%) 49 (32%) 97 (64%) 151
Notes: a Total may not sum due to rounding. Source: DNV GL 2016
Table 6.4-8. Outcome Distribution for All Incidents in the Study Area by Vessel Type (2001–2014)
Damage Status Total Loss (%) Damaged (%) Undamaged (%) Total (%)
Bulk Carrier 0% 2% 16% 18%
General Dry Cargo Ship 0% 1% 3% 4%
Ro-Ro Cargo Ship 0% 1% 1% 2%
Tank Ship 0% 0% 2% 2%
Barge 0% 2% 7% 9%
Passenger Ship 1% 8% 7% 15%
Towing Vessel 0% 7% 13% 20%
Fishing Vessel 2% 5% 13% 21%
Recreational 1% 3% 0% 3%
Military ship 0% 1% 0% 1%
Unspecified 0% 1% 3% 4%
Miscellaneous 0% 1% 0% 1%
Totala 3% 32% 64% 100%
Notes: a Total may not sum due to rounding. Source: DNV GL 2016
20 For the purposes of this analysis, actual total loss, total constructive loss: salvaged, and total constructive loss: unsalvaged were combined into a single total loss category.
U.S. Army Corps of Engineers
Chapter 6. Operations: Affected Environment and Project Impacts
Millennium Bulk Terminals—Longview Draft NEPA Environmental Impact Statement
6.4-19 September 2016
Table 6.4-7 shows groundings were the most common type of incident, followed by allisions, then
collisions. Although collisions represented less than 13% of total incidents during the survey period,
they resulted in the highest severity outcomes, followed closely by allisions; groundings resulted in
significantly less severe outcomes (78% of grounding resulted in no vessel damage). Table 6.4-8
presents the distribution of incident severity for all incidents by vessel type. The table shows the
higher severity events more typically involved smaller craft (e.g., fishing or recreational vessels).
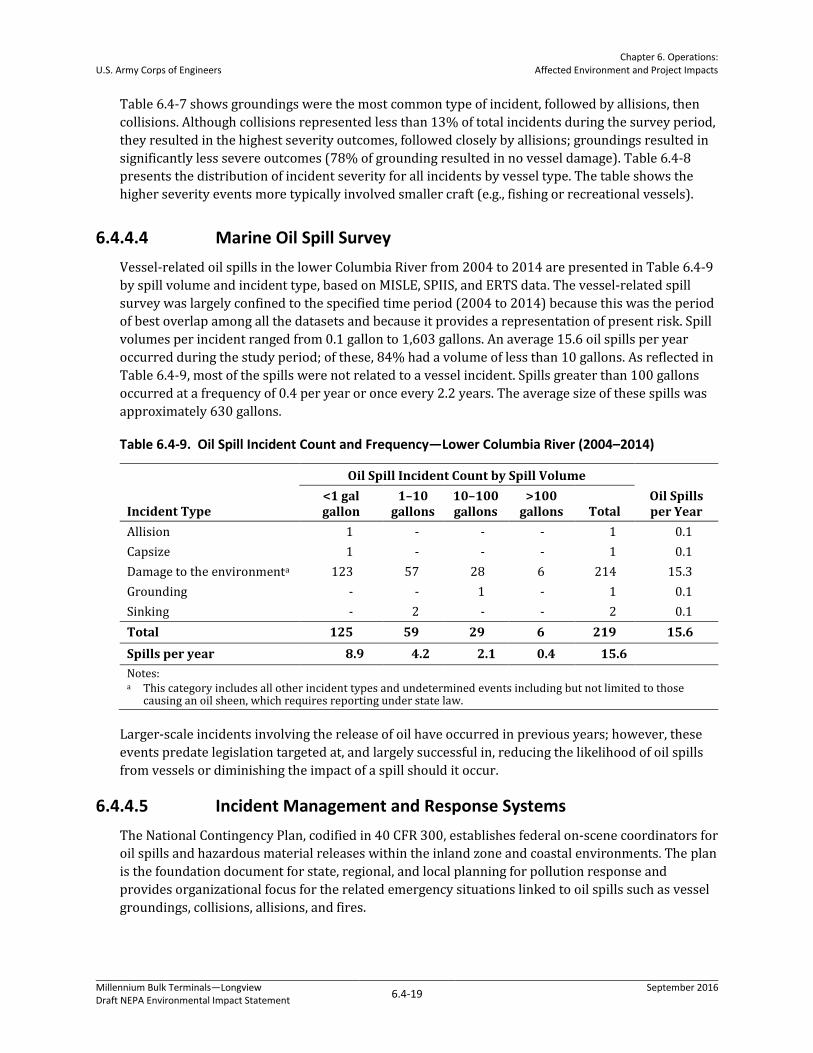
6.4.4.4 Marine Oil Spill Survey
Vessel-related oil spills in the lower Columbia River from 2004 to 2014 are presented in Table 6.4-9
by spill volume and incident type, based on MISLE, SPIIS, and ERTS data. The vessel-related spill
survey was largely confined to the specified time period (2004 to 2014) because this was the period
of best overlap among all the datasets and because it provides a representation of present risk. Spill
volumes per incident ranged from 0.1 gallon to 1,603 gallons. An average 15.6 oil spills per year
occurred during the study period; of these, 84% had a volume of less than 10 gallons. As reflected in
Table 6.4-9, most of the spills were not related to a vessel incident. Spills greater than 100 gallons
occurred at a frequency of 0.4 per year or once every 2.2 years. The average size of these spills was
approximately 630 gallons.
Table 6.4-9. Oil Spill Incident Count and Frequency—Lower Columbia River (2004–2014)
Incident Type
Oil Spill Incident Count by Spill Volume
Oil Spills per Year
<1 gal gallon
1–10 gallons
10–100 gallons
>100 gallons Total
Allision 1 - - - 1 0.1
Capsize 1 - - - 1 0.1
Damage to the environmenta 123 57 28 6 214 15.3
Grounding - - 1 - 1 0.1
Sinking - 2 - - 2 0.1
Total 125 59 29 6 219 15.6
Spills per year 8.9 4.2 2.1 0.4 15.6
Notes: a This category includes all other incident types and undetermined events including but not limited to those
causing an oil sheen, which requires reporting under state law.
Larger-scale incidents involving the release of oil have occurred in previous years; however, these
events predate legislation targeted at, and largely successful in, reducing the likelihood of oil spills
from vessels or diminishing the impact of a spill should it occur.
6.4.4.5 Incident Management and Response Systems
The National Contingency Plan, codified in 40 CFR 300, establishes federal on-scene coordinators for
oil spills and hazardous material releases within the inland zone and coastal environments. The plan
is the foundation document for state, regional, and local planning for pollution response and
provides organizational focus for the related emergency situations linked to oil spills such as vessel
groundings, collisions, allisions, and fires.
U.S. Army Corps of Engineers
Chapter 6. Operations: Affected Environment and Project Impacts
Millennium Bulk Terminals—Longview Draft NEPA Environmental Impact Statement
6.4-20 September 2016
USCG is the federal on-scene coordinator. In Washington State, Ecology is the designated state on-
scene coordinator for spill response. The Washington Emergency Management Division functions in
this role for natural disasters, and Washington State Patrol or state fire marshal for fires. The
Washington State Emergency Response system is designed to provide coordinated state agency
response, in cooperation with federal agencies for effective cleanup of oil or hazardous substance
spills. Within Oregon, DEQ is the lead agency for oil or hazardous material spills, the Oregon Office of
Emergency Management coordinates support from other state agencies, and the state fire marshal
provides hazardous materials/fire incident response coordination and support when a situation
exceeds local response capabilities.
The Northwest Area Contingency Plan is the regional planning framework for oil and hazardous
substance spill response in the states of Washington, Idaho, and Oregon. Representatives from the
federal and state agencies listed above and local governments plan for spill response emergencies
and implement response actions according to the plan when an incident occurs. Geographic
response plans, part of Northwest Area Contingency Plan, are tailored for specific shorelines and
waterways. The main objectives of these plans are to identify sensitive resources at risk from oil
spills and to direct initial response actions to sensitive resources.
In addition to the national and regional plans, the Lower Columbia Region Harbor Safety Committee
maintains the Harbor Safety Plan, which includes incident management guidelines; emergency
communications; notification requirements in case of an oil spill; steps to take in case of a vessel
grounding, vessel collision, bridge allision, and mechanical or equipment failures.
All of these plans help coordinate response efforts by the responsible party (vessel owner/operator)
and federal and state agencies.
Owners/operators of large commercial vessels are required to prepare and submit oil spill response
plans under federal (33 CFR 155.5010-155.5075) and state requirements (WAC 173-182) to ensure
resources, including equipment, are in place for a spill of the vessel’s fuel oil and of any oil carried as
secondary cargo. Moreover, vessel owners/operators are required to retain an oil spill removal
organization and a spill management team; this is often accomplished by contracting with
cooperative organizations that specialize in oil spill response, such as the Marine Spill Response
Organization and National Response Corporation.
Additionally, vessel owners/operators can obtain oil spill response and contingency planning
coverage under the Maritime Fire Safety Association (MFSA) response plan, an umbrella plan for
enrolled vessels entering the Columbia River.
6.4.5 Impacts
This section describes the potential direct and indirect impacts related to vessel transportation from
construction and operation of the proposed export terminal.
6.4.5.1 On-Site Alternative
Construction—Direct Impacts
Construction-related activities would include demolishing existing structures and preparing the site,
constructing the rail loop and dock, and constructing supporting infrastructure (e.g., conveyors and
transfer towers).

U.S. Army Corps of Engineers
Chapter 6. Operations: Affected Environment and Project Impacts
Millennium Bulk Terminals—Longview Draft NEPA Environmental Impact Statement
6.4-21 September 2016
Dock construction (pile-driving, dredging, and general construction of above-water elements) would
occur over a 6-month to 1-year period (Grette Associates, LLC 2014). For this work, barges would be
located near Docks 2 and 3. The barges would be positioned outside of the navigation channel, so as
to not impede vessels traveling within the channel. They would also be placed outside of the area
used by vessels accessing Dock 1, so they would not affect these activities. The On-Site Alternative
would not result in direct impacts on vessel transportation during construction activities. Additional
information on dredging and pile driving is included in Chapter 5, Section 5.5, Water Quality.
Construction—Indirect Impacts
As described in Chapter 3, Alternatives, the Applicant has identified three construction material
delivery scenarios: delivery by truck, rail, or barge. If material is delivered by barge, it is assumed
approximately 1,130 barge trips would be required during the construction period. Approximately
two-thirds of the barge trips would occur during the peak construction year, assumed to be 2018.
Approximately 750 barge trips in the study area would be required during the peak construction
year to deliver construction materials. Because the project area does not have an existing barge
dock, the material would be off-loaded at an existing dock elsewhere on the Columbia River and
transported to the project area by truck.
Barges are shallower in draft and could transit the Columbia River navigation channel during
periods of low water to avoid interference with larger vessel traffic. Coordination would take place
with the River Pilots prior to and during transit activity. Moreover, the barges would be transiting a
portion of the navigation channel during construction in the vicinity of the project area and not the
entire study area. Therefore, impacts on vessel traffic in the study area as a result of construction-
related barge traffic would be low because construction barge traffic would avoid interference with
larger vessels and would only traverse a local portion of the lower Columbia River.
Operations—Direct Impacts
Loading coal onto vessels for export is the only activity proposed for the new docks, Docks 2 and 3.
Vessel loading would be performed using an electric-powered shiploader. Each dock would have
one shiploader and each shiploader would have an average capacity of 6,500 metric tons per hour.
At maximum throughput, an average of 70 vessels per month (an average of over two per day)
would be loaded at Docks 2 and 3. The berths for Docks 2 and 3 are expected to be occupied by
project-related vessels 365 days per year.
River Pilots would pilot the incoming and outgoing vessels (from Astoria inland and vice versa) and
direct docking and undocking maneuvers. At least two tugs would be used to assist with docking and
undocking maneuvers for each arriving and departing project-related vessel. Therefore, at least two
tugs would be active in the vicinity of the docks four times per day on average. The pilot would
determine the appropriate size and horsepower of the tugs depending on factors such as the size of
the vessel, the weather conditions, and the currents at the time of maneuvers.
Docks 2 and 3 would be designed to accommodate dry bulk cargo ships up to 830 feet long and 130
feet wide, which would accommodate standard Panamax vessels and the somewhat smaller
Handymax vessels. The berths at Docks 2 and 3 would be 43 feet deep, which is the depth at which
the Columbia River navigation channel is maintained (U.S. Army Corps of Engineers 2015a).
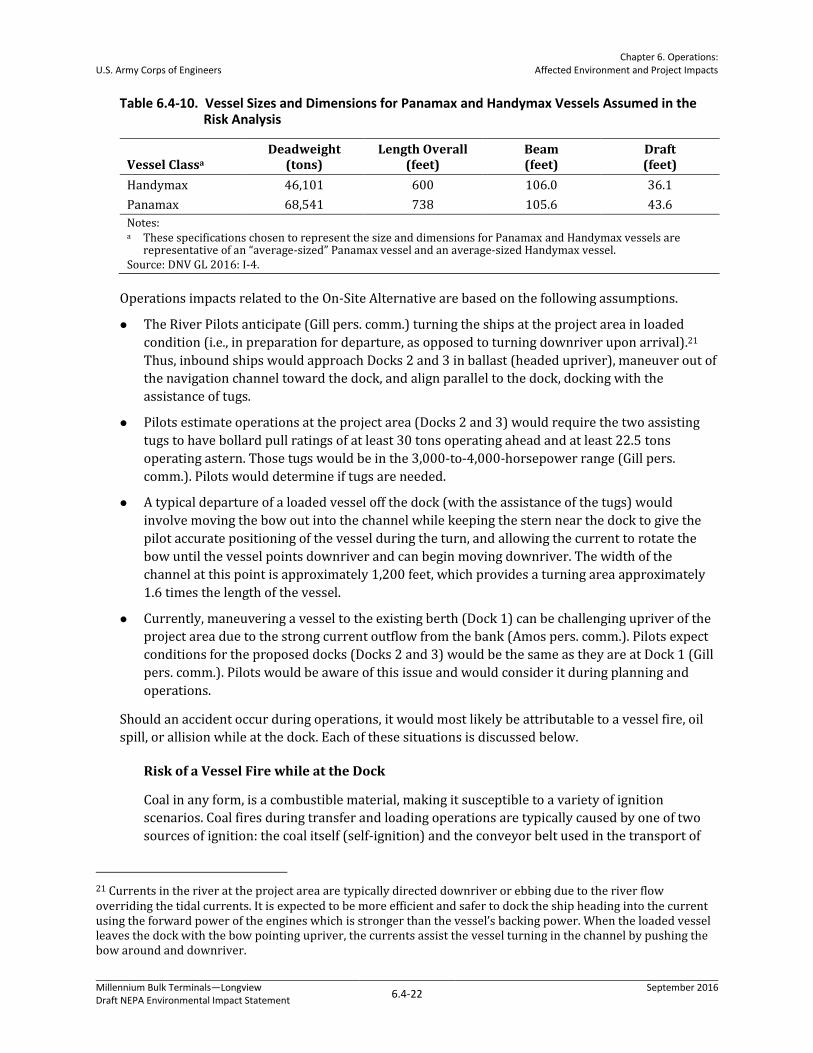
The expected fleet mix is 80% Panamax and 20% Handymax vessels. Table 6.4-10 contains the size
and dimensions of these types of vessels assumed for the risk analysis.
U.S. Army Corps of Engineers
Chapter 6. Operations: Affected Environment and Project Impacts
Millennium Bulk Terminals—Longview Draft NEPA Environmental Impact Statement
6.4-22 September 2016
Table 6.4-10. Vessel Sizes and Dimensions for Panamax and Handymax Vessels Assumed in the Risk Analysis
Vessel Classa Deadweight
(tons) Length Overall
(feet) Beam (feet)
Draft
(feet)
Handymax 46,101 600 106.0 36.1
Panamax 68,541 738 105.6 43.6
Notes: a These specifications chosen to represent the size and dimensions for Panamax and Handymax vessels are
representative of an “average-sized” Panamax vessel and an average-sized Handymax vessel. Source: DNV GL 2016: I-4.
Operations impacts related to the On-Site Alternative are based on the following assumptions.
The River Pilots anticipate (Gill pers. comm.) turning the ships at the project area in loaded
condition (i.e., in preparation for departure, as opposed to turning downriver upon arrival).21
Thus, inbound ships would approach Docks 2 and 3 in ballast (headed upriver), maneuver out of
the navigation channel toward the dock, and align parallel to the dock, docking with the
assistance of tugs.
Pilots estimate operations at the project area (Docks 2 and 3) would require the two assisting
tugs to have bollard pull ratings of at least 30 tons operating ahead and at least 22.5 tons
operating astern. Those tugs would be in the 3,000-to-4,000-horsepower range (Gill pers.
comm.). Pilots would determine if tugs are needed.
A typical departure of a loaded vessel off the dock (with the assistance of the tugs) would
involve moving the bow out into the channel while keeping the stern near the dock to give the
pilot accurate positioning of the vessel during the turn, and allowing the current to rotate the
bow until the vessel points downriver and can begin moving downriver. The width of the
channel at this point is approximately 1,200 feet, which provides a turning area approximately
1.6 times the length of the vessel.
Currently, maneuvering a vessel to the existing berth (Dock 1) can be challenging upriver of the
project area due to the strong current outflow from the bank (Amos pers. comm.). Pilots expect
conditions for the proposed docks (Docks 2 and 3) would be the same as they are at Dock 1 (Gill
pers. comm.). Pilots would be aware of this issue and would consider it during planning and
operations.
Should an accident occur during operations, it would most likely be attributable to a vessel fire, oil
spill, or allision while at the dock. Each of these situations is discussed below.
Risk of a Vessel Fire while at the Dock
Coal in any form, is a combustible material, making it susceptible to a variety of ignition
scenarios. Coal fires during transfer and loading operations are typically caused by one of two
sources of ignition: the coal itself (self-ignition) and the conveyor belt used in the transport of
21 Currents in the river at the project area are typically directed downriver or ebbing due to the river flow overriding the tidal currents. It is expected to be more efficient and safer to dock the ship heading into the current using the forward power of the engines which is stronger than the vessel’s backing power. When the loaded vessel leaves the dock with the bow pointing upriver, the currents assist the vessel turning in the channel by pushing the bow around and downriver.

U.S. Army Corps of Engineers
Chapter 6. Operations: Affected Environment and Project Impacts
Millennium Bulk Terminals—Longview Draft NEPA Environmental Impact Statement
6.4-23 September 2016
coal (e.g., over-heating due to damaged bearings, roller, belt slip). Safety requirements prohibit
open flames near coal loading operations.
A fire in the vessel’s machinery spaces or accommodation areas is a potential emergency
scenario. Vessel design standards, fire equipment requirements, and crew training would be
required to prevent or to facilitate rapid response to a vessel emergency while at the dock. All of
these standards and requirements are implemented in accordance with the International
Convention for the Safety of Life at Seas (SOLAS) in foreign and domestic cargo vessels (and
codified in U.S. regulations) and enforced by USCG.
A bulk carrier such as the project-related vessels would have the following fire prevention and
response features.
Structural fire protection, including certain bulkheads constructed to prevent the passage of
flame and smoke for 1 hour. Other bulkheads must be constructed of incombustible
materials. Current regulations require risk of fire hazards be eliminated as much as possible
in other construction features of the vessel (46 CFR 92).
Structural insulation around compartments containing the emergency source of power
(such as the ship’s service generators). Other approved materials capable of preventing an
excessive temperature rise in the space may also be used to eliminate the spread of a fire
that originates in this type of compartment (46 CFR 92).
Fire pumps, hydrants, hoses, and nozzles for the purposes of onboard firefighting. In
addition, certain spaces must have approved hand-portable fire extinguishers and
semiportable fire extinguishing systems (46 CFR 95).
Officers and crewmembers with a basic level of training, including fire prevention and
firefighting (U.S. Coast Guard 2014).
Within the hold of a vessel, coal can be susceptible to ignition due primarily to self-heating
and/or the creation and subsequent ignition of certain gases, including methane and hydrogen.
Fire detection systems including carbon monoxide detection and infrared scanning would be in
place to monitor and minimize the potential for onboard coal fires. Additionally, manual
scanning by workers would enhance built-in mechanical-detection systems. Automated fire-
suppression systems activated in the early stages of fire development are critical to reducing the
potential for flame spread. These typically include water sprinklers combined with a fire
extinguishing agent such as wetting agents or foam. Therefore, an onboard emergency is
unlikely to affect resources other than the vessel itself.
Risk of an Oil Spill while at the Dock
An operational oil spill at the dock would most likely occur during bunkering (i.e., a ship
receiving fuel while at the dock). However, the Applicant has committed to not allowing vessel
bunkering at Docks 2 or 3, so there would be no risk of an oil spill at a dock associated with oil
transfers. Oil spill risks during transit are addressed under Operations—Indirect Impacts.
Risk of a Vessel Allision at the Dock
An allision occurs when a vessel strikes a fixed structure, such as a project-related vessel
striking the proposed docks at the project area or another vessel striking a project-related
vessel at berth.
U.S. Army Corps of Engineers
Chapter 6. Operations: Affected Environment and Project Impacts
Millennium Bulk Terminals—Longview Draft NEPA Environmental Impact Statement
6.4-24 September 2016
Pilots sometimes experience difficulties getting a ship to the berth at the existing Dock 1, located
just upriver of proposed Docks 2 and 3. Information about maneuvering challenges at Docks 2
and 3 cannot be collected and evaluated until the docks are built and vessel maneuvers take
place at the project area. Nevertheless, the pilots’ experience at nearby Dock 1 in the Applicant’s
leased area introduces a certain level of uncertainty associated with the aggregate influence of
currents and river flow at Docks 2 and 3. A potential outcome when there are strong currents in
the vicinity of the dock during vessel maneuvers is an allision. An allision may also occur if there
were a loss of steering or loss of propulsion during transit or maneuvering at the dock. Despite
the uncertainty associated with vessel maneuvers at the dock, the likelihood of a vessel allision
is lessened due to the presence of tug power while docking and undocking.
Risk of allision could also involve another vessel striking a project-related vessel while the
project-related vessel was at berth. Several ports are located upriver of the project area and
other vessels traveling to and from those locations would pass the project area. Based on
incident modeling (DNV GL 2016), the likelihood of an allision under the On-Site Alternative is
once in 39 years. However, as noted in Section 6.4.4.3, Ship Casualty Survey, most allisions do not
result in substantial consequences, such as total vessel loss. From 2001 and 2014, only 5% of
allisions resulted in total vessel loss, and all of these events involved only fishing vessels.22
Operations—Indirect Impacts
All large commercial vessel traffic bound for Longview or ports further upriver, including the Port of
Portland and Port of Vancouver, pass the project area. Transiting project-related vessels could affect
or be affected by other vessel movements in the study area. Moreover, increased vessel traffic could
result in changes in wake patterns, increased propeller wake, and increased underwater noise, and
vessel emissions that could affect other environmental resources. These impacts are addressed in
Chapter 5, Section 5.5, Water Quality, and Sections 6.5, Noise and Vibration, and 6.6, Air Quality.
Impacts on the vessel transportation system and related environmental resources along the
Columbia River navigation channel outside the project area due to vessel operations are considered
to be indirect impacts.
Risk of Vessel Incidents during Transit
Factors influencing the potential for incidents during vessel transport are complex but are
driven largely by changes in the pattern of vessel traffic particularly those vessels limited to the
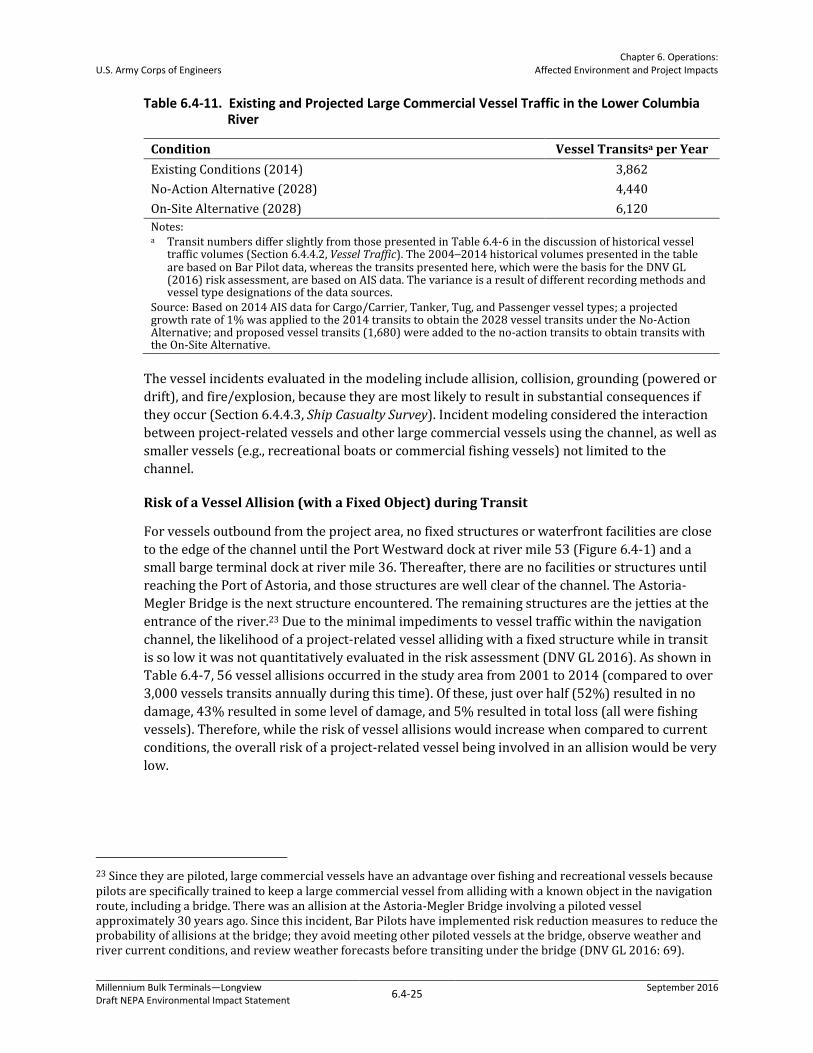
navigation channel. Table 6.4-11 compares large commercial vessel traffic under existing
conditions (based on 2014 AIS data), No-Action Alternative (2028), and On-Site Alternative
(2028).
For the purposes of incident modeling, the baseline traffic year of 2014 was selected to
represent relatively recent traffic conditions on the river.
22 The data also show between 2001 and 2014, 4% of the allisions resulting in some damage were bulk carrier allisions.
U.S. Army Corps of Engineers
Chapter 6. Operations: Affected Environment and Project Impacts
Millennium Bulk Terminals—Longview Draft NEPA Environmental Impact Statement
6.4-25 September 2016
Table 6.4-11. Existing and Projected Large Commercial Vessel Traffic in the Lower Columbia River
Condition Vessel Transitsa per Year
Existing Conditions (2014) 3,862
No-Action Alternative (2028) 4,440
On-Site Alternative (2028) 6,120
Notes: a Transit numbers differ slightly from those presented in Table 6.4-6 in the discussion of historical vessel
traffic volumes (Section 6.4.4.2, Vessel Traffic). The 2004–2014 historical volumes presented in the table are based on Bar Pilot data, whereas the transits presented here, which were the basis for the DNV GL (2016) risk assessment, are based on AIS data. The variance is a result of different recording methods and vessel type designations of the data sources.
Source: Based on 2014 AIS data for Cargo/Carrier, Tanker, Tug, and Passenger vessel types; a projected growth rate of 1% was applied to the 2014 transits to obtain the 2028 vessel transits under the No-Action Alternative; and proposed vessel transits (1,680) were added to the no-action transits to obtain transits with the On-Site Alternative.
The vessel incidents evaluated in the modeling include allision, collision, grounding (powered or
drift), and fire/explosion, because they are most likely to result in substantial consequences if
they occur (Section 6.4.4.3, Ship Casualty Survey). Incident modeling considered the interaction
between project-related vessels and other large commercial vessels using the channel, as well as
smaller vessels (e.g., recreational boats or commercial fishing vessels) not limited to the
channel.
Risk of a Vessel Allision (with a Fixed Object) during Transit
For vessels outbound from the project area, no fixed structures or waterfront facilities are close
to the edge of the channel until the Port Westward dock at river mile 53 (Figure 6.4-1) and a
small barge terminal dock at river mile 36. Thereafter, there are no facilities or structures until
reaching the Port of Astoria, and those structures are well clear of the channel. The Astoria-
Megler Bridge is the next structure encountered. The remaining structures are the jetties at the
entrance of the river.23 Due to the minimal impediments to vessel traffic within the navigation
channel, the likelihood of a project-related vessel alliding with a fixed structure while in transit
is so low it was not quantitatively evaluated in the risk assessment (DNV GL 2016). As shown in
Table 6.4-7, 56 vessel allisions occurred in the study area from 2001 to 2014 (compared to over
3,000 vessels transits annually during this time). Of these, just over half (52%) resulted in no
damage, 43% resulted in some level of damage, and 5% resulted in total loss (all were fishing
vessels). Therefore, while the risk of vessel allisions would increase when compared to current
conditions, the overall risk of a project-related vessel being involved in an allision would be very
low.
23 Since they are piloted, large commercial vessels have an advantage over fishing and recreational vessels because pilots are specifically trained to keep a large commercial vessel from alliding with a known object in the navigation route, including a bridge. There was an allision at the Astoria-Megler Bridge involving a piloted vessel approximately 30 years ago. Since this incident, Bar Pilots have implemented risk reduction measures to reduce the probability of allisions at the bridge; they avoid meeting other piloted vessels at the bridge, observe weather and river current conditions, and review weather forecasts before transiting under the bridge (DNV GL 2016: 69).

U.S. Army Corps of Engineers
Chapter 6. Operations: Affected Environment and Project Impacts
Millennium Bulk Terminals—Longview Draft NEPA Environmental Impact Statement
6.4-26 September 2016
Risk of Other Incidents during Transit
Increased risks associated with additional vessel traffic also include the potential for more
collisions, groundings, or fires/explosions. As presented in Table 6.4-12, operation of the
terminal would increase the potential for incidents compared to existing condition (2014) and
the No-Action Alternative (2028). The total predicted incident frequency in 2028 is 19.4
incidents per year under the No-Action Alternative and 22.2 incidents per year with the On-Site
Alternative. The predicted increase in incidents is primarily because of the increase in the
number of vessels transiting the lower Columbia River with the On-Site Alternative.
Consequences of a modeled incident can vary greatly from no damage to total loss and the
increase in likelihood alone is not representative of the magnitude of the potential
consequences. In other words, not all of these incidents are likely to result in notable damages.
For example, of the 151 reported incidents in the study area from 2001 through 2014 (Table
6.4-7), 64% resulted in no damage, 32% resulted in damage, and 3% resulted in total loss.
Table 6.4-12. Predicted Incident Frequencies per Year in the Study Area
Scenario
Predicted Incident Frequency
Predicted Collision
Predicted Powered
Grounding
Predicted Drift
Grounding
Predicted Fire/
Explosion Total
Existing Conditions (2014) 1.94 11.8 2.8 0.0032 16.6
No-Action Alternative (2028) Conditions
2.53 13.6 3.3 0.0037 19.4
On-Site Alternative (2028) Conditions
2.91a 14.4 3.6 0.0040 22.2
Notes: a Predicted collision incident frequency for the On-Site Alternative includes the likelihood that a non-project vessel would strike a project vessel at berth (collisions and allisions). Source: DNV GL 2016
Additionally, the incident frequencies predicted for existing conditions are from a single year
(2014). While this year accounts for higher vessel traffic compared to the previous few years, it
does not account for the wide historical variation in vessel traffic. Further, because the On-Site
Alternative would ramp up over time, comparing the addition of 840 vessels to existing
conditions is a conservative estimate; incident frequencies would be lower until the terminal is
operating at full capacity and loading all 840 vessels yearly. Therefore, it is important to also
consider how the No-Action Alternative would compare to existing conditions and how the On-
Site Alternative would compare to the No-Action Alternative. As shown in Table 6.4-12, a
relative increase in the likelihood of all incident types would occur over time unrelated to the
On-Site Alternative.
Collisions
In general, the River Pilots and Bar Pilots avoid overtaking situations where one vessel passes
another from behind. Thus, the most likely collision scenario is an inbound vessel meeting an
outbound vessel. The River Pilots have identified specific points on the river where conditions
are not suitable for vessels to pass each other, and they carefully manage transits to avoid two
U.S. Army Corps of Engineers
Chapter 6. Operations: Affected Environment and Project Impacts
Millennium Bulk Terminals—Longview Draft NEPA Environmental Impact Statement
6.4-27 September 2016
vessels meeting in those locations. Avoidance of these areas was taken into consideration in
calculating collision risk.
The most likely collision scenarios are bow-to-bow and side-to-side contact involving two large
commercial vessels transiting the navigation channel. Bow-to-side is a possibility, but the
channel width and the sizes of the vessels would likely make it more of a glancing impact rather
than a straight ahead “T” impact.
Bow-to-bow contact is generally viewed as the easiest type of collision to avoid because the
target area is small and either vessel can act independently to avoid it. Also, a vessel’s bow is its
strongest structural point and bow-to-bow collisions would not be expected to result in cargo
hold damage or fuel oil release. In addition, the hydrodynamic interaction between ships
meeting causes the bows to be pushed away from each other as they approach.
Side-to-side or a glancing bow-to-side collision could result in damage to the hull, but the
likelihood of catastrophic damage is relatively low. For dry cargo vessels—including bulk
carriers—it is unlikely any cargo would be released into the water in the event of an angle of
impact less than 22.5 degrees (DNV GL 2016). For tank vessels—including ATBs carrying oil in
bulk—the risk of an oil spill cannot be ruled out; however, modern tank vessel design standards,
including double hull construction of tankers, substantially reduce the potential.
The Columbia and Willamette Rivers provide important fisheries for commercial, tribal, and
recreational purposes. Although fishing vessels are not restricted to the navigation channel, they
often cross the channel, particularly during periods of high fishing activity. However, in general,
because these smaller vessels are not restricted to the channel and must by law yield to
oncoming large commercial vessels, the potential for a collision between a smaller vessel and a
project-related vessel would be low. Incident modeling showed a very small increase in the
potential for collisions involving fishing boats (0.04 incident per year) and recreational boats
(0.01 incident per year).
Groundings
While a collision may seem like a more likely incident scenario in the two-lane channel, the
vessel casualty data (Table 6.4-7) and incident modeling results (Table 6.4-12) show
groundings, specifically powered groundings, are more likely under all traffic scenarios. The
River Pilots noted there are few areas where waterway conditions create a substantial chance
for an accidental grounding to occur. For example, during periods of low water (generally
between September and November) pilots give adequate consideration to under-keel clearance
to avoid touching bottom. They also noted the nature of the river channel provides a bank
cushion effect to help keep vessels away from the channel edges24 (Amos pers. comm.).
Fires, Explosions, and Other Emergencies
Equipment failure affecting power or steering while the vessel is underway could lead to loss of
control of a vessel. A fire in the vessel’s machinery spaces or accommodation areas is also a
potential emergency scenario. For any of these situations the vessel master would do what is
necessary to protect the safety of the crew first and avoid damage to the vessel second. A
24 When the vessel is near to the bank, the water is forced between the narrowing gap between the vessel’s bow and the bank. This water tends to create a “cushion” that pushes the vessel away from the bank.
U.S. Army Corps of Engineers
Chapter 6. Operations: Affected Environment and Project Impacts
Millennium Bulk Terminals—Longview Draft NEPA Environmental Impact Statement
6.4-28 September 2016
prudent action would be to remove the vessel from the navigation channel to a “safe haven,” a
location where appropriate actions can be taken by the vessel crew without compounding the
emergency by involving another vessel or structure. Safe haven opportunities on the river are
minimal. Marine terminals at the port areas and designated anchorages are the only places
where vessels can stop to manage an emergency. Two anchorages at Astoria can accommodate
five deep-draft vessels, at most, depending on their sizes. There are no other anchorage areas
until reaching Longview (past the project area). Once a loaded vessel gets underway inbound to
or outbound from the Longview area, it is committed to completing the planned transit.25
Nothing prevents a vessel’s master from anchoring anywhere in the river under emergency
conditions; however, there is no way to predict how successful such an action might be in
stopping the vessel. Anchoring effectiveness is dependent on factors such as the nature and
condition of the waterway bottom, water depth, and vessel speed at the time of the anchoring.
Risks include the potential for the anchor to damage the vessel if the water is not sufficiently
deep. The vessel’s location in or near the channel could also hamper or endanger other vessels
depending on its location at the time. Dropping an anchor or anchors in an attempt to stop a
vessel would be done only if other control measures failed. Opportunities for these emergency
measures would be discussed as part of the pre-transit planning between the master and the
pilot.
In an emergency, a vessel could anchor in the channel at some locations; however, this presents
significant risks for the vessel regarding the narrow channel and most likely would block
virtually all other traffic. The likelihood of a vessel emergency causing a collision is low. Safe
haven limitations (described above) mean vessel transit would not begin until everyone
involved is satisfied the vessel is fully capable of completing the transit.
Although a vessel emergency increases the likelihood of indirect impacts on the Columbia River
waterway (such as a bunker oil spill), the likelihood of such an emergency occurring is very
small. As shown in Table 6.4-12, the likelihood of fires and explosions is substantially lower than
any other type of incident considered in the risk assessment. For example, fires and explosions
are predicted to occur approximately 0.004 times per year compared to a predicted total
incident frequency of 22.2 incidents per year. If such an emergency were to occur, the presence
of a qualified vessel master and the pilot, in addition to crew training, vessel design, and
equipment would help minimize the harmful impact on human safety and environment.
Risk of a Bunker Oil Spill during Transit or at Anchorages
In general, the risk of bunker oil spills would increase under the On-Site Alternative due to the
number of vessels that would call at the terminal and the resulting increase in overall vessel
traffic in the river. Accident risk modeling estimated the increased likelihood of oil spills caused
by a collision or grounding under the On-Site Alternative.
25 A number of potential sites for additional anchorages are being discussed by the waterway stakeholders; however, they generally are shallow water sites. Reportedly, the discussions include the possibility of the Corps maintaining those areas as part of the navigation channel. Provision of additional stern buoys is also being considered.

U.S. Army Corps of Engineers
Chapter 6. Operations: Affected Environment and Project Impacts
Millennium Bulk Terminals—Longview Draft NEPA Environmental Impact Statement
6.4-29 September 2016
Tables 6.4-13 and 6.4-14 present the likelihood (in terms of “return period”26) of representative
spill sizes resulting from an increased risk of collisions and groundings, respectively, under the
On-Site Alternative.
Table 6.4-13. Example Bunker Oil Spill Volumes and Frequencies due to Collisions Related to the On-Site Alternative (2028 and 2038)
Return Period (years)a
Oil Spill Volume (gallons) 2028 2038
341 224 20,900 or less
581 381 59,300 or less
676 444 107,400 or less
3,748 2,461 166,500 or less
Notes: a Frequency of collisions in 2038 is higher compared to 2028 due to an increase in the overall vessel traffic
in the study area. Source: DNV GL 2016
Table 6.4-14. Example Bunker Oil Spill Volumes and Frequencies due to Groundings Related to the On-Site Alternative (2028 and 2038)
Return Period (years)a Oil Spill Volume (gallons)
140 5,700 or less
182 10,700 or less
403 39,700 or less
4,299 45,800 or less
Notes: a Grounding frequencies do not vary from 2028 to 2038 since the number of project vessels remains at 840
in both years. Source: DNV GL 2016
As shown in the tables, the likelihood of bunker oil spills from a vessel incident is relatively low
with the most likely scenarios occurring in the range of once every 224 years for collisions
(2038 traffic levels) and once every 140 years for groundings (2028 or 2038 traffic levels). As
noted in Section 6.4.4.4, Marine Oils Spill Survey, historical spills in the study area are much
smaller than the quantities indicated in Tables 6.4-13 and 6.4-14 and have ranged from 0.1
gallon to 1,603 gallons.27 The average number of oil spills within this same timeframe (2004 to
2014) is 15.6 spills per year with 84% having a volume of less than 10 gallons. Spills of more
than 100 gallons have occurred at a frequency of 0.4 per year or once every 2.2 years. The
average size of these relatively larger spills is approximately 630 gallons.
The reason the potential spill sizes are larger is because the spill scenarios presented above are
associated with large-scale vessel incidents: collisions or groundings. For such an incident to
result in a release of bunker oil, the energy involved in the initial incident must be great enough
to puncture the vessel’s tanks. Increases in the types of oil spills of a scale more similar to those
over the last 10 years or so would also be expected to be commensurate with the relative
26 Estimated period of time between occurrences of an event. 27 Data presented in Section 6.4.4.4, Marine Oil Spill Survey, include all reported vessel-related spills from 2004 to 2014, not just those caused by vessel incidents such as groundings and collisions.
U.S. Army Corps of Engineers
Chapter 6. Operations: Affected Environment and Project Impacts
Millennium Bulk Terminals—Longview Draft NEPA Environmental Impact Statement
6.4-30 September 2016
increase in vessel traffic. Expansion of the casualty survey to a longer (beyond 11 years)
timeframe, would include more unlikely events of a larger scale more in line with those
addressed by the incident modeling.
An amendment to the International Convention for the Prevention of Pollution from Ship
(MARPOL) Annex that went into force in 2007, included a new regulation 12A on oil fuel tank
protection. This regulation applies to any ship with an aggregate oil fuel capacity of 785 cubic
yards (3,774 barrels [158,508 gallons] of oil equivalent) or more and was contracted for on or
after August 1, 2007; or had a keel laying date on or after February 1, 2008; or was delivered on
or after August 1, 2010. The regulation limits an individual fuel tank to a maximum capacity
limit of 3,270 cubic yards (15,725 barrels) and also includes requirements for the protected
location of the fuel tanks and performance standards for accidental oil fuel outflow. It requires
consideration of general safety aspects, including maintenance and inspection needs, when
approving the vessel’s design and construction. These improvements have helped to reduce the
extent of releases in the event of a vessel incident.
Increased vessel traffic associated with the proposed export terminal could also increase the
risk of oil spills during bunkering activities. Causes of oil spills during bunkering transfers
include overflow of the tank, parting of the hose due to mooring fault, operator error in
connecting the hose, failure of the hose or pipework, and failure of bunker tanks. Experience
from insurance claims (Gard 2002) indicates most bunker spills result from an overflow of the
bunker tank due to carelessness or negligence, either on the part of those supplying the bunkers,
or those on board the vessel receiving them. The main safeguards against the occurrence of
bunker spills are use of bunkering best practices, including attentive tank-level monitoring and
valve alignment, use of bunkering procedures and checklists, and supervision of the bunkering
operation by a qualified person.28 Standard/ABS (2012) lists the main features of such
procedures.
The consequences of a spill of heavy fuel oil into the marine environment are in general
considered to be more severe than for other fuels, although this may depend on the sensitivity of
the local environment to acute toxicity (DNV 2011). Undoubtedly, spills of heavy fuel oil will be
more persistent, taking longer to weather naturally and being more difficult to clean up. The
average cleanup costs per metric ton of oil spilled have been estimated as more than seven
times higher for heavy fuel oil29 than for diesel (Etkin 2000).
There were nine oil spills during refueling of large cargo vessels in the lower Columbia River
from 2004 to 2014. Spills of oil cargoes are better documented than spills from bunkering.
Therefore, previous risk analyses (e.g., DNV 2011) have assumed the frequency of spills during
bunkering is the same as during transfer of liquid cargoes: 1.8 by 10-4 per bunkering operation
(one spill every 5,555 years) for spills exceeding 1 metric ton (7.3 barrels or 308 gallons). The
frequency of smaller spills would be greater. Although it is not possible to predict the number of
vessels bunkered or where they would bunker, the risks of a spill in the lower Columbia River
would increase only slightly due to the increase in vessel trips under the On-Site Alternative.
28 Bunkering Best Practices: A Reference Manual for Safe Bunkering Operations in Washington State (Washington State Department of Ecology 2014) and Bunkering Guidelines in Lower Columbia Region Harbor Safety Plan (January 2013). These references provide extensive guidelines related to winds, sea states, mooring equipment, tug availability, and regulatory requirements to provide for safe, spill-free bunkering operations. 29 Heavy fuel oil is used in marine main diesel engines. It is a residue from crude oil refining and because of its properties, heavy fuel oil is required be stored and used at a high temperature.
U.S. Army Corps of Engineers
Chapter 6. Operations: Affected Environment and Project Impacts
Millennium Bulk Terminals—Longview Draft NEPA Environmental Impact Statement
6.4-31 September 2016
Vessel Activity
Increased vessel traffic associated with the proposed export terminal would also result in other
impacts from vessel wakes, propeller wash, underwater noise and vibration, and vessel
emissions. Potential impacts on cultural resources, water quality, and fish are addressed in
Chapter 4, Section 4.4, Cultural Resources, and Chapter 5, Sections 5.2, Surface Water and
Floodplains, 5.5, Water Quality, 5.6, Vegetation, 5.7, Fish, and 5.8, Wildlife, respectively. The
magnitude of these vessel-related impacts would depend on a variety of interrelated factors,
including but not limited to, distance of the channel from the shoreline, depth of the intervening
riverbed, placement and size of dredged materials, the presence of particularly sensitive species,
the speed and size of the vessels, the prevailing river and tidal currents, and otherwise naturally
occurring wave action.
6.4.5.2 Off-Site Alternative
The project area for the Off-Site Alternative is located adjacent (west and downriver approximately
1.5 miles) to the project area for the On-Site Alternative. Vessel docking, undocking, and other
activities at the proposed docks (Docks A and B), would be conducted in the same manner and with
the same precautions as described for the On-Site Alternative. The same number and type of vessels
would be loaded at the Off-Site Alternative location as the On-Site Alternative location. Therefore,
vessel impacts of the Off-Site Alternative would be nearly identical to the On-Site Alternative.
Construction—Direct Impacts
Dock construction would occur over a 6-month to 1-year period. For this work, barges would be
located near Docks A and B but positioned outside of the navigation channel, so as to not impede
vessels traveling within the channel.
Construction—Indirect Impacts
Indirect impacts resulting from construction of the Off-Site Alternative would be the same as those
described for the On-Site Alternative.
As described in Chapter 3, Alternatives, the Applicant has identified three construction-material-
delivery scenarios: delivery by truck, rail, or barge. If material is delivered by barge, it is estimated
approximately 1,130 barge trips would be required over the construction period. Approximately
two-thirds of the barge trips would occur during the peak construction year, assumed to be 2018.
Approximately 750 barge trips in the study area would be required during the peak construction
year to deliver construction materials. Because the project area does not have an existing barge
dock, the material would be off-loaded at an existing dock elsewhere on the Columbia River and
transported to the project area by truck.
Barges are shallower in draft and could transit the Columbia River navigation channel during
periods of low water to avoid interference with larger vessel traffic. Coordination would take place
with the River Pilots prior to and during transit activity. Moreover, the construction barges would be
transiting a portion of the navigation channel during construction in the vicinity of the project area
and not the entire study area. Given the limited work area, construction-related barge traffic is
unlikely to interfere with larger vessels in the Columbia River navigation channel.
U.S. Army Corps of Engineers
Chapter 6. Operations: Affected Environment and Project Impacts
Millennium Bulk Terminals—Longview Draft NEPA Environmental Impact Statement
6.4-32 September 2016
Operations—Direct Impacts
Operation of the Off-Site Alternative would result in the same direct impacts as the On-Site
Alternative except as described below. Vessel operations at the Off-Site Alternative would be subject
to tidal current and river flows similar to the On-Site Alternative. The Off-Site Alternative location is
undeveloped, and there is no vessel operating history or pilot experience for that location. The
available data indicate currents along that portion of the river are reasonably consistent and
predictable. If river conditions were not suitable for turning off the dock, pilots would be able to
turn around departing vessels further upriver at the turning basin shown in Figure 6.4-1.
Operations—Indirect Impacts
Operation of the terminal at the Off-Site Alternative location would result in the same indirect
impacts as at the On-Site Alternative location except project-related vessels would not need to travel
as far upriver (approximately 1.5 miles less) to reach a terminal at the On-Site Alternative location.
6.4.5.3 No-Action Alternative
Under the No-Action Alternative, the Corps would not issue a Department of the Army permit
authorizing construction and operation of the proposed export terminal. As a result, impacts
resulting from constructing and operating the export terminal would not occur. In addition, not
constructing the export terminal would likely lead to expansion of the adjacent bulk product
business onto the On-Site Alternative project area.
The Applicant’s planned operations and expansion, would increase vessel traffic by approximately
eight vessels per year, as described in Chapter 3, Alternatives. Additionally, vessel traffic in the lower
Columbia River is expected to increase over time with continued industrial development along the
river. As assumed for the incident modeling, large commercial vessel traffic would increase over the
analysis period and by 2028 would reach approximately 2,200 vessel trips per year (or
approximately 4,400 transits [Table 6.4-11]). Therefore, there would be an increase in the number
of incidents likely to occur if the proposed export terminal is not built. As shown in Table 6.4-12, the
predicted incident frequency under No-Action conditions would be 19.4 incidents per year, an
increase of 2.8 incidents per year over existing conditions.
Management of vessel traffic on the lower Columbia River will be an ongoing concern for federal
(USCG and Corps) and state (Ecology and DEQ) agencies, local coastal jurisdictions, the Bar Pilots
and River Pilots, maritime associations (such as PDXMEX and MFSA), and private interests even if
the proposed export terminal is not constructed. Vessel traffic volume is expected to be variable
along the lower Columbia River due to economic and market fluctuations, changes in port
infrastructure, and vessel design modifications. The Columbia River VTIS and the Lower Columbia
Region Harbor Safety Committee are both part of a system that functions to adapt to changes in the
nature and the volume of vessel traffic. These systems and studies are in place and would continue
to operate under the No-Action Alternative and help reduce the impacts related to the anticipated
increases in vessel traffic in the lower Columbia River.
6.4.6 Required Permits
No permits related to vessel transportation would be required for the proposed export terminal.