6237340807
TRANSCRIPT

February 23, 2016
Reason for report:
PROPRIETARY INSIGHTS
David Larsen, CFA(617) [email protected]
Steven Wardell(617) [email protected]
Chris Abbott(617) [email protected]
Matt Dellelo, CFA(617)[email protected]
HEALTHCARE IT & DISTRIBUTIONThe Future of HCIT & Digital Health
• Bottom Line: We expect the HCIT and Digital Health sectors tocontinue to be active on a number of fronts in 2016. Providersand plans are focused on population health management, value-based care, wearables, and remote medicine including telehealth.Furthermore, there continues to be a focus on core electronicmedical record (EMR) purchasing, and we expect a modest increasein hospital spending on core EMR solutions in 2016 relative to 2015.Data from our recent MEDACorp survey show that share gainerscontinue to be CERN, ATHN and Epic, while MCK’s Horizon is ashare donor. Deal flow appears to be steady, though Allscriptsand MEDITECH are both performing better than we had expectedaccording to recent survey data, and according to bookings in thecase of MDRX.
• EMR market steady but showing signs of slowing. Based primarilyon our recent hospital survey, we expect 2016 EMR sales activity to beconsistent relative to 2015, though it appears like the overall marketgrowth rate in EMR is slowing given the timing of Meaningful Use. Sharewinners will likely be Cerner (CERN [OP], Epic, and athena (ATHN [MP]).We believe that McKesson (MCK [OP]) and Siemens will be share donors,while MEDITECH appears to be showing improved signs of stability andretention. We are slightly more cautious on CERN given what appears tobe a healthy market, but we estimate that CERN’s growth rate in bookingswill decelerate fairly significantly in 2016. Furthermore, we believe thatthere is a limited pool of Horizon hospitals for CERN to win. We alsobelieve that MEDITECH and Allscripts (MDRX [MP]) are stabilizing andare in some cases competing more effectively against CERN for newclients. Kings College is an example of a MDRX win that we suspectCERN may have included in its bookings forecast for 4Q15.
• The focus Is Population Health Management. The hospitals in oursurvey are indicating a heightened interest in bundled reimbursement,population health management, and revenue cycle solutions. Thereis a de-emphasis on ICD 10s and stages 2 and 3. Share winners forpopulation health will likely be CERN, ATHN, and Epic. We believe thatCERN's win-rate relative to Epic is improving, CERN will likely win sharedue to M&A activity, and ATHN also appears to be well positioned.
• Hospital IT budget remains steady in 2016. In a January 2016MEDACorp survey, and a January 2016 MEDACorp PULSE call, we foundthat hospital CIOs and administrators expect on average to increasetheir spending on ancillary software systems in 2016 in spite of generalmarket concern over pressure on hospital budgets. We see this trend
S&P 500 Health Care Index: 768.01
Companies Highlighted:ATHN, CERN, CPSI, CSLT, DXCM, EVDY, FIT, HQY,
IMPR, IMS, ISRG, MCK, MDRX, NUAN, NVTA, PGND,PODD, QSII, TDOC, VCRA, VEEV, WAGE, WBMD
Please refer to Pages 215 - 217 for Analyst Certification and important disclosures. Price charts and disclosures specific tocovered companies and statements of valuation and risk are available athttps://leerink2.bluematrix.com/bluematrix/Disclosure2 or by contacting Leerink Partners Editorial Department, OneFederal Street, 37th Floor, Boston, MA 02110. Rx trends derived from IMS Health.

HEALTHCARE IT & DISTRIBUTION February 23, 2016
benefiting ancillary system vendors like Nuance (NUAN [OP]), Imprivata(IMPR [OP]), and Press Ganey (PGND [MP]). Leerink Analyst calls withMEDACorp specialists, to further explore this trend, indicated that hospitalCIOs are looking to next-generation ancillary healthcare software systemsto help them grow revenue, reduce costs, and respond to reform, makingthe systems a priority in 2016.
• Pharma brand managers chasing physicians online in 2016;drug pricing pressure not an issue. Pharma brand managers havetraditionally over-indexed their spending on traditional offline ad channelsand under-indexed on online ad channels like web and mobile. Ourrecent discussions with MEDACorp specialists and private companyCEOs indicate that brand managers are shifting their ad spend fromoffline channels to online channels, and we believe that this shift will besubstantial and durable. We believe that online health media publishersWebMD (WBMD [OP]) and Everyday Health (EVDY [OP]) will benefit fromthis trend. The specialists believe that political pressure on drug pricesseen in late 2015 and early 2016 will have no impact on the expectedrobust pharma digital ad spend.
• Big employers like Digital Health benefits in 2016. According tonumerous large-employer benefit leaders who we spoke with, largeemployers are spending more on Digital Health benefits in 2016 becausethese benefits help them achieve their top priorities, like controllinghealthcare costs and assisting employees in being wise consumers oftheir own healthcare in an increasingly high-deductible world. We seethese changes as benefiting Digital Health benefits vendors in 2016,such as Teladoc (TDOC [OP]), WebMD (WBMD), Fitbit (FIT [MP]), andCastlight (CSLT [MP]).
2

TABLE OF CONTENTS
Executive Summary....…………………………………………………………….………………………...…….4
Digital Health Last 12 Months’ Performance………………………………………………………..……….….6
Hospital HCIT Purchasing Trends………………………………………………………………………………..9
The State of the EMR Market
Share Winners and Share Donors
Trends in Hospital Capital Budgets
Revenue Cycle Largely Stable
The Next Era of Investment Post-Meaningful Use
The Future of Population Health Management (PHM)……………………………………………………….34
Background: What is Population Health Management?
CMS as a Trendsetter: How Medicare & Medicaid Trends Influence Private Payment Systems
Key Components of the Affordable Care Act (ACA)
Sizing the Population Health Market Opportunity
Health Information Exchanges (HIEs)………………………………………………………………………….49
Background: What are Health Information Exchanges?
The Rise of Digital Health………………………………………………………………………………….…….56
The Digital Disruption
Digital Health Investment Themes
Digital Health Landscape
Subsector Lifecycles
Drivers Behind the Six Investment Themes
Subsector Overview……………………………………………………………………………………………...76
Consumer & Value-Based Care Solutions (CVBCS)……………………………………………….80
Introduction & Overview
The Global & Domestic Market for CVBCS
CVBCS Market Share
Core SaaS Solutions (CSS)…………………………………………………………………..………95
Introduction & Overview
The Global & Domestic Market for Core SaaS Solutions
CSS Market Share
Telehealth & Remote Medicine (TRM)………………………………………………………..……109
Introduction & Overview
TRM Market Share by Revenue
Wearables & Interactive Devices (WIDs)……………………………………………………..……120
Introduction & Overview
The Global & Domestic Market for WIDs
WID Market Share by Revenue
Private Company Overview & Brief Profiles……………………………………………………………..…..132
Overview
Private Equity & Venture Capital Profiles
Appendix A: Selected Public Company Snapshots Index…………….……………………………………142
Appendix B: Population Health Definitions……………………………………………………………….….187
Appendix C: Digital Health Definitions………………………………………………………………….…….188
MEDACorp Survey…………………………………………………………………………..………………….190
3
HEALTHCARE IT & DISTRIBUTION February 23, 2016

Executive Summary
Cerner Continues to Win Share, Though Growth Is Slowing
According to a recent MEDACorp survey that we commissioned, we believe that Cerner and Epic
continue to win share; however, the growth rate in overall bookings is slowing. We estimate that
approximately 10-20% of hospitals in the U.S. will seek to deploy a new electronic medical record
(EMR) solution at some point in the future, though the largest health systems, in our view, have already
selected an EMR platform and have likely already attested to Meaningful Use. Thus, the growth rate of
core EMR sales will likely slow.
The Future Continues to Be Population Health Management
According to our recent hospital survey, facilities continue to be focused on investing in population
health management (PHM) solutions that will enable them to work through value-based care initiatives
and payment reform tied to the Affordable Care Act. We expect Cerner and athena to win share in the
PHM markets over the next several years. Population health management will likely continue to drive
HCIT purchasing decisions with a focus on Consumer & Value-Based Care Solutions (CVBCS), Core
SaaS Products, Telehealth and Remote Medicine (TRM), and Wearables and Interactive Devices
(WIDs). As providers accept more actuarial risk for care, there will be a greater incentive to enforce
preventive care and health, rather than treating sickness. By 2018, Medicare expects to have ~50% of
payments tied to quality, and we believe that most commercial plans will follow suit.
Consumer and Value-Based Care Is the Future
As the payment model for health exchanges shifts toward value-based payments, CVBCS vendors have
an opportunity to capitalize on the demand for easily accessible information that steers consumers
toward more efficient healthcare. With multi-billion emerging markets and favorable government
regulation to ensure widespread usage of population health-focused services, components of the
healthcare analytics and healthcare social networking & marketplaces subsectors are positioned to
grow in revenue, investments, and size over the next several years.
Tele-Health and Remote Medicine Can Improve Care and Reduce Overall Costs
By offering new digital tools to manage health and create a more efficient communication channel
between providers and patients, TRM solutions have been shown to increase access to healthcare,
improve population health, and reduce healthcare spending by offering low-cost alternative methods to
connect patients and providers. By utilizing user-friendly technological advances within the
telecommunications sectors, TRM vendors can create digital platforms for people seeking healthcare
advice or treatment.
Wearables and Interactive Devices Can Track the Progress of PHM Programs
In monitoring physiological traits in users and aggregating this data into user-friendly mobile apps, WIDs
are able to track the efficiency of preventive, population-based healthcare programs. With the
advancement of smartphone technology and an interest from large technology players such as Apple,
Google, and Samsung, WIDs have the potential to reach a mainstream consumer audience. Fitbit’s
recent success also suggests that investors are confident in the ability for new players to enter and
succeed within this growing market as healthcare plans begin to embrace devices that improve
preventive medicine.
4
HEALTHCARE IT & DISTRIBUTION February 23, 2016

Pharma Brand Managers Will Likely Continue to Seek to Sell to Physicians via Online Methods in
2016
Pharma brand managers have traditionally over-indexed their spending on traditional offline ad
channels and under-indexed on online ad channels like web and mobile. Our recent discussions with
MEDACorp specialists and private company CEOs indicate that brand managers are shifting their ad
spend from offline channels to online channels, and we believe that this shift will be substantial and
durable. We believe that online health media publishers WebMD (WBMD) and Everyday Health (EVDY)
will benefit from this trend. The specialists believe that political pressure on drug prices seen in late
2015 and early 2016 will have no impact on the expected robust pharma digital ad spend.
Big Employers Will Continue to Use Digital Health Solutions to Manage Employee Benefits
According to numerous large-employer benefit leaders who we spoke with, large employers are
spending more on Digital Health benefits in 2016 because these benefits help them achieve their top
priorities, like controlling healthcare costs and assisting employees in being wise consumers of their
own healthcare in an increasingly high-deductible world. We see these changes as benefiting Digital
Health benefits vendors in 2016, such as Teladoc (TDOC), WebMD, Fitbit (FIT), and Castlight (CSLT).
5
HEALTHCARE IT & DISTRIBUTION February 23, 2016

Last 12 Months’ Performance of Public Pure-Plays Digital Health Sector Last 12 Months’ Return: -10%
We combined the 48 public pure-play stocks of the Digital Health sector at equal weight (“EW”) into a
composite index and compared their performance to the S&P 500 Healthcare Index and the NASDAQ
Biotechnology Index. The resulting chart of the Leerink Digital Health EW48 Index shows its relative
performance over the last 12 months. The S&P 500 Healthcare Index has declined about 6% and the
NASDAQ Biotechnology Index has declined about 19%. The Digital Health EW48 Index has declined about
10%. We believe that Digital Health stocks are currently at a good entry point for investors and have room
to rise.
Note: The Leerink Digital Health EW48 Index is comprised of 48 pure-play Digital Health stocks with equal weighting.
IPOs added during the year are treated in the Digital Health Index through rebalancing (include Fitbit, HealthEquity,
Inovalon, Evolent, Press Ganey, Teladoc), as are acquired companies removed (include Merge Healthcare and
MedAssets). Index is last twelve months as of 2/17/16.
Source: Last twelve-month performance per FactSet, 2/17/16.
6
HEALTHCARE IT & DISTRIBUTION February 23, 2016

The Leerink Digital Health EW48 Index is comprised of 48 stocks that we believe trade as pure-plays
benefiting from the investment themes of Digital Health.
Company Name Ticker Leerink Rating
Description
Accretive Health ACHI NR Provides healthcare services
Advisory Board Co. ABCO NR Provides research and analysis to the healthcare industry
Allscripts Healthcare Solutions, Inc.
MDRX MP Provides software for healthcare providers
athenahealth, Inc. ATHN MP Provides internet-based business services for physician
practices
Benefitfocus, Inc. BNFT NR Provides software development services to the healthcare
industry
BioTelemetry, Inc. BEAT NR Operates as a wireless medical technology company, focusing on
the delivery of health information
Care.com, Inc. CRCM NR Provides online services for families
Castlight Health, Inc. CSLT MP Provides healthcare information technology solutions
Cerner Corporation CERN OP Provides healthcare information-technology solutions, healthcare
devices, and related services
Connecture, Inc. CNXR NR Provides web-based information systems used to create healthcare
insurance marketplaces and exchanges.
Computer Programs and Systems, Inc.
CPSI MP Provides information-management services to the healthcare
industry
Craneware CRW-GB NR Engages in the development, licensing, and ongoing support of
computer software for the healthcare industry
DexCom, Inc. DXCM OP Manufactures and markets medical devices and glucose
monitoring systems
eHealth, Inc. EHTH NR Provides health insurance services
Everyday Health, Inc. EVDY OP Provides online health solutions to consumers and healthcare
professionals
Fitbit, Inc. FIT MP Manufactures health activity trackers and smartwatches and
provides a social network
Garmin Ltd. GRMN NR Provides navigation, communication, and information devices
and applications enabled by GPS technology
HealthEquity, Inc. HQY OP Provides health insurance brokerage services
HealthStream, Inc. HSTM NR Provides online continuing education and training solutions.
Healthways, Inc. HWAY NR Provides specialized, comprehensive solutions to help people
improve physical, emotional, and social well-being
Health Insurance Innovations HIIQ NR Provides health insurance marketing and administration
HMS Holdings Corp. HMSY NR Provides cost containment solutions for the government, commercial
insurers, and other organizations
Imprivata, Inc. IMPR OP Provides authentication and access management technology
solutions
IMS Health Holdings, Inc. IMS OP Operates as a global information and technology services
company
Inovalon Holdings, Inc. INOV NR Offers cloud-based data analytics and data-driven
intervention platforms across the healthcare landscape.
Insulet Corporation PODD OP Manufactures, develops, and markets insulin infusion systems
Intuitive Surgical ISRG OP Designs, manufactures and markets robotic technologies
7
HEALTHCARE IT & DISTRIBUTION February 23, 2016

Company Name Ticker Leerink Rating
Description
Invitae NVTA MP Develops genetic diagnostics for hereditary disorders associated with
cancer, cardiology, neurology, and pediatrics
LifeWatch AG LIFE-CH NR Specializes in advanced telemedicine systems
Mazor Robotics Ltd. MZOR-TAE NR Manufactures robotic guidance systems for spinal surgery
MedAssets, Inc. MDAS NR Provides technology-based products and services
Medical Transcription Billing Corp.
MTBC NR Provides medical billing and transcription services
Medidata Solutions, Inc. MDSO NR Provides software clinical technology solutions
MINDBODY Inc. MB NR Operates a cloud-based business management software and
payments platform for the small and medium-sized
businesses in the wellness services industry
Nuance Communications, Inc.
NUAN OP Provides voice and language solutions for businesses and
consumers
Omnicell, Inc. OMCL NR Provides automated solutions for hospital medication and supply
management
Press Ganey Holdings, Inc. PGND MP Provides healthcare performance improvement solutions
Quality Systems, Inc. QSII MP Develops computerized information processing systems
SHL Telemedicine Ltd SHLTN-
CH NR
Specializes in the developing and marketing of advanced
personal telemedicine solutions
Spok Holdings, Inc. SPOK NR Provides wireless messaging, mobile voice and data, and unified
communications solutions
Streamline Health Solutions, Inc.
STRM NR Provides healthcare information technologies and services to
healthcare organizations
Tandem Diabetes Care, Inc. TNDM NR Develops and manufactures medical devices for the treatment of
diabetes
Teladoc Inc. TDOC OP Provides telehealth services via mobile devices, the Internet, video,
and phone to clients and their customers in the United States
Veeva Systems, Inc. VEEV MP Provides industry-specific, cloud-based software solutions for the life-
sciences industry
Vocera Communications, Inc.
VCRA OP Provides wireless communication services
WageWorks, Inc. WAGE OP Provides pre-tax benefits to employers and employees
WebMD Health Corp. WBMD OP Provides health information services
Weight Watchers International, Inc.
WTW NR Provides weight management services
Note: OP - Outperform; MP - Market Perform; UP - Underperform; NR - Not Rated. Index is Equal Weight (EW).
Source: Leerink Partners LLC, FactSet 2016
8
HEALTHCARE IT & DISTRIBUTION February 23, 2016

Hospital Survey – Trends in Capital Budgets and the EMR Market Hospital Survey – EMR Market Appears Intact and Cerner Closing the Gap on Epic
On our behalf, MEDACorp recently conducted a survey of 50 hospital administrators in order to assess
trends in the healthcare technology space. Our primary objective is to determine if there is ongoing
demand in the Electronic Medical Record market, and if so, which vendors stand to potentially gain
share, and which vendors may be susceptible to donating share. We no longer view Meaningful Use as
the key driver of demand; however, the highest quality vendors with a single integrated database such
as Cerner and Epic stand to win new accounts.
Key findings from our survey are as follows:
High quality vendors with an integrated database such as Cerner and Epic will likely continue to
win share. We believe that Cerner will win share from McKesson, Siemens and MEDITECH.
Our data suggest that Allscripts may also lose a few hospitals, and it appears that MEDITECH
may actually win a few McKesson hospitals.
The average quality score for Cerner and Epic declined in 2016 (vs. 2015) based on our
sample data, although they continue to rank well ahead of all other vendors. Overall, scores
generally moved lower but in a few instances where scores did move up it was typically very
modest.
About 28% of integrated delivery networks (IDNs) indicated that at least a few of their hospitals
would convert to a new EMR solution (from 18% in 2015). In total, the survey captured ~21
facilities that are expected to switch vendors (from ~80 in 2015). The majority (64%) of
respondents indicated that these deals will be signed in the future, which was less than in 2015
(89%), which likely highlights an uptick in contracts that were signed in the last 12 months.
In 2015, if we assume that 89% of 80 hospitals would sign clinical EMR deals in the future, then
this would imply 71 facilities that would sign new contract “in the future.” If we assume 64% of
these 21 facilities in our 2016 survey would sign deals in the future, then this implies 13 new
hospital deals in the future. This slow-down in deals is significant in our view.
About 37% of respondents indicated they might convert their financial and administrative
solutions to a new vendor (up from 26% in 2015). The biggest net winner in this area per our
survey was Cerner, followed by Epic. Most of these deals, 67%, are expected to be signed in
the future, with the bulk expected in 2016.
39% of the IDNs plan to buy more hospitals (although only 18 respondents were surveyed with
this question). All of the health systems that plan to be acquisitive indicated they would convert
those facilities to a new clinical platform. 71% of the acquisitive IDNs are currently on CERN,
and we expect consolidation to drive share gains for CERN.
We expect a slight annual decline in the capital budget allocation to HCIT over the next few
years, though the absolute dollars will likely remain stable or increase due to growth in total
capital budgets.
9
HEALTHCARE IT & DISTRIBUTION February 23, 2016

96% of respondents indicated that their employed physicians were already on an EMR solution,
which highlights a fully penetrated market. While greenfield opportunities are limited, 52%
indicated that at least some of their physicians would move to a new vendor, which was up
significantly from 32% based on our 2015 survey. Epic, Cerner and athena are winning share.
A sizable majority of hospitals (72%) ideally want the hospital and physicians on the same
platform, with a single database. While there would be some interest in an “overlay solution”
provided by ATHN, we believe IDNs want a fully integrated system.
34% of respondents are using an external RCM vendor, and we believe the revenue cycle
continues to represent an in-sell opportunity for core vendors and an opportunity for bolt-on
vendors.
Post-MU initiatives will drive bookings longer term, and population health management was
identified as the top priority, with 74% of the IDNs surveyed planning to invest in pop health
capabilities. Spend on initiatives such as pop health, HIEs, ACOs, wireless communications
and bundled reimbursements over the next several years will likely be less than the spend on
adopting core clinical systems from 2010-2014; however, including the electronic health record
(EHR) replacement market, we expect total HCIT spend to continue rising (especially in 2016
and 2017).
Other priorities for hospital capital budgets include infrastructure, clinical HCIT systems,
imaging related solutions and operating room (OR) projects.
Ancillary system investments in 2016 are expected to stay mostly the same relative to 2015.
The top ancillary system investments in 2016 are expected to focus on: clinical documentation
improvements, secure messaging, security, speech recognition & eRx.
Survey Characteristics
The charts below show that our sample of 50 hospitals is composed mostly of community hospitals
(76%) and academic facilities (20%). One of the respondents indicated it was a Critical Access Hospital,
and one was an integrated delivery network (IDN). The respondents were made up of Chief Information
Officers/Chief Technology Officers (CIO/CTO, 54%), individuals that work in the office of the CIO/CTO
(16%), Chief Financial Officers (CFO, 8%), and Chief Executive Officers (CEO, 12%). An important
distinction in this survey is that we did not limit the responses to just Chief Information Officers. In our
view, this is a reasonable way to assess the market because the CIO is just one voice in the Electronic
Medical Record purchasing decision process. 98% of all facility respondents indicated that they would
be participating in all three stages of Meaningful Use.
10
HEALTHCARE IT & DISTRIBUTION February 23, 2016

Source: MEDACorp Survey, “Hospital HCIT Purchasing Trends,” January
2016. Other Includes: CMO, IT Director, Medical Director, CMO/CMIO, and
EVP/CSO.
Source: MEDACorp Survey, “Hospital HCIT Purchasing Trends,”
January 2016. Other Includes: A Critical Access Hospital & IDN.
Sample Captures Over 200 Hospitals
The table below shows various metrics around our sample. While our survey represents ~50
respondents, the average health system represented in our survey has ~4 hospitals and in total the
sample captures 222 facilities. We estimate this is ~4% of the U.S market, which is more modest than in
some of our previous surveys, but still very significant, in our view. The average revenue per facility in
this sample is $621M, with the median being $340M.
Source: MEDACorp Survey, “Hospital HCIT Purchasing Trends,” January 2016
Cerner’s and Epic’s Quality Scores Remain High, But Down Slightly y/y
The table below shows which clinical EMR vendor is used for the “majority” of clinical systems within
each hospital system. You can see that Epic (26%) and Cerner (24%) were mentioned most frequently.
As expected, other systems being used include MEDITECH, CPSI, Allscripts, Siemens, McKesson and
others. In addition to simply asking which vendor the respondents are using, the survey asked them to
rate each vendor they have ever used on a scale of 1-5, with 5 being the best. We include data from our
2013 and 2015 surveys as well, which help show trends on each vendor. It is important to keep in mind
that the actual individuals surveyed likely changed from 2013 to 2015 to 2016, which likely has an
impact on the “overall quality” score given to each vendor.
Chief Executive Officer (CEO), 12%
Chief Information Officer (CIO)/Chief Technology Officer
(CTO), 54%
Office of the CIO/CTO, 16%
Chief Financial Officer (CFO), 8%
Other Administration ,
10%
Which of the following best describes your role? (n=50)
Academic hospital, 20%
Community hospital, 76%
Other, 4%
How would you best describe your institution? (n=50)
Sample Metrics:
Number of
Hospitals
Number of Beds in
Network
Annual Revenue for
System ($ MME)
Average 4.4 797 $621
Median 2 390 $340
Sum 222 39,831 $31,032
Count 50 50 50
11
HEALTHCARE IT & DISTRIBUTION February 23, 2016

Our findings by vendor are highlighted below:
Epic: Epic’s quality score declined fairly significantly from our 2015 survey to 2016. The score went
from 4.2 to 3.7. The number of actual respondents was also fairly robust, with 26 in 2013, 23 in
2015, and 26 in 2016. While Epic still continues to dominate the pack, we believe Cerner has
closed the gap, with its quality score of 3.6 being very close to Epic’s. The decrease in Epic’s score
may reflect frustrations around interoperability, and limited progress around a robust population
health solution, in our view.
Cerner: Cerner’s quality score also saw a modest decrease in our 2016 survey from 3.8 in 2015 to
3.6 in 2016. We suspect that Cerner has made significant investments into the Millennium platform,
and significant progress has been made on PowerWorks and Cerner’s patient accounting solution.
In our view, the lower score is not overly material, but may be impacted by the onboarding of
Siemens and concerns that Cerner’s large Department of Defense contract win might distract
Cerner or take away professional service resources.
MEDITECH: We were somewhat impressed to see MEDITECH’s score remain in the top tier,
although it also declined slightly, from 3.3 to 3.1. If Cerner is going to maintain the momentum it has
gathered in the market, we believe it will need to win share from MEDITECH, which we think has a
high likelihood of happening.
Allscripts: After a significant decline in Allscripts’ quality score from 2013 to 2015, Allscripts
appears to be stabilizing. Its score declined only modestly, from 3.0 to 2.9. We did not distinguish
between Sunrise and TouchWorks in our survey, but overall the stabilization is an incremental
positive, in our view.
McKesson: McKesson Horizon saw a deterioration in quality score from 2.6 to 2.4, which is not
surprising given that McKesson plans to sunset Horizon. Paragon saw a modest improvement in
score from 2.3 to 2.7, which also is not entirely surprising given the incremental investments that
MCK has put into the solution. We believe Cerner and Epic and possibly Allscripts stand to win
market share from McKesson.
CPSI: Computer Programs and Systems, Inc. saw a modest decline in its score, from 2.6 to 2.5. We
were pleased to see that Healthland posted a strong improvement, from 1.7 to 2.3, although both
CPSI and Healthland remain near the bottom of the pack, and we believe that CPSI’s acquisition of
Healthland is unlikely to drive meaningful share gains for CPSI. We expect downstream competition
to put ongoing pressure on CPSI.
Quality Systems: Quality Systems’ score was relatively stable, posting a small improvement, from
2.4 to 2.5. QSII has now divested its hospital solution, and overall the scoring on NextGen likely
represents ambulatory docs (using NextGen) who are part of a larger IDN.
12
HEALTHCARE IT & DISTRIBUTION February 23, 2016

Criteria that Hospitals Care About
In addition to simply asking for a quality score about each vendor, the survey asked respondents what
they liked and disliked about their vendors. While the lists below are not exhaustive or complete, these
are a select sample of responses that gives the investor insight into what makes the difference between
solutions. In this report, we do not break out which vendor received which comments because we
believe that many of the “likes” and “dislikes” are shared by all vendors to some degree. Furthermore,
the quality scores above, in our view, should show the investor how the vendors rank relative to each
other on quality. Some criteria that are valued include: good support/responsive, flexible system with
intuitive workflow, price, and interoperability. Common gripes appear to be: lack of flexibility, nickel and
diming, difficult to use, poor integration and interoperability, outdated, and not innovative.
Vendor Used for
Majority of Clinical
Systems
2016
N for
'Rating'
2016
Rating 1-5
(5 = best)
2016 y/y Trend
2015
N for
'Rating'
2015
Rating 1-5
(5 = best)
2013
N for Rating
2013
Rating 1-5
(5 = best)
Epic 26% 26 3.7 Decline 23 4.2 26 3.9
Cerner 24% 34 3.6 Decline 25 3.8 28 3.4
MEDITECH 18% 29 3.1 Decline 24 3.3 35 3.4
Allscripts / Eclipsys 8% 30 2.9 Decline 24 3.0 29 3.5
McKesson Paragon 6% 27 2.7 Improvement 15 2.3 16 3.3
Siemens 4% 26 2.6 Stable 19 2.6 28 3.4
Quality Systems / NextGen 4% 22 2.5 Improvement 16 2.4 19 2.8
HMS 6% 17 2.5 Improvement 11 2.1 11 2.2
CPSI 4% 20 2.5 Decline 12 2.6 17 2.6
McKesson Horizon 4% 15 2.4 Decline 21 2.6 25 3.2
Healthland 2% 16 2.3 Improvement 9 1.7 13 2.1
Other 12% 18 1.9 Decline 9 3.4 11 2.4
Source: MEDACorp Surveys, “Hospital HCIT Purchasing Trends,” September 2013, March 2015, January 2016
Which vendor does your IDN use for most clinical systems and how would you rate each vendor that you have ever used?
13
HEALTHCARE IT & DISTRIBUTION February 23, 2016

Likes
Keeping up with new regulations
Responsive to emerging needs
Responsive to emergency situations
Quick Response
Integration between modules
Price
Comprehensive
Configurable/customizable
Quick Response to Issues
Ease of use
Vendor engagement
Stability
Service
Better workflow
Very knowledgeable about product
Integrated, Single Patient Chart
Customer centric
Easy to customize
Vendor is willing to listen to the
customer
Breadth of functionality
Ease of use/flexible
Ease of use, features and functions
Delivers what is sold
Integrated throughout
Good support
Dislikes
Inflexible
Interoperability is weak
"Nickel and dime" for small changes
Haggling in times of crisis
Lack of integration
Slow to adopt innovation
Responsiveness
Expensive
Difficult to use
Inter-operability struggles
Limited customization
Overly complex
Hard to get changes made
Hard to implement
Slow to market with newer
technologies
Cumbersome to design and build
Multiple databases
Interface challenges
Too many clicks
Archaic programming platform upgrade
failures
Revenue Cycle Management
Too many upgrades and down time
Costs
Not user-friendly
Source: MEDACorp Survey, “Hospital HCIT Purchasing Trends,” January 2016
McKesson and Siemens Are Losing Share
Within the sample, each respondent was asked if any hospitals in their respective IDNs will switch
clinical EMR vendors. Fourteen of 50, or 28%, of IDNs indicated that they have at least a few hospitals
that would switch EMR vendors, which is up from ~18% of the respondents in our 2015 hospital survey.
In our view, McKesson and Siemens are the most likely to see customer attrition. The number of total
facilities identified by respondents also declined significantly from 80 to 21. The 2015 results included
one respondent who indicated 50 facilities would switch vendors, and another indicated that 16
hospitals would convert. 9% of facilities in our 2016 survey indicated they would convert to a new EMR
solution which is consistent with the 9% reported in our 2015 survey.
14
HEALTHCARE IT & DISTRIBUTION February 23, 2016

Source: MEDACorp Survey, “Hospital HCIT Purchasing Trends,” January 2016
Of the 14 IDNs in the sample that indicated an EMR replacement would occur, about 64% of them
stated that this deal would be signed in the future, while 36% of them have already signed contracts.
Most of the contracts are expected to be signed in 2016 (or the next 12 months), although some are
expected to occur in 2017. This 64% figure is lower than the ~89% reported in the 2015 data.
Source: MEDACorp Survey, “Hospital HCIT Purchasing Trends,” January 2016
Existing Vendor Vendor will be Switching to
Allscripts / Eclipsys Epic
Allscripts / Eclipsys Epic
Cerner Cerner
McKesson Horizon Epic
McKesson Horizon Cerner
McKesson Horizon Cerner
McKesson Horizon MEDITECH
McKesson Paragon MEDITECH
MEDITECH TBD - In selection process
Prognosis EcW
Siemens still evaluating
Siemens Cerner
Siemens Cerner
Siemens Either Cerner or EPIC
Yes, 28%
No, 72%
Will any of the hospitals in your network be switching to a new clinical IT vendor? (n=50)
What Year? #
2016 6
2017 3
Total 9
Already signed, 36% Will be signed in
future, specify calender year:, 64%
Has that deal already been signed or will it be signed in the future? (n=14)
15
HEALTHCARE IT & DISTRIBUTION February 23, 2016

Cerner Expected to Win Share, Siemens, Horizon and Allscripts Losing Share
In the table below, we highlight which vendors we expect to win share and which ones may lose share,
based on the data in our survey.
Cerner: The most striking finding in the data shows that of the IDNs switching clinical IT
vendors, ~9 hospitals will convert to Cerner. Most of these will come from McKesson Horizon or
MEDITECH; and Cerner has acquired Siemens Health Services. Based on the most recent
data, Cerner is not expected to lose any hospital customers (the one loss indicated that it was a
switch from Cerner to Cerner), while Allscripts may lose 2 and Siemens may lose 5. Overall the
results are relatively stable compared to our 2015 survey, although more of Cerner’s wins are
coming from a McKesson Horizon customer in our most recent survey (vs. MEDITECH in our
2015 survey). This may be due to the new platform the MEDITECH has been deploying to its
client base.
Siemens: In our 2013, 2015 and 2016 surveys, we show Siemens losing a fairly significant
number of facilities, which reflects a steady degradation of the Siemens base. Following
Cerner’s acquisition of Siemens, we believe CERN is best positioned to win share.
Management recently indicated that Cerner converted 40+ Siemens hospitals to Cerner in
2015.
Epic: In 2013, Epic had shown ~27 facility wins, although the 2016 and 2015 data both show
just 3 facility wins. Epic appears to have a very sticky customer base with no replacements
expected. While we still believe that Epic is the Cadillac, with the highest “quality scores,” we
also believe that Cerner is catching up.
MEDITECH: While MEDITECH is expected to face ongoing facility losses, the net wins/losses
appears to be stabilizing, which reflects a significant improvement relative to the win/loss ratio
from our 2015 and 2013 surveys.
Allscripts: We show Allscripts losing 2 facilities in the 2016 data (vs. 3 losses in the 2015
data). Overall we believe it remains a challenge for Allscripts to win share.
McKesson: Share losses for Horizon are picking up, which is not unexpected given
McKesson’s commitment to sunsetting the system. None of the 74 Horizon facilities indicated
that they would switch to Paragon, which suggests that customers may not have faith in
McKesson’s long-term commitment to the healthcare technology hospital market after their
experience with Horizon.
Quality Systems, CPSI, and Healthland: These vendors appear stable in terms of net
retention based on the survey data. There is little change from the 2013 or 2015 results. While
they may not lose meaningful share, we believe the customer bases will remain stagnant.
16
HEALTHCARE IT & DISTRIBUTION February 23, 2016

Some Conversion for Financial and Administrative Solutions Exists Too, Many Slated for 2016
In the chart below, we show that of the 49 IDNs that responded in 2016, about 37% said that they would
switch their financial and administrative solution, which is up from 26% that said they would switch
vendors in 2015. Based on the data in our survey, we believe that in many cases, in an ideal world,
hospitals would like their financial and clinical systems to be on the same platform, which improves
clinical and financial integration. Some hospitals indicated Horizon or Siemens was going to be sunset.
Source: MEDACorp Survey, “Hospital HCIT Purchasing Trends,” January 2016
Cerner is expected to win share based on both the 2015 and 2016 data, although the gains are less
pronounced based on the 2016 data. Siemens and McKesson Horizon are expected to be the biggest
share losers. Epic showed a sharp increase in 2013, but the 2015 and 2016 data show smaller (but
steady) gains, and strong ongoing retention. We are somewhat surprised that Paragon isn’t winning
more business.
Existing Vendor Vendor will be switching to
Allscripts / Eclipsys Epic
Cerner Cerner
Cerner Not determined
Healthland MEDITECH
McKesson Horizon Epic
McKesson Horizon Not yet determined
McKesson Horizon Cerner
McKesson Horizon MEDITECH
MEDITECH Infor (Lawson)
MEDITECH Cerner
Various Cerner for Rev Cycle & Lawson for skin
FundWare / 3M Quality Systems / NextGen
GE Cerner
Prognosis PeopleSoft
IDX Cerner
Siemens still evaluating
Siemens MS GP
Yes, 37% No, 63%
Will any of the hospitals in your network be replacing their financial and administrative systems? (n= 49)
17
HEALTHCARE IT & DISTRIBUTION February 23, 2016

Source: MEDACorp Surveys, “Hospital HCIT Purchasing Trends,” September 2013, March 2015 & January 2016
Of the financial and administrative deals highlighted and captured in our survey, the majority of IDNs
indicated that these would be signed in the future (67%). This is another positive indicator for bookings
for companies that stand to win share, namely Cerner, and overall 2016 appears to be an active year.
The most typical reasons provided for new financial systems are integration with the clinical systems, or
the old system is being sunset (i.e., Horizon or Siemens).
Source: MEDACorp Survey, “Hospital HCIT Purchasing Trends,” January 2016
What Year? #
2016 7
2017 2
2018 2
2019 1
Total 12
Already signed, 33% Will be signed in the future, specify calendar
year:, 67%
When will the Deal for a new Financial and Administrative Vendor Be Signed? (n=18)
18
HEALTHCARE IT & DISTRIBUTION February 23, 2016

Replacement Activity Will Occur Due to Consolidation Activity -- Cerner Best Positioned
The survey asked 18 respondents who are making financial system changes if they plan to acquire
more hospitals in the future and, if so, will they convert those facilities onto a new Clinical platform. 39%
of the IDNs (7) indicated that they would be acquiring new facilities, and all of them indicated they would
convert those facilities onto a new clinical platform. Cerner appears to be well positioned to win share as
a result of hospital consolidation, with 5 of the 7 (71%) that plan to acquire hospitals currently on
Cerner.
Source: MEDACorp Survey, “Hospital HCIT Purchasing Trends,” January 2016
There May Be a Slight Decline in Capital Budget Allocation to HCIT, but Total HCIT Spend Rising
The survey also asked respondents what their capital budget was in the past year, and what those
budgets are expected to be in 2016, 2017, 2018, and 2019. Overall, while capital budgets themselves
will likely rise over the next few years, the percent allocation to HCIT, we believe, will steadily decline.
Growth in total capital budgets should outpace the slight decline in allocation to HCIT, and overall we
expect HCIT budgets to increase modestly in 2016 and 2017 (on an absolute dollar basis).
Source: MEDACorp Survey, “Hospital HCIT Purchasing Trends,” January 2016
indicated they would convert the IT systems to their existing vendor
Consolidation Drives Conversions
Winners:
Cerner (5x)
Epic (1x)
TBd (1x)
7 indicated they would acquire new hospitals, all of which
Yes, 39%
No, 61%
Will your IDN acquire more hospitals in the future? (n=18)
2015 2016 2017 2018 2019
Capital Budget - Mean $25,027,449 $29,398,571 $30,569,375 $34,944,787 $34,739,130
y/y change NM 17% 4% 14% -1%
Capital Budget - Median $6,600,000 $9,700,000 $9,950,000 $10,000,000 $10,000,000
Percent to HCIT 20.8% 17.9% 17.4% 16.9% 17.7%
HCIT Estimate $5,210,715 $5,268,224 $5,321,567 $5,896,933 $6,156,957
y/y change NM 1% 1% 11% 4%
Note: Two responses in 2017 were edited by Leerink from $400M to $40M because it appears like the $400M was a typo.
Source: MEDACorp Survey, "Hospital HCIT Purchasing Trends", January 2016
What is your capital budget in each of the following years and what percentage do you
expect to be allocated to HCIT?
19
HEALTHCARE IT & DISTRIBUTION February 23, 2016

Overall we believe that most hospitals have invested very large dollars already in getting up to
Meaningful Use standards. While there are always exceptions, we believe the Greenfield opportunity is
complete, and incremental spend on HCIT will likely come from upgrades, replacements and post-
Meaningful Use initiatives, such as pop health, mobile, rev. cycle, etc.
Comments around the trends highlighted above are as follows:
Replacing major systems
Normal growth
We see upgrades and enhancements in the pipeline for our HCIT systems
Major IT expenditures have been made
Currently installing new EMR
We will be implementing a few new items (BI and accounting) in the 2016 calendar year.
2017 will have higher percentage as well as we continue long term plan to migrate to MEDITECH 6.0
IT expenditures are typically refreshed each year at 20%. In other words, assets are completely replaced
every 5 years to normalize annual spend.
Merger with another system
expansion
We have replaced all our core systems with Epic. Much of the capital will now be implementation labor for
new add-on modules, though there will be some new software purchases
In 2016 and 2017 we will be purchasing and implementing the 6.1 MEDITECH upgrade
We should be at a point that we are reducing costs because we will be fully functioning at meaningful use
IT spend will be flat to lower in the next couple of years. In 2017, considering a new Acute Care facility.
Spending after that will flat in ᾽18 then increase in ᾽19 to support managed care initiative (Total Cost of
Care).
Large investment was made in EMR for 2015. Planning replacement with hosted service model
Source: MEDACorp Survey, “Hospital HCIT Purchasing Trends,” January 2016
Bookings Growth May Hold Up in 2016
The survey asked respondents how they expect the value of their signed contracts (i.e., bookings) to
compare to 2013 (a relatively high year) as we progress through the next few years. The number of
respondents that indicated an increase was highest in 2016, with 64% of the respondents expecting an
increase. This figure then declines slightly to 56% in 2017 and 2018. The number of IDNs that expect
the value of signed contracts to stay the same fluctuates up and down, year to year. The strongest
correlation over the 4 years is a growing number of IDNs that expect a decrease in the total value of
signed contracts in each subsequent year. In general, the anticipated increases appear to be most often
related to adding incremental modules and functions, addressing population health and risk-based
contracts and adding new licenses. Many contracts also have an “inflation clause” or “escalators” in the
contract that result in increases to maintenance. Some of the responses also noted that costs would be
higher since they were switching vendors, or upgrading systems.
20
HEALTHCARE IT & DISTRIBUTION February 23, 2016

Source: MEDACorp Survey, “Hospital HCIT Purchasing Trends,” January 2016
The Vast Majority of Employed Docs Have an EMR Already
The survey asked respondents if their employed doctors already have an EMR. Similar to the 2015
survey, almost all of the respondents (96%) indicated that the majority of their employed doctors have
already selected the clinical EMR system they will use to attest to MU. In our view, this means that for
large employed groups at hospitals, the market is replacement only, and there is really no Greenfield
opportunity remaining. While we believe the market is mostly penetrated, most IDNs believe it is
important to have community physicians on the same IT platform as the local hospital (72%), and in our
view this factor will be a key driver of market share shifts in the replacement market for ambulatory
docs.
Source: MEDACorp Survey, “Hospital HCIT Purchasing Trends,” January 2016
58%64%
56% 56%
6% 8%12%
16%
36%
28%32%
28%
0%
10%
20%
30%
40%
50%
60%
70%
2015 2016 2017 2018 2015 2016 2017 2018 2015 2016 2017 2018
Estimated Growth (or Contraction) in Value of Signed Contracts vs. 2013 (n=50)
Increase vs. 2013
Decrease vs. 2013
Stay the Same vs. 2013
Yes, 96%
No, 4%
For the majority of your employed doctors, have they already selected the clinical EMR
system that they will use to attest to Meaningful Use? (n=50)
Yes, 72%
No, 28%
Is it important for the physicians in the community (employed or affiliated) to be on a local hospital’s IT platform in order to be able to participate in ACO’s, bundled reimbursement and other population
health related item? (n=50)
21
HEALTHCARE IT & DISTRIBUTION February 23, 2016

Epic and Cerner Also Poised to Win More Share in 2016 in the Physician Office Space
In the table below, we show how surveyed hospitals responded to the questions around which EMR
vendor their physicians were currently on, and which ones they expect their physicians to move to. Over
50% of the respondents (26 out of 50) indicated that at least some of their physicians would move to a
new vendor. This was up significantly from 32% of the respondents in 2015. Epic was mentioned most
frequently as a possible share winner, followed by Cerner, while share losers may include Allscripts,
eClinicalWorks, McKesson and Quality Systems (NextGen). Relative to 2015, the number of Epic wins
and the number of athena wins increased the most in our 2016 survey. Several of the free-text
comments around why changes might occur included things such as “All practices are put on Athena at
time of acquisition,” and “integration with hospital system,” and “Athena works well and is cost effective,
and will communicate with CPSI on hospital side,” and “we use a variety of outpatient systems currently
across an employed group of 300+ providers. The plan is to consolidate to Cerner” and “some NextGen
doctors will switch to Epic.”
Source: MEDACorp Survey, “Hospital HCIT Purchasing Trends,” January 2016
Vendor
2016
Existing
Vendor
2016
Vendor
will be
Switching to (n=26)
2015
Existing
Vendor
2015
Vendor
will be
Switching to
Epic 28% 23% 22% 14%
Cerner 18% 19% 12% 18%
Athena 20% 12% 6% 6%
Allscripts 14% 4% 24% 12%
eClinical 12% 4% 10% 0%
Eclipsys 4% 0% 4% 0%
GE Centricity (IDX) 10% 0% 8% 0%
Greenway 6% 0% 6% 0%
McKesson 10% 0% 6% 2%
Micro MD 4% 0% 0% 0%
Quality Systems (NextGen) 12% 0% 12% 4%
Sage 0% 0% 0% 0%
I don’t know 2% 15% 2% 26%
Other 14% 23% 16% 6%
Nuance 4% 4%
Press Ganey 4% 4%
Imprivata 4% 4%
Which vendor(s) are your employed doctors using now (check all) and if they will be
switching to a new vendor which will they be switching to (check all that apply)?
Other: Meditech (2x); Amazing Charts (1x); Cerner or EPIC (1x); E-MDs (1x); Healthland Centriq (1x); Home grown (1x);
Medent (1x); NextGen (1x); Selection has not yet been made (1x); Sigmund (1x); Thrive (1x)
22
HEALTHCARE IT & DISTRIBUTION February 23, 2016

Most Hospitals Want an Integrated Solution
In the chart below, we show that 72% of respondents believe that it is important for physicians in the
community to be on the local hospital’s IT platform in order to be able to participate in ACOs, bundled
reimbursement, and various population health management related initiatives. This is down slightly from
78% in our 2015 survey. We believe that Cerner and Epic continue to win share in the market because
their solutions truly are a single integrated database across both the inpatient and ambulatory markets
that they serve.
We believe that most hospitals would prefer a single database, integrated solution, though interfaces do
in many cases work, and a single-database solution is not absolutely required to participate in these
types of arrangements. It appears there is a growing contingent of IDNs that are willing to integrate
systems as efforts to communicate across disparate EMRs continue to expand (e.g., CommonWell). A
few of the responses that we received in the “free text” portion of our survey were as follows:
“Makes sharing info and coordinating care easier.”
“Easier sharing of complete records or patient care and easier referrals between doctors.”
“It would be nice, but certainly not a requirement.. Just necessitates additional data mining.”
“It is important for continuity of care, reduced 'repeat' exams and to meet ACO.”
Source: MEDACorp Survey, “Hospital HCIT Purchasing Trends,” January 2016
ATHN’s Inpatient Strategy Should Help it Get More Looks, but Still an Uphill Battle
In our view, the desire for IDNs to be on a single platform across inpatient facilities and doc practices is
why athenahealth has entered into the inpatient space with its acquisition of RazorInsights (and Beth
Israel Deaconess Medical Center’s WebOMR platform). Once athenahealth builds its inpatient solution
based on WebOMR and RazorInsights, we believe the new athenaNet will be able to deliver a fully
integrated, single database solution for both physicians and hospitals. However, this process and new
development initiative will take time. The survey asked respondents if they would be willing to consider
athenahealth if ATHN provided their IDN customers with an “overlay” product that wraps around the
core mainframe solution of a hospital, and provides one user interface via athenaNet. About 42% of the
IDNs who think it’s important for docs and hospitals to be on the same IT platform would consider ATHN
if there is a “front-end” inpatient solution that would tie together docs and hospitals. Overall, the
responses to our 2016 survey were relatively consistent with the 2015 responses.
Yes, 96%
No, 4%
For the majority of your employed doctors, have they already selected the clinical EMR
system that they will use to attest to Meaningful Use? (n=50)
Yes, 72%
No, 28%
Is it important for the physicians in the community (employed or affiliated) to be on a local hospital’s IT platform in order to be able to participate in ACO’s, bundled reimbursement and other population
health related item? (n=50)
23
HEALTHCARE IT & DISTRIBUTION February 23, 2016

Source: MEDACorp Survey, “Hospital HCIT Purchasing Trends,” March 2015 and January 2016
Source: MEDACorp Survey, “Hospital HCIT Purchasing Trends,” January 2016
Revenue Cycle Activity Largely Stable, Penetration Growing Slowly
There has been a slow but steady uptake in revenue cycle solutions, with 34% of the respondents in our
2016 MEDACorp survey indicating that they currently use an external vendor to assist with aspects of
the revenue cycle function. This is up slightly from 32% in 2015 (and 28% in 2013). We think that the
actual number is far higher, as everyone uses some form of software for electronic claims
transmissions, and scrubbing of claims data. We suspect that these figures represent broader and
larger scope arrangements in the revenue cycle space, such as outsourced Billing and AR. Overall, we
continue to believe there is meaningful revenue cycle in-sell opportunity for core HCIT vendors within
existing customer bases.
2016 (n=39)
Yes, we are likely to consider Athena 25%
No, this doesn’t make a difference; we want the hospital and doctors on one platform 58%
We would consider Athena, but we’d still be more likely to go with another IDN solution 17%
21%
56%
23%
2015
If Athena Health offers a solution to your physicians that would cover the “front-end” of a hospital, inpatient EMR solution,
though the back-end is still a different vendor such as Meditech, Cerner, or Epic, would this be enough for you to include
ATHN Athena in a network wide IDN EMR proposal and would this make you more likely to purchase consider Athena Health
for physician clinicals and a hospital solution?
• Epic already in place for all • Prefer a fully integrated environment but willing to review pro and cons
• new EMR • reputation and confidence
• change is difficult for our providers • better product
• Full integration at the very core of the EMR platform is key for us. • better for integrated system
• Lower TCO for one system • Parent company has network standard
• System integration is key
• single platform drives the same clinical alerts and workflow
• we want single source vendor if possible
• good product, we are too deep • If the user interface is easy for clinicians to navigate
• Don't believe it would be viable for a number of years for large IDN's • We are there already
• The investment to date is just too large • It would meet our needs
• simplicity. reduce complexity. costs. • They have a great solution.
• So much easier for caregivers to use the same system across all care settings • We are currently exploring Athena offerings.
• we will be going with a fully integrated DB and application solution • Already have it
•it is important to have the same information available through out the delivery system
• I'd want to see the solution and how it's handled both at the front end; and how
simply it works with another vendor in the backend.
• Our selections are needs based and our clinical surveys are showing a single record is
most important to our providers
• Some of our outreach practices use Athena and if it would make their access to
our data more seamless, we'd consider moving to them.
• Want an integrated system • What is the annual costs?
• We are satisfied with Epic's higher enterprise level platform
• We do not want to have to manage multiple contracts and systems. More importantly,
the problem of integration of patient information and how that affects care is minimized
with the same vendor across the enterprise.
• I think the key question is would an Athena solution be viable for non employed docs in
order to work along side Epic for our employed docs, in order for both to coexist
optimally in an ACO
No, this doesn’t make a difference; we want the hospital and doctors on one
platform
We would consider Athena, but we’d still be more likely to go with Epic or
Cerner or another IDN solution
Yes, we are likely to would consider Athena
24
HEALTHCARE IT & DISTRIBUTION February 23, 2016

Source: MEDACorp Survey, “Hospital HCIT Purchasing Trends,” September 2013, March 2015, January 2016
Use of Various Vendors Appears Somewhat Stable
In the table below, we show which vendors are being used for revenue cycle functions, and we compare
the results from our 2016 survey to our results from 2015 and 2013. Given that just 17 respondents
used a revenue cycle management (RCM) vendor in 2016, 16 respondents used a RCM vendor in
2015, and just 14 used a RCM vendor in 2013, it is difficult to draw any hard conclusions from the data.
Overall, MedAssets continues to have the highest penetration, and Advisory Board, Emdeon and
athenahealth are all more heavily represented in our 2016 survey (relative to 2015). There also appears
to be a movement away from McKesson and Epic, and a slight move toward Advisory Board. The
category “Other” was lower in 2016, moving from 31% in 2015 to 18% of respondents in 2016. This may
reflect an ongoing shift toward the more established vendors. We were somewhat surprised that Epic is
not represented at all in our 2016 survey, and McKesson also received fewer mentions (in 2016 vs.
2015).
Source: MEDACorp Survey, “Hospital HCIT Purchasing Trends,” September 2013, March 2015, January 2016. In 2016,
“other” includes: Cymetrix (1x); Faircode (1x); Praxis (1x).
2016 2015 2013
Yes 34% 32% 28%
No 66% 68% 72%
Are you currently using an external vendor to assist you
with any aspects of the revenue cycle function?
Vendor
2016
(n=17)
2015
(n=16)
2013
(n=14)
MedAssets 29% 25% 50%
Advisory Board 18% 0% 21%
Emdeon 18% 6% 7%
Accretive Health 12% 13% 14%
Athena 12% 6% 7%
Cerner Revenue Works 6% 0% 7%
McKesson Revenue Cycle Services 6% 19% 0%
CPSI 6% 6% 7%
Epocrates 0% 0% 0%
Omnicell 0% 0% 0%
EPIC 0% 13% 0%
MedeAnalytics 0% 0% 0%
Passport 0% 6% 0%
Patient Keeper 0% 0% 0%
PatientSafe Solutions 0% 0% 0%
Other 18% 31% 29%
Which vendor (s) are you using for revenue cycle? Please select all that apply.
25
HEALTHCARE IT & DISTRIBUTION February 23, 2016

No Clear Trend on Revenue Cycle Purchasing Patterns
Within the survey, respondents were also asked if they plan to purchase more or fewer services and
products from their revenue cycle partners. Most respondents indicated that they would purchase “the
same” or “less” services from their vendors. In some instances, it was hard to directly tie the responses
to a single vendor since respondents were asked to select all revenue cycle vendors they use.
Advisory Board: Our 2016 survey captured 3 users on Advisory Board, and 2 indicated they
expected to purchase “more” in the future, while one expects to purchase “less”. The one
expecting to purchase less stated that they “want to see how Cerner’s rev cycle product can
perform”.
MedAssets: MedAssets had 5 users in our survey, and the vast majority (4 out of 5) indicated
that they would buy “the same” from MedAssets over time, while one indicated “more”.
Accretive Health: There were 2 respondents for Accretive Health, with one indicating they plan
to purchase “the same” and one planning to purchase “more” from their vendor. Overall, this
represents an improvement from last year’s survey, and it appears that some of Accretive
Health’s challenges may be stabilizing.
Other vendors: Interestingly, those using ATHN and Cerner expect to purchase less from their
vendors, while the one hospital on CPSI expected to purchase more. Overall, we continue to
believe that many hospitals will look to their core EMR and financial or administrative solution
vendor to build various RCM capabilities, although there still appears to be demand for best-of-
breed vendors.
Source: MEDACorp Survey, “Hospital HCIT Purchasing Trends,” January 2016
Other Initiatives Will Drive Bookings Longer Term – Population Health a Top Priority
In the table below, we show what other areas hospitals plan to invest in beyond Stage 1, and we
compare the data to our 2015 and 2013 results. While our sample size is limited to 50 facilities, in our
view the data are interesting and make sense. A few of the key points in our view are:
The number of respondents indicating that Population Health Management is an area of
investment has continued to rise steadily from 32% in 2013, to 62% in 2015, and 74% in 2016.
In our view, it is likely that in 2014 many hospitals invested into Core IT systems and they are
now shifting focus toward changing reimbursement models and pop health. The average spend
Vendor Less Same More
MedAssets 4 1
Advisory Board 1 2
Emdeon 2
Accretive Health 1 1
Athena 2
Cerner Revenue Works 1
McKesson Rev Cycle Services 1
CPSI 1
Other 2 1
subtotal 6 9 5
Will you purchase more or less from your revenue
cycle vendor in the future?
Less30%
Same45%
More25%
Will you purchase more or less from your revenue cycle vendor in the future?
(n=17 respondents with 20 solutions used)
26
HEALTHCARE IT & DISTRIBUTION February 23, 2016

for pop health is expected to be ~$2M, which represents a meaningful overall opportunity, in
our view.
ACOs are becoming less of a prioritization, which is somewhat surprising in our view, although
they remain near the top of the list of priorities. 34% of the respondents in 2016 selected ACOs
vs. 50% in 2015. We expect an ongoing shift to value-based care models, although it’s possible
that early ACO challenges have led IDNs to evaluate alternative models.
The number of mentions related to ICD 10s (a diagnosis and procedure coding system)
declined dramatically from 64% in 2015, to 24% in 2016. In our view, this makes sense since
the ICD 10 deadline of October 1, 2015, has now come and gone with relatively limited fanfare.
We no longer view this as a top priority.
Stage 3 also declined, although it is still a top item on physicians’ minds. This makes perfectly
good sense because we are now 5+ years into the Meaningful Use program.
Patient Access Revenue Cycle Apps and Back-end revenue cycle apps appear to be less of a
priority, although they are also expected to be areas of higher spend.
The required dollar investment for each of these categories appears fairly high to us. On average,
$700K per category, in our view, is significant.
Core Vendors Likely to Win – Cerner, Epic and Athena Received Most Mentions
With respect to the vendors that will win business tied to population health management and other
projects beyond Stage 1, we believe that core vendors such as Cerner, Epic and athena will win the
majority of these deals. There were also a significant number of “unknown for now” responses as well
as “other.” In our view, this implies that various third-party software solutions that may typically be
considered “bolt-ons” will win some business. A wide range of third-party solutions were mentioned, but
Project 2016 2015 2013Mean
2016
Median
2016
Population Health Management 74% 62% 32% $1,985,588 $750,000
Stage 3 Items 44% 52% 56% $940,882 $300,000
Health Information Exchanges 44% 44% 48% $285,450 $162,500
ACOs 34% 50% 46% $1,078,125 $750,000
Wireless Communication 32% 32% 34% $1,080,000 $250,000
Bundled Reimbursement 28% 18% 14% $653,462 $100,000
ICD 10s 24% 64% 76% $267,727 $50,000
Patient Access Revenue Cycle Apps 24% 12% 12% $2,245,000 $300,000
Back-End Revenue Cycle Apps 16% 8% 8% $2,742,857 $300,000
Denials Management 16% 18% 10% $410,714 $200,000
Charge-master Related Products 12% 8% 10% $422,500 $125,000
Stage 2 Items 10% 40% 56% $116,667 $100,000
None 4% 6% NM NA NA
Other 0% 0% 2% NA NA
Source: MEDACorp Survey, “Hospital HCIT Purchasing Trends,” September 2013, March 2015, January 2016
Note: One respondent entered $150M for "Patient Access rev Cycle apps, and Back-end rev cycle apps
but responded $15M for all the others. We changed $150M to $15M which we believe was intended.
Which projects will your hospital invest capital into in order to build or expand HCIT
27
HEALTHCARE IT & DISTRIBUTION February 23, 2016

often as a group of vendors that were being considered for a specific solution. When the core vendor
was mentioned, there tended to be greater commitment to the decision.
Source: MEDACorp Survey, “Hospital HCIT Purchasing Trends,” January 2016
Total Required Dollars for Post-Meaningful Use Initiatives Less Than MU Spend
In the table below, you can see that according to survey respondents from 2010 through 2014, on
average hospitals would invest $5.6M into Meaningful Use related items, with a median value of $2.0M.
Over the timeframe 2015 through 2018, the average required investment is expected to be $3.5M and
the median is $2.0M. These dollar amounts are much lower than in our 2015 survey, which found an
average investment of $9M from 2010-2014 for MU related purchases and ~$10.9M from 2015-2018 for
post-MU initiatives. A few large IDNs can skew the average, and it’s possible the median gives a more
accurate view. While investments in post-MU initiatives may be flat or down on average, overall we still
view the anticipated dollar spend as meaningful. Additionally, the estimated spend on non-Meaningful
Use related initiatives doesn’t account for full system replacements that many of the respondents are
planning. When accounting for system replacements, we estimate that total HCIT investments will
increase significantly.
Source: MEDACorp Survey, “Hospital HCIT Purchasing Trends,” January 2016
Vendor Mentions for items listed above:
Vendor 2016
Cerner 8
Epic 5
athena 3
Cisco 3
Phytel 2
MedHost 2
meditech 1
Medicity 1
CPSI 1
Advisory Board 1
Explorys 1
Evolent 1
MedVentive 1
Verisk 1
Optum 1
Craneware 1
RelayHealth 1
Premier 1
eClinicalWorks 1
Priority Mean Median Estimated MU Investments 2010 - 2014 $M (n=48) $5,644,250 $2,000,000
Estimated Investments in Initiatives Above 2015-2018 (n=48) $3,476,250 $2,000,000
How do these investments compare to Meaningful Use Spend?
28
HEALTHCARE IT & DISTRIBUTION February 23, 2016

Many of These Investments Expected to Occur in 2016 and 2017
The chart below shows when many of these investments in other initiatives will be made. As a reminder,
the total sample size for the survey is 50 respondents. The most heavily responded item is Population
Health Management, which had 74% of respondents indicate that they will make investments in this
area, mostly in 2016 and 2017. We were also pleased to see that 40-50% of hospitals will need to invest
in Stage 3 and health information exchanges (HIEs), while Stage 2 spend is largely now in the rear-view
mirror.
Source: MEDACorp Survey, “Hospital HCIT Purchasing Trends,” January 2016
Top IT Initiatives for 2015-2016 Appear to be Full System Replacement, and Pop Health
We also asked respondents about their top IT Investment priority in 2015 and 2016, and there were a
wide range of priorities, but the most common responses were: system replacement, population health,
better analytics, security, Meaningful Use Stage 3, and interoperability. Interestingly, the average
anticipated spend on these top priorities was found to be $8.9M, which is significantly more than the
~$3.5M in average estimated spend on post-MU initiatives from 2015-2108.
0
5
10
15
20
25
30
35
40
# o
f R
esp
on
ses
(n=5
0)
When will you invest in these Initiatives?
2020
2019
2018
2017
2016
2015
29
HEALTHCARE IT & DISTRIBUTION February 23, 2016

Source: MEDACorp Survey, “Hospital HCIT Purchasing Trends,” January 2016
More Detail on Capital Budgets
In the chart and table below, we show investors incremental detail around capital budget expectations.
About 28% of respondents indicated that over the next 12 months they expect their capital budgets, in
totality, to increase. The sizable majority, 72%, indicated that they believe capital budgets will remain
relatively fixed, and none of the respondents expect to see a decrease.
Why? Estimated Cost
• Execute a mega-suite solution for replacing McKesson Horizon and all Allscripts
products
• McKesson product is being sunset and the McKesson replacement solution is not
viable$95,000,000
• total EHR Replacement, $50M • Contract expiration $50,000,000
• New EMR selection 40M • Need to evolve $40,000,000
•Replacing Ancillary Systems, Data Warehouse, Analytics, Population Health
• Replacing old systems - ancillary
Leveraging data for ACO/Pop Health$40,000,000
• System replacement • Need new environment $30,000,000
• data lake and information exchange • risk stratification and clinical information exchange $25,000,000
• Lawson ERP implementation • Huge process improvement and ROI $11,000,000
• Security • Threat environment $10,000,000
• Clinical systems integration • Improve communication between inpatient and outpatient areas $10,000,000
• interoperability • due to ongoing reporting demands $8,000,000
• meaningful use • Get funds $5,600,000
• Oncology module • Too many safety events related to chemo administration $5,000,000
• Population Health • Need to position systems for the shift from volume to value $4,000,000
• Infrastructure upgrades, $3,500,000 • Old infrastructure that needs to be replaced $3,500,000
•Infrastructure replacement for expanded facility (new construction).
• Market growth in clinical service lines and running out of medical surgical available
beds.$3,200,000
• Surgical System replacement • Integration $3,000,000
• upgrade with existing vendor • unification of all areas on one platform $2,000,000
• stage 3 • reimbursement $2,000,000
• analytics • we want to drive decisions based on data $2,000,000
•Identify and commit to Physician EMR, possibly Athena or Meditech 6.1
•The current product of the employed physicians (McKesson -PDS) needs changed. $2,000,000
• better analytics • need "next generation" data to manage pop health $2,000,000
• New vendor selection. Currently considering BETA with vendor who will make the
investment
•We have concerns in regards to the financial viability of current vendor $2,000,000
• ICD 10 • revenue $2,000,000
•Changing nightly data back-up technology and establishing a Hot Spare data center
•Speed up data back-up process and Business continuity $1,500,000
• Added data security • Threat to our customers $1,500,000
•The top IT investment for 2015/2016 is infrastructure.
• Investment in infrastructure was the top investment/priority due to moving into a
newly built facility.$1,500,000
• Infrastructure and financial systems. We will spend approximately $1.3 million
combined.
•bandwidth and mobility; tight financial controls necessary in this environment. $1,300,000
• ICD-10 included in planned upgrades to systems • To meet regulatory requirements $1,000,000
• Population Health • developing Clinically Integrated PHO $1,000,000
• evaluating vendors • migrating away from Siemens $1,000,000
• Population Health • Risk contracts $1,000,000
• Revenue Cycle Management • Efficiency in this area is a known deficiency $1,000,000
• Upgrades to current release including hardware. Approximately 1.2 million between
software and hardware.
•Much do this for McKesson support $1,000,000
• Digital radiology • Area of need $800,000
• enhance clinical tools fit into the flow of our EMR for use by physicians • gives physicians information at point of care $500,000
•Security.
• Because the threats are becoming increasingly sophisticated, and we may not
have sufficient tools/skills.$500,000
• Pop Health, Infrastructure • Strategic Plan $500,000
• EHR/HIS and Financials • New implementation to achieve MU $420,000
• Being able to comply with ACOs and last stage of meaningful use • Future revenue streams $250,000
• PHM • To be successful in shift to value based reimbursement $250,000
• Athena EMR and Revenue Cycle • It is a must $200,000
• infrastructure • to support the increase in use $50,000
• EMR facility wide • would like to complete the project
• meaningful use • $$
• 2015 was MU stage 2, 2016 is more of a review • MU incentive payment
• IT Infrastructure at roughly $750,000. • Infrastructure is aging and no longer meets capacity needs for our HIS.
• MU3 • Required and reimbursable
• epic deployment • everyone on one platform
• cleaning up ICD 10 • accurate billing and coding
• Medhost MU 3 modules 56000 • To reach MU3
Average $8,870,714
Median $2,000,000
Top IT Priority in 2015 and 2016
30
HEALTHCARE IT & DISTRIBUTION February 23, 2016

Source: MEDACorp Survey, “Hospital HCIT Purchasing Trends,” January 2016
The table below shows what areas the survey respondents expect to spend incremental budget on. The
largest areas of incremental investments in 2016 appear to be for infrastructure remodeling and clinical
HCIT systems. X-Ray equipment and equipment for the OR are also areas where incremental dollars
may be invested. This roughly mirrors the top investment priorities found in our 2015 survey.
Source: MEDACorp Survey, “Hospital HCIT Purchasing Trends,” January 2016
Ancillary Priorities in 2016: Clinical Documentation Improvements & Secure Messaging
Ancillary system investments in 2016 are expected to stay mostly the same relative to 2015. The top
ancillary system investments in 2016 are expected to focus on: clinical documentation improvements,
secure messaging, security, speech recognition & eRx. The biggest change in priorities relative to 2015
appears to be a greater emphasis on secure messaging, and less focus on speech recognition, single
sign-on and computer assisted coding.
Current Core vendor
Accretive
Allscripts, MCK Horizon
CPSI
Epic
Epic
Epic
Epic
Epic, McKesson Horizon
Not clear
10%
Healthland
HMS
MCK Paragon , MEDITECH ,MDRX
MEDITECH
MEDITECH , Quality Systems / NextGen
100%
22%
Prognosis
Average
NTM Cap Spending
Budget Increase y/y
10%
50%
50%
5%
1%
20%
20%
5%
15%
3%
1%
Yes, it will increase, 28%
No, it will remain the same, 72%
Yes, it will decrease, 0%
Do you expect to see any changes in your capital spending budget over the next 12 months? (n=50)
Investment More Less UnchangedUndecided/
Unsure
Infrastructure Improvements / Remodeling 54% 6% 34% 6%
Clinical HCIT Systems (EMR / Lab / Pharmacy) 26% 6% 64% 4%
X-Ray / Imaging Equipment 24% 4% 64% 8%
Equipment for the Operating Room 22% 4% 70% 4%
Digital Mammography 18% 4% 68% 10%
Beds / Stretchers / Patient Lift Systems 16% 8% 70% 6%
MRI Equipment 12% 4% 76% 8%
Radiation Oncology Equipment (i.e., Linear Accelerators, etc.) 12% 4% 68% 16%
Ventilators 8% 4% 80% 8%
Da Vinci Systems 8% 4% 78% 10%
“Rio” / MAKO (hip / knee) Systems 4% 2% 62% 32%
Over the next 12 months, does your institution plan on spending more or less on the following items?
Please choose one: more, less, unchanged, Undecided / Unsure. (n=50)
31
HEALTHCARE IT & DISTRIBUTION February 23, 2016

Source: MEDACorp Survey, “Hospital HCIT Purchasing Trends,” January 2016
We also asked respondents how they would rate several ancillary system vendors on a scale of 1-5 with
5 being “excellent”. 3M/Codewrite360 received the highest quality score (3.6) and also had the most
brand recognition, receiving a score from 41 of the respondents. There was a fairly tight quality score
range for most of the vendors, with Nuance, Imprivata, Press Ganey, and the Advisory Board all scoring
on average 3.2 or 3.3. Modal and Optum were each further down the quality curve with scores of 3.0
and 2.8, respectively.
Source: MEDACorp Survey, “Hospital HCIT Purchasing Trends,” January 2016
Spending on Ancillary Systems Should be up Very Slightly in 2016
Spending on Ancillary Systems may tick up slightly in 2016, but most IDNs don’t foresee any change in
spend. The average anticipated increase in spend was 16% for the 10 respondents who expect an
increase. There was only one respondent who expected to see a decrease of 10% in ancillary system
spend.
Which ancillary systems did you invest in for 2015? Which will your hospital invest in 2016?
2015 2016
Clinical documentation improvement 42% 36%
Secure messaging 26% 36%
Other IT security 28% 30%
Speech recognition 52% 26%
E-prescribing 46% 26%
Patient experience measurement/surveys 28% 24%
Single sign-on/authentication management 32% 18%
Computer assisted coding 34% 14%
Patient identification 10% 10%
Other 2% 6%
Other includes: New PACs (2015), Pop Health Analytics (2016), natural language processing (2016), and none (2016)
Which ancillary systems did you invest in for 2015? Which will your hospital invest in 2016?
3.63.3 3.3 3.2 3.2
3.02.8
0.0
0.5
1.0
1.5
2.0
2.5
3.0
3.5
4.0
How would you rate the overall quality of the vendors you have ever used for your ancillary systems? (1 is the poor and 5 is excellent)
32
HEALTHCARE IT & DISTRIBUTION February 23, 2016

Source: MEDACorp Survey, “Hospital HCIT Purchasing Trends,” January 2016
Our Overall Views of the Sector Are Largely Reinforced by this Survey
We remain positive on Cerner, which appears best positioned to win share in the replacement market
and also grow its revenue cycle footprint and its ancillary systems (pop health, etc.). We continue to
view McKesson Horizon and Siemens facilities as the largest near-term opportunity in the replacement
market, and we are encouraged by the progress that Cerner has made to close its win rate against Epic.
The survey data clearly show that hospitals are looking for systems that have a unified database, so we
believe that ATHN’s inpatient strategy makes sense and should help ATHN get more looks, although it
will take time to develop a robust system that can scale up to larger hospitals, in our view. We expect
population health management technologies to be the largest near-term spending priority away from
core EHR replacements, and we are encouraged that the average level of spend on the top 2015 and
2016 priorities should be up from the average spend on MU from 2010-2014.
Increased, specify %, 20%
Stayed the same, 78%
Decreased, specify %, 2%
How does your planned spending for ancillary systems in 2016 compare to 2015 spending? (n=50)
33
HEALTHCARE IT & DISTRIBUTION February 23, 2016

The Future of Population Health Management: Technology Aimed at Balancing Access, Cost, and Quality
Background: What is Population Health Management?
Population Health Management (PHM) has become a common term within healthcare, promising
increased access to treatments, healthier patients, and lower healthcare costs. We define PHM as the
provision of healthcare based upon the outcomes of a group of individuals, accounting for the
distribution of outcomes within the group. In essence, it is the cross-section of better health outcomes,
coordinated care, and overall value. Within the U.S., there is a growing shift toward the adoption of
wellness programs, patient incentives to take a more proactive role in managing their health, and
information exchanges that aggregate data analytics to avoid health incidences before they happen. New
reimbursement models that emphasize the results or performance of the provider, rather than a volume-
based fee-for-service (FFS) model, continue to gain traction. Health systems are acquiring other
providers so they can offer health services across the continuum of care, which is essential in an
Accountable Care Organization (ACO) or risk-based model. These initiatives look to maximize the “Iron”
Triangle of Healthcare, providing the greatest access and quality at the lowest possible cost. We believe that the
next several years may see an increase in innovation and industry consolidation among vendors that
offer population health management technologies.
The Iron Triangle of Healthcare
Source: Leerink Partners LLC, 2016, and a multitude of websites and blogs including http://diseasemanagementcareblog.blogspot.com/2015/03/the-iron-triangle-of-mhealth-apps-due.html
Within the scope of this report, we will focus on population health management trends and the digital
health vendors that currently offer solutions and technologies that are aligned with PHM goals. Given the
breadth of sectors that encompass both PHM and Digital Health, we have divided our coverage into four
sections:
Category Definition
Consumer & Value-Based Care Solutions
(CVBCS)
Programs designed to maximize access and quality of healthcare at the lowest possible cost.
Increase transparency between patient and provider, providing a marketplace platform where
patients can choose treatment based upon cost, ratings, and other subjective criteria.
CVBCS programs place a heavy emphasis on patient education and are linked to the ACO-risk
sharing payment model.
Core SaaS Solutions (CSS) Software programs employed within payer and provider organizations to improve accessibility and
storage of electronic medical records (EMRs) and other organizational information.
Telehealth & Remote Medicine (TRM) Digital telecommunication that allows patients to access medical providers in remote locations,
typically through teleconferencing.
Wearables & Interactive Devices (WIDs) User-driven digital technology that allows patients to track their physiological vitals using mobile
apps or probes worn on their body.
Source: Leerink Partners LLC, 2016
34
HEALTHCARE IT & DISTRIBUTION February 23, 2016

Population Health Seeks to Align Incentives
A recurring term within population health is “provider risk-sharing,” where the provider receives a
capped monthly payment for each patient they cover. Each integrated delivery network (IDN)
receives a per member per month (PMPM) budget or direct cap amount, and all of the claims costs
associated with a specific set of members are tracked by that health plan. There are different forms of risk
sharing. A “direct cap” model where a true fee amount is received each month is the most aggressive form of
risk. Less aggressive forms of risk can include items such as value-based care or some sort of budgeted
capitation model where there is a fee-for-service deal that is restricted to certain budgets and true-ups each
year or every six months.
The health plan can be either a government or commercial plan, although Medicare has been the common
plan in early risk-sharing programs. If the total claims costs come within a certain budget at year-end, the
IDN shares in some of those savings, and if claims costs exceed the budget, then the IDN must return
some of that money to the health plan. We consider these financial arrangements to be complicated
because IDNs need to be able to collect and analyze all of the data from the insurance company or EMR
itself, and the provider also needs to function in such a way that optimizes their own earnings. Insurance
companies want total claims costs to be as low as possible, while providers generally are paid based on
the number of visits at their site. Within a world of population health, providers do not want to eliminate
all patient visits. Rather, the provider wants the most profitable balance between visit revenue and a
managed care budget. These arrangements tend to be best aligned when the payer and provider are housed
within the same institution. In these cases, the owners want members to receive the care they need as
long as it is performed at the lowest cost. In theory, this will maintain and grow premium revenue, while
keeping claims costs under control.
Comparing the U.S. to other OECD Countries
The United States dedicates a large proportion of its GDP to the healthcare system. In 2014, the U.S.
spent about $3.15 trillion, or approximately 17.4% of GDP. Coupled with the rising average age of the
population, as baby boomers reach retirement age, this number is expected to increase. Over the past
20 years, healthcare spending has risen to an unprecedented rate, outpacing GDP growth significantly
during that time period. The trend of healthcare spending is shown below.
Source: World Bank - 1995-2014, Leerink Partners LLC
$2,500
$3,500
$4,500
$5,500
$6,500
$7,500
$8,500
$9,500
$10,500
12.0%
13.0%
14.0%
15.0%
16.0%
17.0%
18.0%
1995 1996 1997 1998 1999 2000 2001 2002 2003 2004 2005 2006 2007 2008 2009 2010 2011 2012 2013 2014
USD
($)
U.S. Healthcare Expenditures, 1995-2014
% of GDP $/Person
35
HEALTHCARE IT & DISTRIBUTION February 23, 2016

Source: World Bank - 1995-2014, Leerink Partners LLC
The distribution of the $3.15T in total healthcare expenditures is illustrated in the following graphic. It’s
worth noting that the top two categories, Hospital Care (31%) and Physician & Clinical Services (20%),
are strongly interrelated to one another. Physician & Clinical Services typically take place within a
hospital setting, which means that over half of all healthcare expenditures are occurring within hospitals
alone.
Source: CMS.gov, 2015, Leerink Partners LLC, 2016
$4.00
$6.00
$8.00
$10.00
$12.00
$14.00
$16.00
$18.00
$20.00
12.0%
13.0%
14.0%
15.0%
16.0%
17.0%
18.0%
1995 1996 1997 1998 1999 2000 2001 2002 2003 2004 2005 2006 2007 2008 2009 2010 2011 2012 2013 2014
USD
($)
in t
rilli
on
s
U.S. Healthcare Expenditures vs. GDP, 1995-2014
% of GDP GDP($)
Hospital Care 31%
Physician & Clinical Services
20%
Prescription Drugs 10%
Private Health Insurance
7%
Nursing Care 5%
Dental Services 4%
Research 2%
Structures & Equipment 2%
Medical Products 3%
Government 3%
Equipment 2%
Public Health 3%
Other Personal
Care 3%
Other Professional 5%
U.S. Healthcare Expenditures Distribution
36
HEALTHCARE IT & DISTRIBUTION February 23, 2016

Based on data from the World Bank, U.S. 2013 healthcare expenditures are compared below with other
member countries of the OECD. Healthcare spending in the U.S., which hovers around ~17% of GDP,
exceeds those of other countries. For comparison, no other OECD country exceeds 12% of GPD. U.S.
healthcare expenditures are so large that the OECD average healthcare spending as a percent of GDP
is bumped up almost 3% with the U.S. included, as opposed to with the U.S. excluded (12.32% vs.
9.46%). In our view, the ex-US average is much more indicative of a sustainable level of spending for
healthcare. While the U.S. has the highest healthcare costs as a percent of GDP, there are three
countries in the OECD that actually spend slightly more per capita than the U.S: Switzerland, Norway,
and Luxembourg. Of the three, only Switzerland spends over 10% of GDP, while the other two spend
less than the ex-U.S. average (9.46% of GDP).
Source: World Bank - 2005-2013, Leerink Partners LLC, 2016
America Is Outspending Other Countries on Healthcare: Are We Getting Our Money’s Worth?
While there are several driving factors that influence healthcare spending, inefficiencies and waste in the
American healthcare system are challenges. Unnecessary medical procedures and tests are estimated to
significantly drive up the costs. A 2009 study by the Institute of Medicine about U.S. healthcare spending
found that nearly one-third of all healthcare spending can be wasteful, equating to $765B in 2009. The focus
of population health management is to improve the overall health of the population, and increase the
value of care delivered. There are several revolving payment models that are driving the shift of
healthcare from a fee-for-service environment where physicians are rewarded for the quantity of care to
a system that pays for performance and the quality of care.
Area of Opportunity Avoidable Cost
Unnecessary Care $210B
Administrative Inefficiencies $190B
Inefficiently Delivered Services $130B
High Prices $105B
Fraud & Abuse $75B
Missed Prevention Opportunities $55B
GRAND TOTAL $765B
Source: Institute of Medicine, “The Health Care Imperative:
Lowering Costs and Improving Outcomes,” 2011
0.0%
2.0%
4.0%
6.0%
8.0%
10.0%
12.0%
14.0%
16.0%
18.0%
2005 2006 2007 2008 2009 2010 2011 2012 2013
Per
cen
tage
of
GD
P
U.S. Healthcare Spending Compared to OECD Members 2005-2013
U.S. Switzerland France Germany Japan UK Canada
37
HEALTHCARE IT & DISTRIBUTION February 23, 2016

Life expectancy data from the World Bank supports the assertion that the quality of care is much more
valuable than the quantity of care. In 2011, the average U.S. life expectancy was ~78.6 years, below the
OECD average of ~79.7 years. This is concerning despite U.S. spending being significantly more on
healthcare than most OECD countries. By contrast, the only OECD members with lower life
expectancies are classified as developing countries. To put this in perspective, Mexico, the lowest per
capita spender in the OECD, has a life expectancy of 76.9 years and per capita expenditure of $620 per
year; while the U.S. has 78.6 years and per capita expenditure of $8,608 per year. This contrast
between spending and results illustrates the current inefficiencies that plague that U.S. healthcare
system.
While the data below show disparity between the incremental value that the U.S. is receiving for
healthcare, we also believe that the actual services delivered in the U.S. in terms of medical procedures
are excellent. If a person has a cardiac or orthopedic procedure performed in the U.S., our view is that
the quality of care delivered is very high relative to other countries. The data in the chart below show life
expectancy, which is just one measure of the quality of overall care delivered in a health system or
country. This metric is relevant when considering payment reform, though it is somewhat limited as well.
OECD Per Capita Spending and Life Expectancy
Source: World Bank, 2011
The Commonwealth Fund -- a private, health foundation based in New York City -- assesses healthcare
system performance and quality for the U.S. and other industrialized countries. In its 2013 rankings --
which compared quality care, access, efficiency, equity, healthy lives, and health expenditures per
capita among 11 developed countries -- the U.S. was ranked eleventh overall. Despite having the
highest health expenditures per capita, the U.S. ranked last in cost-related problems, efficiency, equity,
and healthy lives. The rankings are illustrated in the figure below:
38
HEALTHCARE IT & DISTRIBUTION February 23, 2016

Source: The Commonwealth Fund, June 2014
Cost Drivers within U.S. Healthcare
When analyzing America’s health issues, it is important to examine the cost-drivers that affect the sector.
Becker’s Hospital Review lists the following as the primary drivers within healthcare.
Cost-Driver Explanation
Physician, facility, &
drug costs Average cost for these categories in the U.S. is high relative to the world
Expensive
technologies &
procedures
Treatments heavily rely on the most expensive technologies and procedures available
Fragmented &
uncoordinated care Treatment typically occurs without much consultation, leading to unnecessary care
Poor patient cost
consideration
Patients have limited ability to participate in the cost decision making process of their
care
Fee-for-service
insurance
Volume-based reimbursements incentivize providers to over-treat in order to increase
compensation
High administrative
expenses Billing processes cost the U.S. healthcare system billions
Unhealthy behaviors Chronic illnesses cause ~70% of deaths and often stem from unhealthy behaviors
Expensive end-of-life
care The last year of an American’s life is the most expensive for medical treatment
Provider consolidation High M&A activity has increased economies of scale, but has led to higher prices and
oligopolistic behavior
Source: Becker’s Hospital Review, Jan. 2014
39
HEALTHCARE IT & DISTRIBUTION February 23, 2016

Obesity is a common denominator between eight of the 10 top disease groups. According to WebMD,
adult obesity is associated with a significantly higher risk for developing several health conditions,
including: heart disease and cardiovascular problems, type II diabetes, certain types of cancer, digestive
problems, breathing problems, arthritis, and sex hormone problems. The annual Health, United States,
2012 report from the Center for Disease Control revealed that obesity, despite showing signs of slowing
growth, has remained on the rise. In the past 50 years, the adult obesity rate has nearly tripled from
13.3% in the early 1960s to 35.2% in 2010. There is also an alarmingly high concentration of obesity in
the Southern and Midwestern states, of which 12 had an obesity rate of over 30% as of 2010. This is in
contrast to a decade ago in 2000, when no state had an obesity rate of over 30%.
Source: US Department of Health and Human Services, Health, United States, 2012
Prevention Is the Best Solution for Cost Reduction
While rapid advancements in technology and growing availability of new drugs and procedures
contribute to higher healthcare costs, another explanation for the rapid rise in U.S. healthcare
expenditures is that in many cases the traditional reimbursement system does not reward providers for
focusing on prevention. One of the biggest shortfalls of the healthcare system is the lack of incentives for
doctors to implement population health management tools since many providers may have some
influence on patient behavior outside of care settings. Indifference toward a healthy lifestyle or a lack of
self-discipline too often undermines motivation to change unhealthy habits. A greater focus on
prevention and on individuals taking responsibility for their own health is leading to the emergence of
new payment models and technology that increase communication between providers, payers,
pharmacies and patients.
The Top 5% of the Population Spend 50% of the Dollars
For further analysis on the effect of preventive medicine, it is useful to understand where healthcare
expenditures are concentrated. The data from the following chart were calculated by the Kaiser Family
Foundation using 2010 Medical Expenditures Panel Survey data from the U.S. Department of Health
and Human Services. The data show that the top 1% of the population accounts for 21% of healthcare
spending and the top 5% spends half of the nation’s entire healthcare dollars. According to Kaiser, the top
5% of healthcare consumers consists almost entirely of seniors and those with chronic illnesses. For this
section, when illnesses are properly managed, many of the expensive hospitalizations and treatments are
avoidable. More than half of America’s population spends only about $800 per year on healthcare. If new
technologies or more efficient spending can help just 5% more Americans join this healthy bracket, then
the annual savings can potentially reach some ~$300B, or almost $1,000 in savings per person.
13% 15% 15%
23%
31% 34% 35%
0%
5%
10%
15%
20%
25%
30%
35%
40%
1960-19621971-19741976-19801988-19941999-20022003-20062007-2010
Prevalence of Obesity of % of Total U.S. Population
$107
$82 $82 $73
$64 $62
$51 $43 $39 $37
$-
$20
$40
$60
$80
$100
$120
USD
($)
in b
illio
ns
Top 10 Most Expensive Sicknesses in the U.S.
40
HEALTHCARE IT & DISTRIBUTION February 23, 2016

Source: Kaiser Family Foundation, 2010
Population Health Management Solutions Help Reduce Costs
As previously mentioned, data from CMS revealed that over 50% of the national health expenditures
come from two different segments of healthcare: Hospital Care (31%) and Physician & Clinical Services
(20%). In comparison, prescription drugs only account for 10% of total expenditures. According to Health,
United States, 2012, the percentage of doctor visits that included advanced-imaging more than tripled
from 5% in 2000 to 17% in 2010. This contributes to the significant rise in healthcare costs, as imaging is
one of the most expensive healthcare procedures. Estimates put the likely cost of an MRI somewhere
between $522 and $2,871, with an average of $1,121, according to the 2012 Comparative Price Report
conducted by the International Federation of Health Plans. The price of an MRI machine can also vary
from $150,000 to over $1.0M, based on online vendor quotes.
21%
50%
65%
75%
82%
97%
3%
0%
10%
20%
30%
40%
50%
60%
70%
80%
90%
100%
Top 1%(>$53,238)
Top 5%(>$18,086)
Top 10%(>$10,044)
Top 15%(>$6,696)
Top 20%(>$4,639)
Top 50%(>$829)
Bottom 50%(<$829)
Percent of Population, Ranked by Healthcare Spending
21%
28%
15%
10%
7%
16%
3%
Percent of Total Healthcare Spending by Spending Segment
Top 1% (>$53,238)
Top 1-5% (>$18,086)
Top 5-10% (>$10,044)
Top 10-15% (>$6,696)
Top 15-20% (>$4,639)
Top 20-50% (>$829)
Bottom 50% (<$829)
41
HEALTHCARE IT & DISTRIBUTION February 23, 2016

Even at the high-end of the price tag, just three scans per day recoups the equipment cost of the
machine in less than one year, over an estimated 10-year lifetime of an MRI machine. Much of the cost
on procedures such as this can be reduced by hospitals lowering prices, decreasing redundant and
unnecessary scans, or improving the population’s health so that people stay out of hospitals. As a result,
Population Health Management solutions and new payment models that reward outcomes rather than
procedures are a promising way to slow or reverse healthcare spending trends in the U.S.
Source: CMS.gov, 2015, Leerink Partners LLC, 2016
Rising Cost of Health Insurance Prompting Employers to Seek Alternatives
Along with the rising cost of healthcare, the cost of health insurance premiums in the U.S. has also been
rapidly rising. The Kaiser Family Foundation found in their annual Employer Health Benefits Survey 2014
that rates for employees with employer-based insurance have nearly tripled for both single and family
coverage since 1999. The CAGR for both types exceeded 5%, with 6.51% for single coverage and 6.90%
for family coverage. For comparison, over the same period the per capita GDP in the U.S. grew by a
CAGR of only 3.12%.
Hospital Care 31%
Physician & Clinical Services
20%
Prescription Drugs 10%
Private Health Insurance
7%
Nursing Care 5%
Dental Services 4%
Research 2%
Structures & Equipment 2%
Medical Products 3%
Government 3%
Equipment 2%
Public Health 3%
Other Personal
Care 3%
Other Professional 5%
U.S. Healthcare Expenditures Distribution
42
HEALTHCARE IT & DISTRIBUTION February 23, 2016

Source: Kaiser Family Foundation, Employer Health Benefits Survey 2014
Source: World Bank - 1999-2014, Leerink Partners LLC
Population Health Management Market Share
In a 2015 survey by peer60 of over 950 healthcare leaders, which represents approximately 25% of the
U.S. healthcare systems, Cerner (9%), Advisory Board (9%), MEDITECH (7%), and McKesson (6%)
were found to be the market share leaders for population health management. None of these vendors,
however, held a market share greater than 10%, demonstrating the fragmentation of the market. In
addition, 35% of those surveyed had no PHM technology in place at their facilities. We believe this
depicts the untapped nature of the PHM market and opportunity for vendors to fill this space as more
healthcare providers will be incentivized to employ PHM products at their facilities. The data below are
just one chart from one source, and we view it as being somewhat limited. For example, this chart does
not include leaders in the space such as Valence, Lumeris, and Evolent Health. However, it is useful in
at least providing some information around market share by vendor for certain components
$-
$2,000
$4,000
$6,000
$8,000
$10,000
$12,000
$14,000
$16,000
$18,000
1999 2000 2001 2002 2003 2004 2005 2006 2007 2008 2009 2010 2011 2012 2013 2014
USD
($)
Average Annual Premiums for Single & Family Coverage, 1999-2014
Single Family
$-
$10,000
$20,000
$30,000
$40,000
$50,000
$60,000
1999 2000 2001 2002 2003 2004 2005 2006 2007 2008 2009 2010 2011 2012 2013 2014
USD
($)
U.S. Per Capita GDP 1999-2014
43
HEALTHCARE IT & DISTRIBUTION February 23, 2016

Population Health Management Market Share
Source: peer60 - 2015 Healthcare Tech Purchasing
Reimbursement: Where Does the Money Come From?
Before going into the payer trends within the U.S., it is important to first understand how much spending
occurs within each segment of the insurance industry. In 2014, the U.S. was estimated to spend $3.15
trillion on healthcare. According to Hartman et al. in their report, Health Affairs, Medicare (20%),
Medicaid (16%) and other government payers (15%) account for a total of 51% of all healthcare
spending within the U.S. Private insurers (37%) and out-of-pocket payments (12%) made up the
remaining percentages. These figures demonstrate the high level of government activity in the U.S.
health system, which is predicted to increase as the ACA continues increasing access to previously
uninsured Americans.
Source: Health Affairs, December 2014
None, 35%
Other, 10%
Cerner, 9%
Advisory Board, 9%
Meditech, 7%
McKesson, 6%
Allscripts, 5%
Premier, 4%
Epic, 3%
athenahealth, 2%
Optum, 2%
eClinicalWorks, 2% GE, 1%
Phytel, 1%
Explorys, 1% Caradigm, 1%
Conifer, 1% Philips, 1%
15%
16%
20% 12%
37%
U.S. Healthcare Spending by Organization
Other Government
Medicaid
Medicare
Out of Pocket
Private
44
HEALTHCARE IT & DISTRIBUTION February 23, 2016

CMS as a Trendsetter: How Medicare & Medicaid Trends Influence Private Payment Systems
As the largest single investor in healthcare reimbursement, the U.S. government and its programs are a
major trendsetter for all insurance programs, with CMS being one of the most influential government
insurance organizations. Although there are several large private insurance firms, the insurance system
is almost wholly controlled by the government through pricing. In a 2013 paper by Jeffrey Clemens and
Joshua D. Gottlieb, Medicare’s influence on private payments for physician procedures was analyzed.
According to the paper, on average a $1 change in Medicare’s relative payments resulted in a $1.30
change in private payments. Clemens and Gottlieb concluded that Medicare strongly shaped relative
valuations and aggregate expenditures on all physician services. They noted that this influence varies
by regional market and Medicare tends to have a greater influence in markets with a high physician
population and low provider consolidation. In short, we believe that reimbursement trends within CMS
set precedents for all other insurance companies. This is particularly relevant for Medicare because it is
a federal program and does not have to pass through Medicaid’s state-by-state legislative process. This
means that CMS reimbursement policy trends for Medicare serve as a reliable predictor for the future
behavior of private, commercial insurers.
Given the government’s focus on cutting costs through population health management, we predict that
future Medicare coverage will grow for applications, devices, and programs that are proven to optimize
the healthcare triangle. While this process is typically slow, trends within healthcare suggest that
Medicare will favor the reimbursement of PHM and digital health products as they grow in usage.
Key Components of the Affordable Care Act (ACA) for Investors
Individual Insurance
Mandate
By some estimates, the individual insurance mandate will add 14 million people to
the ranks of the insured in 2014, and ultimately as many as 30m people, growing
significantly the population of people who receive conventional reimbursed
healthcare under the current system.
Accountable Care
Organizations (ACOs)
Perhaps the ACA’s largest single reform, the creation of the ACO framework,
changes the nature of healthcare spending from fee-for-service to fee-for-value,
unlocking the potential of modern workplace technology to improve the cost-
effectiveness of the healthcare workplace. We believe that ACOs will behave very
differently from traditional healthcare provider organizations and will have a large
appetite for cost-effective innovations. They will be major buyers of healthcare
automation technologies and will also purchase population-health management
solutions to help reduce the cost of caring for their populations.
Public Exchanges
The public health insurance exchanges facilitate the buying of health insurance by
consumers from health plans. The public exchanges make it easier for the
uninsured to take advantage of government subsidies and to obtain the right health
insurance. Over time the exchanges will also make it easier for employers to
outsource their employee benefit functions by directing employees to public and
private exchanges.
45
HEALTHCARE IT & DISTRIBUTION February 23, 2016

Cadillac Tax
The ACA includes provision/s to begin taxing so-called Cadillac Health Benefits,
health plans with very generous health benefits, starting in 2018. We believe that
the start of the Cadillac Tax will serve as a catalyst for employers to shift additional
risk and cost of health benefits onto employees through less generous health
benefits. This catalyst will increase the use of high-deductible health plans and
associated tax-advantaged spending accounts, and will benefit consumer-directed
benefit companies such as WageWorks (WAGE) and Health Equity (HQY). Less
generous benefits will also spur employers’ provision to employees of health data
transparency products such as Castlight (CSLT).
Sunshine Act
(and sequelae)
A part of the ACA, the Sunshine Act mandates that pharmaceutical companies
document and report all compensation of physicians. The Sunshine Act is part
of a larger trend of restricting the ability of pharmaceutical companies and other
manufacturers to influence physicians. The Sunshine Act has forced a software
upgrade on the part of pharmaceutical companies that detail to physicians,
benefiting salesforce automation and CRM companies such as Veeva (VEEV).
By limiting the ways that pharmaceutical companies can reach physicians, the
Sunshine Act and its sequelae (such as provider organization restrictions on
affiliated physicians’ ability to receive compensation from industry) will benefit
companies that own unaffected channels to physicians, such as online healthcare
publishing companies like WebMD (WBMD) and Everyday Health (EVDY).
Source: Leerink Partners LLC, 2016
Population Health Management Investor Trends
Along with this government focus on PHM, private equity and venture capital investments into
healthcare have increased by a CAGR of 11.77% since 2011, going from $13.2B in 2011 to $20.6B in
2014.
Source: CB Insights - Industry Analysis, July 2015
Sizing the Population Health Market Opportunity
Sizing the market for PHM is challenging. Since the term “Population Health” is broad and includes a wide
range of solutions and services, it is difficult to estimate the entire market. For example, in order to
effectively run any risk-based organization from a provider’s perspective, hospitals and physician offices
would need fairly advanced Electronic Medical Record (EMR) solutions. We estimate that these solutions
can cost ~$20M for a single 300-bed acute care facility. In addition to a core EMR, facilities would need
$13.2 $13.5
$18.0
$20.6
1851 1940
2088 2324
0
500
1000
1500
2000
2500
$-
$5.0
$10.0
$15.0
$20.0
$25.0
2011 2012 2013 2014
Nu
mb
er o
f D
eals
USD
($)
in b
illio
ns
Healthcare Total PE/VC Funding 2011-2014
46
HEALTHCARE IT & DISTRIBUTION February 23, 2016

referral management products, post-acute services, patient portals, data analytics, possibly tele-health
and a wide range of clinical services. Depending on what is actually included in the definition of
population health, the size of the market can vary dramatically.
Sizing the New, Incremental, Market Opportunity
In Allscripts’ June 18, 2013, investor presentation, the company indicated that the size of the Population
Health technology market could grow beyond $60B by 2025. In one of Cerner’s investment community
presentations, the company estimated that revenue generated from its Population Health related
products could be ~$500M per year by 2020. In our opinion, the $60B market estimate is high and likely
includes many different products and modules that may be sold in a traditional manner outside of a
“risk-based environment.” For example, this $60B market estimate may include items like referral
management software, patient discharge software, and core EMR products. In addition, the ~$500M
figure that Cerner is portraying as its Population Health goal for 2020 is likely the newly developed
modules that Cerner has created in conjunction with Advocate and Intermountain Health groups. We
view this as the incremental opportunity for Cerner beyond its core solutions.
One of the ways that HCIT vendors will be paid for Population Health related activities is on a per-
member-per-month (PMPM) basis. What this means is if a vendor charges ~$5 PMPM for a certain
module, and if we assume there are 100 members enrolled in a “population health program”, then the
incremental revenue would be $6,000 per year (equal to $5 PMPM x 100 members x 12 months).
Using a risk-based analysis to create conservative and non-conservative estimates, the typical
“population health rate” for HCIT vendors may range from $1 PMPM up to $25 PMPM. If we assume that
roughly one-third of the U.S. enrolls in a “risk-based” reimbursement model of some sort and that the rate
charged is $25 PMPM, then this would imply a total market opportunity of $28B. However, we think this
figure is too high because (1) we estimate that the vast majority of PHM lives would come from
employer-sponsored health insurance, (2) we doubt that the penetration rate will reach 30% across the
entire U.S. -- it may reach ~20%, and (3) the PMPM rate will probably be below $25 at least in the early
years. If we assume one-third of the “employer”-sponsored lives are charged ~$15 PMPM, then this
would imply a PHM opportunity of ~$5-$10B. Even these figures are difficult to judge because some
states may start using population health modules for traditional “fee-for-service” lives. It is unclear to us
what the uptake rate will be for other segments such as managed Medicare, traditional Medicare and the
currently uninsured. The table below gives our estimates, based upon healthcare demographics from
the Kaiser Family Foundation.
Estimated Incremental Population Health Market Opportunity
Category of
Coverage
Healthcare
Coverage in
the U.S.
(Lives)
Estimated %
in Population
Health
Estimated
Risk-Based
Enrollment
Market Opportunity ($MM) based on Assumed PMPM Rate
Range
$5 $10 $20 $25
Employer 149,250,600 30% 44,805,180 $2,688 $5,377 $10,753 $13,442
Individual 15,416,100 30% 4,624,830 $277 $555 $1,110 $1,387
Medicaid 50,670,200 30% 15,201,060 $912 $1,824 $3,648 $4,560
Medicare 39,996,700 30% 11,999,010 $720 $1,440 $2,880 $3,600
Other Public 3,846,400 30% 1,153,920 $69 $138 $277 $346
Uninsured 48,611,600 30% 14,583,480 $875 $1,750 $3,500 $4,375
Source: Kaiser Family Foundation, Leerink Partners LLC estimates 2015
47
HEALTHCARE IT & DISTRIBUTION February 23, 2016

PHM Market Size Variance
In addition to our “PMPM” view of the market, in the following table we show what we think the all-in
opportunity for PHM products could be, assuming each hospital in the U.S. pays for a certain solution.
We estimate that the incremental spend that may get paid to HCIT vendors for population health
solutions may be between $0.5-$5M per facility. We believe that smaller hospitals with under 100 beds
would likely pay far less than this range since the all-in cost for a full EMR solution likely runs $1-$2M.
However, in order to be generous we estimate that all hospitals with 0-100 beds spend $0.5M and those
with 600+ beds spend $5M each. If we assume there are approximately 5,437 facilities in the U.S., then
based upon our analysis, we estimate that the total market opportunity for population health related
products is about $7.6B. Again, this is limited to the incremental spending that hospitals would potentially
pay for items such as dbMotion, or risk-based reimbursement solutions. If Cerner is assuming ~$500M
of incremental revenue in 2020, then we estimate that this ~$7.6B figure is somewhat reasonable,
considering CERN’s market share.
Estimated Population Health Opportunity
Bed Segment
HIMSS EMR Adoption Model Opportunity
per Facility
($MM E)
Total
Opportunity
($MM E)
Mean
EMR
Score
Min EMR
Score
Max EMR
Score
Median
EMR Score
# of
Hospitals
0-100 Beds 3.4 0.0 7.1 3.4 2,887 $0.5 $1,444
101-200 Beds 4.2 0.0 7.1 3.6 972 $2.0 $1,944
201-300 Beds 4.5 0.1 7.1 4.3 617 $2.0 $1,234
301-400 Beds 4.5 1.1 7.1 4.3 395 $2.0 $790
401-500 Beds 4.6 2.1 7.1 4.4 227 $2.0 $681
501-600 Beds 5.0 2.2 7.1 5.1 146 $4.0 $585
600+ Beds 4.9 2.1 7.1 5.1 193 $5.0 $965
Source: HIMSS EMR Adoption Model (EMRAM) Scores by Bed Size, 3Q:13; Leerink Partners LLC estimates 2015
Disclaimer: Our Estimates May Be Low
In FY2015, Optum Health and OptumInsight, now subsidiaries of UnitedHealthcare (UNH), generated
$13.9B and $6.2B in revenue. Based on what we know regarding their business models, all of this revenue is
PHM-related and serves as an indicator that our estimates for the size of the Population Health “all-in
market” measurement may be low. The figures that we show in the above tables, in the range of ~$7-
$28B, are limited to what we believe the medium-term opportunity is for new technology sales to hospital
systems. The entire managed care industry is focused on population health and we do not include the
entire “wellness” or “clinical care” components in our market model estimate above.
48
HEALTHCARE IT & DISTRIBUTION February 23, 2016

Health Information Exchanges Providing Consumer Choice for Health Plans
What Are Health Information Exchanges?
One of the key tenets of PHM is the ability to aggregate and share data across all stakeholders to better
manage health. Health information exchanges (HIEs) manage this data sharing by providing an online
platform that facilitates the secure sharing and exchange of health information data between multiple
parties. Their platforms allow data to propagate across multiple networks, providing a technology
infrastructure for both public and private health plans. In addition, these exchanges are highly
accessible, being reachable through any device that can connect to the internet. Bolstered by
government funding from the ACA and the HITECH Act, each state has now set up an information
exchange through its own government or through a State Designated Entity (SDE).
Statewide HIEs Provides Information Flow Across Care Settings
Source: WVHIN.org, Leerink Partners LLC, 2016
At a state level, HIEs can exist in the form of community and hospital HIEs formed for a single IDN or
small group of hospitals. HIEs are important because they allow providers to exchange clinical health
information with other providers in order to coordinate care and support PHM initiatives. There can be
numerous logistical challenges when integrating information across disparate EHRs and safely
delivering health information data across providers in different care settings and with patients, providers,
pharmacies, and payers. We expect Digital Health vendors to focus on products that satisfy government
Meaningful Usage requirements and enhance data analytic capabilities across organizations, allowing
providers to collect more robust, clinical quality reporting data in order to improve patient outcomes.
HIEs are also a critical component of Accountable Care Organizations (ACOs) since a shared risk
payment model relies on aggregated health and payment information across the entire continuum of
care. These models rely on the ability of these HIEs to be accessible to multiple, accredited parties.
49
HEALTHCARE IT & DISTRIBUTION February 23, 2016

HITECH Funds Get Statewide HIEs Up and Running
As part of the 2009 American Recovery and Reinvestment Act (ARRA), the Health Information
Technology for Economic and Clinical Health (HITECH) Act provides up to $45B in subsidies for various
healthcare information technology initiatives aimed at improving healthcare quality, safety and efficiency
through digital communication and technology. One of the top priorities of the HITECH Act was to have
providers become “Meaningful Users” of Healthcare IT, including the adoption of electronic health
records (EHRs). Additionally, the HITECH Act earmarked funding to strengthen the health information
technology infrastructure and encourage provider participation in HIEs. Once providers began receiving
incentives to use programs that qualified under HITECH, a market for innovative products opened for
PHM and Digital Health vendors.
In 2010, the Office of the National Coordinator (ONC) granted 56 awards to states, eligible territories
and qualified State Designated Entities (SDE) totaling approximately $550M as part of the State HIE
Cooperative Agreement Program. The goal of the program is for states to rapidly develop the
capabilities to exchange health information across providers within a region in the hopes that it will
ultimately become a national exchange. The establishment of statewide public HIEs has allowed many
states to aggregate patient data into patient portals that provide a view of a patient’s encounters with
providers. While state HIEs have been boosted by grant money, their long-term sustainability has been
questioned. While they are expected to remain in place, private HIEs are a more significant industry
growth driver, in our view, with health systems and regional players collaborating in an effort to position
themselves for emerging reimbursement models.
State Health Information Exchange Cooperative Agreement Program, Awards by State/SDE
State/ State Designated Entity (SDE) Award ($MM)
State/ State Designated Entity (SDE) Award ($MM)
Alabama Medicaid Agency $10.6 Nevada Department of Health and Human Services $6.1 State of Alaska $5.0 New Hampshire Department of Health and Human Services $5.5 Arizona Governor's Office of Economic Recovery $9.4 New Jersey Health Care Facilities Financing Authority $11.4 Arkansas Dept of Finance and Administration $7.9 LCF Research, New Mexico $7.1 California Health and Human Services Agency $38.8 New York eHealth Collaborative Inc. $22.4 Colorado Regional Health Information Organization * $9.2 North Carolina Health Information Exchange * $13.0 Department of Public Health, State of CT $7.3 State of North Dakota, Information Technology Department $5.3 Delaware Health Information Network $4.7 Ohio Health Information Partnership LLC $14.9 Government of the District of Columbia $5.2 Oklahoma Health Care Authority * $8.9 Agency of Health Care Administration (FL) $20.7 State of Oregon $8.6 Georgia Department of Community Health * $13.0 Governor's Office of Health Care Reform Commonwealth of PA $17.1 The Hawaii Health Information Exchange $5.6 Rhode Island Quality Institute $5.3 Idaho Health Data Exchange $5.9 South Carolina Department of Health & Human Services $9.6 Illinois Department of Health care and Family Services $18.8 South Dakota Department of Health $6.1 Indiana Health Information Technology, Inc. * $10.3 State of Tennessee $11.7 Iowa Department of Public Health $8.4 Texas Health and Human Services Commission $28.8 Kansas Health Information Exchange Project $9.0 Utah Department of Health $6.3 Cabinet for Health and Family Services (Kentucky) $9.8 Vermont Department of Human Services $5.0 Louisiana Health Care Quality Forum $10.6 Virginia Department of Health $11.6 Maine Department of Health and Human Services $6.6 Health Care Authority (Washington) $11.3 The Maryland Department of Health and Mental Hygiene * $9.3 West Virginia Department of Health and Human Resources $7.8 Massachusetts Technology Park Corporation * $10.6 Wisconsin Department of Health and Family Services $9.4 Michigan Department of Health $15.0 Office of the Governor (Wyoming) $4.9 Minnesota Department of Health $9.6 Pacific Ecommerce Development Corporation (American Samoa) $0.6 State of Mississippi $10.4 Office of the Governor (Guam) $1.6 Missouri Depart of Social Services $13.8 Commonwealth of the NMI, Department of Public Health $0.8 HealthShare Montana * $5.8 Oticina del Gobernador La Fortaeza (Puerto Rico) $7.8 Nebraska Department of Administrative Services $6.8 Virgin Islands Department of Health $1.0
Source: http://www.healthit.gov/policy-researchers-implementers/state-health-information-exchange * Existing State HIEs that received new funding through the HIE Challenge Grant Program on January 27, 2011
Total Awards = $547.7M
50
HEALTHCARE IT & DISTRIBUTION February 23, 2016

HCIT Vendors Are Turning Their Focus Toward PHM and HIE
Large healthcare vendors Allscripts (MDRX), athenahealth (ATHN), Quality Systems (QSII), Cerner
(CERN), and McKesson (MCK) have all started leveraging their comprehensive and sophisticated
software suites to offer population health management solutions for their customers. One important
component of PHM focuses on smoothing the flow of information and the integration of disparate
systems through health information exchange technologies. In June 2013, Allscripts hosted an investor
day dedicated entirely to population health management, and at McKesson’s investor day management
also highlighted PHM as a key topic. Allscripts’ acquisitions of dbMotion and Jardogs have been well
received and filled the company’s HIE strategy and patient portal offering. Athena’s acquisition of
Anodyne helped build out its data analytics capabilities, and Quality Systems’ acquisition of Mirth
Corporation helped to expand its data integration, data analytics and Accountable Care Organization
(ACO) capabilities. We expect acquisitions and in-house development of population health management
tools to continue accelerating over the next several years, forming a highly consolidated market of HIE
vendors.
A Diverse Set of Healthcare Constituents Feed into and Pull from HIEs
The utility and viability of HIEs depend on user-feedback and the ability to make a synchronized
platform that is user-friendly and easy to access. Since HIEs are meant to connect all parties involved
within healthcare to varying degrees, there is a diverse set of customers for HIE services. This list of
constituents includes the government, healthcare service vendors, patients, payers, and providers.
Hospitals are Purchasing HIE Solutions
While health information exchanges are being set up to coordinate care across regions and states,
there are also numerous HIE technologies that vendors offer within a hospital to improve patient care
and reporting capabilities. Many of these capabilities are required in order for hospitals and physicians
to meet all 3 Stages of Meaningful Use and receive full incentive payments from the government. A
CapSite survey published in September 2012 found that 71% of US hospitals plan to purchase a new
HIE solution for their facility. While this figure was down slightly from CapSite’s 2011 report, which found
that 74% of US hospitals had plans to purchase a new HIE solution, we still believe there is a robust
market opportunity for PHM and Digital Health vendors. Some of the solutions that were included under
the HIE umbrella in the CapSite survey included: patient & provider indexes, authentication, secure
messaging, results reporting/delivery, continuity of care document (CCD)/patient summary exchange,
referrals, e-prescribing, image viewing, physician & patient portals, and immunization reporting. The
study also found that 25% of the hospitals that planned to purchase a new HIE solution planned to
make a purchase within 7-12 months. We believe that in 2016 there will continue to be a significant
uptick in the rollout of HIE strategies as meaningful usage benchmarks are collected for potential
reimbursements.
51
HEALTHCARE IT & DISTRIBUTION February 23, 2016

HIEs Have Several Benefits, but Also Risks and Challenges
Although the robust synchronization of patient health data and information exchange between providers
can help reduce duplicative data entry and testing while potentially improving the quality and safety of
care for a patient, numerous challenges remain. Data security and privacy are prevalent concerns
common to nearly all forms of digital devices that are connected to the internet. Ensuring that these
programs accurately and consistently match patients to their health information is essential to data
integrity and patient safety.
HIE Capabilities - Types of Data Exchanged & Features
Clinical Security features
Laboratory User authentication
Radiology Encrypt communications
Pathology Encrypt data
Medication data Separate data servers
Other clinical data (e.g., EKGs) 3rd party certification
Administrative Access/audit trail
Prescription orders Data back-up/redundancy
ER visit documentation Professional services
Inpatient data (e.g., diagnoses & procedures, discharge plans) Program Management
Referrals/Consultations Design & Configuration
Ambulatory data (e.g, patient visits) Support Planning
Dictation/transcription notes Training & Implementation Planning
Referrals/Consultations Other (e.g. transcription services)
Privacy features
Privacy policy clearly available in a printed format
Provisioning process
Role-based access
Pre-defined roles
Selective data tagging & sharing
Source: Healthcare CIO Report - Health Information Exchange (HIE) Comprehensive Analysis & Insight
52
HEALTHCARE IT & DISTRIBUTION February 23, 2016

eHealth Exchange a Nationwide Network (a Network of Networks)
In 2004, the Office of the National Coordinator for Health Information & Technology (ONC) began
providing funding for the development of the Nationwide Health Information Network (NwHIN). The
NwHIN consists of a set of standards, services, and policies that enable the secure exchange of health
information through a nationwide exchange that links together different exchanges. The exchange is
now called the eHealth Exchange, which started out as an exchange between the Social Security
Administration and MedVirginia, and was then joined by the VA and Kaiser Permanente. There are
currently about 40 organizations in the eHealth Exchange.
Importance of HIEs for Stages 1, 2, & 3 of Meaningful Use
While the exchange of patient health information across regions and states is one goal of the HITECH
Act, within individual health systems the exchange of health information is also a priority. The leading
clinical vendors such as Epic and Cerner typically offer IT solutions for different settings within a
hospital. These settings include both clinical and non-clinical purposes, such as laboratories, radiology,
pharmacy, and ER, among others.
Many hospitals, however, either employ a “best-of-breed” approach or use legacy systems in some of
the departments rather than consolidating onto a single system. Similarly, many integrated delivery
networks (IDNs) have different clinical systems in each of their hospitals and rely on HIEs to send data
between systems. HIEs help reduce the need for patients to provide administrative information multiple
times during a hospital visit and serve a more important role in allowing providers to ensure high quality
care.
Exchange of clinical information is a priority of the Meaningful Use rules, and vendor-to-vendor
exchanges are important so that health information is not aggregated within data silos. In order for
providers to become Meaningful Users of HCIT, the transfer of care, exchange of patient summary
information, and submission of clinical and non-clinical data are critical.
Data Exchange & HIE Capabilities Are at the Top of the HIMSS EMR Adoption Model
The Healthcare Information and Management Systems Society (HIMSS) is the leading Healthcare IT
industry organization made up of thought leaders, healthcare providers, HCIT vendors, governmental
organizations, and other stakeholder groups. HIMSS has its own 8-stage ranking system of HCIT
capabilities that providers and hospitals are scored on, with Stage 0 representing the complete lack of
an EMR, while Stage 7 represents a complete EMR as well as robust data flow and sharing capabilities
in a community. Based on the HIMSS EMR Adoption Model (EMRAM), only 3.6% of U.S. hospitals and
7.87% of U.S. ambulatory facilities met the HIMSS Stage 7 definition (as of 1Q:15). While these
percentages increased in the past three years, we believe this low usage highlights the relative youth of
the HIE market.
53
HEALTHCARE IT & DISTRIBUTION February 23, 2016

Hospital Electronic Exchange of Health Information On the Rise
A study published in Health Affairs in August 2013 looked at the exchange of health data among
hospitals between 2008 and 2012 based on American Hospital Association (AHA) yearly surveys. As
part of the AHA surveys, hospitals were asked whether they exchanged four types of clinical
information: radiology reports, laboratory results, clinical care summaries, or medication lists. Not
surprisingly, the highest level of information exchange was across hospitals within an organizational
hospital system, which found that 65% of hospitals in that category effectively exchanged information in
2012. The study also found that in 2012, 51% of the hospitals were exchanging some electronic
information with ambulatory care providers outside the organization, but only 36% were exchanging
information with hospitals outside the organization. In our view, hospitals have a greater incentive to
exchange data with ambulatory care providers since they are a hospital’s referral base.
Source: Health Affairs, August 2013, Authors’ analysis of data from the health information technology supplements to the
American Hospital Association’s Annual Survey of Hospitals, 2008 and 2012.
Notes: EHR is electronic health record system. HIO is a health information organization. All comparisons between 2008
and. 2012 are significantly different (p < 0:01).
54
HEALTHCARE IT & DISTRIBUTION February 23, 2016

Positioning for HC Reform Changes Is a Top Concern of HCIT Executives
Based on the responses from the 24th Annual HIMSS Leadership Survey, 37% of healthcare IT
executives strongly believed that healthcare reform was the most impactful issue in 2013. Additionally,
the executives believed the key business objectives are: sustain financial viability (21%), improve
patient care (19%), improve operational efficiency (17%), and achieve Meaningful Use (15%). Each one
of these top concerns is directly related to adopting an effective HCIT infrastructure across a healthcare
organization. We believe the shift toward risk-based payment models and managing population health
will serve as a tailwind for HCIT vendors, such as Allscripts, McKesson, and athena.
Conclusion
Overall, we believe that population health management presents a new opportunity for HCIT vendors.
While we are skeptical that hospitals will look to reduce their overall admissions into their facilities since
the current reimbursement fee-for-service rewards volume-based behavior, we do believe that there is a
market for population health software and solutions as CMS looks to incentivize insurers to shift toward
population-focused management. We believe that hospitals in many cases may need to at least appear
like they are operating within a budgeted capitation range even if these hospitals are looking to
maximize revenue and earnings.
55
HEALTHCARE IT & DISTRIBUTION February 23, 2016

The Rise of Digital Health Improving the User Experience
The Digital Disruption
With the advent of social media and smartphones in recent years, the term “disruption” has become a
common descriptor among technology startups. Market researchers, investors, and the tech firms
themselves have come to describe their products as disruptive, serving as life-changing consumer
goods that reshape how people think about a commodity or service. For example, Steve Jobs’ 2007
announcement of the first iPhone, which became the first internet-accessible mobile phone of its kind,
was seen as quite literally disrupting how consumers viewed mobile phones.
As technology has increased, several other industries have seen digital disruptions that have shifted
consumer perception of how these industries operate. Below are a few examples of where this has
occurred:
World’s largest taxi services own no taxis (e.g., Uber, Lyft)
Largest accommodation provider owns no real estate (Airbnb)
Largest phone companies own no telephone infrastructure (Skype, WeChat, WhatsApp)
World’s most valuable retailer owns no inventory (Alibaba)
Most popular media owner creates no content (Facebook)
World’s largest movie operator owns no cinemas (NetFlix)
Largest software vendors do not write any of their apps (Apple, Google).
Okay… But where is this occurring in healthcare?
Largest community for physicians and source of CME is a tech company (WebMD)
Largest physician referral service owns no clinics (Teladoc)
Largest repository of consumer step-count and heart-rate data is a tech company (Fitbit).
Source: DearMedia, 2014
56
HEALTHCARE IT & DISTRIBUTION February 23, 2016

Global Digital Snapshot
Healthcare, the largest sector of the US economy, is arguably going through its greatest transformation.
Led by the digital revolution that has seen immense growth in the past two decades, powerful external
forces are now restructuring the healthcare sector, creating winners and losers. Nearly half of all people
globally have access to the internet, and even more have access to a mobile phone device.
Number of People/Users/Accounts Saturation
Total Population 7.21 Billion Urbanization: 53%
Active Internet User 3.01 Billion Penetration: 42%
Active Social Media Accounts 2.08 Billion Penetration: 29%
Unique Mobile Users 3.65 Billion Penetration: 51%
Active Mobile Social
Accounts 1.69 Billion Penetration: 23%
Source: wearesocial.com, Digital, Social & Mobile Worldwide in 2015, Jan. 2015
In preparing this report, we studied the societal, technological, sector, and policy drivers affecting the
healthcare system, and discerned six themes that are powering investment opportunities in digital
healthcare today. Below we provide a discussion of these six Digital Health Investment Themes and the
Drivers behind them.
Digital Health Investment Themes
1. Consumer Empowerment - Consumers are taking control of healthcare spending, and market
participants like payers and providers must follow them or become irrelevant.
2. Smart Systems & Workflow Automation - Technologists are digitizing the components of healthcare
and automating workflows, creating new opportunities for the adaptive, and de-valuing old skills and
legacy systems.
3. Connected Health - Patients are tearing down the walls of the healthcare system, demanding to receive
care and information when and where they need it.
4. Population Health - Providers are beginning to manage the wellness of a population proactively,
instead of reactively treating the sick.
5. Big Data - Data scientists are optimizing care with next-generation analytics applied to a growing
mountain of healthcare data.
6. Healthcare IT - IT systems are now at the center of providers’ plans to improve care outcomes, cut
costs, and get paid.
We define Digital Health as the convergence of the healthcare system with digital technology, a
convergence that enables the six Digital Health Investment Themes. Once digital technology pervades
the healthcare system, the convergence term “Digital Health” will fade into “healthcare.” Several terms
have evolved over time to describe the digitally powered changes revolutionizing healthcare: Health 2.0,
digital medicine, connected health, and e-health among others; see Appendix A for a discussion of these
terms.
57
HEALTHCARE IT & DISTRIBUTION February 23, 2016

In the 2010s, Digital Health has rapidly become a large public and private investment sector in the US.
Market research firm Rock Health found that there was $1.5B of investment in Digital Health in 2012,
$2.0B in 2013, $4.3B in 2014, and $4.5B in 2015, with notable 125% growth from 2013 to 2014.
In addition to many private companies, a number of public companies are strongly affected by the Digital
Health Investment Themes. In the table below, we summarize the investment themes in Digital Health,
the pure-play stocks whose value is being driven by those themes, and the major public companies that
are also affected by these investment themes.
# Investment
Theme Drivers Public Pure-Plays Public Majors
1 Consumer Empowerment
Consumers take charge
Payers shifting costs onto
consumers
Healthcare Reform - drives
health insurance exchanges
Demographics - shift to web
and mobile
Technology shock - pharma
shift to targeted therapeutics
Benefitfocus, Care.com, Castlight, eHealth, Everyday Health, HealthEquity, Health Insurance Innovations, WageWorks, WebMD
ADP, Bank of America, CVS, Towers Watson, Yahoo, InteractiveCorp, Walgreens
2 Smart Systems & Workflow Automation
Technology shock - Moore’s
Law
Healthcare reform - IT at the
center
Pharma cost cutting and
restructuring
HealthStream, Imprivata, Intuitive Surgical, Mazor Robotics, Medidata, MindBody, Model N, MTBC, Nuance, Omnicell, Press Ganey, Veeva
Quintiles, PDI, Inc., iRobot
3 Connected Health
Technology shock - Moore’s
Law
Demographics - shift to web
and mobile
BioTelemetry, DexCom, Fitbit, Garmin, Insulet (OmniPod), LifeWatch, SHL Telemedicine, Spok, Tandem Diabetes, Teladoc, Vocera
Alere, Apple, Boston Scientific, Google, Intel, Medtronic, Philips, Qualcomm, St. Jude, Stryker, Verizon
4 Population Health
Healthcare Reform - change
to fee for value
Evolent Health, Healthways, Maximus, Streamline Health, Weight Watchers
Cognizant, J&J, Lilly, Merck, Novartis, Pfizer
5 Big Data
Technology shock - Moore’s
Law
Healthcare Reform - IT at the
center
Advisory Board, IMS Health, Inovalon
Aetna, Amazon, Apple, Google, IBM, Microsoft, Premier Inc., Philips, Samsung, Salesforce.com, Tableau, UnitedHealth, Verisk
6 Healthcare IT Healthcare Reform - IT at the
center
Accretive Health, Allscripts, athenahealth, Cerner, CPSI, Craneware, HMS Holdings, MedAssets, Merge Healthcare, Press Ganey, Quality Systems
ADP, AdvancedMD, GE, McKesson, Oracle, Quest
Note: bold indicates covered companies. Source: Leerink Partners LLC, 2016
58
HEALTHCARE IT & DISTRIBUTION February 23, 2016

Digital Health Landscape
The Digital Health landscape is rapidly evolving. We are currently tracking developments at over 250
Digital Health companies. Many startups are formed each year. Some private companies are growing
rapidly and raising substantial funds in venture and growth equity rounds. M&A activity has been hot, and
leading Digital Health companies and major technology companies are seeking to become
consolidators, such as GE, IBM, Intel, WageWorks, Medtronic, Weight Watchers, WebMD, Everyday
Health, Google, Facebook, Care.com, and others. In the figure below, we have created a sector
landscape that places companies within their primary Digital Health product categories and into six
investment themes, recognizing that this simplifies the sector’s overlaps.
59
HEALTHCARE IT & DISTRIBUTION February 23, 2016

LEERINK DIGITAL HEALTH LANDSCAPE
Source: Leerink Partners LLC, 2015
60
HEALTHCARE IT & DISTRIBUTION February 23, 2016

Subsector Lifecycles
Digital Health is a convergence term to describe the converging sectors of healthcare and digital
technology. Existing sectors are colliding and new sectors are being birthed. Different sub-sectors of
the Digital Health convergence sector are in different stages of development, and many are in early
stages of development. The figure below shows the stages of the lifecycle that industries typically go
through. We also interpret where on the lifecycle the different sub-sectors of Digital Health are located.
This interpretation may be helpful in understanding what to expect of a company and a sub-sector.
Early in the lifecycle, companies may have low or negative profitability, as they still have start-up costs
and may not have reached economies of scale. Late in the growth stage, there is typically a shake-out
characterized by M&A and exit.
Stages in the Digital Health Sector Lifecycle
Source: Leerink Partners LLC, 2015
From a thematic view, the following three megatrends have been identified as revenue-drivers for companies in Digital Health:
Thematic View Description
Online Marketing Gap: Demographics
Consumers and physicians have shifted their time and attention online: we
think advertisers will follow, creating a boom for online health media
companies
Employer Wellness Plans
Employers are shifting healthcare costs onto employees, creating
opportunities for consumer digital tools companies in healthcare; 2016 will
be a big year for more cost shifting
Healthcare Reform
Healthcare reform has put IT at the center of how healthcare gets done and
is paid for, triggering an upgrade super-cycle; hospitals now need Single
Sign-On and automation
Source: Leerink Partners LLC
sSsta
61
HEALTHCARE IT & DISTRIBUTION February 23, 2016

In addition, the following three factors have been identified as catalysts behind equity pricing:
Thematic View Description
Earnings Earnings are report cards on usage and revenue growth
ACA Cadillac Tax The Cadillac Tax will drive employer cost shifting and healthcare
consumerism
Meaningful Usage (MU 2&3) MU 2&3 deadlines (ongoing) demand usage of healthcare IT by provider
organizations
Source: Leerink Partners LLC, 2016; Note: In mid-Dec. 2015, Congress voted to delay implementation of the Cadillac Tax to 2020 from 2018.
Current Under-utilization of Online Advertising
In the U.S. advertising market, consumers have shifted nearly 50% of their attention online. Despite this
significant attention, brand managers are lagging by behind, as Internet & Mobile channels are under-
indexed by a combined ~17%. We believe that the under-indexing gap of online ad spend in the Online
Health Media market is the same as or greater than the general market’s spending patterns. Pharma
brand managers are expected to re-balance ad spend, which will greatly benefit companies such as
WebMD and Everyday Health.
Source: eMarketer, Interactiving Advertising Bureau as cited by Kleiner Perkins Internet Trends Report, 5/27/15
Drivers Behind The Six Investment Themes
A. Consumers take charge. The 2010s are the Era of the Consumer in healthcare. Whereas 20
years ago, a healthcare business organizing around the patient-as-buyer in healthcare would not have
been successful, today the consumer market in healthcare is growing rapidly, and even traditional payer
and provider organizations are learning how to sell to consumers and adapt to their needs.
As healthcare spending in the US rises at a rate greater than inflation, healthcare payers, such as
employers, are continuing to shift healthcare risk, cost, and power onto consumers through less
generous benefit designs. These benefit design changes include covering fewer employees, increasing
deductibles in health plans, increasing co-pays and co-insurance portions, and ultimately, reducing and
capping the amount of the health insurance benefit premium that employers will pay. In this way,
employers are moving from what has traditionally been a defined-benefit type of employee benefit
toward a defined-contribution benefit, following the path of employee retirement benefits in the late 20th
century.
4%
11%
37%
48%
18%
11%
41% 31%
0%
10%
20%
30%
40%
50%
60%
Print Radio TV Web & Mobile
Time Spent Ad Spend
62
HEALTHCARE IT & DISTRIBUTION February 23, 2016

As payers shift healthcare costs onto consumers, they also shift responsibilities and decision-making
onto these consumers. Consumers can now direct healthcare spending as never before, and they are
also spending more out-of-pocket dollars on healthcare than ever before. We have identified 5 growing
categories of consumer-empowered spending in healthcare.
Growing categories of consumer-empowered healthcare spending:
1. Health plan selection. Consumers have a growing number of health plan options to choose from.
Whereas in the past, a participant in a health benefit might have been able to choose between an HMO
and a PPO from the same carrier, today benefit sponsors may provide to participants several in-house
options from multiple carriers. In addition, still more health plan options are available from private and
public exchanges. Growing consumer choice in health-plan options drives health plans to focus on the
consumer as the customer, instead of the benefit sponsor (such as the employer) as the customer.
Carriers must therefore design plan benefits and costs around the consumer in order to be competitive.
All health insurance carriers are designing plan options to compete in this environment. In addition,
employee benefit consulting companies like Towers Watson (TW) are setting up private insurance
exchanges, such as Towers Watson’s OneExchange, to assist their employer-clients in this transition,
while offering multiple plan options to the employee-participant.
2. Pre-deductible spending. Increasingly, benefit sponsors are shifting healthcare costs onto consumers
by sponsoring low premium/high-deductible health plans (HDHP), including IRS-qualified high-
deductible health plans that are paired with tax-advantaged spending accounts (such as Health Savings
Accounts and Flexible Spending Accounts) that allow employees to spend pre-tax earnings on
healthcare. In 2014, the deductible of a typical single employee in an HDHP was between $1,250 and
$6,350 for the year. Consumers control this healthcare spending (instead of employers), and it hits their
wallets on a dollar-for-dollar basis, instead of being subsidized by their employer. Healthcare providers
and vendors who wish to earn the business of these consumers must sell directly to the consumers.
Consumer-directed benefit vendors such as WageWorks (WAGE) and HealthEquity (HQY) are strongly
affected by the shift to high-deductible health plans. As employers shift health costs onto employees
through these high-deductible health plans paired with tax-advantaged spending accounts, the
employers need to set up more consumer-directed benefit accounts and process more funds through the
accounts. Health-transparency data vendors like Castlight (CSLT) also benefit from this cost-shifting by
employers, as employers pair the cost-shifting with consumer digital tools that empower employees to
optimize their care decisions.
3. Post-deductible spending. The effect of consumer control of pre-deductible spending in the healthcare
marketplace is multiplied because the spending patterns that consumers develop during the pre-
deductible phase of their health spending (such as using a health-transparency tool to choose one
vendor over another on account of its cost effectiveness) are typically carried over into the post-
deductible spending covered by the health benefit. Potentially all of a consumer’s healthcare spending
can be set and directed by the consumer on the basis of the decisions they made when they were
directly spending their own money during the pre-deductible phase.
4. Consumer-influenced spending. Traditionally, the healthcare marketplace de-emphasized the
consumer because the physician/provider was the decision-maker and the health plan was the payer.
Another way that this traditional structure is now changing is that consumers are gaining additional
influence even in areas of healthcare where that traditional structure still exists. Increasingly, consumers
63
HEALTHCARE IT & DISTRIBUTION February 23, 2016

arrive in the doctor’s office with their own sources of information and opinions about their needs, and
treat the physician as a gate-keeper to the healthcare system rather than as the authoritative decision-
maker. Patients may learn about new pharmaceuticals through pharma direct-to-consumer “ask your
doctor” ads for prescription drugs when seeking information on websites such as Everyday Health
(EVDY) and WebMD (WBMD), and go to their physician requesting the drug (or procedure or device).
5. Direct consumer spending. Consumers are also increasingly willing to spend their post-tax consumer
dollars on healthcare products. A diabetic consumer may receive paper testing strips at no cost through
her health benefit, but may purchase a continuous blood glucose monitor on her own -- with her
consumer dollars -- for the benefits that it offers. A patient with chronic pain may self-manage with OTC
drugs bought out of pocket for the benefits of increased control and convenience and the potential for
cost savings. Millions of Americans have bought activity trackers from companies such as FitBit,
Jawbone, and Misfit, or turned on their smartphone’s activity-tracking settings, using the data from these
devices to track their fitness, diet, and sleep, or to help them self-manage their chronic conditions.
Increasingly, health-conscious Americans are willing to spend their own consumer dollars on health
products, and vendors are responding with a wide variety of consumer-oriented options. Websites such
as WebMD and Everyday Health are popular media channels that health brands turn to for an audience.
Beyond the structural changes described above, a secular social and demographic trend is changing
healthcare. The current generations driving the US economy, from Boomers to Millennials, are taking
charge of their healthcare as prior generations never did. Current generations are likely to question
authority, whereas prior generations deferred to authority. Current generations are likely to develop
their own expertise, and they find the tools to accomplish this readily available, whereas prior
generations primarily sought out specialists to hand their case over to. Current generations proactively
demand to be involved in their own healthcare, whereas prior generations wanted institutions to be
responsible.
B. Technology shocks. Belatedly, technology is one of the primary drivers of the digital revolution in
healthcare. Over the past 30 years, whereas high-tech sectors of the economy seemed to ride a “digital
productivity curve” (driven by Moore’s Law) of dramatic increases in cost-effectiveness, other sectors of
the economy -- especially healthcare, government, and education -- seemed stuck with slow
improvements in productivity, or even negative productivity trends (sometimes called Eroom’s Law, or
Moore’s Law spelled backwards).
However, the last few years have seen breakthroughs in the application of digital technology to
healthcare. The digital revolution that has restructured other industries is finally shaking up
healthcare. Health records that used to be trapped on paper in manila folders in physician practices,
or on film at hospitals, are now commonly born digital and readily shared with members of the care
team wherever they are and whenever they need access.
Healthcare products that were once unimaginable, that seemed too expensive for common use, and that
were necessarily controlled by specialty physicians, are now becoming accessible to all. If a component
of a healthcare product can be digitized, then it can follow the same curve of rapid productivity
improvement as the rest of the digital economy.
64
HEALTHCARE IT & DISTRIBUTION February 23, 2016

Technology forces driving improvement in Digital Health include the following:
1.) Moore’s Law. The original Moore’s Law, which applied to the cost effectiveness of microprocessors, is
now joined by a cloud-computing variation of Moore’s Law. Both are now delivering technology shocks to
the US healthcare sector. The cost-effectiveness of cloud computing is growing, both on an absolute
basis to users and also in comparison to traditional enterprise-software infrastructure costs, as
economies of scale play out around cloud storage, transport, processing, and maintenance costs.
Cloud-based companies in healthcare like Benefitfocus (BNFT), Castlight Health (CSLT), athenahealth
(ATHN), CareCloud, WageWorks (WAGE), Veeva (VEEV), Medidata (MDSO), HealthEquity (HQY), and
others are riding this curve, as are automation companies like Omnicell (OMCL), Intuitive Surgical
(ISRG, maker of the Da Vinci surgical robotics system), and Imprivata (IMPR, which automates sign-on
and authentication management across complex hospital systems).
2.) Smartphones. The innovation curve of Digital Health is also being driven by the cost-effectiveness
curve of the smartphones in our pockets, as mass-market demand for these devices drives ever-lower
per-unit costs and ever more pervasive infrastructure support for components like video cameras,
cellular radios, GPS receivers, mobile processors, and body sensors. Companies propelled by these
technology shocks include companies with important mobile apps like WebMD (WBMD) and Everyday
Health (EVDY) in the online health publishing sub-sector; consumer digital tools companies like
WageWorks and Castlight; and population health management companies like MDRevolution. In
addition, activity tracker companies like FitBit and Jawbone benefit, as do wearable medical device
companies like DexCom (DXCM) and Insulet (PODD), both of which make advanced diabetes medical
devices.
3.) Targeted Therapeutics. A third technology shock to hit the healthcare system is the progress of drug
development from primary-care blockbuster drugs -- such as ibuprofen-class drugs for pain relief and
statin drugs for high cholesterol -- to targeted therapeutics, which have the potential to stop the
progression of major diseases that have hitherto eluded successful treatment. Building on advances in
the study of disease and in the capabilities to manipulate biology, targeted therapeutics allow us to more
effectively treat Crohn’s disease, infertility, hepatitis C, cancer, growth-hormone deficiency, and other
conditions. Over the past 10 years, pharmaceutical companies have seen their primary-care
blockbuster drugs go off-patent, as part of the ongoing Patent Cliff, which peaked in the early 2010s.
Pharma companies have adapted strategically by shifting drug development to targeted therapeutics and
by restructuring the way that they sell and market the drugs.
65
HEALTHCARE IT & DISTRIBUTION February 23, 2016

Note: AP – Approved Product
Whereas in the past, pharma companies targeted the mass consumer and the primary care physician
with their sales and marketing efforts, today pharma companies are targeting patients with specific
conditions, such as diabetes and Hepatitis C, and the specialist physicians who care for them. Instead
of targeting with a large force of sales professionals aimed at big groups of physicians and mass media
ads aimed at every consumer, pharma companies are now building much smaller and more specialized
sales forces, and advertising to patients and physicians on a much more specialized basis. Online
publishers like WebMD and Everyday Health allow pharma companies to target messages to specific
physicians and specific patient communities, something that traditional publishers can’t do as well. And
cloud-based client-relationship management (CRM) systems -- like Veeva’s -- enable pharma
companies to automate sales processes better than before. Pharma companies can cut the size of their
sales forces, while integrating the sales reps more effectively into the pharma company’s workflows, and
manage this new team more cost-effectively.
4.) Agile Start-ups. Another kind of technology shock has played out before America’s eyes in Silicon
Valley over the past decade and with accelerating speed since 2008. It’s the combination of the
following: the emergence of an agile start-up culture centered around a falling cost of IT infrastructure
and product development, the utilization of agile-software-development-management techniques
leading to rapid innovation, plus a spirit of rapid experimentation among start-up talent and capital. The
result has been an unparalleled cycle of innovation in the B2C and B2B markets. This cycle of
innovation is now extending to healthcare, as evidenced by the large and fast-growing pool of
investment in Digital Health companies that has been tracked by Rock Health. This technology shock
ensures that some of America’s most talented entrepreneurs will be ready to serve up innovative
technology solutions to the healthcare sector as Healthcare Reform is opening the sector up to the
forces of change for the first time in two generations.
C. Healthcare Reform. The Affordable Care Act of 2010 and related reforms represent the biggest
change to the U.S. healthcare system in the post-WWII era and one of the largest business opportunities
of the 2010s. Prior to WWII, few Americans had health insurance and most health insurance policies
covered only hospital expenses.
66
HEALTHCARE IT & DISTRIBUTION February 23, 2016

However, during WWII the War Labor Board ruled that the ongoing wage freeze didn’t apply to fringe
benefits, and employers responded by using health benefits to compete for workers during a time of
labor shortages. This change kicked off the modern American healthcare payment system -- with
employers providing health insurance as a tax-advantaged fringe benefit. Government reinforced this
system both as a conventional employer and also as the insurer of the old (Medicare) and the poor
(Medicaid).
Many of the modern healthcare system’s much-observed ailments have been attributed over time to its
fundamental fee-for-service payment structure. Healthcare’s expensive procedures and suspected over-
utilization of care is attributed to the system’s bias to pay for procedures but not to pay for quality, or
thinking about options, or prevention, or waiting to take action, or maintaining wellness. The system’s lack
of a true marketplace is attributed to misalignment of incentives among the user (the patient), the
decision-maker (the provider/physician), and the payer (the insurance carrier). Due to the healthcare
system’s decentralized nature, it has proven difficult to improve any one part without reforming all of the
healthcare system (and the healthcare payment system too). And payment reform ultimately required
changes in healthcare policy and law that the political system couldn’t deliver until recently.
Under the traditional healthcare system, the misalignment among payers, providers, and patients often
punished innovation:
Prospective innovators found that they had to bear all the cost of innovation, while the benefits were
spread diffusely among other participants, without enough of the benefits accruing to the innovator to
justify the cost. Thus, physicians rejected electronic medical records at their practices because they
would have to bear the cost of the system in time and money -- with not enough benefit accruing to their
practice, they felt, to justify the cost.
Innovations that required different sector participants to adopt their innovation withered because of lack
of agreement on priorities among participants.
Vendors would find their innovative product rejected by otherwise-receptive physicians because the
innovators needed to get assurance of reimbursement from payers first before physicians would
prescribe or use the innovative products.
Clinicians weren’t allowed to use basic productivity technology in the practice of medicine because it
didn’t meet HIPAA standards. And lack of critical mass in electronic clinical systems caused sector
participants to default to paper and physical mediums of collaboration, denying the collaborative benefits
of electronic systems to the participants who adopted them early.
Payers refused to reimburse an innovative product because the costs were too high to cover the
innovation for members who could be changing carriers within a couple of years anyway.
Wellness products were rejected by the healthcare system because of a traditional agreement to
reimburse for sick care but not for population health.
Providers who innovated to develop higher quality procedures found the system didn’t reward high
quality care and didn’t punish low quality care.
Patients over-consumed expensive care because they didn’t have to pay the bills.
The consequences of the healthcare system’s misalignments could fill many pages and have contributed
to America’s having the highest per-capita healthcare expenses in the world with sometimes less-than-
the-best outcomes. The result of these problems in the U.S. healthcare system was that throughout the
late 20th and early 21st centuries, while U.S. businesses were pioneering world-class productivity,
collaboration, and automation systems in offices and factories, healthcare’s payers and providers
seemed stuck in a darkly humorous parallel universe of old and kludgey technology, including telephone
67
HEALTHCARE IT & DISTRIBUTION February 23, 2016

answering services, color-coded manila folders, large film negatives, paper clips, monochrome computer
screens, multiple computer key-function codes from 1980s DOS manuals, handwritten phone messages
on pink sheets of paper, and deliveries of critical workflow documents through the postal system. Our
21st century brain surgeons are still wearing beepers and reading faxes.
The healthcare reforms of the 2010s have opened up the healthcare system -- the largest single
component of the US economy -- to the adoption of the same wave of productivity, collaboration, and
automation systems as the rest of the economy. Like a third-world country in the 1990s that could skip
over the building of a copper-line telephone network in favor of going straight to the latest mobile phone
system, the U.S. healthcare sector now has the opportunity to adopt the latest cloud-based systems
while skipping over the prior generation of enterprise systems built by pioneers in the business sector.
The US healthcare sector can now jet straight to Malibu without having to trek for weeks in Conestoga
wagons through a technological Death Valley.
In addition to the ACA, there are other parts of Healthcare Reform that are changing the healthcare
system and placing healthcare IT at the center of how payers and providers work and get paid. Under
HIPAA (the Health Insurance Portability and Accountability Act of 1996) all covered entities, such as
hospitals, must have adopted by 2015 the new ICD-10, a diagnosis and procedure coding system that is
substantially more detailed than the prior standard (ICD-9) and that requires updating enterprise
software and workflows in order to successfully comply with it.
Also, under the American Recovery and Reinvestment Act of 2009 (ARRA) and its included HITECH
Act, healthcare providers can receive financial rewards for the Meaningful Use of Electronic Health
Records. Providers must have met additional use requirements under Stage 2 of Meaningful Use in the
2014-15 timeframe in order to continue to receive these rewards. Provider organizations that decline to
participate in the Meaningful Use program initially forgo its financial rewards, and later are subject to
reimbursement penalties from CMS for not satisfying its billing requirements.
The combination of these policies has triggered multiple waves of healthcare IT software upgrades and
put healthcare IT at the center of how healthcare payers and providers improve care, cut costs, and get
paid. Instead of necessarily defaulting to the lowest common technological standard of paper
documentation and communication, healthcare participants can now train and organize around
advanced electronic systems. A critical mass of participants in healthcare online has been reached, and
participants can now count on doing their work digitally. Laggard provider organizations must also make
deferred investments in IT systems in order to stay current and interoperate with their peers and payers.
The emergence of IT at the center of healthcare is benefiting automation companies like Imprivata
(IMPR), which automates the sign-on and authentication process for healthcare providers across
multiple healthcare IT systems, and Omnicell, which automates the hospital pharmacy.
D. Demographics. Major demographic trends are boosting demand for digital solutions to healthcare
challenges. At the older end of the demographic spectrum, Boomers are retiring in vast numbers and
becoming major consumers of healthcare services, triggering a number of changes. Healthcare has
long been viewed as a labor-intensive service sector that has resisted automation. But as the Boomers
enter retirement at a time of unprecedentedly high healthcare spending and a growing gap in the
adequate supply of healthcare providers, Boomers are increasingly demanding healthcare and eldercare
services. In addition, unlike prior generations who saw themselves as recipients of care from institutions
and authorities, Boomers are taking charge of their care through their own spending and demanding that
their care be customized to them. In order for their care to be convenient, personalized and affordable,
there’s an increased need for automation.
68
HEALTHCARE IT & DISTRIBUTION February 23, 2016

Earlier along the demographic spectrum are the Millennials, a generation that was “born digital” and that
turns first to internet-connected mobile devices for information, connection, work, and play. Businesses
that want to serve Millennials will need to figure out how to serve them on their mobile devices.
In between the Boomers and the Millennials, the rest of America is responding to the technological
shocks of the past 30 years by changing how they spend their time and how they want to receive care.
They are consuming information from online sources such as the web and mobile apps. And they too
are changing how they want to interact with their healthcare vendors and providers, switching from
offline activities, such as calling a doctor’s office, to online activities, such as finding a provider and
booking a visit through a mobile app.
These demographic changes are boosting healthcare benefit vendors that engage with their members
through web and mobile: vendors such as WageWorks, Health Equity, and Castlight. The trend to online
activities also benefits healthcare publishers with a strong web and mobile presence such as WebMD
and Everyday Health, and population health vendors with mobile apps such as Weight Watchers (WTW)
and Healthways (HWAY). This web and mobile trend also helps medical device companies that are
building brands in the hearts of consumers, such as DexCom and Insulet.
We believe that the convergence of positive technology shocks powered by Moore’s Law with
demographic shifts such as retiring Boomers and provider shortages, plus the world’s highest
healthcare costs, is spawning an unprecedented wave of automation in healthcare. Increasingly we’re
receiving our healthcare in new ways – such as at home, through connected devices, and with the
assistance of automation.
E. Healthcare costs. U.S. healthcare costs are the highest in the world. They have been growing
faster than the general rate of inflation for decades. They are regularly cited by policy makers as a major
factor inhibiting U.S. global competitiveness, by company CEOs and CFOs as a major challenge to
profitability, and by consumers as a major budget concern. High healthcare costs are a major driver of
cost-shifting by employers, which boosts the growth of High-Deductible Health Plans and Consumer-
Directed Benefit accounts, which, in turn, drives growth for consumer-directed benefit companies like
WageWorks and HealthEquity. Soaring healthcare costs and the need to restrain them also benefit
health-transparency tools companies that help consumers optimize care decisions, such as Castlight
Health. High healthcare costs were a major driver behind the introduction of Accountable Care
Organizations (ACOs) in the Affordable Care Act. ACOs, in turn, introduced a fee-for-value calculation
into the healthcare system, which was formerly overwhelmingly fee-for-service based. The introduction
of fee-for-value into healthcare will benefit population health companies like Healthways and Weight
Watchers, and automation companies like Imprivata and Omnicell.
Source: Health Affairs as cited in Vox.com, 9/4/14
7.2%
3.7% 3.6%
5.3% *6.1%
0.0%
2.0%
4.0%
6.0%
8.0%
1990-2008 2009-2012 2013 2014-2015 2016-2023
Annual Growth in Healthcare Costs
*Estimated
69
HEALTHCARE IT & DISTRIBUTION February 23, 2016

The Outlook for Digital Health Segments
Online Health Media Industry Outlook Remains Robust, Benefiting WBMD, EVDY
Important controversies in the online health media sector in 2016 include: 1) how strong and durable is
pharma ad shift spending (shifting from offline ad channels to online ad channels), and 2) will political
pressure on drug prices materialize and, if so, will that pressure affect the pharma ad budget
negatively?
To answer these questions, we conducted calls with MEDACorp Digital Health specialists with
backgrounds in pharma marketing consulting and pharma ad agencies. Our calls left us more confident
in our belief that pharma ad shift spending is currently ongoing, that it is strong, and that it is durable.
Shift spending is strong in that it is powering a short- to medium-term growth rate of digital pharma ad
spend of 12% (as compared to our estimate of 6% growth for all pharma ad spend), and it is durable in
that we expect pharma digital ad spend to remain at this elevated growth rate of about 12% for the next
5 years. We further believe that WebMD (WBMD) and Everyday Health (EVDY) are well positioned to
capture this strong pharma digital ad spend.
We also believe that WBMD and EVDY are unlikely to be impacted by debates around drug pricing or a
direct-to-consumer advertising ban, and that social media will remain a limited threat.
The MEDACorp specialists believe that pharma digital ad spend growth should remain steady at 12% in
2016. The specialists cited the growing appeal of the measurability of digital marketing to pharma brand
managers along with the necessity to use digital to reach millennials as being behind the durability of
digital's relatively high growth rate in the pharma ad budget. In addition, the specialists see a continued
strong pipeline of new drug approvals coming online in 2016. This supports our thesis of digital ad
spend growth remaining strong and steady in 2016.
WBMD and EVDY are likely to maintain their premier positioning. Both companies have become
important destinations for pharma brands seeking to reach consumers and healthcare professionals.
Despite many changes for online media and online health media in recent years, the specialists see
both companies maintaining this position with pharma brands. Although social media platforms such as
Facebook and Twitter are grabbing more consumer attention, the specialists do not see these
companies posing a competitive challenge in the next few years and note that most pharma companies
remain hesitant (see below). This supports our thesis of online health media remaining a preferred ad
channel for pharma.
Drug pricing concerns are unlikely to impact pharma ad spend. The stories dominating US pharma drug
pricing recently are a mix of media sensationalism and politics, in the specialists' view. One of the
specialists sees little to no impact to pharma's marketing spend, but noted that pharma companies are
conscious of the debate and should be ready to respond to it, possibly by educating the public on the
drug approval process and investment that goes into new drug development. The other specialist
doesn't see pharma ad spend being affected by drug pricing concerns next year except potentially in the
oncology category due to high-priced drugs that provide limited benefit, but sees this as merely a
potential headwind and not a driver of lower overall pharma ad spend. We generally agree with the
specialists on this topic.
The American Medical Association’s 2015 vote to ban direct-to-consumer advertising of prescription
drugs is mostly noise. The specialists do not believe the AMA's effort here will have legs, and they
expect little will come of it. They cite that the FDA has historically been slow to change, it would take a
70
HEALTHCARE IT & DISTRIBUTION February 23, 2016

long time for this policy to be implemented if at all, and the pharma industry is one of the top lobbyists in
Washington and would seek to block any moves.
In social media advertising, pharma trails consumer brands. Our specialists see pharma as still hesitant
to advertise on social media platforms such as Facebook and Twitter, which is good news for
advertising destinations WBMD and EVDY. Due to FDA regulations on pharma social media ads, space
constraints on social media such as Twitter, the risks of placing branded content next to open forums,
and the fact that greater traffic can usually be found on health content sites, pharma brands have mostly
resisted social platforms and have spent ad dollars on online publishing platforms such as WBMD and
EVDY. While the FDA has published some guidance documents, the specialists agreed that it is more
difficult for pharma to advertise in the social arena, and pharma brands are still hesitant. However,
advertising agencies are becoming more creative, and they expect to see greater social media spend
from pharma in 2-3 years. This supports our view of limited impact from social media on pharma ad
spend in online health media.
Outlook for Consumer Directed Benefits Remains Robust, Benefiting HQY, WAGE
Consumer Directed Benefit (CDB) accounts are Health Savings Accounts (HSAs), Flexible Spending
Accounts (FSAs), and Health Reimbursement Arrangements (HRAs) that allow employees to preserve
the tax benefit associated with employer-sponsored healthcare while spending their own money on their
healthcare. Consumer Directed Benefits, especially HSAs, are of growing interest to employers and
employees as employers shift larger amounts of healthcare costs onto employees in order to cut their
healthcare costs. Leading vendors of these accounts include HealthEquity and WageWorks.
Important issues in the sector include whether the next few years will see continued employer
healthcare cost shifting onto employees and what kinds of employer-sponsored healthcare benefits will
gain from this and whether HSAs will retain their high 20%+ growth rate in 2016. In an effort to answer
these questions we spoke with MEDACorp specialists who are market researchers and consultants in
the Consumer Directed Benefits sector.
Consumer Directed Benefit Accounts Remain a Focus for Employers
For 2016, the specialists said they are seeing employers, both in RFPs and in enrollment discussions,
continue to focus on the CDB marketplace. Many companies are either adding high deductible health
plans (HDHP) as an additional plan option for the 2016 benefit year or moving to “full replacement” --
where a HDHP is the only plan offered by the employer. As a result, enrollment in HSA accounts (which
are attached to HDHPs) continues to grow.
HSA Accounts Are Seen Growing 20-22%
A recent America’s Health Insurance Plans (AHIP) survey cited by one of the specialists points to only
10-15% adoption in the HSA market, indicating that market penetration is low and there is room to grow.
While the Consumer Directed Benefit account market remains under-penetrated, the specialists agreed
that growth is likely to remain steady in the 20-22% range with the main hindrance to growth being the
education barrier, as many consumers don’t know about or fully appreciate the tax advantages of
FSA/HRA/HSA accounts and how to utilize them. One of the specialists feels that the tipping point has
occurred this year and we should see an acceleration of adoption from ~11% today to over 50% in the
next several years, particularly among younger employees. Millennials will soon become the dominant
member of the workforce, and this specialist expects to see a change in employee behavior as these
younger workers take charge of their health plans and are more likely to select the high deductible
health plan. The movement to private exchanges is also a tailwind to HSA accounts since HDHP plans
71
HEALTHCARE IT & DISTRIBUTION February 23, 2016

are selected nearly half the time on the exchanges vs. ~20% of the time at employers who offer both
types. The specialists’ conversations with employers reveal that most are finding that the HSA is the
preferred account with their new plan design.
Both specialists see HRAs as falling out of favor citing their lack of flexibility including the inability of
employees to take the accounts with them. HRA accounts are owned and funded by the employer, and
although they appear more favorable to employers, they are seeing employers adopting HSAs more
and more frequently. FSA accounts, given their $2,500 cap, are expected to remain relatively low
growth.
Employees Are Not Fully Utilizing Their HSAs, Providing Further Room for Growth
The specialist from the HSA market research firm noted that this year contributions to open HSA
accounts have only been ~25% of the legal maximum. He counts approximately $20 billion in
contributions across 15M accounts, but if these accounts were fully utilized balances would be north of
$70 billion. Most account holders (50-60%) fall into the “Spender” category -- those with <$1,000
balance – where behavior is more indicative of the use-it-or-lose-it model of the HRA account from
where they likely migrated. The “Savers” (those with $1,000-5,000) and “Investors” ($5,000+) make up
the minority of the accounts, though the “Investors” are not necessarily investing their cash balances.
Finally, the specialist notes that asset growth should continue to outpace account growth given the
installed base of 15M accounts that continue to receive funding and the addition of new accounts’ initial
funding.
Competition in the Sector Is Fragmented
While HSA accounts are growing industry-wide at 20-22%, HQY is growing ~2x as fast due to scale
economies, a dedicated sales force and active marketing. According to the market research specialist,
there are approximately 2,400 HSA account vendors in the U.S. today, most of which are banks
conducting primarily passive sales. For example, a typical credit union (of which there are 700-800) that
offers CDB accounts has no dedicated sales person or specialized FSA/HRA/HSA brochure -- only a
teller that responds to a customer’s inquiry for a CDB account. These smaller financial institutions don’t
have the scale to grow at the 30-40% rate posted by WageWorks and HealthEquity. Both of the
specialists agreed that the industry is a scale game and that some consolidation is likely as some banks
or institutions decide to opportunistically sell their business rather than invest to scale it further. We
agree with the specialists and see sporadic deal announcements from WAGE and HQY that can
contribute to growth, but not a steady stream of consolidation.
HSA Survey Points to Steady Growth for WAGE and HQY
In February 2016, Devenir Research released its 2015 Year-End Health Savings Account (HSA) Market
Survey, which showed industry accounts grew 22% to 16.7M accounts and AUM grew 25% to $30.2B, a
strong growth rate that is in-line with our view of the HSA industry. We note that the 2014 survey
revealed that accounts grew 29% and assets grew 25%, but we are not concerned by the deceleration
in account growth in 2015 as this trajectory has been in place as the industry has grown. Overall, we
believe these data points are supportive of our view of continued strong growth of Consumer Directed
Benefit (CBD) accounts driven by employers' desire to move employees into cheaper high-deductible
health plans. This trend continues to benefit CDB account vendors HQY (OP) and WAGE (OP).
For 2016, Devenir forecasts HSA assets to reach $37.4B, representing similar steady y/y growth of
24%. This is down slightly from the firm's mid-2015 report, which forecasted assets to reach $38.1B in
2016, or growth of 26%. Devenir does not offer an official forecast for accounts, which is the key driver
72
HEALTHCARE IT & DISTRIBUTION February 23, 2016

of HSA revenue for HQY and WAGE, but on our December MEDACorp Pulse Call, the specialists
indicated that they expect industry HSA account growth to remain over 20% with non-bank custodians
like HQY and WAGE experiencing more rapid HSA account growth due to their greater sales &
marketing focus including consumer education efforts.
Big Employers Like Digital Health Benefits for 2016
The Digital Health benefits sector includes companies like Teladoc (TDOC), Castlight (CSLT), Fitbit
(FIT), and WebMD (WBMD). Large employers are a major purchaser of Digital Health benefits, and their
buying decisions around issues like whether to continue spending budgets on Wellness Programs
(WBMD, FIT), transparency (CSLT), and telehealth (TDOC) have a big impact on the success of the
Digital Health benefits sector.
We are incrementally more positive on the Digital Health benefits sector after attending an industry
conference for big employers in 4Q15 and speaking to healthcare benefit leaders buyers. Conference
attendees were benefit leaders who are big buyers of health benefits and thought leaders in the
employer community. Overall, we are impressed by the degree to which benefit leaders look to Digital
Health vendors to optimize their biggest benefits. We expect the increased drive by benefit buyers
toward consumerizing employer benefits and improving employee engagement to provide a tailwind to
vendors in the health transparency, telehealth, wellness, and second opinions sectors, among others.
Trends for 2016 Benefits Season. We have found that progressive benefit leaders are driving the
consumerization of the benefits that they offer employees and are now targeting a suite of consumer
tools to empower employees. Vendor categories benefiting from this shift toward a "consumerization
suite" include telehealth (TDOC), transparency (CSLT), and second opinions. Another trend is the
promise of increased employee engagement in health benefits enabled by mobile devices. Categories
receiving increased interest from buyers due to this shift include wellness (WBMD, FIT), telehealth
(TDOC), transparency (CSLT), and benefit hubs.
Our interpretation. We also observed growing competition among Digital Health vendors, with new
entrants and growing sophistication among vendors. We also observed growing interest in Digital Health
benefits from benefit leaders at large employers. For TDOC, we found a very high level of interest in the
telehealth category this year and buyer satisfaction with Teladoc. For FIT, a relative newcomer in the
corporate wellness sector, we found significant conference buzz and curiosity about their solution. For
WBMD, we saw very high booth traffic and interest in their top brand, comprehensive wellness suite,
and mobile enablement. And for CSLT, we found strong market acceptance of transparency and a
differentiated positioning for Castlight in enterprise healthcare management.
Healthcare IT Budgets Appear Solid in 2016 Despite Macroeconomic Concerns and Some Calls
for Weaker Hospital Profitability
In early 2016, investors are concerned about the health of the hospital IT budget. A number of market
observers are predicting that 2016 will be a lean year for profitability for the hospital sector in general
and are further drawing the conclusion that 2016 will also be a lean year for hospital IT budgets, which
by implication will hurt the sales of healthcare IT software vendors that sell into the hospital IT budget.
To address these concerns, in 1Q16 we spoke with two MEDACorp specialists (one a hospital system
CIO and the other a former CIO and now a consultant) examining the outlook for hospital IT budgets in
2016. We came away confident that healthcare IT spend will be up and will benefit companies like
Nuance (NUAN), Imprivata (IMPR), and Press Ganey (PGND).
73
HEALTHCARE IT & DISTRIBUTION February 23, 2016

Total hospital HCIT and Digital Health spend expected to rise in 2016 relative to 2015. While there
has been significant headline news around challenging hospital budgets, our checks indicated that total
HCIT investments in 2016 will likely rise over 2015 for the majority of hospitals. Furthermore, there is a
greater focus on population health management and value-based care now than there has been in
previous years. We do expect a slowdown in core EMR purchases, and Cerner's recent string of top-line
misses likely reflects the timing of Meaningful Use. However, the specialists indicated that total
contracted spend with several large vendors will likely rise in 2016 relative to 2015.
In addition, on our behalf MEDACorp conducted in February 2016 a survey of 50 hospital administrators
on their spending priorities for 2016. 28% of respondents said that their capital spending budget would
increase over the next 12 months while 72% said that it would remain the same. We believe this finding
is consistent with the thesis that the hospital IT budget will remain strong in 2016, benefiting Digital
Health vendors that sell to hospitals.
We further looked at the hospital ancillary system market, which contains systems that are ancillary to
the core EMR market and includes systems like speech recognition (from vendors like Nuance), single
sign-on (from vendors like IMPR), and patient experience measurement (from vendors like Press
Ganey). Here, 79% of respondents said that they expect their spending on these systems to stay the
same in 2016; 20% said that they expect their spending to increase; and only 2% said that they expect
their spending to decrease.
Overall, the specialists don’t see the recent macro worries impacting hospital IT budgets, and
expect spending to be up. They cited and agreed with a 2015 HIMSS survey that reported that two-
thirds of hospital CIOs plan to increase their IT operating budget. However, they expect spend to be
more directed toward services and consulting than software, as hospitals need help deriving insights
from their data. And while 2016 budgets were set several months ago, actual spend has the potential to
vary throughout the year as revenue and cost constraints materialize from a weaker economic
environment. One of the specialists sees 2016 and 2017 as important preparation years ahead of value-
based care coming in 2018, and this should keep hospital technology investment up as hospitals need
to remain competitive for value-based care contracts. Growth of IT spend is likely to come from
additional licenses rather than large new contracts as hospital consolidation continues and
beds/physicians are added to a health system. Consolidation also increases the need for system
integration, which may benefit middleware vendors such as dbMotion (Allscripts).
Nuance’s voice recognition is expected to see increased spending from consolidation and
expansion across departments. One specialist sees strong growth from community hospital
consolidation as more beds/doctors from rural/community hospitals are rolled up into his system. He
sees spending increasing 2-3 fold. The other specialist said Nuance spend will not be up as significantly
but he does plan to expand the voice recognition platform into his cancer center.
Press Ganey appears to have an opportunity in consulting services. While the specialists have
been long-time customers of PGND in discerning patient satisfaction in their health systems, they both
felt there will be greater demand from hospitals to understand their data and implement plans to
improve patient experience and care coordination. Improving employee engagement was mentioned as
another area of interest -- a service that currently represents approximately 10% of PGND’s revenues
whereas consulting services today are around 1%.
74
HEALTHCARE IT & DISTRIBUTION February 23, 2016

The specialists have had positive experiences with Imprivata for single sign-on, but were split on
purchases going forward. One believed many hospitals have moved or are moving to a single EMR
where doctors will only need to sign into one system, and so the demand for single sign-on today is less
than it was 5 years ago. The other saw his hospital system spending more with IMPR, as not everything
is stored in the EMR, citing the need to link into systems while requiring authentication. This specialist
was pleased with IMPR's solution and support.
Hospital regulations drive some IT spend. With Meaningful Use 2 over, the specialists are interested
to see what Meaningful Use 3 holds, and both expressed an interest in seeing a commonality
requirement for patients’ multiple portals -- a long-running area of confusion for patients. Consumer
Assessment of Healthcare Providers & Systems (CAHPS) programs, they said, are likely to trigger
some spending, but it may not be a significant increase. We expect ICD 10 to benefit Nuance in 4Q15
and for a couple of quarters afterward through its Clintegrity 360 coding solution, and CAHPS programs
to provide an ongoing tailwind for Press Ganey.
75
HEALTHCARE IT & DISTRIBUTION February 23, 2016

Subsector Overview
As previously mentioned in the PHM section, the breadth of firms that utilize digital health and satisfy
PHM requirements has led us to divide our coverage into four subsectors: Consumer & Value-Based
Care Solutions (CVBCS), Core SaaS Solutions (CSS), Telehealth & Remote Medicine (TRM), and
Wearables & Interactive Devices (WIDs). The category titles and brief definitions are reprinted below:
Category Definition
Consumer & Value-Based Care Solutions
(CVBCS)
Programs designed to maximize access and quality of healthcare at the lowest
possible cost. They increase transparency between patient and provider, providing a
marketplace platform where patients can choose treatment based upon cost, ratings,
and other subjective criteria. CVBCS programs place a heavy emphasis on patient
education and are linked to the ACO-risk sharing payment model.
Core SaaS Solutions (CSS)
Software programs employed within payer and provider organizations to improve
accessibility and storage of electronic medical records (EMRs) and other organizational
information.
Telehealth & Remote Medicine (TRM) Digital telecommunication that allows patients to access medical providers in remote
locations, typically through teleconferencing.
Wearables & Interactive Devices (WIDs) User-driven digital technology that allows patients to track their physiological vitals
using mobile apps or probes worn on their body.
Source: Leerink Partners LLC
As mentioned, PHM vendors are concerned with the optimization of the Iron Triangle of Healthcare (see
diagram below), with an emphasis from the government on performing these tasks at the lowest cost
possible. In an era marked by a rapidly growing technology sector that has made mobile computing
devices, software, and medical devices affordable and user-friendly, vendors currently looking to
improve PHM overwhelmingly offer their services through digital mediums. This has led to significant
overlap between PHM and Digital Health vendors. Although the current digital healthcare infrastructure
is built upon legacy software systems, we believe that government financial incentives have prompted
innovation to develop a nationwide healthcare cloud-based system.
The Iron Triangle of Healthcare
Source: Leerink Partners LLC, 2016
We have chosen to analyze approximately 30 public companies and 200 private companies that
specialize in healthcare information technology, looking for themes and trends among them. In many
cases, these companies directly compete with one another with comparable products and clientele. We
found connections between companies on the products or services offered and their target audience.
Cloud-based data analytics programs, consumer education forums, healthcare-focused software-as-a-
service (SaaS) programs, mobile applications, telehealth devices, and wearable tracking devices were
prevalent within this sector. These products were typically targeted toward healthcare providers,
76
HEALTHCARE IT & DISTRIBUTION February 23, 2016

patients, or both. In some cases, products would target payers, government programs, or suppliers.
Based upon this criterion, we differentiated companies and created our subsectors. While all of these
companies attempt to achieve the same goal of population health efficiency through digital mediums,
they offer different products that cater to different consumers. This logic can be seen in the following
figure:
Source: Leerink Partners LLC, 2016
Total Addressable Market for CVBCS, CSS, TRM, & WIDs Subsectors
Calculating the total addressable market (TAM) for each subsector can be tricky because much of it is
based upon predictions, past growth trends, and total healthcare spending. In its 2015 Global health
care outlook, Deloitte estimates that total global healthcare spending is predicted to grow by an average
of 5.2% per year between 2014 and 2018, reaching $9.30 trillion by 2018. Using these figures, that
would equate to global health spending of approximately $8.81 trillion in 2017. Statista predicts that the
total global market for Digital Health should grow to $135.9B by 2017. We have decided to use the
$8.81 trillion figure to serve as the TAM for healthcare and the $135.9B figure to represent the “served
market” for the digital healthcare sector. Individual subsector market sizes were obtained from BCC
Research, MarketsandMarkets, PwC, and TekCarta. In cases where forecasts for multiple subsector
products are listed, we simply added these market sizes together.
After compiling this data, we found that by 2017, CVBCS should have a target market of about $12.5B,
CSS of $30.2B, TRM of $31.3B, and WIDs of $23.0B.
Population Health Management (PHM)
Cross section of better health outcomes, coordinated care, and overall value to a population-focused health system. Programs optimize access, cost, and quality of care to deliver the highest access and quality at the lowest cost.
Digital Health
Convergence of the healthcare system with digital technology platforms.
Subsector
Consumer & Value Based Care Solutions
(CVBCS)
Core SaaS Solutions (CSS)
Telehealth & Remote Medicine (TRM)
Target Audience
Government, Patients,
Payers, Providers
Primary: Providers Secondary: Payers,
Government
Patients, Providers
Products
Consumer education forums, healthcare social networks, healthcare marketplaces,
healthcare analytics
Healthcare SaaS programs; clinical information systems,
non-clinical information systems
Telehealth/telemedicine platforms, remote tracking
devices
Wearables & Interactive Devices
(WIDs)
Primary: Patients
Secondary: Providers
Mobile health applications, wearable health-tracking devices
77
HEALTHCARE IT & DISTRIBUTION February 23, 2016

Total Addressable Market for CVBCS, CSS, TRM, & WIDs Subsectors
Source: BCC Research - Global Markets for Telemedicine Technologies, Sept. 2014; CB Insights, July 2015; Deloitte 2015
Global health care outlook; MarketsandMarkets, Aug. 2015; PwC - Touching lives through mobile health, Feb. 2012;
Statista - Digital Health Dossier, April 2015; TekCarta, Aug. 2013
Market Opportunity
Initial Opportunity Healthcare in highest demand
for big data hiring; internet traffic to hit 7,694 petabytes in
2015; healthcare analytics totalled $488M in funding in
2014
Future Opportunity
Internet traffic expected to double by 2019 to 16,092
petabytes; global market for healthcare analytics expected to reach $21.4B by 2020 and social media expected to hit
$30.1B by 2017
Market Opportunity
Initial Opportunity
SaaS services most common type of cloud-based app;
$11.1B EMR global market in North & South America; CMS
offering $27B in incentives through HITECH Act; $1.52B in
funding in 2014
Future Opportunity
CMS to begin issuing penalties for firms without EMR MU in
2015; global market for healthcare cloud computing
expected to reach upwards of $12.9B by 2020
Market Opportunity
Initial Opportunity
Highly fragmented market with no firm holding a share greater than 10%; 26 states currently have laws requiring telehealth coverage and another 10 have
similar proposals in place; $1.48B in funding in 2014
Future Opportunity
Predicted shortage of 20,400 primary care physicians by
2020; industry revenue expected to increase by a
CAGR of 47% between 2014 and 2017
Market Opportunity
Initial Opportunity
Estimated 40+ million active gym users in the U.S.; current
global revenue of $10.2B; $1.39B in funding in 2014
Future Opportunity
Global market estimated to grow by a CAGR of 43.4% between 2013 and 2018,
reaching $30.3B; government and employer insurance
programs beginning to favor wearable tracking devices for
population health
78
HEALTHCARE IT & DISTRIBUTION February 23, 2016

Population Health Management & Digital Health Matrix
The following figure provides a visual summary of how a select list of private companies appears when
comparing their 2017 estimated market size classification to their total investments. The 30 private
companies with the highest total investments were chosen to form this graph. Generally, a company
farther up and to the right is seen as in the most secure position to generate the highest revenue. Due
to skew, Emdeon, Inc. (Market Size: $10.9B, Total Investments: $2.2B) and Truven Health Analytics
(Market Size: $10.9B, Total Investments: $1.25B) were excluded from the figure.
Sources: BCC Research - Global Markets for Telemedicine Technologies, Sept. 2014; CB Insights, July 2015; Deloitte
2015 Global health care outlook; MarketsandMarkets, Aug. 2015; PwC - Touching lives through mobile health, Feb. 2012;
Statista - Digital Health Dossier, April 2015; TekCarta, Aug. 2013
$-
$5.0
$10.0
$15.0
$20.0
$25.0
$30.0
$35.0
$- $100 $200 $300 $400 $500 $600 $700
Targ
et M
arke
t U
SD($
) in
bill
ion
s
Total Investment USD($) in millions
PHM & Digital Health Matrix *Based upon 2017 estimates
79
HEALTHCARE IT & DISTRIBUTION February 23, 2016

Consumer & Value-Based Care Solutions
Shifting Economic Incentives: Balancing Access, Price, & Quality
Introduction & Overview
Consumer & Value-Based Care Solutions (CVBCS) consist of programs that are designed to optimize
access, cost, and quality of healthcare delivery through a combination of benchmarks, consumer
ratings, and patient education. CVBCS programs oftentimes perform these tasks through web-
accessible platforms that increase the level of transparency between patient and provider. Depending
on the services offered, these programs may target patients, payers, or providers as their main clients.
CVBCS programs are typically divided into two subsectors by investors: healthcare analytics and
healthcare social networks & marketplaces (HSNMs).
CVBCS Hierarchy of Sectors
Source: Leerink Partners LLC, 2016
Much of the demand for CVBCS vendors is derived from improvements in smartphone technology and
increased consumer access to the internet. According to the Pew Research Center, 87% of U.S. adults
use the internet, 90% own a cell phone, and 58% own a smartphone. Of those with access to the
internet, 72% of internet users used the internet to look up health information in 2014. In addition, 31%
of cell phone owners and 52% of smartphone owners have used their device to look up information
about a condition, symptom, treatment, or general health question. Another 19% of smartphone owners
have also downloaded an app that manages their health. As more patients and providers turn to the
internet and cloud storage for healthcare information, CVBCS programs have become readily available
platforms for consumers.
Like many population health management tools, CVBCS affects healthcare by increasing access to
treatment, decreasing costs through fewer provider appointments, and increasing treatment quality.
Healthcare analytics tools aggregate large amounts of data and organize inputs at the request of the
client. These tools are particularly helpful for providers in disease management, decision-making, and
public health tracking. In addition, these aggregated statistics allow patients and payers to assess
treatment risks and use precedents to influence their scope of treatment. Similarly, healthcare social
networks & marketplaces help both patients and providers connect with one another through an online
forum for an array of possibilities, such as asking questions, rating physicians or facilities, and
collaborating with fellow professionals. In addition, these online forums can be used as marketplaces by
consumers to shop healthcare plans, providers, or procedures. By providing a space where a consumer
Consumer & Value-Based Care Solutions (CVBCS)
Healthcare Analytics
Healthcare Social Networks &
Marketplaces (HSNMs)
80
HEALTHCARE IT & DISTRIBUTION February 23, 2016

can compare pricing and ratings, patients are able to make more informed, cost-conscious decisions
about their treatment.
While CVBCS vendors have a short track record on the public market, there is potential for them to
capitalize on a growing internet-savvy global population and take market share away from online giants
Amazon.com, Inc. (AMZN), Facebook, Inc. (FB), or LinkedIn Corp. (LNKD). WebMD Health Corp.’s
(WBMD) 2005 IPO demonstrated the ability of a healthcare pure-play to capitalize on the online media
market. In addition, the growing need for both patients and providers to justify procedures with
supporting data has opened up an opportunity for healthcare analytics vendors to serve as conduits for
this data collection. As both private equity and venture capital investments have increased over the past
three years, we anticipate that increasing patient involvement, widespread access to the internet and
internet-accessible devices, and incentives to cut healthcare costs will lead to economic growth within
this sector in order to better serve the needs of patient populations.
21st Century Statistics: The Demand for Big Data Analytics
With the onset of significant technological advancements in computing and the growing trend of making
decisions based upon statistical precedents, there has been an increase in the number of software
vendors that create programs that focus on aggregating data inputs. According to Wanted Analytics,
Healthcare, Professional, Scientific, & Technical Services (26%), Information Technologies (17%),
Manufacturing (15%), Finance & Insurance (9%), and Retail Trade (8%) make up the top five employers
for big data analysts.
Source: Wanted Analytics, June 2015
This increased demand for big data expertise is largely due to the upward increase in global consumer
web usage and data traffic. Statista found that 5,853 petabytes per month were transferred across the
internet in 2014. For context, a petabyte is equal to 1,000 terabytes or 1 million gigabytes (GB). For
reference, a standard iPhone data plan is ~10GB, so 1 petabyte is equal to about the monthly usage of
100M iPhones. This traffic is set to grow rapidly over the next several years. Rock Health calculates that
the amount of data streamed across digital mediums is growing 40 times faster than the world
population and should become a $50B market by 2017.
26%
17%
15%
9%
8%
4%
4%
2%
15%
Top 10 Industries Hiring Big Data Expertise
Healthcare, Professional, Scientific, &Technical Services
Information
Manufacturing
Finance & Industry
Retail Trade
Administrative & Support
Wholesale Trade
Educational Services
Other Services
81
HEALTHCARE IT & DISTRIBUTION February 23, 2016
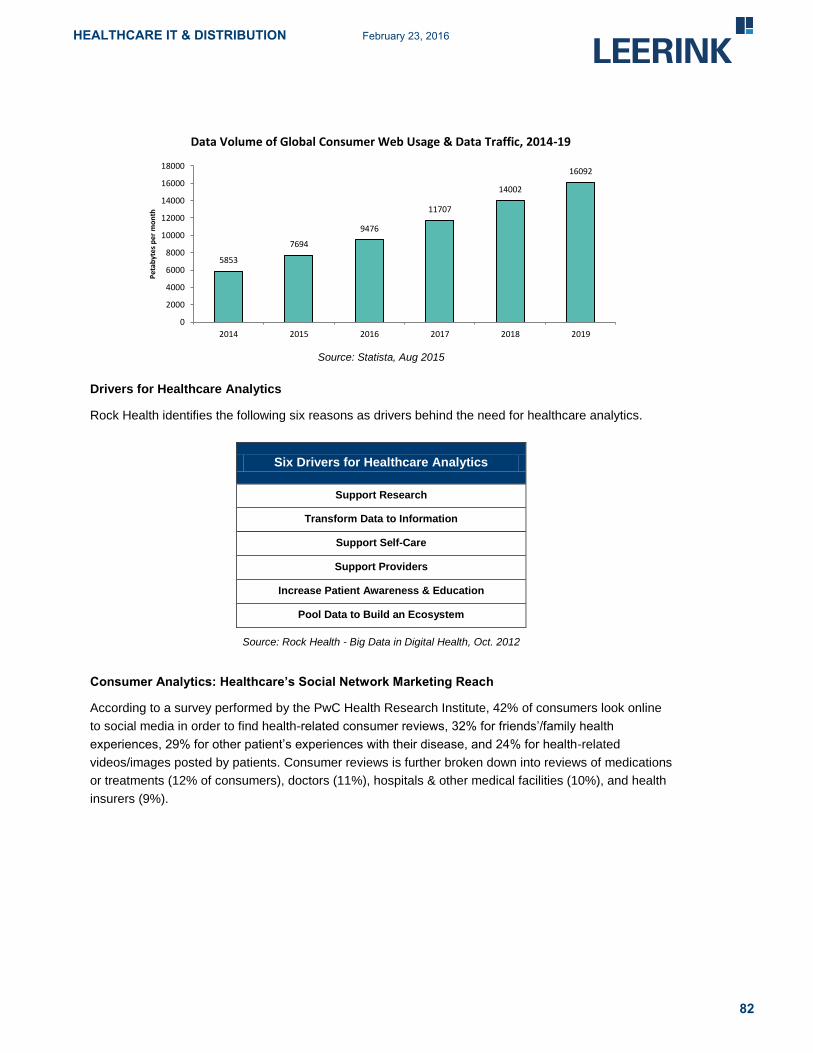
Source: Statista, Aug 2015
Drivers for Healthcare Analytics
Rock Health identifies the following six reasons as drivers behind the need for healthcare analytics.
Six Drivers for Healthcare Analytics
Support Research
Transform Data to Information
Support Self-Care
Support Providers
Increase Patient Awareness & Education
Pool Data to Build an Ecosystem
Source: Rock Health - Big Data in Digital Health, Oct. 2012
Consumer Analytics: Healthcare’s Social Network Marketing Reach
According to a survey performed by the PwC Health Research Institute, 42% of consumers look online
to social media in order to find health-related consumer reviews, 32% for friends’/family health
experiences, 29% for other patient’s experiences with their disease, and 24% for health-related
videos/images posted by patients. Consumer reviews is further broken down into reviews of medications
or treatments (12% of consumers), doctors (11%), hospitals & other medical facilities (10%), and health
insurers (9%).
5853
7694
9476
11707
14002
16092
0
2000
4000
6000
8000
10000
12000
14000
16000
18000
2014 2015 2016 2017 2018 2019
Pet
abyt
es p
er m
on
th
Data Volume of Global Consumer Web Usage & Data Traffic, 2014-19
82
HEALTHCARE IT & DISTRIBUTION February 23, 2016

Source: PwC Health Research Institute, April 2012
In addition to significant consumer usage, PwC found that respondents were comfortable with their
provider using an online community of other providers to obtain information that better treated their
condition. 54% of respondents were either “comfortable” or “very comfortable” with their provider using
online forums, such as HSNMs, for treatment information.
Source: PwC Health Research Institute, April 2012
In the survey, PwC also highlighted both the individual and company benefits for using social media
platforms. The benefits are paraphrased below:
Individuals Healthcare Companies Gauge another person’s experience - see how others react to
symptoms and treatments
Find support - use social media to receive support from
others
Understand the disease - perform research on the condition
in order to improve exchanges with providers, payers, and
others
Obtain real-time information
Formulate thoughtful, timely responses - the buffer of using
an online allows the provider ample time to assess questions
Better understand patient feelings between visits
Reach a larger audience - social media platforms provide a
stage for providers to reach more consumers and educate a
wider range of patients, cutting down on unnecessary
appointments
Source: PwC Health Research Institute, April 2012, Leerink Partners LLC, 2016
17%
37% 23%
14%
9%
Consumer Comfort Level (n = 1,060)
Very comfortable
Comfortable
I don't care
Uncomfortable
Very uncomfortable
83
HEALTHCARE IT & DISTRIBUTION February 23, 2016

Barriers to Success
The primary concern for CVBCS products revolves around security and assurance that personal
information is kept safe and private. In the past, social networking has been a popular target for
malicious software and hackers looking to exploit platform users. As new social network forums are
formed, there remains concern from consumers that these products are vulnerable to security threats.
For healthcare analytics products, there must be assurances that collected information, particularly
clinical, is kept private and that any patient data are kept safe and anonymous. Part of the success of
CVBCS products will depend on their ability to address these issues with a reliable track record among
consumers.
The Global Market for CVBCS
In order to estimate the size of the global and domestic markets for CVBCS, it must be divided into two
categories: healthcare analytics and healthcare social networks & marketplaces (HSNMs). For the
global healthcare analytics market size, MarketsandMarkets estimates a 2014 market size of $5.5B that
should grow to $21.4B by 2020. This would assume a CAGR of 25.2% from 2013-2020.
Source: MarketsandMarkets - Healthcare Analytics Market, July 2015
Since HSNMs are a recent development, there is not much market research available to gauge its exact
market size. Using metrics for the market for social networking, however, allows us to form an idea of
the potential market available to HSNM vendors. The Radicati Group estimates that there are currently
1.2 billion users who manage 3.9 billion social networking accounts. On average, each user manages
about three accounts. Based on data from 2011-2015, this equates to a 10.2% CAGR for the number of
social network users and a 9.1% CAGR for social networking accounts. Using these growth rates as a
future predictor, it is estimated that there will be 1.5 billion users managing 4.7 billion social networking
accounts by 2017.
$4.4 $5.5
$6.9* $8.7*
$10.9 *
$13.6*
$17.1*
$21.4*
$-
$5.0
$10.0
$15.0
$20.0
$25.0
2013 2014 2015 2016 2017 2018 2019 2020
USD
($)
in b
illio
ns
Global Healthcare Analytics Revenue, 2013-2020
*Estimated
84
HEALTHCARE IT & DISTRIBUTION February 23, 2016

Source: The Radicati Group, Inc., March 2011
TekCarta estimates the current market size for social networking to be $20.8B. Based upon a 13.2%
CAGR, this market should grow to $30.1B by 2017. IBISWorld, Inc. is more conservative with their
figure, estimating current total market revenue of over $11B based upon a 25.4% CAGR between 2010
and 2015.
Source: TekCarta - Technology Industry Research, Aug. 2013
Based upon healthcare’s market share of consumer smartphone and tablet applications, which is about
5%, we posit that HSNMs will mirror this share and could control about 5% of the total social networking
market. Conservatively, that would lead to a current market size for HSNMs of about $1.0B that could
reach $1.5B by 2017.
0.8 0.9 1.0
1.1 1.2
1.4*
1.5*
0.0
0.2
0.4
0.6
0.8
1.0
1.2
1.4
1.6
2011 2012 2013 2014 2015 2016 2017
Nu
mb
er o
f U
sers
in b
illio
ns
Number of Worldwide Social Networking Users
*Estimated
2.4 2.7
3.1 3.5
3.9 4.3*
4.7*
0.0
1.0
2.0
3.0
4.0
5.0
2011 2012 2013 2014 2015 2016 2017
Nu
mb
er o
f A
cco
un
ts in
bill
ion
s
Number of Worldwide Social Networking Accounts
*Estimated
$16.2
$18.3 $20.8*
$23.5*
$30.1*
$-
$5.0
$10.0
$15.0
$20.0
$25.0
$30.0
$35.0
2013 2014 2015 2016 2017
USD
($)
in b
illio
ns
Social Networking Global Market, 2013-2017
*Estimated
85
HEALTHCARE IT & DISTRIBUTION February 23, 2016

Source: TekCarta, Aug. 2013 and Leerink Partners LLC, 2015
It is important to note that these social networking market estimates are primarily driven by funding from
advertising within websites. Gartner, Inc. estimates that about 90% of all revenue from social media
websites is obtained from advertising. HSNMs are uniquely positioned compared to other online forums
because they are much more specialized and attractive to investors who want to plan targeted
campaigns.
Healthcare Analytics Market Share by Volume
According to Statista, the largest big data vendor in the world by revenue (in 2013) was IBM. HP, Dell,
SAP, and Teradata rounded out the top five revenue generators. The following figure illustrates the top
10:
Source: Statista, Feb. 2016
$0.8 $0.9
$1.0
$1.2
$1.5
$-
$0.2
$0.4
$0.6
$0.8
$1.0
$1.2
$1.4
$1.6
2013 2014 2015 2016 2017
USD
($)
in b
illio
ns
HSNM Global Market Estimate, 2013-2017
$1,601
$932
$923
$687
$685
$544
$533
532
$498
$493
$- $200 $400 $600 $800 $1,000 $1,200 $1,400 $1,600 $1,800
IBM
HP
SAP
Teradata
Dell
Palantir
SAS Institute
Microsoft
Accenture
Oracle
USD($) in millions
Big Data Vendors 2013 Market Share by Revenue
86
HEALTHCARE IT & DISTRIBUTION February 23, 2016

For healthcare data analytics, IQ4I Research & Consultancy found that Cerner Corp. owns the largest
share in the healthcare analytics market, followed by McKesson Corporation and Epic. Cerner is seen
as the definitive market leader and is estimated to have about a 20% market share. The healthcare
analytics market is top-heavy and consolidated, with the top firms accounting for more than 80% market
share in 2013. The top 10 firms were Cerner Corp., McKesson Corp., Epic, IBM Corp., Optum, Oracle
Corp., Allscripts, MedeAnalytics, Truven Analytics, and Information Builders, Inc.
Revenue between these firms was divided into three primary types of streams: services, hardware, and
software. According to Statista’s 2013 Global Big Data Dossier, services (40%) was the largest revenue
generator, followed by hardware (38%) and software (22%).
In a 2015 survey by peer60 of over 950 healthcare leaders, which represent approximately 25% of the
U.S. healthcare systems, McKesson (19%) was deemed the market share leader for healthcare
analytics, followed by Epic (11%), and Cerner (10%). Oracle (5%), Tableau (4%), SAP (3%), and IBM
(3%) rounded out the top seven major firms.
Source: peer60 - 2015 Healthcare Tech Purchasing
By hospital size, however, these market share figures varied. McKesson was the individual market
share leader in all five size categories, demonstrating its universal popularity and viability. Cerner and
Epic also typically fluctuated among the top market share leaders. Other companies that appeared in
these hospital surveys were CPSI, Medisolv, MEDITECH, SAS, and Qlik. For hospitals under 100 beds,
MEDITECH controlled 5% of the market share, despite not appearing as a market share leader for any
other category.
19%
11%
10%
5% 4% 3% 3%
13%
32%
Healthcare Analytics Market Share Survey
McKesson
Epic
Cerner
Oracle
Tableau
SAP
IBM
Other
None
87
HEALTHCARE IT & DISTRIBUTION February 23, 2016

Source: peer60 - 2015 Healthcare Tech Purchasing
HSNM Market Share by Number of Visitors
When mapping the market share for websites and online social networks, a good metric to use is share
based upon the number of visitors. Since visitor counts and unique clicks are associated with
advertising reach and advertising accounts for about 90% of non-product revenue for social networks,
we have chosen this metric to determine market share. According to Statista, Facebook has the largest
market share, and the market is highly consolidated.
20%
13%
13%
13%
7%
7%
7%
7%
7%
7%
Healthcare Analytics Market Share Survey >1000 Beds
McKesson
Cerner
Oracle
Other
Epic
IBM
SAP
SAS
Tableau
None
88
HEALTHCARE IT & DISTRIBUTION February 23, 2016

Source: Statista, Oct 2015
These visitors came from a diverse global footprint, with 84% of the visitors coming from outside of the
U.S. China (35%) and the U.S. (16%) had the largest number of social media visitors, followed by India
(11%), Brazil (7%), Indonesia (6%), Russia (6%), and Germany (3%). Other countries outside of this
group of seven made up 17% of the total market share.
Source: Statista, Aug 2015
This global footprint is expected to expand between 2014 and 2018, with China expected to grow in
users by 24% and India by 46%. With this growth, India is expected to surpass the U.S. in market share.
The top seven countries are all estimated to grow by >10%.
45%
22%
1%
5%
4%
1% 1%
2%
1% 1%
15%
Social Networking Market Share by Number of Visitors
YouTube
Google Plus
Yahoo! Answers
Tumblr
Other
35%
16% 11%
7%
6%
6%
3%
17%
Social Networking Market Share by Number of Visitors
China
United States
India
Brazil
Indonesia
Russia
Germany
Others
89
HEALTHCARE IT & DISTRIBUTION February 23, 2016

Source: Statista, Aug. 2015
WebMD Alexa Ranking & Visitor Demographics
Given its widespread popularity and user-friendly design, WebMD serves as an archetype for many
HSNMs. As a search engine, WebMD ranks as the 89th most frequented website in the U.S. and 296th
globally as of July 7, 2015, according to Alexa Rankings. These users came from a global footprint, with
visitors from the U.S. consisting of 60% of all visitors to the site. India (10%), the United Kingdom (4%),
Canada (4%), and Australia (2%) rounded out the top five visitor origins list.
Source: Alexa.com, Feb. 2016
Users visiting WebMD typically made their way to the website from one of the major internet search
engines. Google.com (53%), yahoo.com (4%), bing.com (2%), facebook.com (2%), and google.co.in
(India) (2%) made up the top five search engines used to reach WebMD.
24%
46%
10%
35%
19%
15% 14%
0%
5%
10%
15%
20%
25%
30%
35%
40%
45%
50%
0
100
200
300
400
500
600
China India UnitedStates
Indonesia Brazil Russia Germany
Per
cen
tage
Gro
wth
Soci
al N
etw
ork
ing
Use
rs in
mill
ion
s
Number of Social Networking Users by Country
2014
2018*
Percentage
60% 10%
4%
4%
2%
20%
WebMD Audience Geography
United States
India
United Kingdom
Canada
Australia
Other
90
HEALTHCARE IT & DISTRIBUTION February 23, 2016

Source: Alexa.com, Feb. 2016
Alexa found the demographics of these visitors to be predominantly female, browsing from a school
location, who have either had a “some college” or “no college” education designation. WebMD’s
popularity as a go-to search engine for health inquiries demonstrates the potential reach of HSNMs.
Given the widespread global access to the internet, similar websites that can help internet users shop
healthcare plans, locate providers, or solve health-related inquiries have the potential to reach a global
market.
Top 10 Health Website Alexa Rankings
According to Alexa, the National Institutes of Health is the most frequented health-based website in the
world, and WebMD is the more frequented health-based website in the U.S. The top 10 rankings for
health-based websites are listed as follows:
Company Name
(Alexa Website Listing)
World Ranking
(U.S. Ranking)
National Institutes of Health (NIH) (nih.gov) 240 (100)
WebMD (webmd.com) 323 (96)
MyFitnessPal.com (myfitnesspal.com) 720 (163)
Mayo Clinic (mayoclinic.org) 882 (251)
Center of Disease Control (cdc.gov) 1,317 (482)
Drugs.com (drugs.com) 1,160 (437)
WeightWatchers (weightwatchers.com) 2,094 (470)
MedicineNet (medicinenet.com) 1,946 (764)
Medscape (medscape.com) 2,023 (717)
healthgrades (healthgrades.com) 2,157 (489)
Source: alexa.com “Health Rankings” - 2/16/16
53%
4%
2% 2%
2%
37%
Website Previously Visited Before WebMD
google.com
yahoo.com
bing.com
facebook.com
google.co.in
Other
91
HEALTHCARE IT & DISTRIBUTION February 23, 2016

Value-Based Care: The Economic Shift from Fee-for-Service toward Population-Based Payments
In 1983, under pressure from the government to address expensive hospital care, CMS adopted a
prospective payment system (PPS) for Medicare in order to shift the economic incentives for providers.
Medicare payments were subsequently changed from a per diem arrangement to a fee-for-service
(FFS) model. This FFS model, which pays providers based upon the number of treatments offered to a
patient, shifted provider behavior. Prior to 1983, providers were reimbursed based upon the number of
days a patient was treated. Once this shift was established, a noticeable trend occurred as the average
length of stay (ALOS) of patients within hospitals sharply declined. A corresponding coding system of
diagnosis-related groups (DRGs) was also created that listed guidelines and rates for each type of
treatment.
Until the ACA was passed in 2010, FFS was the predominant form of reimbursement across all payment
plans. Following the adoption of PPS, private, commercial plans began offering similar FFS models. The
ACA’s focus on population health looked to curb healthcare spending by shifting the financial incentives
away from volume-based to performance-based reimbursement. CMS began changing its
reimbursement framework to account for provider performance, and the subsequent formation of ACOs
began placing financial risk on providers in order to encourage them to be cost-conscious with their
treatment of patients. This system has been coined as population-based payments (PBPs) and was
formally incorporated into Medicare and Medicaid by CMS in 2014. PBPs are also commonly referred to
as value-based payments (VBPs) or pay-for-performance (P4P) reimbursement.
We expect that the usage of PBPs within Medicare and Medicaid will eventually be adopted by
commercial and private payers. Going forward, it can be estimated that PBPs will be the universal
payment model for insurers. The CMS payment framework is summarized in the following table:
Payment Taxonomy Framework
Category 1
Category 2
Category 3
Category 4
Fee-for-Service - No
Link to Quality (FFS)
Fee-for-Service - Link to
Quality
Alternative Payment
Models Built on Fee-for-
Service Arrangement
Population-Based
Payment (PBP)
Description
Payments are based on
volume of services and
not linked to quality or
efficiency
At least a portion of
payments varies based on
the quality of efficiency of
health care delivery
Some payment is linked to
the effective management of
a population or an episode
of care. Payments still
triggered by delivery of
services, but opportunities
for shared savings or 2-
sided risk
Payment is not directly
triggered by service
delivery so volume is not
linked to payment.
Clinicians and
organizations are paid
and responsible for the
care of a beneficiary for a
long period of time
Medicare
FFS
- Limited in Medicare
fee-for-service
- Majority of Medicare
payments now are linked
to quality
- Hospital value-based
purchasing
- Physician value-based
modifier
- Readmissions/Hospital
acquired condition
reduction program
- Accountable care
organizations
- Medical homes
- Bundled payments
- Comprehensive primary
care initiative
- Comprehensive ESRD
- Medicare-Medicaid
financial alignment initiative
fee-for-service model
- Eligible Pioneer
accountable care
organizations in years 3-5
Source: CMS.gov, Aug. 2015
92
HEALTHCARE IT & DISTRIBUTION February 23, 2016

Currently, ~75% of Medicare spending is on FFS. Based upon the above framework, CMS plans to
have Categories 2-4 account for 85% of all payments in 2016 and reach 90% by 2018. Categories 3-4
are targeted to reach 30% of all payments in 2016 and reach 50% by 2018. That would mean that by
2018, 90% of medical payments would be tied to some aspect of quality or performance. This may
include bundled payments, such as the Comprehensive Care for Joint Replacement (CJR) Payment
Model for hip and knee replacement surgeries.
Source: CMS.gov, Aug. 2015
Following this shift in payment models from CMS, funding for healthcare analytics vendors has seen a
recent dramatic increase in the past year, going from $162M in 2013 to $488M in 2014. Notably, this
~$300M increase occurred through only a difference of 6 more deals, demonstrating a market
maturation as the average investment size increases.
Source: CB Insights - Industry Analysis, July 2015
$74 $68
$162
$488
16
20
32
38
0
5
10
15
20
25
30
35
40
$-
$100
$200
$300
$400
$500
$600
2011 2012 2013 2014
Nu
mb
er o
f D
eals
USD
($)
in m
illio
ns
Healthcare Analytics Total VC/PE Funding 2011-2014
93
HEALTHCARE IT & DISTRIBUTION February 23, 2016

RedBrick Health -- Employee Engagement for a Healthier Workforce
RedBrick Health offers solutions that allow employers to better engage their employees in healthy living.
The company’s personalized online tools help employers understand the numbers behind wellness, and
also give employees insight into their own physical condition. RedBrick also offers personalized
programs for employees as well as coaching, health competitions, and monetary incentives. For the
employers, Redbrick offers data-driven analytics and built-in health assessment tests to help report the
progress in healthy living of the employees. The majority of the offerings from Redbrick are internet-
based, which provides easy access to employers and their employees. Healthy living coaching is
provided over the phone, which may be one key reason employees have higher participation rates.
In 2012, the company published a white paper detailing the benefits and costs of implementing its
health management system. The paper highlighted a significant return on investment (ROI) after
implementing a health management program with savings accruing from lower healthcare expenditure
costs and less health-related productivity loss. Participants saved $443 per year on average. Programs
such as these are at the heart of value-based care plans.
ROI after 2 years with RedBrick
Source: redbrickhealth.com/solution/numbers, 2013
Closing Thoughts
As the payment model for health exchanges shifts toward value-based payments, CVBCS vendors have
an opportunity to capitalize on the demand for easily accessible information that steers consumers
toward more efficient healthcare. With multi-billion emerging markets and favorable government
regulation to ensure widespread usage of population health-focused services, components of the
healthcare analytics and healthcare social networking & marketplaces subsectors are positioned to
grow in revenue, investments, and size over the next several years.
94
HEALTHCARE IT & DISTRIBUTION February 23, 2016

Core Software-as-a-Service (SaaS) Solutions
Hospital Software: Managing Operations & Patient
Recordkeeping
Introduction & Overview
Core SaaS Solutions (CSS) are software programs employed within payer and provider organizations to
improve accessibility and storage of electronic medical records and other organizational medical
information. Many of these programs utilize cloud computing platforms for information storage in order
to reduce capital expenditures related to conventional billing practice methods. Within the U.S. and
Canada, the CSS market is categorized into a variety of services, applications, and pricing models.
These services are divided between Clinical Information Systems (CIS) and Non-Clinical Information
Systems (NCIS). CIS include pharmacy information systems (PIS), laboratory information systems
(LIS), electronic health/medical records (EHRs/EMRs), computerized physician order entries (CPOEs),
radiology information systems (RIS), and Picture Archiving and Communication Systems (PACS). NCIS
include patient billing, payroll management, revenue cycle management, and claims reimbursement
systems. In addition to SaaS products, many CSS firms offer alternative Infrastructure-as-a-Service
(IaaS) and Platform-as-a-Service (PaaS) applications. The scope of this section, however, will be
focused on the burgeoning market for SaaS programs. In addition, the terms “electronic medical
records” (EMRs) and “electronic health records” (EHRs) are interchangeable and will be used that way
throughout this report, with preference to “EMRs”.
CSS Hierarchy of Services
Source: MedGadget, Leerink Partners LLC, 2016
Core SaaS Solutions (CSS)
Clinical Information
Systems (CIS)
Electronic Medical Records
(EMRs)
Computerized Physician Order Entries (CPOEs)
Laboratory Information Systems (LIS)
Pharmacy Information
Systems (PIS)
Radiology Information System (RIS)
Picture Arch. and Comm. Systems
(PACS)
Revenue Cycle Management
Claims Reimbursement
Systems
Payroll Management
Patient Billing
Non-Clinical Information
Systems (CIS)
95
HEALTHCARE IT & DISTRIBUTION February 23, 2016

CSS programs are delivered as private, public, community, and combination hybrid modes of
deployment at host facilities. Programs are priced under pay-as-you-go and subscription-based models
which typically include the software itself, hardware, and assistance services. Due to the U.S. and
Canada’s established healthcare infrastructure, the market demand for cloud computing is very high.
Government legislature such as the ACA and American Recovery and Reinvestment Act (ARRA)
stimulus package has further incentivized healthcare providers to improve their ability to increase
access to health information and streamline the flow of clinical information between parties. Increased
adoption of cost-effective information technology has been a key driver for the domestic market for CSS.
This sector has been the beneficiary of heavy investment interest with the improvement of cloud storage
and the need to store and access massive amounts of healthcare data on user-friendly software
platforms. Inovalon Holdings, Inc.’s (INOV) public offering on February 11, 2015, demonstrated an
example of the investment potential of CSS. While the stock has fluctuated, the combination of
healthcare and cloud computing was intriguing to investors and sparked interest in the capabilities of
these fields. With government incentives and an increasing focus from executive providers to reduce
costs and improve the ability to access patient information, we expect this sector to continue growing in
both usage and number of products. CSS vendors are incentivized to improve provider operational
procedures and to increase access to patient information across organizations through a market
opportunity that should reach $5.4B by 2017.
CSS Flow of Information & Services
Source: International Integrated Systems, Inc., 2015
Barriers to Success
For CSS vendors, the high cost involved in implementing software at facilities (particularly for CIS) and
patient privacy assurance are key barriers. When a consumer purchases a new CSS program, the CSS
vendor requires payment for software installation, training, and maintenance. While the government
usually subsidizes these programs in the long run, provider organizations must pay an up-front cost for
the program’s integration. Provider organizations that have limited cash on hand may decide against
96
HEALTHCARE IT & DISTRIBUTION February 23, 2016

using these programs, even if they improve organizational efficiency and offer long-term government
financing incentives. For digital software that aggregates information, especially programs that utilize
cloud-based storage, security breaches are also a threat. Privacy rules, such as HIPAA, attempt to
thwart this risk by limiting the amount of data that can be transferred through cloud platforms. These
themes will continue to emerge as new, innovative programs are brought to the market. The success of
CSS will depend on their ability to address these issues by demonstrating a successful track record with
offered programs.
Consumer Analytics: The Prevalence of SaaS Within Cloud-Based Apps
According to the 2014 HIMSS Analytics Cloud Survey, 83% of IT executives report that cloud services
are used at their facilities, and another 9.3% plan on incorporating cloud services in the future. Among
healthcare IT organizations, 67% of them use SaaS-based programs. IaaS (15.9%) and PaaS (2.4%)
were the most prevalent following SaaS. The three most common cloud-based applications were
Hosting of Clinical Applications & Data (43.6%), Health Information Exchanges (38.7%), and Backups &
Data Recovery (35.1%).
Source: 2014 HIMSS Analytics Cloud Survey, June 2014
The Global & Domestic Market for Core SaaS Solutions
In calculating the global market for CSS, it is difficult to determine which subsectors qualify as cloud
computing. Despite the industry’s immense financial potential, little concrete research is available
regarding the global market size. Figures for the global market value are subject to a variety of opinions.
The consensus, however, is that the market is expected to grow at a rapid pace through 2020. For cloud
computing, the consensus from researchers is that this market will grow at a CAGR above 20% over the
next 3-7 years. For EMRs, Accenture estimates that the global market increased at a 5.5% CAGR from
2012-2015.
To demonstrate this variability, three reports that are frequently cited in articles about the topic are listed
for healthcare cloud computing. Persistence Market Research estimates the 2015 market value for CSS
to be $5.1B and expects that figure to grow over the next five years, reaching $12.9B by 2020.
Research & Markets, a market research firm, is more bearish on the global size, estimating a 2015
global market value of $2.9B that should reach $6.5B by 2017.
67%
16%
2% 15%
Most Common Types of Cloud-Based Apps
SaaS
IaaS
PaaS
Other
97
HEALTHCARE IT & DISTRIBUTION February 23, 2016

Source: Persistence Market Research, Feb 2015, Research & Markets, March 2014
Notably, several outlets cite research by MarketsandMarkets, which reports that the global market for
healthcare cloud computing should reach $5.4B by 2017. MarketsandMarkets’ 2012 research report
anticipates that this should occur at a 20.5% CAGR from 2012-2017.
Source: MarketsandMarkets - Healthcare Cloud Computing 2012-2017, July 2012
For the North American market, Persistence Market Research estimates the 2014 market value for CSS
to be $1.9B and expects that figure to grow over the next six years, reaching $5.7B by 2020. For both
the global and North American markets, SaaS is expected to be the largest segment of the healthcare
cloud computing market.
$4.2 $5.1
$6.1*
$7.4* $8.9*
$10.7*
$12.9*
$-
$2.0
$4.0
$6.0
$8.0
$10.0
$12.0
$14.0
2014 2015 2016 2017 2018 2019 2020
USD
($)
in b
illio
ns
Healthcare Cloud Computing Global Market, 2014-2020
*Estimated
$1.7 $2.2*
$2.9*
$3.7*
$4.8*
$6.5*
$-
$1.0
$2.0
$3.0
$4.0
$5.0
$6.0
$7.0
2013 2014 2015 2016 2017 2018
USD
($)
in b
illio
ns
Healthcare Cloud Computing Global Market, 2013-2018
*Estimated
$2.6
$3.1
$3.8*
$4.6*
$5.4*
$-
$1.0
$2.0
$3.0
$4.0
$5.0
$6.0
2013 2014 2015 2016 2017
USD
($)
in b
illio
ns
Healthcare Cloud Computing Global Market, 2013-2017
*Estimated
98
HEALTHCARE IT & DISTRIBUTION February 23, 2016

Source: Persistence Market Research - Global Market Study on Healthcare Cloud Computing, Feb. 2015
For EMRs, Accenture anticipates that the global market reached $22.3B by the end of 2015, based
upon a 5.5% CAGR from 2012-2015. The global EMR market breaks down into North & South America
($11.1B), Asia Pacific ($4.0B), and the Europe, the Middle East, and Africa (EMEA) ($7.1B).
Source: Accenture Analysis - Getting EMR Back in the Fast Lane, 2014
$1.9 $2.2
$2.7
$3.3
$3.9
$4.8
$5.7
$-
$1.0
$2.0
$3.0
$4.0
$5.0
$6.0
$7.0
2014 2015 2016 2017 2018 2019 2020
USD
($)
in b
illio
ns
Healthcare Cloud Computing North American Market, 2014-2020
*Estimated
$18.8
$19.8
$20.9
$22.3
$17.0
$18.0
$19.0
$20.0
$21.0
$22.0
$23.0
2012 2013 2014 2015
USD
($)
in b
illio
ns
EMR Global Market, 2012-2015
$11.1
$4.0
$7.1
EMR Global Market Split, 2015
North & South America
Asia Pacific
Europe, the Middle East,and Africa
99
HEALTHCARE IT & DISTRIBUTION February 23, 2016

CSS Market Share -- Healthcare Cloud Computing & EMRs
According to MarketsandMarkets, the cloud computing market sector of CSS is highly fragmented and
competitive. Of the top market performers, which include CareCloud Corporation, Carestream Health,
Inc., Merge Healthcare, Inc., GE Healthcare, and Agfa Healthcare, none occupy a share greater than
5%. Other competitive firms within the North American market include ClearData Networks, Inc., Cisco
Systems, Inc., EMC Corporation, Dell, Inc., Hewlett-Packard Company, IBM Corporation, Iron Mountain,
Inc., Microsoft Corporation, VMware, Inc. and Oracle Corporation.
The EMR market demonstrates similar fragmentation, but has greater public visibility. Similar to cloud
computing, five of the market’s top 10 vendors have less than a 5% market share. “Other” vendors
outside of the top 10 also make up 41% of the total market share. Epic Corp. (12%), eClinicalWorks LLC
(10%), Allscripts Healthcare Solutions, Inc. (9%), Practice Fusion, Inc. (7%), NextGen Healthcare
Information Systems LLC (6%), GE Healthcare (4%), Cerner Corporation (4%), athenahealth, Inc. (3%),
McKesson Corp. (3%), and Amazing Charts (2%) make up the top 10 EMR vendors within the U.S.
Source: Becker’s Hospital Review, Feb. 2015
In a 2015 survey by peer60 of over 950 healthcare leaders, which represents approximately 25% of the
U.S. healthcare systems, MEDITECH (15%) was deemed the market share leader for EMR usage,
followed by CPSI (15%), Cerner (13%), and McKesson (11%). Siemens (9%), Healthland (7%), and
Epic (5%) round out the top seven major vendors.
12%
10%
9%
7%
6% 4%
4% 3%
3% 2%
41%
Top 10 EMR Vendors by Market Share
Epic
eClinicalWorks
Allscripts
Practice Fusion
NextGen Healthcare
GE Healthcare
Cerner
athenahealth
McKesson
Amazing Charts
Other
100
HEALTHCARE IT & DISTRIBUTION February 23, 2016

Source: peer60 - 2015 Healthcare Tech Purchasing
By hospital size, however, these market share figures varied. There was no consensus number-one
across the board, demonstrating the highly fragmented nature of the market. Cerner and Epic also
typically fluctuated within the top market share leaders. Other companies that appeared in these
hospital surveys were Allscripts, athenahealth, eClinicalWorks, GE, and NextGen.
Source: peer60 - 2015 Healthcare Tech Purchasing
19%
15%
13% 11%
9%
7%
5%
17%
4%
EMR Market Share Survey Total Results
Meditech
CPSI
Cerner
McKesson
Siemens
Healthland
Epic
Other
None
30%
30%
20%
10%
10%
EMR Market Share Survey >1000 Beds
Cerner
Epic
GE
Allscripts
McKesson
101
HEALTHCARE IT & DISTRIBUTION February 23, 2016

Source: peer60 - 2015 Healthcare Tech Purchasing
Market Consolidation Advantage Sparks High M&A Activity
The current fragmentation within the SaaS cloud computing market has led to increased consolidation
among firms in order to increase efficiency through economies of scale. Since no single vendor owns
more than a 5% share of the cloud computing market, in some cases it may be advantageous to merge
with or acquire equivalent competitors because it can put the newly formed company in a position to
take a commanding portion of the cloud computing market share. Given each firm’s minimal foothold
within the market, we also believe that many smaller vendors will be acquisition targets for larger, non-
SaaS companies. Since 2009, we have found that 72% of SaaS acquisitions have been performed by
non-SaaS companies. We anticipate that this trend will continue within healthcare as a market leader
emerges.
Source: SEC Public Filings, Capital IQ, 2015
Government Stimulus Package Has Led to Increased Interest in Core SaaS Solutions
Since the adoption of the American Recovery and Reinvestment Act (ARRA) in 2009, government
funding for CSS has increased dramatically. Under ARRA, the government has pledged $36.5B in
funding in order to establish a nationwide EMR system. This database would be accessible to
physicians at any location and would help providers streamline the flow of patient data in order to
improve efficiency of treatment and ultimately lower healthcare costs by not providing unnecessary or
redundant treatment to patients. ARRA has incentivized businesses within the healthcare industry to
increase their scope of innovation within cloud computing and EMRs.
184 190
291 333
412
621
0
100
200
300
400
500
600
700
2009 2010 2011 2012 2013 2014
Nu
mb
er o
f M
&A
Dea
ls
SaaS Industry M&A Deals, 2009-2014
102
HEALTHCARE IT & DISTRIBUTION February 23, 2016

As part of this incentive system, providers and vendors must achieve “Meaningful Use” (MU) of
government-accepted EMR technology. MU requires that vendors engage patients and provide access
to health information through online patient portals. The effects of ARRA were immediate, as shown in a
predictive graphic from McKinsey, where prior to 2009 only 20% of physicians and 10% of hospitals
were using EMRs and other forms of clinical software. While McKinsey acknowledges that
corresponding technology advancements would lead to an increase in EMR and other software usage,
the stimulus package would help raise physician usage (90%) and hospital usage (70%) to even higher
levels.
Source: McKinsey Quarterly, July 2009
MU Stage 2 Requirements - Engaging Patients & Families in their Care
20%
65%
90%
10%
45%
70%
0%
10%
20%
30%
40%
50%
60%
70%
80%
90%
100%
2009 2019 2019 w/Stimulus
% A
do
pti
on
Adoption of EMRs & Clinical Software
Physicians
Hospitals
103
HEALTHCARE IT & DISTRIBUTION February 23, 2016

CMS Offers EHR Incentive Programs for Medicare-Medicaid
Following the passing of the Health Information Technology for Economic and Clinical Health (HITECH)
Act in 2009, $27B was put aside by the federal government to form an EMR incentive program through
Medicare-Medicaid. The Centers for Medicare and Medicaid Services (CMS) received this funding and
formed the Medicare and Medicaid EHR Incentive Programs, which provide incentive payments to
participants who are able to demonstrate CMS’ definition of Meaningful Use. Under this definition, the
provider must not only own a certified EMR program, but also demonstrate how it improves the quality
of care for their patients. CMS believes that widespread EHR usage will lead to large reductions in
healthcare costs, with estimates upwards of $30B per year in savings. These guidelines consist of 15
core objectives, 5 menu objectives, and 6 clinical quality measures. While there are differences between
the timeline and amount distributed for Medicare and Medicaid, they require the same definition of
Meaningful Use. Guidelines are outlined in the CMS Medicare & Medicaid EHR Incentive Program
Reports. As of April 2015, Medicare had paid out approximately $20.6B and Medicaid had paid out
$5.9B.
Medicare EHR Incentive Program Medicaid EHR Incentive Program
Run by CMS Run by your State Medicaid Agency
Maximum incentive amount is $44,000 Maximum incentive amount is $63,750
Payments over 5 consecutive years No payment adjustments for providers who are
only eligible for the Medicaid program
Payment adjustments will begin in 2015 for
providers who are eligible but decide not to
participate
No payment adjustments for providers who are
only eligible for the Medicaid program
Providers must demonstrate meaningful use every
year to receive incentive payments
In the first year providers can receive an incentive
payment for adopting, implementing, or upgrading
EHR technology. Providers must demonstrate
meaningful use in the remaining years to receive
incentive payments.
Source: CMS.gov, 2015
While the monetary incentive payments are relatively small, the penalty for not participating is high for
Medicare. CMS penalizes non-participating institutions by adjusting reimbursements 1% per year for up
to a maximum of 5%.
Private Payers Appear to Follow CMS EMR Incentives Trend
Since private insurance payers were not included within the HITECH stimulus package for commercial
plans outside of Medicare and Medicaid, many payers were hesitant to offer similar incentives for EMR
participation. When gauging policy shifts within health coverage, however, CMS tends to be a
trendsetter in determining how payers cover patients; once CMS begins reimbursing for a new
procedure or type of treatment, private payers tend to follow suit. We estimate that the focus from CMS
is to incentivize EMR usage and the goal of the HITECH is to create a national healthcare medical
record system that will have a trickle-down effect that will lead private payers to provide incentives for
patients and providers that use EMRs.
These incentives and government reimbursements have provided an opportunity for vendors to create
programs and services that help provider institutions achieve meaningful usage requirements. With this
increased innovation, there has been an increase in private equity and venture capital investment
activity within CSS firms. Since 2011, investments in CSS firms from private equity and venture capital
104
HEALTHCARE IT & DISTRIBUTION February 23, 2016

firms have increased dramatically. CB Insights designates CSS in three categories: healthcare software,
medical information software, and medical practice management. According to CB Insights, investments
in healthcare software went from $329M in 2011 to $1.32B in 2014, and medical information software
went from $51M in 2011 to $107M in 2014. Medical practice management saw a record year in 2013
with $271M -- more than triple the total of any other year, before returning to $88M in 2014.
Source: CB Insights - Industry Analysis, July 2015
Source: CB Insights - Industry Analysis, July 2015
Source: CB Insights - Industry Analysis, July 2015
$329
$584 $710
$1,321
87
130
134
168
0
20
40
60
80
100
120
140
160
180
$-
$200
$400
$600
$800
$1,000
$1,200
$1,400
2011 2012 2013 2014
Nu
mb
er o
f D
eals
USD
($)
in m
illio
ns
Healthcare Software Total VC/PE Funding, 2011-2014
$51
$92
$48
$107 15
17
8
10
0
2
4
6
8
10
12
14
16
18
$-
$20
$40
$60
$80
$100
$120
2011 2012 2013 2014
Nu
mb
er o
f D
eals
USD
($)
in m
illio
ns
Medical Information Software Total VC/PE Funding, 2011-2014
$84 $73
$271
$88
10
15 18 16
0
2
4
6
8
10
12
14
16
18
20
$-
$50
$100
$150
$200
$250
$300
2011 2012 2013 2014
Nu
mb
er o
f D
eals
USD
($)
in m
illio
ns
Medical Practice Management Software Total VC/PE Funding, 2011-2014
105
HEALTHCARE IT & DISTRIBUTION February 23, 2016

The Impact of Cerner’s Contract with the Department of Defense
In July 2015, the Pentagon announced that the U.S. Department of Defense (DoD) was partnering with
Cerner Corp. and Leidos (LDOS) to create a universal EHR system for active military personnel in a
contract that is worth $4.3B over the first 5 years and about $9B over its 18-year lifespan. This marked
the largest government health IT contract since the $1.7B adoption of HealthCare.gov with CGI Group
(GIB). As a part of this coverage, Cerner is responsible for nearly 9.5 million military personnel. Other
competing parties for this deal included Allscripts, Computer Sciences Corp., Epic, Hewlett-Packard,
IBM, and Impact Advisors. Pundits were surprised by the DoD’s decision to choose Cerner, with many
specialists believing that Epic, IBM, and Impact Advisors would be the eventual contract winners.
Of note, the contract details indefinite delivery indefinite quota (IDIQ) from Cerner, indicating that the
contract payment figures may be subject to change. There is also an “out” clause for the DoD, which
may back out of this deal if they are not satisfied with Cerner’s products. The IDIQ clause has led
specialists to speculate that the government will end up spending much more than the initial contract
outlines. Estimates for a realistic spending figure have ranged between $12B and $16B for the first 10
years of the deal, with Cerner receiving an undisclosed portion of the deal’s value.
Given the fragmentation within the EHR market, this deal is a significant win for Cerner because it
involves a large investment from the government. In addition to its EHR system, Cerner offers a
population health module for clients. It is expected that Cerner will attempt to cross-sell other products
to the DoD as their relationship grows, further strengthening their position within the CSS market.
Currently, the VA uses Vista for its EHR system and there is speculation that the DoD would be
interested in creating a single EHR system including both parties that would allow for seamless
integration of patient records, potentially extending Cerner’s contract and patient reach. Pending the
success of this program, Cerner is well-positioned to increase its market share within the EHR market.
Obtaining trust from government clients gives Cerner an advantage over some competitors.
ICD-10 Implementation Serves as an Example for CSS Revenue Tailwind
ICD-10 is the 10th revision of medical coding used by the World Health Organization (WHO) for
determining where diagnoses should be classified. It replaced the former system, ICD-9, on October 1,
2015. This change puts the U.S. Healthcare system in line with the World Health Organization’s system
of classification of disease and will significantly increase the complexity of how hospitals code for
insurance reimbursement purposes. In the wake of its official start date, hospitals using legacy vendors
that did not support ICD-10 were required to make arrangements to upgrade their systems or risk
extended reimbursement delays.
A study performed by HIMSS on the introduction of ICD-10 in Canada found that hospitals saw a
significant drop in productivity immediately following the implementation. Based on the number of charts
completed per hour, one hospital saw productivity losses between 37%-64% among departments only 3
months after implementation. One year after implementation, productivity only reached 80-85% of pre-
ICD-10 levels. This was largely due to the volume increase of information available on patient records
that coders must analyze. The report also highlighted the need for significant education around the
transition, specifically for those staff members that will be working closely with the newly converted data
and coding procedures.
In our January 2015 MEDACorp HCIT survey of 50 hospital administrators, 64% of respondents
indicated that their hospitals would be allocating investments toward building or expanding HCIT
capabilities for the upcoming ICD-10 transition. These respondents also indicated that they intended on
106
HEALTHCARE IT & DISTRIBUTION February 23, 2016

investing an average of $1.36M into ICD-10 initiatives. We believe that respondents who did not indicate
a future intent to allocate capital into ICD-10 initiatives have already invested capital into similar efforts,
given that ICD-10 compliance is mandatory.
Patient Portals Increase Accessibility of Health Information for Patients
A patient portal provides patients with a secure way to log-in and view personal health information
through the internet. In addition to accessing and viewing personal health information, patient portals
typically allow patients to contact or connect with providers. As part of the Stage 2 Meaningful Use
requirements, at least 5% of a provider’s patients must view, download, and transmit their health
information and send a secure electronic message to their provider. This requirement means that
providers need to adopt and implement patient portal technology (either through their main EHR vendor
or as a bolt-on product). Several of the core Stage 2 requirements revolve around engaging patients
and families in their care. Fifty percent of patients must be provided timely access to their electronic
discharge statements after a hospital or office visit. These digital thresholds are expected to increase
between 2015 and 2017, when Stage 3 Meaningful Use rules are adopted.
Patient Access to Online Medical Records May Increase Primary Care Utilization
Providing patients with online access to health information through connection to their provider has the
potential to reduce healthcare utilization and increase overall population health. In 2012, a study was
published by the Journal of the American Medical Association (JAMA) that evaluated the rates of office
visits, telephone encounters, after-hours clinic visits, emergency department encounters, and
hospitalization for Kaiser Permanente members with and without online access. The JAMA study
included members who were enrolled for at least 24 months during the study period (March 2005-June
2010). Interestingly, JAMA found that there was a significant increase in the per-member rates of office
visits (0.7 PMPY) and telephone encounters (0.3 PMPY) for patients who used Kaiser Permanente’s
MyHealthManager (MHM) online access system compared to their matched cohorts. There were also
higher rates of after-hour clinic visits, emergency department encounters and hospitalizations for users
of the MHM online access system. The study found that there was more variability in utilization rates for
MHM users with chronic illnesses.
Kaiser Permanente’s MyHealthManager allows patients to access their health records, test results,
immunization records, active meds, medical problem lists and care plans. The system can also be used
for appointment scheduling, requesting med refills and to communicate with physicians through a
messaging platform. About 54% of members used the online access system by June 2009 (n=375,620),
which was up more than two-fold from ~25% of members at the end of 2007.
These results were significant because it demonstrated a shift away from emergency and specialty
treatment and toward more frequent primary care visits. Instead of patients pursuing more costly
emergency or specialty appointments, they were found to be using less expensive appointments with
their primary care physician through increased interaction between patient and provider. By having the
ability to view their patient records, patients appeared to demonstrate a greater consciousness
concerning their health and sought more frequent encounters with their primary care physician in order
to better manage their health.
107
HEALTHCARE IT & DISTRIBUTION February 23, 2016

Closing Thoughts
As payers and providers look for solutions that maximize organizational efficiency while reducing costs,
CSS products have the opportunity to take advantage of this niche market. With market values of $3.8B
and $22.3B, respectively, as well as a $36.5B pledge from the government to providers who use their
services, the cloud computing and EMR subsectors are positioned to continue growing in revenue,
investments, and size over the next several years. The past trading success of SaaS companies on
public exchanges has caught the attention of investors, who have the opportunity to capitalize on the
sector’s innovation. With a heavy consumer demand for products, as well as increasing market size,
and low barriers to entry, CSS is expected to be a highly active investment sector.
108
HEALTHCARE IT & DISTRIBUTION February 23, 2016

Telehealth & Remote Medicine
Engaging Patients Through Portal Communication & Increasing Provider Access to Patient Data
Introduction & Overview
Telehealth & Remote Medicine (TRM) is a form of digital telecommunication that allows patients to
access medical providers in remote locations. TRM digital platforms allow providers to assess patients,
monitor patient vitals, provide diagnoses, and establish communication with patients at a lower cost
than in-person hospital appointments. This is achieved through the delivery of health services by way of
several telecommunication platforms, including online chatrooms and videoconferences. In addition,
remote patient monitoring can be provided through home-use monitoring equipment, such as digital
blood glucose meters, blood pressure monitors, weight scales, and peak flow meters. While a key
component of telehealth is remotely connecting patients and providers through digital face-to-face
interactions, telehealth can also provide users with access to EHRs and additional educational
resources.
TRM has a two-fold effect on healthcare by increasing access to treatment and decreasing costs
through fewer provider appointments, also reducing physician workload. In addition, growing coverage
under both commercial and government health insurance plans has improved patient perception of TRM
viability. This is of particular importance for primary care appointments, as the U.S. Department of
Health and Human Services anticipates a shortage of 20,400 primary care physicians by 2020.
Meanwhile, physician demand continues to grow due to a steadily aging population that will reach over
50 million Medicare-eligible U.S. citizens by 2017. TRM firms are thus uniquely poised to enter this
sector during a period of high patient demand, low primary care physician supply, and potential
government reimbursement.
As both private equity and venture capital investments have increased over the past three years, we
anticipate that increasing patient involvement and incentives to cut healthcare costs will lead to
substantial economic growth within this sector in order to better serve the needs of patient populations.
As general telecommunications technology steadily increases across all industries, we believe that a
natural shift will occur to meet the needs of patients, providers, and other parties involved in healthcare.
Telehealth Allows Providers to Monitor and Communicate with Patients Remotely
Source: http://tunstallhealthcare.com.au, 2016
109
HEALTHCARE IT & DISTRIBUTION February 23, 2016

Barriers to Success
The primary concern for TRM devices revolves around potential security breaches that expose users’
personal information. Consumers want assurance that their personal data are safe from hackers and
that all aggregated data are not being abused. Security will be a recurring theme as new, innovative
products are launched. The success of TRM products will depend on their ability to address security
concerns by demonstrating safe transmission of data between involved parties.
Telehealth & Telemedicine: Defining the Scope of Treatment
The terms “telehealth” and “telemedicine” are often used interchangeably when discussing digital
medical procedures. The main difference between the two terms relates to their scope of treatment, as
telemedicine typically refers to direct treatments that occur for a specific procedure between a provider
and a patient, and telehealth refers to indirect treatments revolving around preventive medicine, such as
patient education, monitoring, and tracking. NTT Data views telehealth as an expansion of telemedicine,
covering preventative, promotive, and curative aspects of healthcare outside of patient-provider direct
interactions. For the purposes of this paper, the terms are interchangeable and are only differentiated
when discussing the level of investment activity between both subsectors.
In addition, IHS reports that the number of patients using some form of telehealth services should grow
from 350,000 in 2013 to over 7,000,000 by 2018. From this patient pool, Deloitte foresees that their
usage will consist of approximately 100 million electronic appointments (eVisits) with providers. These
eVisits will occur through a multitude of platforms, including webcam appointments, image sharing,
video conferencing, and remote patient monitoring. A 2014 survey of 406 C-Suite officers, IT
professionals, clinicians, and department heads by HIMSS Analytics found two-way video/webcam
appointments to be the most common platform for usage; image sharing technology, email, and patient
portals all scored greater than 40% usage at surveyed facilities.
Source: HIMSS Analytics 2014 Telemedicine Study
TRM Market Share by Revenue
In its 2015 report on telehealth, IBISWorld, Inc. lists GlobalMedia Group LLC (dba GlobalMed),
Infomedia Group, Inc. (dba Carenet Healthcare Services), InTouch Technologies, Inc., (dba InTouch
Health), and Teladoc, Inc. as telehealth and remote medicine market share revenue leaders. In addition,
AT&T (T), Bosch Healthcare, Cerner, GE Healthcare, Honeywell Life Care Solutions, IBM, Intel (INTC),
McKesson, Medtronic (MDT), Philips Healthcare, Siemens Healthcare, and Verizon (VZ) are highlighted
as controlling the market for telehealth and telemedicine.
4% 20%
26% 30% 31%
36% 43% 44%
56%
58%
0% 10% 20% 30% 40% 50% 60% 70%
OtherSmart phone
Remote patient monitoringScheduling portal
Medication managementVideo conferencing
Patient portalEmail
Image sharing technologyTwo-way video/webcam
Percent Usage
Most Common Telehealth Platforms
110
HEALTHCARE IT & DISTRIBUTION February 23, 2016

Source: IBISWorld, Inc. - Industry Report OD5775, March 2015
When breaking down the TRM market by type of disease, congestive heart failure (44%) is the largest
market sector, followed by diabetes (27%), chronic obstructive pulmonary disease (16%), hypertension
(7%), and mental health (4%).
Source: IBISWorld, Inc. - Industry Report OD5775, March 2015
Healthcare Executives Positive on Telehealth Potential
According to a 2014 survey of healthcare executives by Foley & Lardner LLP, respondents were seen
as embracing telehealth as a method to keep patients healthy. In the survey, 84% of executives felt that
future development was “very important” (52%) or “important” (32%), with only 3% feeling that its
development was unimportant. In addition, 92% of respondents are in the process of pursuing a
telehealth program at their organization. These programs, however, are in the early stages, with only
6% in the “sustain (mature) phase,” 18% in the “optimization phase,” 18% in the “implementation
phase,” 16% in the “pilot phase,” and 34% still in the development stages.
8%
4%
2%
2% 1%
1%
82%
TRM Market Share by Company
GlobalMed
In Touch Health
Teladoc
Carenet Healthcare Services
AmericanWell
MDLive
Other
44%
27%
16%
7% 4%
2%
Market Share by Type of Disease
Congestive Heart Failure
Diabetes
Chronic Obstructive PulmonaryDisease
Hypertension
Mental Health
Other
111
HEALTHCARE IT & DISTRIBUTION February 23, 2016

Source: Foley & Lardner LLP - 2014 Telemedicine Survey
Control Trials Confirm Cost-Saving Capabilities for Telehealth
According to its SEC S-1/A filing, Teladoc, Inc. performed a case study in 2014 by commissioning
Veracity Healthcare Analytics (VHA) to track health spending of two of Teladoc’s biggest clients for 24
months. One of these clients, Rent-A-Center, which had 24,000 employees that were members of
Teladoc’s services, demonstrated significantly lower healthcare spending than external control groups.
Over the 24-month study, Rent-A-Center employees using Teladoc had an average spending of $284
while individuals within the control group had an average spending of $2,703, a $2,419 difference per
employee. In addition, VHA concluded that Rent-A-Center saved $1.73M in 2014, which amounted to
an ROI of $11.80 for every $1.00 spent on healthcare per member. This amounted to a 7.0% reduction
to Rent-A-Center’s total employee health benefits in 2014.
In addition, a randomized controlled trial for long-term living assistance by Finkelstein et al.
demonstrated that virtual visits between a nurse and chronically ill home health patients improved
outcomes at a lower cost than traditional face-to-face visits. In the control group, 19 patients received
traditional care at home; 20 patients in experimental group V received traditional care plus two virtual
visits each week; 14 patients in experimental group M received traditional care, which included two
virtual visits per week and remote monitoring of vital signs. Participants were listed as suffering from at
least one of the following chronic health conditions: congestive heart failure, chronic obstructive
pulmonary disorder, or chronic wound care.
Discharge to a higher level of care such as a hospital or nursing home (a worse outcome) within 6
months of study participation was 42% for control subjects, 21% for V subjects, and 15% for M subjects.
Average costs per visit were $48.27 for face-to-face home visits and $22.11 for virtual visits.
Source: Finkelstein et al., Telemedicine and E-Health, 2006
6%
18%
18%
16%
34%
8%
0% 5% 10% 15% 20% 25% 30% 35% 40%
Sustain (Mature Phase)
Optimization Phase
Implementation Phase
Pilot Phase
Under Consideration/Development
None
What is the current status of your telehealth program? (n = 57)
42%
21%
15%
0% 10% 20% 30% 40% 50%
Control
Video
Monitor + Video
Percent Admissions
Rate of Discharge to Hospital
112
HEALTHCARE IT & DISTRIBUTION February 23, 2016

Government Reimbursement Has Led to Increased Interest in Telehealth & Remote Medicine
Since the adoption of the Health Information Technology for Economic and Clinical Health (HITECH) Act
on February 17, 2009, government reimbursement has increased business activity within the TRM
sector. As a part of the $787B American Recovery and Reinvestment Act (ARRA) stimulus package, the
HITECH Act has incentivized providers and vendors to achieve “Meaningful Use” (MU) of government-
accepted healthcare information technology. MU requires that vendors engage patients and provide
access to health information through online patient portals. Contained within the HITECH Act’s
guidelines were a focus on the reduction of healthcare costs from inefficient or unnecessary medical
treatment, as well as a budget of $36B set aside in reimbursements for successful electronic health
record (EHR) implementation and other healthcare information technology (HIT) usage, such as TMR.
2015 marked the fifth year that CMS has made MU incentive payments to providers and hospitals. MU
payments through May 2015 have totaled more than $30.9B since the program’s inception ($12.4B to
docs and $18.5B to hospitals).
In addition to an increase in the total sector revenue, these government reimbursements have led to a
pronounced increase in the number of active TMR firms and venture capital/private equity investments.
Since 2010, the number of industry players has more than doubled, going from 258 in 2010 to 612 in
2015. By 2017, IBISWorld Inc. predicts that there could be more than 1,000 telehealth firms in the U.S.,
reaching over 2,000 by 2020.
Over 2011-2014, investments in telehealth and telemedicine from private equity and venture capital
firms also increased dramatically, increasing from $56M in 2011 to $244M in 2014 for telehealth, and
$57M in 2011 to $326M in 2014 for telemedicine. Over that same period, the average investment size
for both telehealth and telemedicine saw similar dramatic increases, growing respectively from
$2.93M/deal and $4.05M/deal in 2011 to $10.17M/deal and $11.64M/deal in 2014.
Source: CB Insights - Industry Analysis, July 2015
$56 $63 $82
$244
19
25
21
24
0
5
10
15
20
25
30
$-
$50
$100
$150
$200
$250
$300
2011 2012 2013 2014
Nu
mb
er o
f D
eals
USD
($)
in m
illio
ns
Telehealth Total VC/PE Funding, 2011-2014
$57 $41 $67
$326
14
17
17
28
0
5
10
15
20
25
30
$-
$50
$100
$150
$200
$250
$300
$350
2011 2012 2013 2014
Nu
mb
er o
f D
eals
USD
($)
in m
illio
ns
Telemedicine Total VC/PE Funding, 2011-2014
113
HEALTHCARE IT & DISTRIBUTION February 23, 2016

Source: CB Insights - Industry Analysis, July 2015
Funding for patient monitoring vendors has also seen a recent dramatic increase over 2011-2014,
growing from $257M in 2011 to $768M in 2014. The increase is notably significant between 2013 and
2014, where total funding into patient monitoring increased from $162M through 54 deals to $768M
through 57 deals. This demonstrates an increase of 474% in dollar terms.
Source: CB Insights - Industry Analysis, July 2015
Commercial Coverage Expansion & Increasing Medicare/Medicaid Reimbursement
Commercial and government health plans have embraced physician consultations through TRM as a
cost-effective solution to affordable access issues. TRM has emerged as a potential solution for
increasing patient access to primary care within Medically Underserved Areas/Populations (MUA/Ps) as
well as lowering Medicare costs for a steadily growing Medicare-eligible population. Along with
government stimulus packages, the number of states with parity laws that enforce coverage for
telemedicine from private, commercial payers has increased. In addition, the Affordable Care Act has
led to greater coverage for American patients, which has led to an increase in demand for medical
service. As patients, payers, and providers have all sought less expensive methods for primary care
treatment, TRM has emerged as a potential cost-effective solution.
Lobbying from the American Telemedicine Association for greater reimbursements has also increased
in the past three years. While both bills failed to receive enactment from Congress, the introduction of
the TELE-MED Act (HR 3077) and the Telehealth Modernization Act (HR 3750) to Congress in 2013
demonstrated this increased legislative activism for TRM. The Center for Medicare & Medicaid Services
(CMS), however, has been slow to accept some of these reimbursement changes.
$11.64
$3.92
$2.40
$4.05
$10.17
$3.90
$2.50
$2.93
$- $2.00 $4.00 $6.00 $8.00 $10.00 $12.00 $14.00
2014
2013
2012
2011
USD($) in millions
Average Investment Size
Telehealth
$257
$160 $162
$768 45 49
54
57
0
10
20
30
40
50
60
$-
$100
$200
$300
$400
$500
$600
$700
$800
$900
2011 2012 2013 2014
Nu
mb
er o
f D
eals
USD
($)
in m
illio
ns
Patient Monitoring Total PE/VC Funding, 2011-2014
114
HEALTHCARE IT & DISTRIBUTION February 23, 2016

In a calendar year (CY) 2015 report, CMS increased the number of telehealth and telemedicine services
that were eligible for coverage under Medicare as well as the physician reimbursement for procedures.
Prior to 1999, Medicare coverage for telehealth services was limited to services that did not require an
in-person meeting between physicians and patients, such as analyzing data readouts or performing a
verbal consultation. In 2001, coverage was significantly expanded to include telecommunication
consultations for Medicare beneficiaries that are within MUA/Ps. Since then, this coverage has gradually
expanded and now accounts for 31 medical procedures that can be performed via telehealth platforms.
The proposed CY2015 physician fee schedule includes some changes to telehealth services, which
would expand coverage to include coding for new services. Proposed changes revolve around
modifying the urban and rural classifications to include more urban areas that are MUA/Ps. Currently,
Anthem and a University of Pittsburgh Medical Center health plan offer virtual telehealth visits through
their Medicare Advantage program.
Along with this expanded Medicare coverage, commercial payers in 26 states are now obligated to
provide payment coverage for certain telehealth and telemedicine procedures through the establishment
of state-level parity laws. This has led to the establishment of parity laws in several states in order to
encourage the usage of telehealth to provide cost-effective treatment for citizens. These parity laws
require group health plans and health insurance issuers to create financial requirements and treatment
limitations for telehealth and telemedicine procedures, preventing exclusion of services from billing
practices. Monetary coverage and visit limitations may vary by state, but insurers in states with
established parity laws must acknowledge acceptable telehealth and telemedicine procedures as
requiring reimbursement.
115
HEALTHCARE IT & DISTRIBUTION February 23, 2016

According to the American Telemedicine Association, 27 states (including Arizona, which officially joined
in 2015) and the District of Columbia require private insurance plans to provide coverage for telehealth
and telemedicine services. An additional 9 states currently have a proposed parity bill up for vote. Prior
to these changes, Medicaid was the most common payment method for telehealth services, providing
physician reimbursement for TRM services in 43 states and the District of Columbia.
States with Parity Laws in
Place (Year of Enactment)
(28)
Arizona (2013)*, Arkansas (2015), California (1996), Colorado (2001), Georgia
(2006), Hawaii (1999), Indiana (2015), Kentucky (2000), Louisiana (1995), Maine
(2009), Maryland (2012), Michigan (2012), Minnesota (2015), Mississippi (2013),
Missouri (2013), Montana (2013), Nevada (2015), New Hampshire (2009), New
Mexico (2013), New York (2014), Oklahoma (1997), Oregon (2009), Tennessee
(2014), Texas (1997), Vermont (2012), Virginia (2010), Washington (2015), and the
District of Columbia (2013)
States with
Proposed/Pending
Legislation (10)
Connecticut, Delaware, Illinois, Iowa, Massachusetts, New Jersey, North Carolina,
Ohio, Pennsylvania, Rhode Island
States with No Parity
Legislative Activity (13)
Alabama, Alaska, Florida, Idaho, Kansas, Nebraska, North Dakota, South Carolina,
South Dakota, Utah, West Virginia, Wisconsin, Wyoming
* Coverage applies to certain health services and/or rural areas only
Source: American Telemedicine Association, Leerink Partners LLC, 2016
116
HEALTHCARE IT & DISTRIBUTION February 23, 2016

When analyzing this coverage by state population, about 200 million U.S. citizens live in states with
established telemedicine parity laws, 50 million live in states that do not have parity laws, and 72 million
live in states with proposed parity laws. In other words, about 62% of Americans live in states that
require private insurers to reimburse for some telemedicine procedures; another 22% live in states
where a parity law may be established in the near future.
Source: U.S. Census Bureau, American Telemedicine Association, and Leerink Partners LLC, 2016
Employers have also increased their usage of TRM within employee benefit packages, with Towers
Watson (TW) anticipating a 68% increase in employer-sponsored health packages including telehealth
over the next two years. This inclusion is expected to lead to $6B a year in healthcare savings for U.S.
companies. In its 2014 Health Care Changes Ahead Survey of companies with at least 1,000
employees, Towers Watson found that 37% of employers expected to offer some form of telehealth
consultation as an alternative for employees, and another 34% are considering offering similar services
by 2017. Of the polled firms, 22% already offered telehealth employee services, which Towers Watson
is expecting to rise to 37% over the next year. As more payers embrace telehealth services, we expect
the industry to grow and become an integral part of managing health in a population health-focused
ACO environment.
Department of Veterans Affairs Home Telehealth Services
The Department of Veterans Affairs (VA) offers veterans several forms of telehealth, including home
telehealth (HT), clinical video telehealth (CVT), store & forward telehealth (SFT), and teleradiology
services. These programs provide routine, non-institutional care, and targeted care management
services to veterans with diabetes, congestive heart failure, hypertension, post-traumatic stress disorder
(PTSD), chronic obstructive pulmonary disease, and depression. These programs were deemed a
success by the VA, reaching approximately 608,900 patients through 1,793,496 telehealth consultations
in FY2013. This allowed 41,430 patients to live independently outside of long-term institutional care. Of
patients receiving telehealth services, 45% lived in MUA/Ps. The VA estimates that the number of
patients receiving treatment from their telehealth program should grow by 22% annually.
197.83
49.44
71.61
28
13 10
0
5
10
15
20
25
30
0.00
50.00
100.00
150.00
200.00
250.00
Yes No Proposed
Nu
mb
er o
f St
ates
USD
($)
in m
illio
ns
Does state have a telehealth parity law?
Total Population by Legislation Decision
117
HEALTHCARE IT & DISTRIBUTION February 23, 2016

VA Telehealth Definitions
Clinical Video Telehealth (CVT)
Real-time videoconferencing between VA medical vendors
and CBOCs that replicates face-to-face consultations
between patient and provider, or provider to provider.
Home Telehealth (HT)
Monitors patients and manages diseases through video into
the home and use of mobile devices for acute and chronic
care management and health promotion/disease
prevention.
Store & Forward Telehealth (SFT)
Acquisition, storage, and forwarding of clinical images to
experts for review.
Teleradiology
Remote analysis of radiology and nuclear medicine images.
Source: VA Telehealth Services Overview - Adam Darkins, June 2014
Source: VA Telehealth Services Overview - Adam Darkins, June 2014
In 2011, the VA awarded contracts valued at $1.38B over 5 years to 6 companies for telehealth devices
and services. These companies included: Authentidate, American Telecare, Cardiocom, HealthHero
Network, Visual Telecommunication Network/ViTelCare and Viterion TeleHealthcare. The VA has also
piloted software from Vertiglo that allows veterans to contact their primary care provider through
handheld devices that utilize Apples FaceTime application.
Smaller telehealth awards made by the VA include a $29M 5-year contract awarded to AMC Health
announced in September 2013. AMC Health provided the VA with technology, including patient
monitoring devices that transmitted wirelessly to AMC Health’s secure web portal or to any integrated
EHR.
311,369
202,823
144,520
0 50,000 100,000 150,000 200,000 250,000 300,000 350,000
SFT
CVT
HT
Number of Patients
Number of Patients Using VA Telehealth
118
HEALTHCARE IT & DISTRIBUTION February 23, 2016

“Pathways to Health” - Panasonic’s Partnership with Assisted Living Facilities
On May 19, 2014, Panasonic Corporation of North America, a subsidiary of Panasonic Corp.
(6752:Tokyo), partnered with New York-based Jewish Home Lifecare (JHL), one of the largest geriatric
and long-term care facilities in the U.S., to establish “Pathways to Health,” a telehealth service for
monitoring JHL patients within assisted living. “Pathways to Health” utilized Panasonic’s home gateway
system to provide a portal that allowed JHL employees to monitor and communicate with patients from a
remote central location. JHL indicated that the program had been deemed a success by staff and
patients, reporting that the facility had seen a reduction in hospitalizations and emergency room visits
from assisted living patients, while also maintaining a high degree of patient satisfaction. By decreasing
these provider visits, JHL was able to reduce treatment costs for patients and costs associated with
unnecessary patient visitations by staff. The program received praise for its innovative features and was
awarded the 2014 “Innovator of the Year” award by McKnight’s, a business magazine that covers long-
term care facilities. This example demonstrates the viability of these partnerships and the potential
niche market for TRM vendors to integrate their products within existing health systems to improve their
treatment capabilities.
Closing Thoughts
By offering new digital tools to manage health and create a more efficient communication channel
between providers and patients, TRM solutions have been shown to increase access to healthcare,
improve population health, and reduce healthcare spending by offering low-cost alternative methods to
connect patients and providers. By utilizing user-friendly technological advances within the
telecommunications sectors, TRM vendors can create digital platforms for people seeking healthcare
advice or treatment.
119
HEALTHCARE IT & DISTRIBUTION February 23, 2016

Wearables & Interactive Devices
Engaging the Consumer: The Era of Mobile Apps & Digital Health
Introduction & Overview
Wearables & Interactive Devices (WIDs) are a form of user-driven, biosensing digital technology that
allows patients to track their physiological vitals using mobile applications (apps) or probes worn on their
body. WIDs are typically divided into two subsectors by investors: wearables and Digital Health mobile
apps. WIDs obtain data that is stored on a cloud server and is accessed from a mobile application. Use
of such medical tracking devices, known as “do-it-yourself” (DIY) medicine, has increased with
smartphone development and widespread usage.
Wearable & Bio-sensing Devices Scope of Products
Source: Leerink Partners LLC, 2016
Numerous apps target patients and providers to improve their education, wellness, and access to
information. The Amazon Appstore (Amazon.com), App Store (Apple), BlackBerry World (BlackBerry),
Google Play (Android), Firefox Marketplace (Firefox OS, Android, Windows), Windows Phone Store
(Windows Phone), and the Windows Store (Windows Desktop) are among the major distributors of such
applications. According to Statista, the “Health & Fitness” and “Medical” categories account for about
5% of the ~1.4 million apps available on the Apple App Store. Wellness apps can range from mobile
electronic medical records (EMRs) with workflow software compatible with both smartphone and tablet
devices to health tracking monitors that sync with a wearable device recording physiological traits,
including heart rate, blood pressure, and physical movement.
The WIDs sector has been at the forefront of an investment surge since 2014, including the IPO of Fitbit
(FIT) in 2015. Within this sector, we anticipate growth in both usage and number of products, as
devices are motivated to promote preventive, population health by engaging users to track their health
and avoid risky behavior.
Wearable Devices
Fitness Bands Smart Clothing Smart Glasses Smartwatches
Biosensors
Ingestibles Smart Implants Tattoos
120
HEALTHCARE IT & DISTRIBUTION February 23, 2016

Source: Statista, Dec 2015
BCC Product Lifecycle for the Wearable Computing Industry
BCC Research predicts that we are currently in a period of extensive growth within the WID industry. As
major smartphone companies, such as Apple, Google, and Samsung, enter the market, there will be a
large period of product growth from 2015 through 2018. At that point, the market will begin to mature,
and growth will slow down before ultimately declining by around 2021. BCC believes that, by then, the
consumer target audience will be presented with newer technology, such as bio-implanted computers,
to perform the same duties as WIDs. The figure below displays this lifecycle process, with the area
under the curve being a predictive representation of sales, revenue, and consumer interest in WIDs.
Source: BCC Research, Feb. 2014, Leerink Partners LLC, 2016
22%
10% 10% 9%
7%
5% 4%
4% 3% 3% 3% 3% 3% 2% 2% 2% 2% 2% 2%
1% 1%
0%
5%
10%
15%
20%
25%
Pe
rcen
tage
of
Tota
l Ap
ps
App Store Categories by Percentage
2012 2013 2014 2015 2016 2017 2018 2019 2020 2021 2022
Product Lifecycle for WIDs DEVELOP INTRODUCE GROWTH MATURITY DECLINE
121
HEALTHCARE IT & DISTRIBUTION February 23, 2016

WID Industry Drivers
BCC also highlights the industry drivers for WIDs, separating them into two sections: market drivers and
technology drivers. Descriptions for these drivers are paraphrased.
Market Driver Description Technology Driver Description
Smartphone Industry
Large firms have brand recognition,
consumer loyalty, and strong
developmental infrastructure.
Consumers within this market
demand increased innovation.
Crowd-Sourced Startups
Crowdsourcing capital has become a
common practice for many tech start-
ups and may be a source of initial
capital for many start-ups wearable
device vendors.
Wearable Computing
Industry growth will rely on ability
for devices to store large amounts
of data on cloud-based servers.
OLED Improvements
Improvements to Organic Light
Emitting Diodes (OLEDs) allow
device displays to be both functional
and durable. Many are scratch-
resistant and flexible.
Fitness & Sports
Large potential consumer market
that may prove to have highest
demand for WIDs.
Power Source
Improvements
Small power storage devices are
critical for WIDs to possess the
necessary battery life for consumers.
Monitoring Device
Industry is looking for WIDs that
can serve as platforms for digital
monitoring devices for aged care
and child monitoring.
Big Data Software
Improvements
Since WIDs are small and cannot
store large amounts of data, WID
vendors need to access reliable
cloud-based data servers for storage.
Gaming &
Entertainment
Industry is looking for WIDs that
can appease consumer demand for
augmented reality and virtual reality
platforms.
App Innovation
Apple was able to spur innovation
within this sector by allowing
consumers to write their own app
programs. Much of the success of
WIDs will depend on their ability to
attract consumers with meaningful
apps that make their devices a
popular necessity.
Source: BCC Research, Feb. 2014
Barriers to Success
The primary concerns for WIDs revolve around potential security breaches that expose users’ personal
information. As new digital products that aggregate the user’s personal information during the era of
system-hacking, there remains concern from consumers that these products are vulnerable to security
breaches. As users begin tracking their physiological traits, they want assurance that this information
will not be stolen or misused. Pressure from payer organizations to use this information to reduce the
effects of adverse selection can leave consumers wary of involving themselves in potentially revealing
devices.
Health & Wellness: Focusing on Nutrition and Exercise
Over the past several years, mobile healthcare apps have targeted the fitness-savvy and nutrition-
conscious consumers by promoting health and wellness as a method of preventive medicine. Of the 3%
of apps within the Apple App Store under the “Health & Fitness” label, many are based around tracking
a user’s diet and exercise routine. Some examples include apps that track caloric intake or measure
distance run by a user. Many of these apps, such as the Apple Watch, Basis Peak™, Fitbit® Flex™,
Jawbone™ UP, and Nike+ FuelBand, utilize Bluetooth technology to connect to wearable bracelets and
bands that measure heart rate, fitness activity, sleep patterns, and caloric intake. These apps are
produced by public companies Apple (AAPL), Fitbit, Inc. (FIT), and Nike, Inc. (NKE) as well as private
companies like AliphCom Corp. (Jawbone).
122
HEALTHCARE IT & DISTRIBUTION February 23, 2016

These apps target a large, growing market. According to WiFore, around 19.5% of the U.S. population
and 12.5% of Europe’s population have a gym membership; in developing regions this number is
significantly lower because populations do not have similar access to disposable income. They estimate
a global presence of 140 million health club and gym users. WiFore believes that, from this figure, it is
reasonable to consider a total addressable 2018E market of 65 million potential purchasers from this
group, which is expected to continue growing in the future. While many of these apps target consumers
who want to live a healthier lifestyle, we also expect providers and health plans to partner with wellness
app companies as they continue to look for ways to engage patients and improve population health.
Source: WiFore - The Market for Smart Wearable Technology, Feb. 2015
Commonly Used Personal Healthcare Mobile Apps - App Store & Google Play Store
0
10
20
30
40
50
60
70
80
90
100
2014 2015 2016 2017 2018 2019 2020
Mill
ion
s o
f U
sers
Total Addressable Market of Active Gym Users
123
HEALTHCARE IT & DISTRIBUTION February 23, 2016

Consumer Analytics: How Consumers View Wearable Devices
According to the 2014 HRI/CIS wearables consumer survey by PwC, 21% of U.S. consumers were
found to own a wearable device. Usage among device owners was high, with only 2% no longer
wearing the product after purchasing it.
Source: PwC - HRI/CIS Wearables consumer survey, 2014
Overall, nearly half of consumers polled were “somewhat likely or very likely” to purchase a fitness band
within the next year. Another 35% of consumers were “somewhat likely or very likely” to purchase a
smartwatch. PwC’s report, however, preceded Apple’s (AAPL) Apple Watch announcement on
September 9, 2014. Computer marketing research firm BI Intelligence was more bullish about wearable
device growth, particularly for smartwatches. According to BI Intelligence, the global wearables market
was expected to grow by a CAGR of 35% over the next five years, reaching 148 million units shipped
per year, up from 33 million wearable products shipped in 2015. While some consumers were skeptical
about the necessity of smartwatches, the shipment rate for smartwatches was still expected to grow by
a CAGR of 41% over the next five years. By 2019, smartwatches are expected to account for 70% of all
wearable devices sold.
Source: PwC - HRI/CIS Wearables consumer survey, 2014
45%
35%
20%
19%
13%
0% 5% 10% 15% 20% 25% 30% 35% 40% 45% 50%
Fitness band
Smartwatch
Smart clothing
Smart glasses
Tracking devices
Percentage of consumers that would purchase type
Most Popular Types of WIDs Among Consumers
124
HEALTHCARE IT & DISTRIBUTION February 23, 2016

Shipment volume figures from IDC’s Worldwide Quarterly Wearable Device Tracker support this
consumer sentiment, with wristwear (fitness bands and smartwatches) accounting for 90.4% of all
shipments in 2014. IDC anticipates this number going down to 89% as eyewear increases in popularity.
Source: IDC Worldwide Quarterly Device Tracker, March 30, 2015
In addition to this growing popularity among consumers, both patients and providers were found to be
comfortable with the transfer of health data over mobile devices. Providers in particular understand the
positive effects of mobile devices. According to a 2014 poll by PwC, 79% of physicians believe that
mobile devices improve their coordination of care for patients, and 68% are willing to prescribe a mobile
health device to assist a patient in chronic disease management.
Source: PwC - Healthcare Delivery of the Future - November 2014
125
HEALTHCARE IT & DISTRIBUTION February 23, 2016

The Global & Domestic Markets for Wearables & Interactive Devices
The global market for smartphone technology has received a variety of professional opinions. The
consensus amongst reports, however, is clear: the market ceiling is high and there is exponential
potential for innovative healthcare WIDs. IndustryARC, an Indian market research practice, expects
WIDs revenue to grow by a CAGR of 21.3% over the next six years, generating $34.4B by 2020. This
figure would account for 83.3% of all wearable device revenue. PwC is more bearish on the global size,
estimating a current global market value of $10.2B that should swell to $23B by 2017. Juniper Research
is also optimistic about the WID market growth rate, estimating a total industry revenue of $53.2B by
2019.
Source: PwC - Touching lives through mobile health, Feb. 2012
PwC’s 2017 $23B global revenue figure was broken down into three primary revenue regions: Asia
Pacific (30%), Europe (30%), and USA/Canada (28%). The U.S. was estimated to have the largest
national market, reaching $5.9B in 2017. Rounding out the top five individual countries were China
($2.5B), Japan ($1.4B), Germany ($1.0B), and France/Russia ($0.8B). All other countries outside of the
top 10 largest markets accounted for $8.1B.
Source: PwC - Touching lives through mobile health, Feb. 2012
In its report on the global wearable market, BCC Research roughly supports PwC’s and IndustryARC’s
revenue figures and pattern of growth. BCC calculates WID revenue to be $9.2B in 2014 and estimates
that it will grow by a CAGR of 43.4% between 2013 and 2018 until it reaches $30.3B by 2018.
$4.5
$6.9
$10.2
$15.4*
$23.0*
$-
$5.0
$10.0
$15.0
$20.0
$25.0
2013 2014 2015 2016 2017
USD
($)
in b
illio
ns
Global WID Market Revenue, 2013-2017
*Estimate
126
HEALTHCARE IT & DISTRIBUTION February 23, 2016

Source: BCC Research, Feb 2014
The mobile health market is broken down by PwC into the following functional categories:
administration, diagnosis, health practitioner support, monitoring, prevention, treatment, and wellness.
In PwC’s mobile healthcare analysis, monitoring apps and treatment apps were found to have the
largest market share. In North America, in particular, which PwC classified as the U.S. and Canada,
monitoring apps were found to hold 84% of the market share of all mobile health apps.
Source: PwC - Touching lives through mobile health, Feb. 2012
Within the global market, the largest factors that will determine the success of mobile healthcare
proliferation are government incentives, legislative freedom, provider acceptance and comfort, and user
adoption. In addition, proven success in lowering the cost of healthcare while maintaining a high
standard of care will affect the global perception of mobile healthcare apps as a viable alternative to
face-to-face interactions.
WID Market Share by Revenue
According to the IDC Worldwide Quarterly Wearable Tracker, Fitbit, Inc., Apple, Xiaomi, Inc., Garmin,
and Chinese brand XTC (a subsidiary of BBK) (TSE: XTC) were the market share leaders by shipment
volume in 3Q15. Total shipment volume for the quarter came to 21.0 million units, up 197.6% from the
7.1 million units shipped in 3Q14.
$3.1 $5.0
$9.2
$30.3*
$-
$5.0
$10.0
$15.0
$20.0
$25.0
$30.0
$35.0
2012 2013 2014 2018
USD
($)
in b
illio
ns
Global Wearable Computing Market, 2012-2018
*Estimate
127
HEALTHCARE IT & DISTRIBUTION February 23, 2016

Going forward, several market researchers, including BI Intelligence, Canalys, and HIS Technology,
believe that Apple’s Watch product will be a continuing catalyst for wearables sales due to consumer
curiosity from media attention. Canalys is confident in Apple’s ability to drive market growth for
wearables, citing the Apple Watch’s ability to sync with Apple iPhone technology as a primary reason.
BI Intelligence predicts that the Apple Watch could reach a 48% share by 2017, up from 40% in 2015.
Similar to the smartphone and tablet markets, BI Intelligence predicts that Apple and Google will be the
future market share leaders for smartwatches and wearable devices. BI is optimistic in its predictions,
viewing a 90% market share between both firms.
Despite this market growth, skepticism persists from consumers about the necessity and benefit of
smartwatch wearable technology. In a poll by BI Intelligence about why consumers were not interested
in purchasing a smartwatch, 51% did not see the purpose of a smartwatch, 14% found the price to be
too expensive, and 13% simply did not like wearing a watch. While Apple and Google are targeting the
same consumer market as wearable vendors Fitbit, Jawbone, and Nike, BI believes that there will still
be a niche market available for fitness bands, as smartwatches by Apple and Google are aimed at being
standalone communication devices. As luxury items, WID vendors must rely on strategic marketing
campaigns in order to ensure long-term success. Issues that will influence the market growth include
limited battery life, small screen size, and the lack of a universal app that drives user engagement. As
these issues are addressed and WID vendors are successful in marketing the improvements that their
devices can bring to users, the market should experience substantial growth through 2017.
Source: BI Intelligence - October 2014 Survey
Healthcare Reform Sparks Innovation & Increased Investment Activity
Fitbit’s IPO in 2015 marked a turning point in the investment perception of WIDs and Digital Health.
Since passage of the ACA in 2010, healthcare has undergone a multitude of government reforms aimed
at finding cost-effective health solutions that increase access, lower costs, and increase quality. In their
2014 annual report, StartUp Health reported significant growth in the number of start-up firms,
estimating a current landscape of more than 7,500 digital-health focused start-ups. As innovation within
this sector has increased with the formation of new WIDs products, investments from private equity and
venture capital firms have also demonstrated a similar dramatic increase in the past five years. When
tracking investments, CB Insights breaks down WIDs into three subcategories: Wearables, Mobile
Health, and Healthcare Mobile Software. CB Insights calculates that total funding for wearables has
gone from $334M in 2011 to $886M in 2014.
15%
7%
13%
14%
51%
0% 10% 20% 30% 40% 50% 60%
Other
Design: I Don't Like the Design
I Don't Like Wearing a Watch
Price: Watches are Too Expensive
I Don't See the Point
Percent of Consumer Reponses
Consumer Poll: Why Aren't You Interested in a Smartwatch? (n = 1,326)
128
HEALTHCARE IT & DISTRIBUTION February 23, 2016

Source: CB Insights - Industry Analysis, July 2015
Corporate-Wellness Plans and WIDs
In 2010, the FDA designated WellDoc, Inc.’s mobile type-II diabetes management app, BlueStar,
eligible for 510(k) clearance, setting a precedent for the future of WIDs. 510(k) clearance, the FDA’s
informal approval of medical products that are deemed “substantially equivalent” to FDA-approved
products, provides legitimacy for BlueStar as a diabetes-monitoring device. While no laws are currently
in place to obligate commercial coverage for WID platforms, WellDoc’s 2012 agreement with two
unnamed private insurers to provide reimbursement for BlueStar demonstrated the trend toward
increased coverage. BlueStar was named an acceptable healthcare monitoring system by the FDA in
2010, and this allowed WellDoc to negotiate a $100/month reimbursement from two commercial
insurance companies for patients using the app. This agreement gained the attention of several Fortune
500 companies, including Ford Motor Company (F), Rite Aid (RAD), and DexCom (DXCM), which
subsequently added BlueStar coverage to their employee health benefits packages. Following this
breakthrough achievement for WID reimbursement, physicians are now able to prescribe BlueStar for
patients.
Employers are also using WIDs to encourage healthy employee behavior. Within larger firms, benefits
managers have used these devices to monitor several physiological traits, including breathing rate,
heart rate, exercise patterns, sleep patterns, blood glucose levels, and stress levels. The data provided
can be analyzed to avoid triggers, thereby preventing hospital visits and unnecessary treatment. In the
long term, employers save money and avoid raising premiums for “higher risk” employees. Employees
also appear receptive toward corporate wellness plans and have expressed a desire for their companies
to provide wearable fitness trackers. In a survey by Modis, an IT staffing firm, respondents identified
smartwatches (63%) and fitness trackers (44%) as the two wearable devices they would most want their
employers to provide.
$334 $283
$459
$886
17
25
55 59
0
10
20
30
40
50
60
70
$-
$100
$200
$300
$400
$500
$600
$700
$800
$900
$1,000
2011 2012 2013 2014
Nu
mb
er o
f D
eals
USD
($)
in m
illio
ns
Wearables Total VC/PE Funding, 2011-2014
129
HEALTHCARE IT & DISTRIBUTION February 23, 2016

Source: Modis Employee Survey, Jan. 2015
Thomsons Online Benefits also cites wearable devices and “nudge yourself” integrated apps as two of
the top five trends that are expected to be included in future employer health-benefits packages.
Consistent with the theme of population health, many employers are turning to healthcare education
and other preventative measures as a means of engaging employees in their healthcare programs. We
anticipate that this saving incentive for employers will lead to an increase in the number of corporate
sponsorships with WID vendors and an increase in employee incentives to participate in WID-sponsored
programs. As consumer WID usage increases for health-specific purposes, such as disease tracking,
we expect payer coverage to increase and allow the industry to help manage health in a population
health-focused ACO environment.
On-Demand Medicine: Competition Among Start-ups for Home Health Visits
Home healthcare appears to also be making a comeback, as “on-demand” home visits have seen a
surge in popularity through competition among several regional start-ups. The concept is simple:
providing in-person home health visits by certified, third-party providers through a mobile app. These
apps are beneficial because they allow patients to schedule visits at their convenience and keep
patients from visiting the ER for urgent care procedures. Companies such as Heal, Pager, MedZed,
RetraceHealth, and True North Health Navigation (dba Dispatch Health) have emerged as prominent
brands throughout the U.S. While these companies have different business models and services
offered, they present a compelling solution for urgent care treatment in metropolitan areas. In-house
visits can range from $99 to $200 per visit and are currently made through out-of-pocket payments that
are later submitted as an out-of-network claim for the patient’s insurer. In a style reminiscent to Uber,
providers are staffed from local populations, typically consisting of full-time hospital employees who are
looking to earn money outside of their normal work hours. Despite being small in size, these start-ups
demonstrate a unique opportunity for healthcare vendors to provide treatment and increase access to
healthcare at an affordable price.
63%
44%
29%
18%
8%
0% 10% 20% 30% 40% 50% 60% 70%
Smartwatch
Fitness Tracker
Smart Glasses
Interactive Input
Smart Clothing
Percent of Employee Responses
Consumer Poll: What two wearable devices would you want your employer to provide?
130
HEALTHCARE IT & DISTRIBUTION February 23, 2016

Source: Wall Street Journal, 8/11/15
Closing Thoughts
In monitoring physiological traits in users and aggregating this data into user-friendly mobile apps, WIDs
are able to track the efficiency of preventive, population-based healthcare programs. With the
advancement of smartphone technology and an interest from large technology players such as Apple,
Google, and Samsung, WIDs have the potential to reach a mainstream consumer audience. Fitbit’s
recent success also suggests that investors are confident in the ability for new players to enter and
succeed within this growing market as healthcare plans begin to embrace devices that improve
preventive medicine.
131
HEALTHCARE IT & DISTRIBUTION February 23, 2016

Private Company Overview & Brief Profiles
Introduction & Overview
This section contains approximately 200 private company snapshots, all of which identify companies
within the PHM space. Companies were selected based upon recent contributions to the healthcare
field, investor activity, M&A activity, and potential to make a difference within healthcare, specifically
from a population health perspective. Each company was also placed into the following four categories:
Consumer & Value-Based Care Solutions (CVBCS), Core SAAS Solutions (CSS), Telehealth & Remote
Medicine (TRM), and Wearables & Interactive Devices (WIDs).
Source: Leerink Partners LLC, 2016
Overview
According to CB Insights, healthcare made up ~12% of total venture capital investments globally and
~14% in North America from 1Q14 through 1Q15 (5 quarters). Total investments and total number of
deals within all sectors of healthcare grew between 2011 and 2014. In 2011, investments totaled $13.2B
and by 2014 had eclipsed $20B, reaching an aggregate of $20.6B. Over $6.0B in investments was
reported for 1Q15. Since 2011, over $71.3B has been invested into healthcare-related companies.
18%
16%
38%
30%
Population Health Labels
WID
TRM
CVBCS
CSS
132
HEALTHCARE IT & DISTRIBUTION February 23, 2016

Source: CB Insights - Industry Analysis, July 2015
Of the 132 companies that had public investment activity, Emdeon, Inc. ($2.20B), Truven Health
Analytics ($1.25B), and Decision Resources Group ($635M) all had aggregate investments of over
$500M. Privia Health ($414M) and Jawbone ($368M) rounded out the top five highest aggregate
investments.
Source: Leerink Partners LLC, Aug. 2015
Twenty-five companies from the list had $100M+ in total aggregate investments. Following the above
five, the next 10 highest aggregate investments were as follows:
$13.2 $13.5
$18.0
$20.6
1851 1940
2088 2324
0
500
1000
1500
2000
2500
$-
$5.0
$10.0
$15.0
$20.0
$25.0
2011 2012 2013 2014
Nu
mb
er o
f D
eals
USD
($)
in b
illio
ns
Healthcare Total PE/VC Funding, 2011-2014
$2,200
$1,250
$635
$414 $368
$-
$500
$1,000
$1,500
$2,000
$2,500
Emdeon Truven HealthAnalytics
Decision ResourcesGroup
Privia Health Jawbone
USD
($)
in m
illio
ns
Top 5 Highest Aggregate Investments
133
HEALTHCARE IT & DISTRIBUTION February 23, 2016

Source: Leerink Partners LLC, Aug. 2015
Nearly one-fifth of the 132 companies that reported public investment activity had a total aggregate
funding over $100M. This same group also accounted for 70% of the total investment funding.
Companies were separated into the following brackets:
Source: Leerink Partners LLC, Aug. 2015
Private Equity & Venture Capital Profiles
437 private equity, venture capital, and general investment firms were active investors for the private
companies profiled. 95 of these firms were active investors for at least two companies, and 42 were
active investors in three or more companies.
$295 $289
$268 $250
$185
$167 $163 $153
$152 $138
$-
$50
$100
$150
$200
$250
$300
$350U
SD($
) in
mill
ion
s
Next 10 Highest Aggregate Investments
50
33
24
11
5 9
38%
25%
18%
8%
4% 7%
0%
5%
10%
15%
20%
25%
30%
35%
40%
0
10
20
30
40
50
60
$0 - $25 $25 - $50 $50 - $100 $100 - $150 $150 - $200 $200+
Pe
rcen
tage
of
Tota
l Co
mp
anie
s
Nu
mb
er o
f C
om
pan
ies
USD($) in millions
Number of Companies Per Aggregate Range
134
HEALTHCARE IT & DISTRIBUTION February 23, 2016

Source: Leerink Partners LLC, Aug. 2015
Fourteen firms were active investors in at least five or more companies. Kleiner Perkins Caufield &
Byers LLC was the most active investment firm by total number of active investments, investing in eight
companies from the list. It was followed by Ascension Ventures LLC, Heritage Group LLC, and Kaiser
Permanente Ventures LLC, which all were active investors for seven companies from the list.
Number of Investments (# of Firms) Firms
5 Investments (7)
Merck Global Health Innovation LLC, Norwest Venture
Partners, Oxeon Investments LLC, QUALCOMM
Ventures, Safeguard Scientifics, Inc., Sandbox RLD
LLC, Sequoia Capital
6 Investments (3) Draper Fisher Jurvetson Management LLC, HLM
Venture Partners, Khosla Ventures LLC
7 Investments (3) Ascension Ventures LLC, Heritage Group LLC, Kaiser
Permanente Ventures LLC
8 Investments (1) Kleiner Perkins Caufield & Byers LLC
Source: Leerink Partners LLC, Aug. 2015
22
6 8
2 3
1
0
5
10
15
20
25
3 4 5 6 7 8
Nu
mb
er o
f In
vest
men
t Fi
rms
Number of Individual Investments
Number of Firms with >2 Individual Investments (n=437)
135
HEALTHCARE IT & DISTRIBUTION February 23, 2016

Active Private Equity & Venture Capital Firms by Sector
Consumer & Value-Based Care Solutions (CVBCS) Core Saas Solutions (CSS)
Heritage Group LLC
Essex Woodlands Health Ventures, Inc.
HLM Venture Partners
Francisco Partners Management LLC
Kaiser Permanente Ventures LLC
Health Enterprise Partners LLC
Khosla Ventures LLC
Kleiner Perkins Caufield & Byers LLC
Venrock Associates
Summit Partners LP
Telehealth & Remote Medicine (TRM) Wearables & Interactive Devices (WIDs)
CHP Management, Inc.
Ascension Ventures LLC
Heritage Group LLC
Draper Fisher Jurvetson Management LLC
Merck Global Health Innovation LLC
Kaiser Permanente Ventures LLC
Oxeon Investments LLC
Kleiner Perkins Caufield & Byers LLC
Psilos Group Managers LLC
Norwest Venture Partners
Source: Leerink Partners LLC, Aug. 2015
136
HEALTHCARE IT & DISTRIBUTION February 23, 2016

Company Name Designation Description
1Life Healthcare, Inc. TRM Provide primary care physician services for the employers
23andMe WID Personal genetics company that provides genetic information through DNA analysis technologies and web-based interactive tools
ABILITY Network CVBCS Healthcare information technology company that enables physicians and hospitals to connect
AbilTo, Inc. TRM Offers face-to-face therapy programs by using video chats
Access Mediquip WID Provide outsourced implantable medical device management solutions
Accolade TRM Engage in the provision of professional health assistant services
Act.MD WID Build web and mobile applications
Activate Networks WID Analyze and activate social networks for healthcare providers
Adreima CVBCS Provide healthcare reimbursement software and solutions
Advanced Practice Strategies WID Provide education solutions about medical risk management
Aethon WID Develop and deploy autonomous mobile robots and robotic transit systems
Airstrip Technologies, Inc. TRM Provide mobile medical software applications
Akili Interactive Labs WID Develop therapeutic mobile video games
Aledade CVBCS Partners with primary care physicians to provide everything the doctors need to create and run an Accountable Care Organization (ACO)
Alignment Healthcare LLC CVBCS Provide population health management services to health systems and provider groups in the U.S.
AliphCom Corp. (Jawbone) WID Develop and manufacture human-centered wearable technology and audio devices
AmazingCharts CSS Develop electronic health records management software
American Well TRM Provide on-line healthcare services
Analyte Health TRM Operates as a diagnostic triage company
Anthelio Healthcare Solutions CVBCS Independent provider of information technology and business process services
API Healthcare CVBCS Offer workforce management solutions to the healthcare industry
Aprima Medical Software, Inc.
CSS Develop innovative electronic health record, practice management and revenue cycle management solutions
Arcadia Solutions LLC CSS Provide healthcare consulting services
Aventura CSS Provide healthcare IT software and solutions
Aviacode CSS Provide technology-enabled medical coding
Awarepoint TRM Engage in the provision of real-time location system solutions
BenefitFocus CSS Provide employers, carriers and consumers a single Web-based platform for benefit shopping, enrollment, management and industry standard data exchange
BENU CSS Provide integrated health benefit solutions
Best Doctors WID Engage in the provision of medical consultation services and insurance programs
BodyMedia WID Develop, markets and sells body monitoring products and applications
Brightree CSS Provide business management software solutions
Bswift LLC CSS Provide software and services that streamline benefits, human resources and payroll administration services
Butterfly Network, Inc. WID Operates at the cutting edge of multiple engineering and scientific disciplines
CareCloud CSS Provide cloud-based healthcare information technology solutions
CareCore CVBCS Provide diagnostic imaging management services
Casenet CSS Engage in the provision of care management system solutions
Cereve, Inc. WID Develop therapeutic devices for the treatment of insomnia
Ceridian CSS Global human capital management technology company
Change Healthcare Corp. CVBCS Provide healthcare cost transparency solutions
CitiusTech, Inc. CVBCS Provider of technology consulting and solutions to healthcare providers and healthcare IT vendors
ClearCost CVBCS Work with medical claims to determine medical service and prescription drug prices for both in-and out-of-network providers
Connance CSS Provide healthcare services
CoPatient CVBCS Operates an online platform that offers a medical bill review
CUE.ME WID Deep health tracker that obtains health information at the molecular level
Curaspan CSS Build secure patient-transition networks for hospitals, post-acute providers and suppliers to optimize patient care
137
HEALTHCARE IT & DISTRIBUTION February 23, 2016

Company Name Designation Description
Curoverse CVBCS Develop an open-source platform to manage big genomic data
DailyFeats, Inc. (Maxwell Health)
CVBCS Engage in the provision of a health-as-a-service platform
Decision Resources Group CVBCS Health research and data analytics firm
Doximity WID Operates an online professional physician network for physicians
Dr.First.com, Inc. CVBCS Provides standalone e-prescribing that is scalable to work with major health plans, medical sites, health systems, hospitals, and small practice providers
eClinicalWorks, LLC CSS Provide electronic health records and practice management services
Eliza Corp. CVBCS Provide health engagement management, blending technology, communication solutions, and data analytics
Emdeon CVBCS Provide revenue and payment cycle management and clinical information exchange solutions
eMDs CSS Develop healthcare software solutions
Epic Systems Corp. CSS Develop healthcare information systems
Essence Group Holdings CSS Provide technology solutions, support, and consulting services to healthcare systems, payers, and providers
eVariant CSS Operates as a software-as-a-service company serving the healthcare provider market
Explorys CSS Maintain a cloud-computing platform specialized for the healthcare industry
Flatiron Health CVBCS Provide healthcare data analytics for specialized diseases
Gaffey Healthcare CSS Engage in practice management and medical billing solutions
GetWellNetwork, Inc. CVBCS Provide patient care solutions
Ginger.io CVBCS Operates as a behavior analytics company using big data
GNS Healthcare CVBCS Engages in the provision of analytics solutions for the healthcare industry
Grand Rounds CVBCS Connect patients in need to the expert physicians best able to help them
Greenway Medical Technologies, Inc.
CSS Provide technical solutions and services for healthcare customers
hCentive CVBCS Provide cloud-based healthcare technology solutions for health plans, state agencies, dental plans, and TPAs
Health Catalyst CVBCS Develop healthcare data warehousing and process improvement solutions
Health Grades, Inc. CVBCS Engage in the provision of proprietary, objective ratings of hospitals, nursing homes and home health agencies
Healthcare BlueBook CVBCS Provide online consumer platform for healthcare services pricing
HealthcareSource HR, Inc. CSS Develop talent management software for the healthcare industry
HealthEdge CSS Provide next-generation, business-transforming technology products to the healthcare payer market
Healthland, Inc. CSS Nationwide provider of comprehensive information systems for small community hospitals
Healthline Networks CVBCS Provide internet-based intelligent health search, advertising and content services
HealthPort, Inc. TRM Provide Release of Information (ROI) services, audit management, and tracking technology
HealthSparq CVBCS Develop healthcare transparency software solutions for health plans and employers to offer to their members and employees
HealthWyse CSS Provide clinical and financial software for home care, hospice, and private duty agencies
HeartFlow, Inc. WID Engage in the development of technology to help physicians noninvasively diagnose coronary artery diseases
Human Arc WID Provide revenue enhancement solutions to hospitals and health insurers
Human Care Systems CVBCS Design and deliver high impact support programming and marketing for biopharma and medtech companies
Humedica, Inc. CSS Offer software-as-a-services business solutions to the health care industry
Iatric Systems CVBCS Deliver comprehensive healthcare IT integration
IC Sciences WID Develop mobile and digital health applications
iHealth Technologies, Inc. CVBCS Provide payment policy management services
ikaSystems CSS Develop cloud computing technologies to support healthcare payers
InCrowd CVBCS Provide real-time research platform for the life sciences industry
138
HEALTHCARE IT & DISTRIBUTION February 23, 2016

Company Name Designation Description
Influence Health, Inc. CVBCS Provide digital consumer engagement for the healthcare industry
Informatics Corp. of America TRM Provide strategic interoperability and intelligent care coordination solutions
InterSystems Corp. CSS Provide software platforms for connected healthcare
InTouch Health TRM Develop, manufacture, and market telemedicine remote presence devices and medical robots for clinical applications
IntraLign Health, Inc. CVBCS Provide specialty healthcare services to hospitals and health systems
Iora Health TRM Provide primary care healthcare services
Jackson Healthcare Solutions CVBCS Provide healthcare staffing, healthcare technology, and hospital management solutions
Kareo CSS Provide cloud-based software and services for independent medical practices
Keas TRM Operates an online health and wellness platform for the enterprise applications
Knome CVBCS Provide genome sequencing and analysis services to biomedical researchers
Kyruus, Inc. CVBCS Provide physician network optimization software solutions
Liazon CVBCS Engage in the provision of web-based employee benefit solutions
Linkwell Health CVBCS Engage in the development of health and wellness consumer engagement platforms
Lively TRM Provide telehealth services for elderly people with chronic illnesses
Lumeris CVBCS Provide population health management solutions
Lumos Labs, Inc. (Lumosity) WID Cognitive neuroscience research and development company that builds software tools for improving brain health and performance
Mango Health WID Develop mobile healthcare apps
MD Revolution CSS Deliver a population health management SaaS products
MDeverywhere, Inc. CSS Provide physician revenue cycle management and medical billing software solutions
MDLive TRM Operates as telehealth provider of online and on-demand healthcare delivery services and software
MedAptus CVBCS Operates as a healthcare information technology company which provides revenue cycle solutions to medical group practices and integrated delivery systems
MedAssist CVBCS Provide revenue management services
MedeAnalytics, Inc. CSS Provide SaaS-based healthcare performance management solutions
MEDecision, Inc. CSS Provide healthcare management software and services to physicians and managed care organizations
MedHOK CVBCS Provide an integrated, cloud-based platform that delivers quality and compliance solutions
MEDHOST CVBCS Provide market-leading enterprise, departmental and healthcare engagement solutions
Medical Information Technology, Inc.
(MEDITECH) CSS
Develop, manufacture, license, and support computer software products for the hospital market
MedImpact CVBCS Provide pharmacy benefit management services
Medivo TRM Provide virtual healthcare services
MedSynergies, Inc. CSS Provide physician practice, revenue, and physician referral management services
MedVentive, Inc. CVBCS Provide healthcare and medical technology solutions
Misfit WID Manufactures and invents wearable computing products
Modernizing Medicine CSS Provide electronic medical record systems
Motivation Science, Inc. (Validic)
WID Engage in the development of health technology platforms
Nanthealth LLC CVBCS Operates as a transformational healthcare company
naviHealth CVBCS Provide data-driven clinical decision-support solutions to the post-acute healthcare markets
NaviNet TRM Healthcare communications network
Netsmart Technologies, Inc. CSS Supply software solutions to health and human services providers and payers
NextGen CSS Provide software programs and solutions to healthcare clients
Omada Health WID Provide diabetes and obesity prevention programs online
OneHealth WID Online community dedicated to helping people in recovery from addiction
Oscar CVBCS Engages in the provision of health insurance services
139
HEALTHCARE IT & DISTRIBUTION February 23, 2016

Company Name Designation Description
Par8o CSS EMR-agnostic platform that creates a common point for coordinating care delivery and plan design
Passport Health Communications
CSS Engages in the provision of software and solutions to help hospitals and healthcare providers improve business operations and secure payment services
PatientKeeper, Inc. CSS Provide healthcare applications for physicians
PatientPing TRM Connect healthcare providers across the country through real-time notifications whenever and wherever their patients receive care
PatientSafe Solutions, Inc. TRM Provide wireless workflow optimization and patient safety solutions
PatientsLikeMe CVBCS Operate online health communities for patients
PayFlex CSS Provide employee benefits administration products and services
Pebble Technology Corp. WID Engages in the manufacture and development of smart watches
Phreesia, Inc. WID Provide patient check-in solutions for medical practices
PHT CVBCS Design and develop software applications that collect patient data for clinical research
Phytel, Inc. CSS Provide population health management software solutions
PillPack WID Sort and deliver medications in personalized packets
PokitDok, Inc. CVBCS Operates a health and wellness website
Posit Sciences Corp. WID Provides interactive computer-based programs designed to improve brain fitness and function.
Practice Fusion, Inc. CSS Provide web-based electronic medical record systems
Precyse Solutions CVBCS Engages in the provision of health information management (HIM) services and technologies
Predilytics CVBCS Engages in the provision of advanced healthcare analytic solutions
Preventice, Inc. WID Develop mobile health applications
Privia Health TRM Provide healthcare services
Proteus Digital Health WID Develop medicine products and therapeutic devices
QPID Health CSS Provide health record acceleration software and intelligence solutions
QuadraMed Corp. CVBCS Provide information technology solutions for healthcare organizations
QuantiaMD CVBCS Engages in the development of interactive communication networks and provides integrated end-to-end security
Reciprocal Labs. Corp. (Asthmapolis)
WID Develop mobile platforms for respiratory health management
Recondo Technology CSS Develop and distribute software and cloud computing solutions to the healthcare industry
RedBrick Health CVBCS Provide health engagement and behavior change technology solutions that helps organizations reinvigorate their health and wellness programs
Reflexion Health, Inc. CSS Develop software for healthcare services
RemitDATA CSS Sell web-based services to assist health care providers with reimbursement and productivity
Rise Health TRM Provide healthcare services
RxAnte CVBCS Provide solutions for driving medication adherence
Santa Rosa CVBCS Provide management consulting and information technology services to the healthcare industry
SAS CSS Engage in the provision of business analytics software and services
SBR Health TRM Provide video-based solutions that enable the creation of Virtual Healthcare Delivery Networks
SCIO Health Analytics CSS Provide health analytics services for healthcare organizations
SeeChange Health TRM Provide healthcare software and payment solutions
Segterra, Inc. WID Engage in the development and marketing of a health and fitness analytics platform
Sermo CVBCS Operates an online physician community
Shareable Ink TRM Provide clinical documentation and analytics solutions
Sharecare CVBCS Provide healthcare information services
Silverlink Communications CVBCS Provide engagement management solutions for healthcare organizations
Sotera Wireless, Inc. WID Develop medical devices
Sound Inpatient Physicians CVBCS Hospitalist organization
SSI Group, Inc. CSS Provide healthcare payment processing services and electronic data interchange software to hospitals
Stanson Health TRM Provide real-time data analytics to influence provider decisions
140
HEALTHCARE IT & DISTRIBUTION February 23, 2016

Company Name Designation Description
Sunless, Inc. WID Provide sunless tanning products and services
TelCare WID Develop cellular-enabled blood glucose meter for diabetes patients
Teletracking Technologies, Inc.
TRM Develop products and services that automate patient flow
Ten 250 Corp. (SimplyInsured)
CVBCS Provides an online platform to purchase small business health insurance
Theranos, Inc. CVBCS Develop bio monitoring and clinical laboratory test services
TriZetto Corp. CVBCS Provide information technology solutions
Truven Health Analytics CVBCS Engage in the provision of unbiased information, analytic tools, benchmarks, and services for healthcare professionals
T-System, Inc. CSS Provide SaaS programs for emergency medicine physicians
Valence Health CVBCS Provide clinical integration and health plan services
Virtual Radiologic Corp. TRM Provide teleradiology services
Vitals.com CVBCS Provide online tools and mobile applications that enable healthcare consumers to make informed decisions about both the quality and cost of their medical care
Vivify Health TRM Provide a cloud based platform that manages patients in a post-acute setting
WaveMark, Inc. TRM Provide supply chain management services to healthcare providers and healthcare suppliers
Wellbe, Inc. CVBCS Work with health providers to engage patients as partners in their treatments
WellDoc CVBCS Develop technology solutions to support chronic disease management
Welltok TRM Design and develop consumer engagement and behavior modification solutions for the healthcare industry
Wescom Solutions, Inc. (PointClickCare)
CSS Provide electronic health records and business office software for the long-term care industry
WiserCare CVBCS Operates as a healthcare information technology company that offers a web-based decision support system for patients and doctors
Withings WID Create smart products and apps for health and wellness
ZeOmega CVBCS Provide population health management solutions
Zephyr Health CVBCS Engages in the provision of data information for health companies
Zillion Group, Inc. (HealthFleet)
CSS Cloud computing company dedicated to the design and delivery of healthcare applications, services, and facilitating technologies
Zipnosis TRM Provides a technology that allows patients to get diagnosed and treated for common medical conditions online
Zirmed CSS Provide web-based revenue cycle management solutions for the healthcare business
ZocDoc CVBCS Provide online services for patients to find and schedule doctor appointments
Zynx Health CSS Design and develop support software for health care organizations
Source: Bloomberg, FactSet, Leerink Partners LLC, LinkedIn, Aug. 2015
141
HEALTHCARE IT & DISTRIBUTION February 23, 2016

Appendix A: Selected Public Company Snapshots Index
Accretive Health, Inc.
The Advisory Board Company, Inc.
Allscripts Healthcare Solutions, Inc.
athenahealth, Inc.
Benefitfocus, Inc.
BioTelemetry, Inc.
Care.com, Inc.
Castlight Health, Inc.
Cerner Corp.
Computer Programs and Systems, Inc.
Connecture, Inc.
Craneware
DexCom, Inc.
eHealth, Inc.
Everyday Health, Inc.
Fitbit, Inc.
Garmin Ltd.
HealthEquity, Inc.
HealthStream, Inc.
Healthways, Inc.
Health Insurance Innovations
HMS Holdings Corp.
Imprivata, Inc.
IMS Health Holdings, Inc.
Inovalon Holdings, Inc.
Insulet Corporation
Intuitive Surgical
Invitae
LifeWatch AG
Mazor Robotics Ltd.
Medical Transcription Billing Corp.
Medidata Solutions, Inc.
Nuance Communications, Inc.
Omnicell, Inc.
Quality Systems, Inc.
SHL Telemedicine Ltd.
Spok Holdings, Inc.
Streamline Health Solutions, Inc.
Tandem Diabetes Care, Inc.
Veeva Systems, Inc.
Vocera Communications, Inc.
WageWorks, Inc.
WebMD Health Corp.
Weight Watchers International, Inc.
142
HEALTHCARE IT & DISTRIBUTION February 23, 2016

Accretive Health, Inc. 401 North Michigan Avenue, Suite 2700, Chicago, IL 60611 Phone: 1-312-324-7820 Website: www.accretivehealth.com Sources: Company website, FactSet, Google Finance, News
ATCMKTS: ACHI - $2.71
Market Cap - $280.18M
(FactSet 2/17/16)
Financial Performance
Company Description Accretive Health, Inc. is a healthcare company, which provides revenue cycle management services for hospitals and healthcare providers. It offers revenue cycle management services to manage their revenue cycles which encompass patient registration, insurance and benefit verification, medical treatment documentation and coding and bill preparation and collection from patients and third-party payers. Accretive Health was founded by Mary Ann Tolan and J. Michael Cline in July 2003 and is headquartered in Chicago, IL.
Stock Performance
Key Competitors
athenahealth
Cerner
Huron Consulting Group
MedAssets
Quality Systems
ACHI DEC. '17 DEC. '16 DEC. '15 DEC. '14
365 Days 365 Days 365 Days 365 Days
Sales 592.1$ 306.4$ 229.1$ 233.6$
Gross Income 153.1$ 88.5$ 72.5$ 63.4$
EBIT 48.8$ 15.1$ 11.9$ 1.7$
EBITDA - 21.5$ 7.6$ 7.8$
Net Income (72.2)$ 2.0$ (80.0)$ (79.6)$
USD($) in millions
143
HEALTHCARE IT & DISTRIBUTION February 23, 2016

The Advisory Board Company, Inc. 2445 M Street Northwest, Washington D.C. Phone: 1-202-266-5000 Website: www.advisory.com Sources: Company website, FactSet, Google Finance, News
NASDAQ: ABCO - $39.82
Market Cap - $1.7B
(FactSet 2/17/16)
Financial Performance
Company Description The Advisory Board Co. engages in insight-driven performance improvement software and solutions to the healthcare and higher education industries. It provides practices research and insight, performance technology software, consulting and management services, and data- and tech-enabled services through discrete programs to hospitals, health systems, pharmaceutical and biotechnology companies, health care insurers, medical device companies, colleges, universities, other health care-focused organizations and educational institutions. The company was founded by David G. Bradley in 1979 and is headquartered in Washington, DC.
Stock Performance
Key Competitors
Accenture
Huron Consulting Group
IMS Health
MedAssets
Navigant Consulting
ABCO DEC. '17 DEC. '16 DEC. '15 DEC. '14
365 Days 365 Days 365 Days 365 Days
Sales 1,017.3$ 892.9$ 780.4$ 574.2$
Gross Income 521.6$ 451.3$ 388.4$ 279.3$
EBIT 128.3$ 85.3$ 55.0$ 33.9$
EBITDA 234.1$ 200.4$ 171.8$ 97.6$
Net Income 86.4$ 66.2$ 57.3$ 49.1$
USD($) in millions
144
HEALTHCARE IT & DISTRIBUTION February 23, 2016

Allscripts Healthcare Solutions, Inc. 222 Merchandise Mart Plaza, Suite 2024, Chicago, IL 60654 Phone: 1-312-506-1200 Website: www.allscripts.com Sources: Company website, FactSet, Google Finance, News
NASDAQ: MDRX - $12.77
Market Cap - $2.4B
(FactSet 2/17/16)
Financial Performance
Company Description Allscripts Healthcare Solutions, Inc. provides clinical, financial, connectivity and information solutions and related professional services to hospitals, physicians and post-acute organizations, such as nursing homes. It delivers innovative solutions that provide healthcare professionals with the information, insights and connectivity required to transform healthcare by improving the quality and efficiency of patient care. The company operates its business through five reportable segments: software delivery, services delivery, client support, pathway solutions and information technology outsourcing. Allscripts Healthcare Solutions was founded in 1986 and is headquartered in Chicago, IL.
Stock Performance
Key Competitors
athenahealth
Cerner
Constellation Software
McKesson
Quality Systems
MDRX DEC. '17 DEC. '16 DEC. '15 DEC. '14
365 Days 365 Days 365 Days 365 Days
Sales 1,517.6$ 1,444.6$ 1,386.4$ 1,389.5$
Gross Income 696.2$ 649.3$ 612.9$ 585.7$
EBIT 190.2$ 156.0$ 116.7$ 105.5$
EBITDA 310.7$ 279.7$ 242.6$ 198.4$
Net Income 122.5$ 103.0$ 88.0$ 56.3$
USD($) in millions
145
HEALTHCARE IT & DISTRIBUTION February 23, 2016

athenahealth, Inc. 311 Arsenal Street, Watertown, MA 02472 Phone: 1-617-402-1000 Website: www.athenahealth.com Sources: Company website, FactSet, Google Finance, News
NASDAQ: ATHN - $130.17
Market Cap - $5.1B
(FactSet 2/17/16)
Financial Performance
Company Description athenahealth, Inc. provides cloud-based business services company, which provides ongoing billing, clinical-related, and other related services to customers. The company also offers, practice management, and electronic health record services. Its service offerings are based on proprietary web-native practice management and electronic health record software, which offer payer knowledge-base and integrated back-office service operations and care coordination services. Its cloud-based software offers four integrated offerings through athenaNet: athenaCollector for revenue cycle management; athenaClinicals for clinical cycle management; athenaCommunicator for patient cycle management; and athenaCoordinator for referral cycle management. Athenahealth was founded on August 21, 1997, by Jonathan S. Bush and Todd Y. Park and is headquartered in Watertown, MA.
Stock Performance
Key Competitors
Allscripts Healthcare Solutions
Cerner
Quality Systems
UnitedHealth Group
WebMD Health
DEC. '17 DEC. '16 DEC. '15 DEC. '14
365 Days 365 Days 365 Days 365 Days
Sales 1,327.0$ 1,109.0$ 925.0$ 753.0$
Gross Income 858.0$ 711.0$ 587.0$ 474.0$
EBIT 162.0$ 124.0$ 95.0$ 87.0$
EBITDA 281.0$ 228.0$ 184.0$ 150.0$
Net Income 36.0$ 17.0$ 14.0$ (3.0)$
USD($) in millions
146
HEALTHCARE IT & DISTRIBUTION February 23, 2016

Benefitfocus, Inc. 100 Benefitfocus Way, Charleston, SC 29492 Phone: 1-843-849-7476 Website: www.benefitfocus.com Sources: Company website, FactSet, Google Finance, News
NASDAQ: BNFT - $26.95
Market Cap - $781M
(FactSet 2/17/16)
Financial Performance
Company Description Benefitfocus, Inc. is a provider of cloud-based benefits software solutions for consumers, employers, insurance carriers and brokers delivered under a software-as-a-service (SaaS) model. The company operates through two segments: Employer and Carrier. The Employer segment provides products and services for employers, which include HR InTouch, HR InTouch Marketplace, Benefit Informatics, HR Support Center, implementation services, media and animation services, app development platform and software-enabled services. The Carrier segment provides products and services for insurance carriers, which include eEnrollment, eBilling, eExchange, eSales, eDirect, Marketplace, Benefit Informatics, implementation services, media and animation services, app development platform and software-enabled services. Benefitfocus was founded by Mason R. Holland and Shawn A. Jenkins in June 2000 and is headquartered in Charleston, SC.
Stock Performance
Key Competitors
DST Systems
Ebix
McKesson
Paychex
Towers Watson
DEC. '17 DEC. '16 DEC. '15 DEC. '14
365 Days 365 Days 365 Days 365 Days
Sales 277.2$ 228.9$ 182.6$ 137.4$
Gross Income 144.9$ 109.2$ 82.4$ 51.2$
EBIT (24.3)$ (42.5)$ (49.4)$ (52.3)$
EBITDA (3.1)$ (24.6)$ (36.4)$ (43.8)$
Net Income (38.0)$ (56.0)$ (63.5)$ (63.2)$
USD($) in millions
147
HEALTHCARE IT & DISTRIBUTION February 23, 2016

BioTelemetry, Inc. 1000 Cedar Hollow Road, Suite 102, Mavern, PA 19355 Phone: 1-610-729-7000 Website: www.biotelinc.com Sources: Company website, FactSet, Google Finance, News
NASDAQ: BEAT - $10.01
Market Cap - $272M
(FactSet 2/17/16)
Financial Performance
Company Description BioTelemetry, Inc. operates as a wireless medical technology company, which focuses on the delivery of health information. The company provides cardiac monitoring services, original equipment manufacturing with a primary focus on cardiac monitoring devices and centralized cardiac core laboratory services. It operates through three segments: Patient Services, Product and Research Services. The Patient Services segment focuses on the diagnosis and monitoring of cardiac arrhythmias or heart rhythm disorders, through its mobile cardiac outpatient telemetry event and holter services. The Product segment focuses on the development, manufacturing, testing and marketing of medical devices to healthcare companies, clinics and hospitals. The Research Services segment focuses on providing cardiac safety monitoring services for drug and medical devices trials in a research environment. The company was founded on April 22, 2013, and is headquartered in Malvern, PA.
Stock Performance
Key Competitors
Coltene Holding
PhotoMedex
Shofu
St Shine Optical
ZELTIQ Aesthetics
BEAT DEC. '17 DEC. '16 DEC. '15 DEC. '14
365 Days 365 Days 365 Days 365 Days
Sales 215.5$ 196.8$ 178.5$ 166.6$
Gross Income 133.8$ 119.9$ 106.6$ 93.4$
EBIT 27.0$ 19.8$ 12.5$ (2.3)$
EBITDA 47.9$ 40.1$ 33.0$ 19.5$
Net Income 21.6$ 15.2$ 7.4$ (9.8)$
USD($) in millions
148
HEALTHCARE IT & DISTRIBUTION February 23, 2016

Care.com, Inc. 77 Fourth Avenue, Suite 500, Waltham, MA 02451 Phone: 1-781-642-5900 Website: www.care.com Sources: Company website, FactSet, Google Finance, News
NYSE: CRCM - $5.30
Market Cap - $170M
(FactSet 2/17/16)
Financial Performance
Company Description Care.com, Inc. operates as an online care destination, which enables people to connect to family care services. It help families address their particular lifecycle of care needs, which includes child care, senior care, special needs care and other non-medical family care needs such as pet care, tutoring and housekeeping. The company through its subsidiary, Breedlove & Associates, LLC, offers household payroll, tax and compliance services to its customers to manage their household payroll. Care.com was founded by Sheila Lirio Marcelo, Dave Krupinski, Donna Levin and Zenobia Moochhala on October 27, 2006, and is headquartered in Waltham, MA.
Stock Performance
Key Competitors
Bright Horizons Family
Monster Worldwide
RealPage
Yahoo!
DEC. '17 DEC. '16 DEC. '15 DEC. '14
365 Days 365 Days 365 Days 365 Days
Preliminary Final Final Final
Sales 195.8$ 162.8$ 148.3$ 116.7$
Gross Income 149.5$ 123.4$ 109.8$ 86.4$
EBIT 2.8$ (9.5)$ (29.5)$ (77.2)$
EBITDA 11.5$ 1.6$ (10.3)$ (24.4)$
Net Income 0.2$ (11.2)$ (33.6)$ (80.3)$
USD($) in millions
149
HEALTHCARE IT & DISTRIBUTION February 23, 2016

Castlight Health, Inc. 121 Spear Street, Two Rincon Center, San Francisco, CA 94105 Phone: 1-415-829-1400 Website: www.castlighthealth.com Sources: Company website, FactSet, Google Finance, News
NYSE: CSLT - $3.21
Market Cap - $305M
(FactSet 2/17/16)
Financial Performance
Company Description Castlight Health, Inc. provides healthcare information technology solutions. The company operates its business through single segment, cloud applications, which allows its customers to conquer the complexity of the existing health care system by providing personalized, actionable information to their employees, implementing technology-enabled benefit designs and integrating disparate systems and applications. Castlight Health was founded by Todd Y. Park, Bryan E. Roberts and Giovanni M. Colella in January 2008 and is headquartered in San Francisco, CA.
Stock Performance
Key Competitors
Aetna
Anthem
CIGNA
Medidata Solutions
Merge Healthcare (IBM)
CSLT DEC. '17 DEC. '16 DEC. '15 DEC. '14
365 Days 365 Days 365 Days 365 Days
Sales 132.8$ 100.5$ 75.3$ 45.6$
Gross Income 88.0$ 62.1$ 43.7$ 19.2$
EBIT (27.7)$ (51.0)$ (64.5)$ (71.7)$
EBITDA (19.5)$ (45.4)$ (61.6)$ (72.5)$
Net Income (35.4)$ (57.5)$ (79.9)$ (85.9)$
USD($) in millions
150
HEALTHCARE IT & DISTRIBUTION February 23, 2016

Cerner Corporation 2800 Rockcreek Parkway, Suite 601, North Kansas City, MO 64117 Phone: 1-816-221-1024 Website: www.cerner.com Sources: Company website, FactSet, Google Finance, News
NASDAQ: CERN - $51.97
Market Cap - $17.78B
(FactSet 2/17/16)
Financial Performance
Company Description Cerner Corp. designs, develops, markets, installs, hosts and supports health care information technology, health care devices, hardware and content solutions for health care organizations and consumers. It also provides a wide range of value-added services, including implementation and training, remote hosting, operational management services, revenue cycle services, support and maintenance, health care data analysis, clinical process optimization, transaction processing, employer health centers, employee wellness programs and third party administrator services for employer-based health plans. The company operates its business through two segments: Domestic and Global. The Domestic segment includes revenue contributions and expenditures associated with business activity in the United States. The Global segment includes revenue contributions and expenditures linked to business activity in Argentina, Aruba, Australia, Austria, Canada, Cayman Islands, Chile, China, Egypt, England, France, Germany, Guam, India, Ireland, Italy, Japan, Malaysia, Mexico, Morocco, Puerto Rico, Qatar, Saudi Arabia, Singapore, Spain, Sweden, Switzerland and the United Arab Emirates. Cerner was founded by Neal L. Patterson, Clifford W. Illig and Paul N. Gorup in 1979 and is headquartered in North Kansas City, MO.
Stock Performance
Key Competitors
Allscripts Healthcare Solutions
athenahealth
McKesson
Omnicell
Quality Systems
cern DEC. '17 DEC. '16 DEC. '15 DEC. '14
365 Days 365 Days 365 Days 365 Days
Sales 5,510.5$ 4,980.9$ 4,425.3$ 3,402.7$
Gross Income 4,583.5$ 4,126.2$ 3,671.3$ 2,798.3$
EBIT 1,290.6$ 1,097.9$ 1,028.8$ 767.0$
EBITDA 1,898.4$ 1,707.7$ 1,457.3$ 1,122.8$
Net Income 932.3$ 816.0$ 741.1$ 576.4$
USD($) in millions
151
HEALTHCARE IT & DISTRIBUTION February 23, 2016

Connecture, Inc. 18500 West Corporate Drive, Suite 250, Brookfield, WI 53045 Phone: 1-262-432-8282 Website: www.connecture.com Sources: Company website, FactSet, Google Finance, News
NASDAQ: CNXR - $2.83
Market Cap - $61.9M
(FactSet 2/17/16)
Financial Performance
Company Description Connecture, Inc. operates as a web-based consumer shopping, enrollment and retention platform for health insurance distribution. Its solutions support the industry evolution towards a consumer-centric experience that is transforming how health insurance is purchased and distributed. The company offers a personalized health insurance shopping experience that recommends the insurance plan based on an individual's preferences, health status, preferred providers, medications and expected out-of-pocket costs. Connecture was founded on July 30, 1999, and is headquartered in Brookfield, WI.
Stock Performance
Key Competitors
Acotel Group
Himacs
Jiangsu Nadasoft Technology Co. Ltd.
RIB Software
ThreePro
DEC. '17 DEC. '16 DEC. '15 DEC. '14
365 Days 365 Days 365 Days 365 Days
Sales 136.2$ 114.3$ 97.1$ 84.6$
Gross Income 69.8$ 55.9$ 46.2$ 32.2$
EBIT 15.1$ 6.8$ 0.8$ (4.3)$
EBITDA 25.0$ 15.4$ 8.8$ 1.3$
Net Income 10.4$ 0.9$ (5.8)$ (10.2)$
USD($) in millions
152
HEALTHCARE IT & DISTRIBUTION February 23, 2016

Computer Programs and Systems, Inc. 6600 Wall Street, Mobile, AL 36695 Phone: 1-251-639-8100 Website: www.cpsi.com Sources: Company website, FactSet, Google Finance, News
NASDAQ: CPSI - $55.31
Market Cap - $625.38M
(FactSet 2/17/16)
Financial Performance
Company Description Computer Programs & Systems, Inc. operates as a healthcare information technology company that designs, develops, markets, installs and supports computerized information technology systems. The Company provides integrated basis, enterprise-wide clinical management, access management, patient financial management, health information management, strategic decision support, resource planning management and enterprise application integration solutions to healthcare organizations throughout the United States. Its wholly owned subsidiary, TruBridge LLC, focuses exclusively on providing business office, consulting and managed IT services to rural and community healthcare organizations, regardless of their IT vendor. Computer Programs & Systems was founded by Michael Kenny Muscat Sr. in 1979 and is headquartered in Mobile, AL.
Stock Performance
Key Competitors
athenahealh
Cerner
McKesson
Streamline Health Solutions, Inc.
Quality Systems
DEC. '17 DEC. '16 DEC. '15 DEC. '14
365 Days 365 Days 365 Days 365 Days
Sales 332.2$ 304.4$ 182.2$ 204.7$
Gross Income 132.9$ 126.1$ 74.1$ 94.0$
EBIT 71.7$ 62.9$ 25.1$ 49.6$
EBITDA 94.1$ 81.9$ 38.6$ 53.2$
Net Income 44.5$ 38.3$ 18.0$ 32.4$
USD($) in millions
153
HEALTHCARE IT & DISTRIBUTION February 23, 2016

Craneware Plc 1 Tanfield, Edingburgh, Scotland, EH3 5DA, United Kingdom Phone: +44-131-550-3100 Website: www.craneware.com Sources: Company website, FactSet, Google Finance, News
London Alt: CRW - £7.60
Market Cap - £203.93M
(FactSet 2/17/16)
Financial Performance
Company Description Craneware Plc is engaged in the development, licensing and ongoing support of computer software for the U.S. healthcare industry. The company's software-as-a-service solutions help hospitals and other healthcare providers more effectively price, charge, code and retain earned revenue for patient care services and supplies. It offers revenue cycle, access management & strategic pricing, supply management, audit & revenue recovery and professional services. The company was founded by William Gordon Craig and Keith Neith in May 1999 and is headquartered in Edinburgh, the United Kingdom.
Stock Performance
Key Competitors
MedAssets
JUN. '17 JUN. '16 JUN. '15 JUN. '14
365 Days 365 Days 365 Days 365 Days
Sales 39.0 35.2 30.4 27.3
Gross Income 38.3 34.5 - -
EBIT 11.3 10.1 9.0 7.6
EBITDA 12.3 11.1 9.8 8.3
Net Income 8.2 7.3 6.4 5.8
Thousands of British Pounds
154
HEALTHCARE IT & DISTRIBUTION February 23, 2016

DexCom, Inc. 6340 Sequence Drive, San Diego, CA 92121 Phone: 1-858-200-0200 Website: www.dexcom.com Sources: Company website, FactSet, Google Finance, News
NASDAQ: DXCM - $61.19
Market Cap - $4.98B
(FactSet 2/17/16)
Financial Performance
Company Description DexCom, Inc. is a medical device manufacturing company. The company is focused on the design, development and commercialization of continuous glucose monitoring systems for ambulatory use by people with diabetes and for use by healthcare providers in the hospital for the treatment of both diabetic and non-diabetic patients. The company was founded by John F. Burd in May 1999 and is headquartered in San Diego, CA.
Stock Performance
Key Competitors
Echo Therapeutics
Johnson & Johnson
Medtronic Plc
PositiveID
dxcm DEC. '17 DEC. '16 DEC. '15 DEC. '14
365 Days 365 Days 365 Days 365 Days
Sales 757.5$ 551.1$ 395.2$ 259.2$
Gross Income 516.7$ 383.1$ 274.8$ 176.3$
EBIT 44.5$ (2.8)$ (25.3)$ (21.5)$
EBITDA 59.8$ 15.4$ (27.9)$ (17.9)$
Net Income 41.3$ (4.0)$ (23.2)$ (22.4)$
USD($) in millions
155
HEALTHCARE IT & DISTRIBUTION February 23, 2016

eHealth, Inc. 440 East Middlefield Road, Mountain View, CA 94043 Phone: 1-650-584-2700 Website: www.ehealthinsurance.com Sources: Company website, FactSet, Google Finance, News
NASDAQ: EHTH - $10.47
Market Cap - $190M
(FactSet 2/17/16)
Financial Performance
Company Description eHealth, Inc. offers Internet-based health insurance agency services for individuals, families and small businesses. It also offers online sponsorship and advertising and technology licensing. The company's ecommerce platform enables individuals, families and small businesses to research, analyze, compare and purchase health insurance products. eHealth was founded by Vipool Mohanlal Patel in November 1997 and is headquartered in Mountain View, CA.
Stock Performance
Key Competitors
Aon
Donegal Group
Ebix
Health Insurance Innovations, Inc.
Internet Patents
EHTH DEC. '17 DEC. '16 DEC. '15 DEC. '14
365 Days 365 Days 365 Days 365 Days
Sales 209.7$ 191.5$ 181.0$ 179.7$
Gross Income 193.8$ 184.7$ 175.2$ 175.2$
EBIT 5.9$ 2.9$ (7.3)$ (6.8)$
EBITDA 20.9$ 15.1$ 8.9$ 3.7$
Net Income 3.5$ 2.5$ (2.0)$ (16.2)$
USD($) in millions
156
HEALTHCARE IT & DISTRIBUTION February 23, 2016

Everyday Health, Inc. 345 Hudson Street, 16
th Floor, New York, NY 10014
Phone: 1-646-728-9500 Website: www.corporate.everydayhealth.com Sources: Company website, FactSet, Google Finance, News
NASDAQ: EVDY - $4.50
Market Cap - $145.65M
(FactSet 2/17/16)
Financial Performance
Company Description Everyday Health, Inc. provides digital health and wellness solutions. It also provides consumers, healthcare professionals and brands with content and advertising-based services across a broad portfolio of websites that span the health spectrum-from lifestyle offerings in pregnancy, diet and fitness to in-depth medical content for condition prevention and management. The company was founded in January 2002 by Gregory Stuart Cohn, Benjamin Wolin and Michael Keriakos and is headquartered in New York, NY.
Stock Performance
Key Competitors
Ebix
eDiets.com
HealthStream
WebMD Health
Yahoo!
DEC. '17 DEC. '16 DEC. '15 DEC. '14
365 Days 365 Days 365 Days 365 Days
Sales 288.2$ 257.7$ 226.4$ 184.3$
Gross Income 214.9$ 191.0$ 164.1$ 135.0$
EBIT 23.9$ 16.4$ 2.2$ 11.8$
EBITDA 59.9$ 52.0$ 45.9$ 36.0$
Net Income 16.2$ 9.0$ (6.8)$ (4.6)$
USD($) in millions
157
HEALTHCARE IT & DISTRIBUTION February 23, 2016

Fitbit, Inc. 405 Howard Street, San Francisco, CA 94105 Website: www.fitbit.com Sources: Company website, FactSet, Google Finance, News
NASDAQ: FIT - $16.10
Market Cap - $3.33B
(FactSet 2/17/16)
Financial Performance
Company Description Fitbit, Inc. is engaged in the development of a wearable device that tracks data of an individual's health. It offers products that can track a person's activities, such as calories burned, sleep quality, steps, and distance. The data collected allows an individual to monitor their progress towards their own personal goals. The company was founded by Eric Friedman & James Park in 2007 and is headquartered in San Francisco, CA.
Stock Performance
Key Competitors
Apple
Garmin
Microsoft
Samsung Electronics
fit DEC. '17 DEC. '16 DEC. '15 DEC. '14
365 Days 365 Days 365 Days 365 Days
Sales 2,998.2$ 2,410.9$ 1,796.5$ 749.1$
Gross Income 1,471.4$ 1,164.8$ 865.6$ 372.3$
EBIT 581.6$ 447.7$ 351.0$ 170.3$
EBITDA 606.1$ 461.4$ 360.1$ 191.0$
Net Income 389.2$ 292.3$ 229.7$ 125.1$
USD($) in millions
158
HEALTHCARE IT & DISTRIBUTION February 23, 2016

Garmin Ltd. Mühlentalstrasse 2, Schaffhausen, Schaffhausen 8200, Switzerland Phone: +41.52.630.16.00 Website: www.garmin.com Sources: Company website, FactSet, Bloomberg, News
NASDAQ: GRMN - $39.88
Market Cap - $7.6B
(FactSet 2/17/16)
Financial Performance
Company Description Garmin Ltd. provides navigation, communication, and information devices and application that are enabled by global positioning system technology. The company operates through the five segments: Automotive and Mobile, Aviation, Marine, Outdoor and Fitness. The Fitness segment offers weight training assistants for athletes with integrated GPS sensor, Garmin connect mobile application and Garmin Swim. The company's inception roots back to its predecessor, Garmin Ltd., a Cayman Islands company that was incorporated on July 24, 2000. The company was founded on February 9, 2010, and is headquartered in Schaffhausen, Switzerland.
Stock Performance
Key Competitors
FLIR Systems
Johnson Outdoors
MiTAC International Corp.
Rockwell Collins
TomTom
GRMN DEC. '17 DEC. '16 DEC. '15 DEC. '14
365 Days 365 Days 365 Days 365 Days
Sales 2,818.2$ 2,812.4$ 2,820.3$ 2,870.7$
Gross Income 1,539.2$ 1,528.5$ 1,538.7$ 1,604.4$
EBIT 518.9$ 510.8$ 549.6$ 690.7$
EBITDA 622.9$ 600.8$ 641.9$ 780.7$
Net Income 437.7$ 427.8$ 456.2$ 364.2$
USD($) in millions
159
HEALTHCARE IT & DISTRIBUTION February 23, 2016

HealthEquity, Inc. 15 West Scenic Pointe Drive, Suite 100, Draper, UT 84020 Phone: 1-877-694-3942 Website: www.healthequity.com Sources: Company website, FactSet, Google Finance, News
NASDAQ: HQY - $19.12
Market Cap - $1.08B
(FactSet 2/17/16)
Financial Performance
Company Description HealthEquity, Inc. offers a full range of solutions for managing health care accounts (health savings accounts, health reimbursement arrangements, and flexible spending accounts) for health plans, insurance companies and third-party administrators. Its platform provides an ecosystem where consumers can access their tax-advantaged healthcare savings, compare treatment options and pricing, evaluate and pay healthcare bills, receive personalized benefit and clinical information, earn wellness incentives and make educated investment choices to grow their tax-advantaged healthcare savings. HealthEquity was founded by Stephen D. Neeleman on September 18, 2002, and is headquartered in Draper, UT.
Stock Performance
Key Competitors
Aetna
Fidelity National Information Services, Inc.
JPMorgan Chase
Webster Financial
Xerox Corp.
JAN. '17 JAN. '16 JAN '15 JAN. '14
365 Days 365 Days 365 Days 365 Days
Sales 212.6$ 172.2$ 125.7$ 87.9$
Gross Income 124.7$ 100.4$ 72.6$ 48.0$
EBIT 56.8$ 40.2$ 26.0$ 16.9$
EBITDA 72.6$ 56.2$ 38.8$ 25.2$
Net Income 32.6$ 24.0$ 15.5$ 10.9$
USD($) in millions
160
HEALTHCARE IT & DISTRIBUTION February 23, 2016

HealthStream, Inc. 209 10
th Avenue South, Suite 450, Nashville, TN 37203
Phone: 1-615-301-3100 Website: www.healthstream.com Sources: Company website, FactSet, Google Finance, News
NASDAQ: HSTM - $22.36
Market Cap - $707.61M
(FactSet 2/17/16)
Financial Performance
Company Description HealthStream, Inc. provides SaaS-based workforce development solutions and research/patient experience solutions for healthcare organizations--all designed to assess and develop the people that deliver patient care which, in turn, supports the improvement of business and clinical outcomes. The company operates through two segments: HealthStream Workforce Development Solutions and HealthStream Research/Patient Experience Solutions. The HealthStream Workforce Development Solutions segment provides training, assessment, and education content together with administrative and management tools through HLC. It products consist of Internet-based services and solutions to meet the ongoing training, certification, and development needs of the healthcare community. These solutions provide, deliver and track computer based education for customers in the United States through software as a service model. The HealthStream Research/Patient Experience Solutions segment products offer healthcare organizations a wide range of quality and satisfaction surveys, analyses of survey results, and other research-based services. HealthStream was founded by Robert A. Frist, Jr. and Jeffery L. Mclaren in 1990 and is headquartered in Nashville, TN.
Stock Performance
Key Competitors
Cornerstone OnDemand
Huron Consulting Group
National Research Corporation
Press Ganey Holdings
Saba Software
HSTM DEC. '17 DEC. '16 DEC. '15 DEC. '14
365 Days 365 Days 365 Days 365 Days
Sales 258.4$ 229.9$ 209.0$ 172.2$
Gross Income 150.6$ 133.9$ 119.8$ 96.5$
EBIT 21.3$ 16.8$ 20.4$ 17.3$
EBITDA 43.4$ 37.1$ 34.3$ 28.7$
Net Income 12.9$ 9.7$ 8.6$ 10.4$
USD($) in millions
161
HEALTHCARE IT & DISTRIBUTION February 23, 2016

Healthways, Inc. 701 Cool Springs Blvd., Franklin, TN 37067 Phone: 1-615-614-4929 Website: www.healthways.com Sources: Company website, FactSet, Google Finance, News
NASDAQ: HWAY - $10.78
Market Cap - $388.32M
(FactSet 2/17/16)
Financial Performance
Company Description Healthways, Inc. provides specialized, comprehensive solutions to help people improve physical, emotional and social well-being, reducing both direct healthcare costs and associated costs from the loss of employee productivity. The company through its Well-Being Improvement Services segment provides specific and personalized interventions for each individual in a population, irrespective of health status, age or payor. Its solutions are designed to keep healthy people healthy, mitigate or eliminate lifestyle risk factors that can lead to disease and optimize care for those with chronic illness. Healthways was founded by Stone E. Robert and Thomas G. Cigarran in 1981 and is headquartered in Franklin, TN.
Stock Performance
Key Competitors
Air Methods
Alere
Comprehensive Care
Magellan Health
WebMD Health
DEC. '17 DEC. '16 DEC. '15 DEC. '14
365 Days 365 Days 365 Days 365 Days
Sales 858.3$ 793.6$ 764.8$ 742.2$
Gross Income 143.8$ 143.6$ 131.1$ 143.9$
EBIT 38.8$ 19.3$ 11.0$ 25.1$
EBITDA 87.6$ 73.8$ 62.0$ 78.5$
Net Income 13.4$ 2.7$ (20.3)$ (5.6)$
USD($) in millions
162
HEALTHCARE IT & DISTRIBUTION February 23, 2016

Health Insurance Innovations 15438 North Florida Avenue, Suite 201, Tampa, FL 33613 Phone: 1-877-376-5831 Website: www.hiiquote.com Sources: Company website, FactSet, Google Finance, News
NASDAQ: HIIQ - $5.70
Market Cap - $44.23M
(FactSet 2/17/16)
Financial Performance
Company Description Health Insurance Innovations, Inc. provides affordable, web-based individual health insurance plans and ancillary products. It is engaged in the sale of 12-month short-term medical or STM, insurance plans, an alternative to traditional individual major medical, or IMM, plans. Its product short-term medical insurance is an alternative to traditional individual major medical plans and generally offers comparable benefits for qualifying individuals. It also offers guaranteed-issue hospital indemnity plans for individuals under the age of 65, which pay fixed cash benefits for covered procedures and services, and a variety of ancillary products such as pharmacy benefit cards, dental plans, vision plans and cancer/critical illness plans that are frequently purchased as supplements to STM and hospital indemnity plans. Health Insurance Innovations was founded by Michael W. Kosloske on October 26, 2012, and is headquartered in Tampa, FL.
Stock Performance
Key Competitors
Aon
eHealth
Internet Patents
HIIQ DEC. '17 DEC. '16 DEC. '15 DEC. '14
365 Days 365 Days 365 Days 365 Days
Sales 158.0$ 123.8$ 99.2$ 88.8$
Gross Income - - - -
EBIT - - - (9.7)$
EBITDA 12.7$ 9.5$ 5.7$ 2.4$
Net Income - 1.3$ 0.8$ (0.3)$
USD($) in millions
163
HEALTHCARE IT & DISTRIBUTION February 23, 2016

HMS Holdings Corp. 5615 High Point Drive, Irving, TX 75038 Phone: 1-214-453-3000 Website: www.hms.com Sources: Company website, FactSet, Google Finance, News
NASDAQ: HMSY - $11.55
Market Cap - $992.97M
(FactSet 2/17/16)
Financial Performance
Company Description HMS Holdings Corp. provides revenue enhancement and recovery services. It provides cost containment services to government and private healthcare payers and sponsors. The company operates through its wholly owned subsidiaries, Health Management Systems, Inc. and HealthDataInsights, Inc. Health Management Systems, Inc. provides services to State Medicaid Agencies, Medicaid Managed Care Plans, Pharmacy Benefits Managers, Child Support Agencies, the Veterans Health Administration, the Centers for Medicare & Medicaid Services, and other public programs. HealthDataInsights, Inc. is a technology-enabled healthcare services company that specializes in the identification and recoupment of claim overpayments to providers. The company serves health and human services programs, commercial insurers, including Medicaid managed care, Medicare advantage, and group health plans; the centers for Medicare & Medicaid services and veterans administration facilities. The company was founded in 1974 and is headquartered in Irving, TX.
Stock Performance
Key Competitors
Accretive Health
CorVel
Performant Financial
PRGX Global
Quality Systems
HMSY DEC. '17 DEC. '16 DEC. '15 DEC. '14
365 Days 365 Days 365 Days 365 Days
Sales 572.0$ 495.3$ 468.3$ 443.2$
Gross Income 183.7$ 147.9$ 143.4$ 130.2$
EBIT 88.0$ 55.9$ 48.2$ 34.2$
EBITDA 153.5$ 120.0$ 112.8$ 101.2$
Net Income 70.6$ 53.4$ 48.2$ 36.2$
USD($) in millions
164
HEALTHCARE IT & DISTRIBUTION February 23, 2016

Imprivata, Inc. 10 Maguire Road, Building 1, Lexington, MA 02421-3120 Phone: 1-781-674-2700 Website: www.imprivata.com Sources: Company website, FactSet, Google Finance, News
NASDAQ: IMPR - $10.54
Market Cap - $263.06M
(FactSet 2/17/16)
Financial Performance
Company Description Imprivata, Inc. provides authentication and access management technology solutions for the healthcare industry. The company's product Imprivata OneSign, is an integrated enterprise single sign-on, authentication management and workflow automation platform that addresses multiple security and productivity challenges faced by hospitals and other healthcare organizations. Its solutions save clinicians time to focus on patient care, increase their productivity and satisfaction, and help healthcare organizations comply with privacy and security regulations. Imprivata was founded by David Ting on May 7, 2001, and is headquartered in Lexington, MA.
Stock Performance
Key Competitors
Authentidate Holding
Aware
Cisco Systems, Inc.
Scrypt
VeriSign
impr DEC. '17 DEC. '16 DEC. '15 DEC. '14
365 Days 365 Days 365 Days 365 Days
Sales 161.0$ 138.5$ 119.1$ 97.0$
Gross Income 112.4$ 95.8$ 81.3$ 67.0$
EBIT (9.5)$ (17.5)$ (18.6)$ (15.0)$
EBITDA (2.9)$ (11.1)$ (12.4)$ (11.5)$
Net Income (11.7)$ (20.0)$ (23.1)$ (19.2)$
USD($) in millions
165
HEALTHCARE IT & DISTRIBUTION February 23, 2016

IMS Health Holdings, Inc. 83 Wooster Heights Road, Danbury, CT 06810 Phone: 1-203-448-4600 Website: www.imshealth.com Sources: Company website, FactSet, Google Finance, News
NYSE: IMS - $25.41
Market Cap - $8.35M
(FactSet 2/17/16)
Financial Performance
Company Description IMS Health Holdings, Inc. operates as a global information and technology services company. It provides clients in the healthcare industry with comprehensive solutions to measure and improve their performance. The company standardizes, organizes, structures and integrates this data by applying its sophisticated analytics and leveraging its global technology infrastructure to help its clients run their organizations more efficiently and make better decisions. It serves key healthcare organizations and decision makers around the world, spanning the breadth of life science companies, including pharmaceutical, biotechnology, consumer health and medical device manufacturers, as well as distributors, providers, payers, government agencies, policymakers, researchers and the financial community. The company was founded on October 23, 2009, and is headquartered in Danbury, CT.
Stock Performance
Key Competitors
Advisory Board
Cegedim SA
GfK SE
Ipsos
PAREXEL
IMS DEC. '17 DEC. '16 DEC. '15 DEC. '14
365 Days 365 Days 365 Days 365 Days
Sales 3,348.0$ 3,163.8$ 2,921.0$ 2,641.0$
Gross Income 1,691.4$ 1,587.1$ 1,476.5$ 1,408.4$
EBIT 642.4$ 569.1$ 374.0$ 208.0$
EBITDA 1,026.5$ 946.2$ 886.0$ 878.0$
Net Income 590.6$ 526.0$ 515.0$ 454.0$
USD($) in millions
166
HEALTHCARE IT & DISTRIBUTION February 23, 2016

Inovalon Holdings, Inc. 4321 Collington Road, Bowie, MD 20716 Phone: 1-301-809-4000 Website: www.inovalon.com Sources: Company website, FactSet, Google Finance, News
NASDAQ: INOV - $18.92
Market Cap - $2.85B
(FactSet 2/17/16)
Financial Performance
Company Description Inovalon Holdings, Inc. operates as a technology company that combines advanced cloud-based data analytics and data-driven intervention platforms to achieve meaningful insight and improvement in clinical and quality outcomes, utilization, and financial performance across the healthcare landscape. Its powerful platform drives high-value impact, improving quality and economics for health plans, hospitals, physicians, patients, pharmaceutical companies, and researchers. Inovalon Holdings was founded on September 11, 2014, and is headquartered in Bowie, MD.
Stock Performance
Key Competitors
DST Systems
IBM
Oracle
SAP
Verisk Analytics
inov DEC. '17 DEC. '16 DEC. '15 DEC. '14
365 Days 365 Days 365 Days 365 Days
Sales 614.7$ 525.8$ 441.4$ 361.5$
Gross Income 407.6$ 349.6$ 295.1$ 248.8$
EBIT 201.5$ 163.0$ 133.6$ 110.1$
EBITDA 228.7$ 186.9$ 153.6$ 133.7$
Net Income 122.4$ 98.8$ 76.4$ 65.4$
USD($) in millions
167
HEALTHCARE IT & DISTRIBUTION February 23, 2016

Insulet Corporation 600 Technology Park Drive, Street 200, Billerica, MA 01821 Phone: 1-978-600-7000 Website: www.myomnipod.com Sources: Company website, FactSet, Google Finance, News
NASDAQ: PODD - $27.50
Market Cap - $1.57B
(FactSet 2/17/16)
Financial Performance
Company Description Insulet Corp. engages in the development, manufacture and marketing of an insulin infusion system for people with insulin-dependent diabetes. Through its OmniPod Insulin Management System, the company seeks to expand the use of insulin pump therapy among people with insulin-dependent diabetes. The OmniPod Insulin Management System is a revolutionary and easy-to-use tubeless insulin pump that features just two parts and fully-automated cannula insertion. The company's current product offering consists of diabetes supplies, including the OmniPod System as well as other diabetes related products and supplies such as blood glucose testing supplies, traditional insulin pumps, pump supplies, and pharmaceuticals. Insulet was founded by John L. Brooks III and John T. Garibotto in July 2000 and is headquartered in Billerica, MA.
Stock Performance
Key Competitors
Eli Lilly
Medtronic Plc
Novo Nordisk
Takeda Pharmaceutical Co. Ltd.
Tandem Diabetes Care
podd DEC. '17 DEC. '16 DEC. '15 DEC. '14
365 Days 365 Days 365 Days 365 Days
Sales 423.6$ 363.7$ 315.5$ 288.7$
Gross Income 225.7$ 187.9$ 151.3$ 143.1$
EBIT (8.4)$ (24.5)$ (49.1)$ (12.2)$
EBITDA 3.8$ (13.9)$ (29.6)$ (0.0)$
Net Income (18.6)$ (35.6)$ (61.6)$ (51.5)$
USD($) in millions
168
HEALTHCARE IT & DISTRIBUTION February 23, 2016

Intuitive Surgical 1266 Kifer Road, Building 101, Sunnyvale, CA 94086-5304 Phone: 1-408-523-2100 Website: www.intuitivesurgical.com Sources: Company website, FactSet, Google Finance, News
NASDAQ: ISRG - $541.49
Market Cap - $20.21B
(FactSet 2/17/16)
Financial Performance
Company Description Intuitive Surgical, Inc. develops, manufactures, and markets da Vinci Surgical Systems and related instruments & accessories for minimally invasive surgery. It also develops and manufactures robotic technologies designed to improve clinical outcomes and help patients return more quickly to active and productive lives. The company was founded by Frederic H. Moll, John Gordon Freund and Robert G. Younge in 1995 and is headquartered in Sunnyvale, CA.
Stock Performance
Key Competitors
Accuray
Hansen Medical
IMRIS
Medtronic Plc
TransEnterix
ISRG DEC. '17 DEC. '16 DEC. '15 DEC. '14
365 Days 365 Days 365 Days 365 Days
Sales 2,859.3$ 2,615.5$ 2,384.4$ 2,131.7$
Gross Income 1,944.8$ 1,772.6$ 1,594.0$ 1,430.1$
EBIT 934.7$ 835.2$ 740.0$ 815.1$
EBITDA 1,024.0$ 926.0$ 822.6$ 641.2$
Net Income 716.1$ 637.0$ 588.8$ 418.8$
USD($) in millions
169
HEALTHCARE IT & DISTRIBUTION February 23, 2016

Invitae Corp. 458 Brannan Street, San Francisco, CA 94107-1713 Phone: 1-415-374-7782 Website: www.invitae.com Sources: Company website, FactSet, Google Finance, News
NYSE: NVTA - $7.07
Market Cap - $225.7M
(FactSet 2/17/16)
Financial Performance
Company Description Invitae Corp. develops genetic diagnostics for hereditary disorders. It offers gene sequencing and deletion/duplication analysis for genetic disorders associated with cancer, cardiology, neurology and pediatrics. The firm is applying advances in genomics to provide clinical genetic solutions for patient, providers, and payer alike. The company was founded by Randal W. Scott and Sean E. George on January 13, 2010, and is headquartered in San Francisco, CA.
Stock Performance
Key Competitors
Bio-Reference Labs
LabCorp
Myriad Genetics
Quest Diagnostics
nvta DEC. '17 DEC. '16 DEC. '15 DEC. '14
365 Days 365 Days 365 Days 365 Days
Sales 77.0$ 34.5$ 8.4$ 1.6$
Gross Income 23.3$ (0.0)$ (8.1)$ (4.0)$
EBIT (68.9)$ (88.8)$ (89.3)$ (47.5)$
EBITDA (60.9)$ (82.6)$ (84.8)$ (30.3)$
Net Income (69.2)$ (88.9)$ (89.8)$ (47.7)$
USD($) in millions
170
HEALTHCARE IT & DISTRIBUTION February 23, 2016
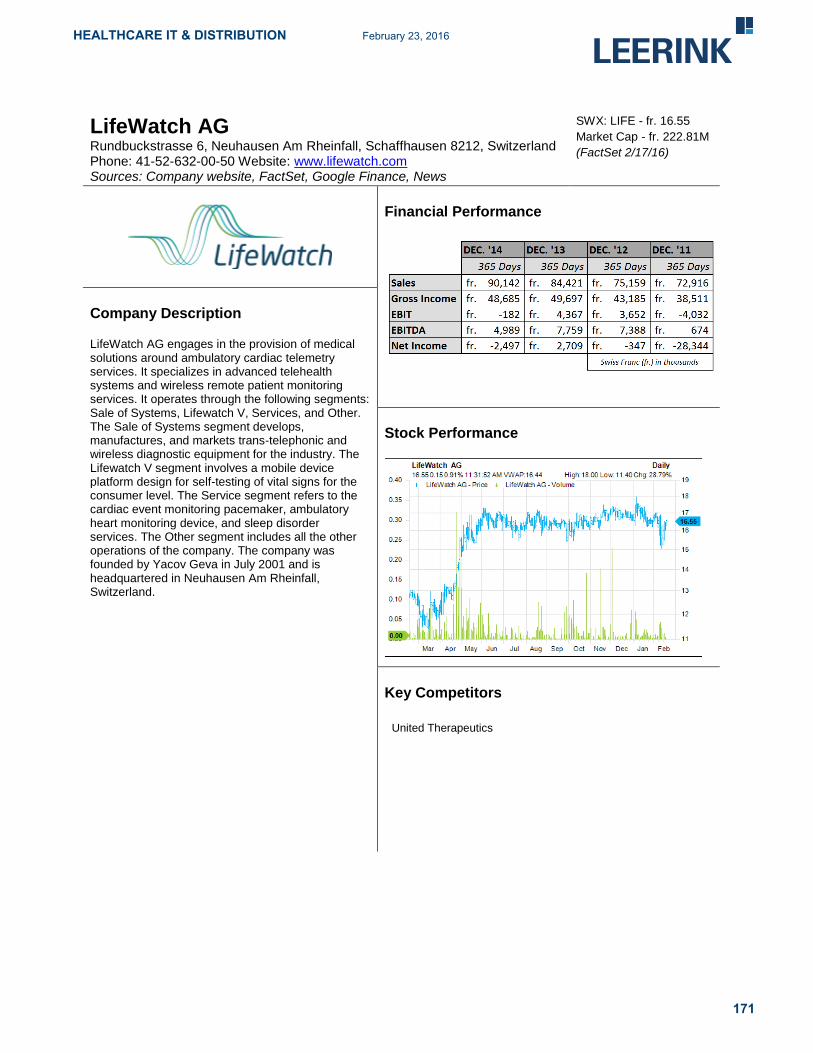
LifeWatch AG Rundbuckstrasse 6, Neuhausen Am Rheinfall, Schaffhausen 8212, Switzerland Phone: 41-52-632-00-50 Website: www.lifewatch.com Sources: Company website, FactSet, Google Finance, News
SWX: LIFE - fr. 16.55
Market Cap - fr. 222.81M
(FactSet 2/17/16)
Financial Performance
Company Description LifeWatch AG engages in the provision of medical solutions around ambulatory cardiac telemetry services. It specializes in advanced telehealth systems and wireless remote patient monitoring services. It operates through the following segments: Sale of Systems, Lifewatch V, Services, and Other. The Sale of Systems segment develops, manufactures, and markets trans-telephonic and wireless diagnostic equipment for the industry. The Lifewatch V segment involves a mobile device platform design for self-testing of vital signs for the consumer level. The Service segment refers to the cardiac event monitoring pacemaker, ambulatory heart monitoring device, and sleep disorder services. The Other segment includes all the other operations of the company. The company was founded by Yacov Geva in July 2001 and is headquartered in Neuhausen Am Rheinfall, Switzerland.
Stock Performance
Key Competitors
United Therapeutics
171
HEALTHCARE IT & DISTRIBUTION February 23, 2016

Mazor Robotics Ltd. 7 HaEshel Street, Casesrea Industrial Park South, Haifa, Israel 38900 Phone: 972-4-618-7100 Website: www.mazorrobotics.com Sources: Company website, FactSet, Google Finance, News
NASDAQ: MZOR - ILS 19.37
Market Cap - ILS 211.32
(FactSet 2/17/16)
Financial Performance
Company Description Mazor Robotics Ltd. is a medical device company, which engages in the developing and marketing of innovative surgical guidance systems and complementary products. The company specializes in robotic, computerized and imaging-based systems, primarily in the field of spine surgery. Its flagship product, Renaissance, is a surgical guidance system that enables surgeons to conduct spine surgeries in an accurate and secure manner. It operates its business through four geographical segments: the United States of America, Eastern Europe, Western Europe and Asia. The company was founded by Moshe Shoham and Eliyahu Zehavi in 2001 and is headquartered in Caesarea, Israel.
Stock Performance
Key Competitors
Globus Medical
IMRIS
Intuitive Surgical
Medtech
Renishaw
mzor-il DEC. '17 DEC. '16 DEC. '15 DEC. '14
365 Days 365 Days 365 Days 365 Days
Sales 167.2$ 135.4$ 101.5$ 82.5$
Gross Income 129.1$ 105.9$ 79.0$ 65.6$
EBIT (41.3)$ (49.3)$ (56.5)$ (55.4)$
EBITDA (43.2)$ (43.9)$ (51.4)$ (52.2)$
Net Income (42.1)$ (50.4)$ (57.2)$ (57.7)$
USD($) in millions
172
HEALTHCARE IT & DISTRIBUTION February 23, 2016

Medical Transcription Billing Corp. 7 Clyde Road, Somerset, NJ 08873 Phone: 1-732-873-5133 Website: www.mtbc.com Sources: Company website, FactSet, Google Finance, News
NASDAQ: MTBC - $0.88
Market Cap - $8.58M
(FactSet 2/17/16)
Financial Performance
Company Description Medical Transcription Billing Corp. operates as a healthcare information technology company that offers proprietary electronic health records and patient management solutions, together with related business services, to healthcare providers. The company's integrated services are designed to help customers increase revenues, streamline workflows and make better business and clinical decisions, while reducing administrative burdens and operating costs. Its services include full-scale revenue cycle management, electronic health records, and other technology-driven practice management services to private and hospital-employed healthcare providers. Medical Transcription Billing was founded by Mahmud Haq on September 28, 2001 and is headquartered in Somerset, NJ.
Stock Performance
Key Competitors
Allscripts Healthcare Solution
athenahealth
MTBC DEC. '17 DEC. '16 DEC. '15 DEC. '14
365 Days 365 Days 365 Days 365 Days
Sales - 25.0$ 23.0$ 18.3$
Gross Income - - - -
EBIT - (3.6)$ (6.5)$ (5.9)$
EBITDA - 1.6$ (0.8)$ (2.0)$
Net Income - (4.2)$ (5.3)$ (4.5)$
USD($) in millions
173
HEALTHCARE IT & DISTRIBUTION February 23, 2016

Medidata Solutions, Inc. 350 Hudson Street, 9
th Floor, New York, NY 10014
Phone: 1-212-918-1800 Website: www.mdsol.com Sources: Company website, FactSet, Google Finance, News
NASDAQ: MDSO - $35.34
Market Cap - $1.96B
(FactSet 2/17/16)
Financial Performance
Company Description Medidata Solutions, Inc. provides cloud-based solutions for life sciences that enhance the efficiency of customer's clinical development processes from concept to conclusion, optimizing their research and development investments. It provides technology solutions and data analytics aimed at enabling effective and safe development, using secure cloud and hybrid cloud infrastructure to instantly connect users over the Internet. The company customers include pharmaceutical, biotechnology, and medical device companies, academic institutions, contract research organizations and other organizations engaged in clinical trials. The company was founded by Glen M. de Vries, Edward F. Ikeguchi and Tarek A. Sherif in June 1999 and is headquartered in New York, NY.
Stock Performance
Key Competitors
DATATRAK
DRS Data & Research Services
Merge Healthcare
OmniComm Systems
Oracle
mdso DEC. '17 DEC. '16 DEC. '15 DEC. '14
365 Days 365 Days 365 Days 365 Days
Sales 548.5$ 460.5$ 392.5$ 335.1$
Gross Income 435.5$ 359.2$ 304.3$ 251.5$
EBIT 59.1$ 40.7$ 29.2$ 20.1$
EBITDA 135.4$ 108.5$ 90.5$ 73.6$
Net Income 72.7$ 58.2$ 50.8$ 40.2$
USD($) in millions
174
HEALTHCARE IT & DISTRIBUTION February 23, 2016

Nuance Communications, Inc. 1 Wayside Road, Burlington, MA 01803 Phone: 1-781-565-5000 Website: www.nuance.com Sources: Company website, FactSet, Google Finance, News
NASDAQ: NUAN - $18.35
Market Cap - $5.59B
(FactSet 2/17/16)
Financial Performance
Company Description Nuance Communications, Inc. provides voice and language solutions for businesses and consumers around the world. Its solutions are used in healthcare, mobile, consumer, enterprise customer service and imaging markets. The company products are based on proprietary voice and language platform. It operates under four segments: Healthcare, Mobile & Consumer, Enterprise and Imaging. The Healthcare segment provides transcription solutions and services that automate the input and management of medical information. The Mobile & Consumer segment offers integrated suite of voice control and text-to-speech solutions, dictation applications, predictive text technologies, mobile messaging services and emerging services such as dictation, Web search and voicemail-to-text. The Enterprise segment offers customer service business intelligence and authentication solutions that are designed to support, understand and communicate with their customers. The Imaging segment offers optical character recognition technology to deliver document scanning and storage solutions, including networked print management and comprehensive PDF applications designed specifically for business users. The company was founded in March 1992 and is headquartered in Burlington, MA.
Stock Performance
Key Competitors
Adobe Systems
IBM
Microsoft
Omtool
West
nuan DEC. '17 DEC. '16 DEC. '15 DEC. '14
365 Days 365 Days 365 Days 365 Days
Sales 2,093.3$ 2,007.0$ 1,979.1$ 1,923.5$
Gross Income 1,345.5$ 1,272.1$ 1,245.5$ 1,235.8$
EBIT 628.7$ 569.5$ 517.2$ 471.1$
EBITDA 719.2$ 684.7$ 652.0$ 564.0$
Net Income 52.5$ (9.1)$ (115.0)$ (150.3)$
USD($) in millions
175
HEALTHCARE IT & DISTRIBUTION February 23, 2016

Omnicell, Inc. 590 East Middlefield Road, Mountain View, CA 94043-1337 Phone: 1-650-251-6100 Website: www.omnicell.com Sources: Company website, FactSet, Google Finance, News
NASDAQ: OMCL - $27.73
Market Cap - $981.73M
(FactSet 2/17/16)
Financial Performance
Company Description Omnicell, Inc. provides automation and business information solutions. The company's automation, analytics and medication adherence solutions are designed to enable healthcare facilities to acquire, manage, dispense and administer medications and medical surgical supplies. The Acute Care segment solutions utilize advanced, software-based medication control and tracking algorithms that interact with hardware security features, resulting in a system that provides both the pharmacist and the nurse real-time safety controls. It also offers analytics and reporting software for pharmacists and materials managers to more easily manage inventory flow, tracking and optimization. This segment includes products and services sold to hospital customers. The Non-Acute Care segment primarily manufactures and sells consumable medication blister cards, packaging equipment and ancillary products throughout the United States, Canada, Europe and Australia. This segment includes products and services sold to customers outside of the hospital setting. The company was founded by Randall A. Lipps in September 1992 and is headquartered in Mountain View, CA.
Stock Performance
Key Competitors
AmerisourceBergen
Becton Dickinson
Cerner
Emerson Electric
McKesson
omcl DEC. '17 DEC. '16 DEC. '15 DEC. '14
365 Days 365 Days 365 Days 365 Days
Sales 767.1$ 707.5$ 484.6$ 440.9$
Gross Income 379.2$ 348.3$ 249.1$ 222.1$
EBIT 71.0$ 55.8$ 48.6$ 49.6$
EBITDA 137.6$ 115.2$ 90.1$ 81.2$
Net Income 41.1$ 31.0$ 30.8$ 30.5$
USD($) in millions
176
HEALTHCARE IT & DISTRIBUTION February 23, 2016

Quality Systems, Inc. 18111 Von Karman Avenue, Suite 700, Irvine, CA 92612 Phone: 1-949-255-2600 Website: www.qsii.com Sources: Company website, FactSet, Google Finance, News
NASDAQ: QSII - $14.40
Market Cap - $876.76M
(FactSet 2/17/16)
Financial Performance
Company Description Quality Systems, Inc. develops and markets computer-based practice management, electronic health records and revenue cycle management applications along with connectivity products and services. It serves medical and dental group practices as well as rural and community hospitals. The company operates through four reportable segments: QSI Dental, NextGen, Hospital Solutions and RCM Services. QSI Dental segment focuses on developing, marketing and supporting software suites sold to dental practices. The NextGen segment provides clinical, financial and connectivity solutions for ambulatory and dental provider organizations. The Hospital Solutions segment develops and markets financial management and billing software products, which perform administrative functions required for operating small and specialty hospitals as well as clinical offerings such as multi-disciplinary clinical documentation and computerized physician order entry. The RCM Services provides technology solutions and consulting services to cover the full spectrum of healthcare provider's RCM needs, with a primary focus on billing and collection services. The company was founded by Sheldon Razin in 1974 and is headquartered in Irvine, CA.
Stock Performance
Key Competitors
Allscripts Healthcare Solutions
athenahealth
Cerner
CPSI
McKesson
QSII DEC. '17 DEC. '16 DEC. '15 DEC. '14
365 Days 365 Days 365 Days 365 Days
Sales 582.6$ 546.1$ 496.5$ 490.2$
Gross Income 327.4$ 309.3$ 273.6$ 268.3$
EBIT 67.4$ 69.9$ 60.0$ 36.0$
EBITDA 91.8$ 90.5$ 75.9$ 70.9$
Net Income 42.8$ 37.5$ 30.0$ 27.3$
USD($) in millions
177
HEALTHCARE IT & DISTRIBUTION February 23, 2016

SHL Telemedicine Ltd. 90 Yigal Alon Street, Ashdar Building, Tel Aviv, Israel 67891 Phone: 972-3-561-2212 Website: www.shl-telemedicine.com Sources: Company website, FactSet, Google Finance, News
SWX: SHLTN - fr. 6.60
Market Cap - fr. 69.24M
(FactSet 2/17/16)
Financial Performance
Company Description SHL Telemedicine Ltd. specializes in the developing and marketing advanced personal telemedicine solutions, which focuses on cardiovascular and related diseases. It operates its business in three geographical segments: Europe, Israel and the United States. The company was founded by Yoram Alroy and Elon Shalev in 1987 and is headquartered in Tel Aviv, Israel.
Stock Performance
Key Competitors
Apollo Medical
Big Tree Group
HLB
I’rom Group
RaySearch Laboratories
SHLTN-CH DEC. '17 DEC. '16 DEC. '15 DEC. '14
365 Days 365 Days 365 Days 365 Days
Sales 71.7$ 61.4$ 48.4$ 39.7$
Gross Income - - - -
EBIT 9.4$ 7.6$ 4.0$ 1.3$
EBITDA 12.9$ 11.3$ 7.8$ 7.3$
Net Income 8.9$ 7.3$ 3.8$ 2.6$
USD($) in millions
178
HEALTHCARE IT & DISTRIBUTION February 23, 2016

Spok Holdings, Inc. 6850 Versar Center, Suite 420, Springfield, VA 22151-4148 Phone: 1-800-611-8488 Website: www.spok.com Sources: Company website, FactSet, Google Finance, News
NASDAQ: SPOK - $17.44
Market Cap - $367.45M
(FactSet 2/17/16)
Financial Performance
Company Description Spok Holdings, Inc. operates as a holding company, which provides wireless messaging, mobile voice and data, and unified communications solutions to the healthcare, government, and enterprise sectors. The company operates through three segments, Wireless and Software. The Wireless segment provides one-way and two-way messaging services, including information services. Its one-way messaging consists of numeric messaging services, which enable subscribers to receive messages comprising numbers, such as phone numbers; and alphanumeric messages, including numbers and letters that enable subscribers to receive text messages. Its two-way messaging services enable subscribers to send and receive messages to and from other wireless messaging devices, such as pagers, personal digital assistants, and personal computers. In addition, this segment offers voice mail, personalized greeting, message storage and retrieval, and equipment loss and/or maintenance protection to both one-way and two-way messaging subscribers, as well as provides mobile voice and data services through third party providers. The Software segment develops, sells, and supports enterprise-wide systems to automate critical unified communications solutions for contact centers, clinical alerting and notification, mobile communications, and messaging, as well as for public safety notifications. This segment also provides professional services, such as installation and training; and post-contract support services, as well as sells equipment used with its software. The company serves businesses, professionals, management personnel, medical personnel, field sales personnel and service forces, members of the construction industry and construction trades, real estate brokers and developers, sales and service organizations, specialty trade organizations, manufacturing organizations, and government agencies. The company was founded on November 16, 2004 and is headquartered in Springfield, VA.
Stock Performance
Key Competitors
AT&T
Spring
T-Mobile
Verizon
179
HEALTHCARE IT & DISTRIBUTION February 23, 2016

Streamline Health Solutions, Inc. 1230 Peachtree Street NE, Suite 1000, Atlanta, GA 30309 Phone: 1-404-446-0050 Website: www.streamlinehealth.com Sources: Company website, FactSet, Google Finance, News
NASDAQ: STRM - $1.42
Market Cap - $26.67M
(FactSet 2/17/16)
Financial Performance
Company Description Streamline Health Solutions, Inc. is a provider of SaaS-based healthcare information technology solutions for healthcare providers. The company's comprehensive suite of solutions includes: enterprise content management, business analytics, integrated workflow systems, clinical documentation improvement, and computer assisted coding. Its business analytics solutions provide real-time access to key performance metrics that enable healthcare organizations to identify and manage opportunities. It also provides implementation and consulting services to complement its software solutions. The company's software and services enable hospitals and integrated healthcare delivery systems in the U.S. and Canada to capture, store, manage, route, retrieve, and process vast amounts of patient clinical, financial and other healthcare provider information. Streamline Health Solutions was founded by J. Brian Patsy in October 1989 and is headquartered in Atlanta, GA.
Stock Performance
Key Competitors
Cerner
CPSI
McKesson
Quality Systems
STRM DEC. '17 DEC. '16 DEC. '15 DEC. '14
365 Days 365 Days 365 Days 365 Days
Sales 33.9$ 31.7$ 29.3$ 27.6$
Gross Income 20.9$ 19.2$ 17.5$ 14.6$
EBIT (3.5)$ (3.8)$ (5.3)$ (11.2)$
EBITDA 3.9$ 3.9$ 3.0$ (0.4)$
Net Income (5.8)$ (5.8)$ (5.6)$ (13.0)$
USD($) in millions
180
HEALTHCARE IT & DISTRIBUTION February 23, 2016

Tandem Diabetes Care, Inc. 11045 Roselle Street, Suite 200, San Diego, CA 92121 Phone: 1-858-366-6900 Website: www.tandemdiabetes.com Sources: Company website, FactSet, Google Finance, News
NASDAQ: TNDM - $7.25
Market Cap - $218M
(FactSet 2/17/16)
Financial Performance
Company Description Tandem Diabetes Care, Inc. is a medical device company, which designs, develops and commercializes products for people with insulin-dependent diabetes. It manufactures and sells the t:slim Insulin Pump and slimmest & smallest durable insulin pump; t:connect; and glucose monitoring, infusion sets and accessories. The company's technology platform features patented Micro-Delivery Technology and easy-to-navigate software architecture. Tandem Diabetes Care was founded by Paul M. DiPerna on January 27, 2006, and is headquartered in San Diego, CA.
Stock Performance
Key Competitors
Insulet
Johnson & Johnson
Medtronic Plc
Roche Holding Ltd.
TNDM DEC. '17 DEC. '16 DEC. '15 DEC. '14
365 Days 365 Days 365 Days 365 Days
Sales 136.3$ 102.6$ 72.8$ 49.7$
Gross Income 63.9$ 42.5$ 24.5$ 15.3$
EBIT (57.7)$ (65.9)$ (72.3)$ (75.8)$
EBITDA (51.1)$ (63.1)$ (68.8)$ (73.3)$
Net Income (59.4)$ (68.6)$ (75.1)$ (79.5)$
USD($) in millions
181
HEALTHCARE IT & DISTRIBUTION February 23, 2016

Veeva Systems, Inc. 4637 Chabot Drive, Suite 210, Pleasanton, CA 94588 Phone: 1-925-452-6500 Website: www.veeva.com Sources: Company website, FactSet, Google Finance, News
NYSE: VEEV - $22.64
Market Cap - $3B
(FactSet 2/27/16)
Financial Performance
Company Description Veeva Systems, Inc. provides industry-specific, cloud-based software solutions for the life sciences industry. Its solutions enable pharmaceutical and other life sciences companies to realize the benefits of modern cloud-based architectures and mobile applications for their most critical business functions, without compromising industry-specific functionality or regulatory compliance. The company's customer relationship management solutions enable its customers to increase the productivity and compliance of their sales and marketing functions. Its regulated content management and collaboration solutions enable its customers to more efficiently manage a range of highly regulated, content-centric processes across the enterprise. The company's customer master solution enables customers to more effectively manage complex healthcare provider and healthcare organization data. Veeva Systems was founded by Mark Armenante, Peter P. Gassner, Doug Ostler, Mitch Wallace and Matthew J. Wallach on January 12, 2007, and is headquartered in Pleasanton, CA.
Stock Performance
Key Competitors
Cegedim SA
Computer Sciences
EMC
IMS Health
Open Text
VEEV DEC. '17 DEC. '16 DEC. '15 DEC. '14
365 Days 365 Days 365 Days 365 Days
Sales 620.0$ 508.5$ 405.0$ 313.2$
Gross Income 429.5$ 345.5$ 271.8$ 202.4$
EBIT 181.9$ 139.5$ 108.9$ 86.3$
EBITDA 192.5$ 150.2$ 115.8$ 89.6$
Net Income 112.8$ 85.9$ 67.9$ 40.1$
USD($) in millions
182
HEALTHCARE IT & DISTRIBUTION February 23, 2016

Vocera Communications, Inc. 525 Race Street, Suite 150, San Jose, CA 95126-3495 Phone: 1-408-882-5100 Website: www.vocera.com Sources: Company website, FactSet, Google Finance, News
NYSE: VCRA - $14.19
Market Cap - $371.41M
(FactSet 2/17/16)
Financial Performance
Company Description Vocera Communications, Inc. provides secure, integrated, intelligent communication solutions, focused on empowering mobile workers in healthcare, hospitality, energy, and other mission-critical mobile work environments, in the U.S. and internationally. The company sells its solutions to healthcare customers primarily through its direct sales force in the United States, with resellers for certain U.S. Government business, and through both directs sales and select distribution channels in international markets. It operates its business through two segments: Product and Service. Vocera Communications was founded by Robert E. Shostak, Paul Barsley and Randy Nielsen on February 16, 2000, and is headquartered in San Jose, CA.
Stock Performance
Key Competitors
Ascom Holding
BlackBerry
Cisco Systems, Inc.
Motorola
Nokia Oyj
VCRA DEC. '17 DEC. '16 DEC. '15 DEC. '14
365 Days 365 Days 365 Days 365 Days
Sales 126.2$ 114.6$ 104.1$ 95.4$
Gross Income 81.0$ 72.2$ 65.2$ 59.0$
EBIT (6.2)$ (1.3)$ (5.2)$ (14.8)$
EBITDA 5.5$ 1.4$ (2.8)$ (12.2)$
Net Income (13.2)$ (14.5)$ (17.1)$ (28.3)$
USD($) in millions
183
HEALTHCARE IT & DISTRIBUTION February 23, 2016

WageWorks, Inc. 1199 Park Place, 4
th Floor, San Mateo, CA 94403-1599
Phone: 1-650-557-5200 Website: www.wageworks.com Sources: Company website, FactSet, Google Finance, News
NYSE: WAGE - $44.28
Market Cap - $1.59B
(FactSet 2/17/16)
Financial Performance
Company Description WageWorks, Inc. is a provider of Consumer-Directed Benefits(CDBs) in the United States. WageWorks administers and operates a broad array of CDBs, including pre-tax spending accounts, such as health and dependent care Flexible Spending Accounts, as well as Commuter Benefit Services, including transit and parking programs, Health Savings Accounts HSAs, Health Reimbursement Arrangements, and other employee benefits. The company delivers employee spending account benefit programs through highly scalable benefits as a service, delivery model that employer clients and their employee participants may access through a standard web browser on any Internet-enabled device, including computers, smart phones and other mobile devices, such as tablet computers. WageWorks was founded by Clem O'Donnell and Jon Kessler on January 28, 2000, and is headquartered in San Mateo, CA.
Stock Performance
Key Competitors
ADP
Aetna
Cash Technologies
Crawford & Company
Engility Holdings
wage DEC. '17 DEC. '16 DEC. '15 DEC. '14
365 Days 365 Days 365 Days 365 Days
Sales 402.3$ 361.8$ 334.3$ 267.8$
Gross Income 265.2$ 236.5$ 218.4$ 168.3$
EBIT 103.7$ 86.9$ 78.2$ 58.4$
EBITDA 128.0$ 109.9$ 96.5$ 71.8$
Net Income 36.7$ 27.8$ 23.0$ 18.2$
USD($) in millions
184
HEALTHCARE IT & DISTRIBUTION February 23, 2016

WebMD Health Corp. 111 8
th Avenue, 7
th Floor, New York, NY 10011-5201
Phone: 1-212-624-3700 Website: www.webmd.com Sources: Company website, FactSet, Google Finance, News
NASDAQ: WBMD - $53.19
Market Cap - $1.92B
(FactSet 2/17/16)
Financial Performance
Company Description WebMD Health Corp. provides health information services to consumers, physicians and other healthcare professionals, employers and health plans through its public and private online portals, mobile platforms and health-focused publications. Its online healthcare information, decision-support applications and communications services enable consumers to obtain detailed information on a particular disease or condition, to locate physicians, to store individual healthcare information, to assess their personal health status, to receive periodic e-newsletters and alerts on topics of individual interest, and to participate in online communities with peers and experts. The company also enables physicians and other healthcare professionals to access clinical reference sources, to stay abreast of the latest clinical information, to learn about new treatment options, to earn continuing medical education and continuing education credit and to communicate with peers. It enables employers and health plans to provide their employees and plan members with access to personalized health and benefit information and decision-support technology that helps them make more informed benefit, provider and treatment choices. The company's services include WebMD consumer network, WebMD professional network, WebMD private portal and WebMD magazine. WebMD Health was founded on May 3, 2005, and is headquartered in New York, NY.
Stock Performance
Key Competitors
athenahealth
Everyday Health
FICO
Healthways
WBMD DEC. '17 DEC. '16 DEC. '15 DEC. '14
365 Days 365 Days 365 Days 365 Days
Sales 739.9$ 690.1$ 634.2$ 580.4$
Gross Income 463.3$ 422.0$ 384.4$ 357.6$
EBIT 174.0$ 147.9$ 127.5$ 96.3$
EBITDA 243.0$ 213.0$ 192.2$ 158.6$
Net Income 87.7$ 74.4$ 62.7$ 42.1$
USD($) in millions
185
HEALTHCARE IT & DISTRIBUTION February 23, 2016

Weight Watchers International, Inc. 675 Avenue of the Americas, 6
th Floor, New York, NY 10010
Phone: 1-212-589-2700 Website: www.weightwatchersinternational.com Sources: Company website, FactSet, Google Finance, News
NYSE: WTW - $14.45
Market Cap - $820.69M
(FactSet 2/17/16)
Financial Performance
Company Description Weight Watchers International, Inc. provides weight management services, operating globally through a network of company-owned and franchise operations. It operates through four segments: North America, United Kingdom, Continental Europe, and Other. The North America reporting segment consists of United States and Canada Company-owned operations. The United Kingdom reporting segment consists of United Kingdom Company-owned operations. The Continental Europe reporting segment consists of Germany, Switzerland, France, Spain, Belgium, Netherlands and Sweden Company-owned operations. The other reporting segment includes Australia, New Zealand, Mexico and Brazil Company-owned operations. The company was founded by Jean Nidetch in 1963 and is headquartered in New York, NY.
Stock Performance
Key Competitors
eDiets.com
Fleury Michon
Medifast
Nutrisystem
WebMD Health
WTW DEC. '17 DEC. '16 DEC. '15 DEC. '14 365 Days 365 Days 365 Days 365 Days
Sales 1,229.4 $ 1,191.9 $ 1,164.3 $ 1,479.9 $ Gross Inc. 596.8 $ 581.3 $ 572.7 $ 805.7 $ EBIT 228.3 $ 209.5 $ 188.7 $ 306.3 $ EBITDA 269.8 $ 257.0 $ 249.6 $ 353.6 $ Net Inc. 69.6 $ 56.2 $ 44.1 $ 97.4 $
USD($) in millions
186
HEALTHCARE IT & DISTRIBUTION February 23, 2016

Population Health & Digital Health Definitions
Appendix B: Population Health Definitions
Accountable Care Organization (CMS definition): Accountable Care Organizations (ACOs) are groups
of physicians, hospitals, and other healthcare providers that coordinate care between one another to
ensure efficient, cost-effective treatment for patients. ACOs require that providers engage in risk-
sharing, where they receive an upfront, lump-sum payment on a per patient per month (PMPM) basis.
Providers are incentivized to perform efficient treatment for patients under their care, as savings can be
accrued to improve facilities. This represents an economic shift from volume-based fee-for-service plans
that pay providers for each form of treatment they offer a patient. In its early stages, ACOs typically only
offer plans for Medicare patients.
Affordable Care Act (healthinsurance.org definition): The Patient Protection and Affordable Care Act
(PPACA), commonly referred to as the Affordable Care Act (ACA) or Obamacare, is a health reform
legislation passed by the 111th Congress and signed into law by President Barack Obama in March
2010. Its changes include a list of health-related provisions that began taking effect in 2010. The goal of
the ACA is to extend insurance coverage, lower health care costs, eliminate practices that deny
coverage for pre-existing conditions, and improve the coordination of care between providers.
American Recovery and Reinvestment Act (recovery.gov definition): The American Recovery and
Reinvestment Act of 2009 (ARRA) is a $787B stimulus package law that was used to create new jobs,
spur economic activity, and increase accountability with government spending. Within ARRA was the
HITECH Act.
Health Information Technology for Economic and Clinical Health Act (hhs.gov definition): The
Health Information Technology for Economic and Clinical Health (HITECH) Act of 2009 was enacted as
a part of the ARRA of 2009. The law was adopted to promote the meaningful usage of health
information technology, offering $45B in subsidies for participating provider organizations.
Population Health Management (Leerink definition): Population Health Management (PHM) is a
convergence term used to describe the provision of healthcare based upon the outcomes of a group of
individuals, accounting for the distribution of outcomes within the group. It attempts to maximize health
access and quality at the lowest possible cost. Center to the PHM movement has been the risk-shifting
between payers and providers, where providers are now being obligated by insurance companies to
have a shared risk when taking on patients in order to ensure that care is provided at a reasonable cost.
187
HEALTHCARE IT & DISTRIBUTION February 23, 2016

Appendix C: Digital Health Definitions
Digital Health (Leerink definition): Digital Health is a convergence term used to describe the coming
together of formerly separate sectors such as the healthcare system, connected devices, and big data
analytics that is enabled by digital technology and the digitization of healthcare information. There are 6
investment themes in Digital Health, including:
Consumer Empowerment. Consumers are taking control of healthcare spending, and market
participants like payers and providers must follow them or become irrelevant.
Automation. Technologists are digitizing the components of healthcare and automating
workflows, creating new opportunities for the adaptive, and de-valuing old skills and legacy
systems.
Connected Health. Patients are tearing down the walls of the healthcare system, demanding to
receive care and information when and where they need it.
Population Health. Providers are beginning to manage the wellness of a population proactively,
instead of reactively treating the sick.
Big Data. Data scientists are optimizing care with next-generation analytics applied to a
growing mountain of healthcare data.
Healthcare IT. IT systems are now at the center of providers’ plans to improve care outcomes,
cut costs, and get paid.
Digital Health is a useful term to describe a convergence phenomenon that is not well understood.
However, as a convergence term, Digital Health is also a transitional term whose use will ultimately fade
away as its elements become normalized and accepted. Ultimately, “Digital health care practices” will
become just “healthcare practices.”
Digital Health companies (Rock Health definition): Health companies that build and sell technologies
(or technologies paired with services). Excludes companies that are selling a service only.
Digital Health (Paul Sonnier definition): Digital Health is the convergence of the digital and genetics
revolutions with health and healthcare with the goal of reducing inefficiencies in healthcare delivery,
improving access, reducing costs, increasing quality, and making medicine more personalized and
precise.
e-Health (Wikipedia): Healthcare practice supported by electronic processes and communication.
Interchangeable terms also include health informatics, healthcare practice using the internet, and
mHealth.
Health 2.0 (Health 2.0 Conference definition, from Wikipedia): The use in health care of new cloud,
SaaS, mobile and device technologies that are:
Adaptable technologies that easily allow others tools and applications to link and integrate with
them, primarily through use of accessible application programming interfaces (APIs).
Focused on the user experience, incorporating the principles of user-centered design.
Data-driven, in that they both create data and present data to the user in order to help improve
decision-making.
Digital Medicine (Eric Topol definition): Digital technologies, social networking, mobile connectivity and
bandwidth, increasing computing power and the data universe converging with wireless sensors,
genomics, imaging, and health information systems to creatively destroy medicine as we know it.
188
HEALTHCARE IT & DISTRIBUTION February 23, 2016

Connected Health (Joe Kvedar definition): Connected health is a model for healthcare delivery that
uses technology to provide healthcare remotely. Connected health aims to maximize healthcare
resources and provide increased, flexible opportunities for consumers to engage with clinicians and
better self-manage their care. It uses technology – often leveraging readily available consumer
technologies – to deliver patient care outside of the hospital or doctor's office. Connected health
encompasses programs in telehealth, remote care (such as home care), and disease and lifestyle
management, often leverages existing technologies such as connected devices using existing cellular
networks, and is associated with efforts to improve chronic care.
Source: Leerink Research, Wikipedia, author websites.
Note: MEDACorp performed this survey on behalf of a Leerink Partners analyst. The
analyst in conjunction with MEDACorp developed the questions contained in the survey.
189
HEALTHCARE IT & DISTRIBUTION February 23, 2016

HOSPITAL HCIT PURCHASING TRENDS
Respondent Distribution
Geographic Distribution
Source: Google Maps
Specialty Hospital HCIT
Trends Hospital HCIT Purchasing Trends
Number of Respondents 50 Hospital Administrators
Respondent Distribution United States
Survey Date January 2016
Responses represent an average of the aggregate response (n=50) unless otherwise noted. Screener 1: Are you currently a hospital CIO/CTO or administrator involved in the decision making and selection of financial and
clinical information systems at your center?
100.0% Yes
0.0% No
Screener 2: Which of the following best describes your role?
12.0% Chief Executive Officer (CEO)
54.0% Chief Information Officer (CIO)/Chief Technology Officer (CTO)
16.0% Office of the CIO/CTO
8.0% Chief Financial Officer (CFO)
0.0% Office of the CFO
0.0% Administration – purchasing manager
10.0% Administration – other: CMO (1x); CMO/CMIO (1x); EVP/CSO (1x); IT Director (1x); Medical Director (1x)
Screener 3: Will your hospital be participating in all three stages of Meaningful Use?
98.0% Yes
2.0% No
0.0% I don’t know
Screener 4: Which IT vendor does your health system use for the majority of your hospital clinical modules (check all that apply)?
24.0% Cerner
4.0% CPSI
8.0% Allscripts / Eclipsys
26.0% Epic
2.0% Healthland
6.0% HMS
6.0% McKesson Horizon
4.0% McKesson Paragon
18.0% MEDITECH
4.0% Quality Systems / NextGen
4.0% Siemens
12.0%
Other: Accretive (1x); Athena (Razor) (1x); Home grown (1x); Medhost EDIS & Enterprise (1x); Prognosis (1x); Sigmund (1x)
190
HEALTHCARE IT & DISTRIBUTION February 23, 2016

Hospital Demographics
1. What is the name of your hospital and where is it located? If you work for a health system with multiple facilities, please
answer based on the location where you work at specifically. See Appendix for a summary of responses.
2. How would you best describe your institution?
20.0% Academic hospital
76.0% Community hospital
4.0% Other: CAH (1x); Integrated Delivery Network (1x)
3. How many hospitals are in your network? If you are an independent hospital, please enter “1.”
Mean Median Sum
Number of hospitals in network 4.4 2 222
4. How many inpatient beds does your hospital network have?
Mean Median Sum
Number of inpatient beds in hospital network 796.6 390 39,831
5. What is your hospital system’s estimated annual net revenue in millions (the entire network)?
Mean Median
Hospital system’s estimated annual net revenue $620,640,000 $340,000,000
6. How would you rate the overall quality of the vendor(s) you have ever used for your clinical modules? Please use a scale from
1 - 5, where 1 is the worst and 5 is the best.
3.6 (n=34) Cerner
2.5 (n=20) CPSI
2.9 (n=30) Allscripts / Eclipsys
3.7 (n=26) Epic
2.3 (n=16) Healthland
2.5 (n=17) HMS
2.4 (n=27) McKesson Horizon
2.7 (n=15) McKesson Paragon
3.1 (n=29) MEDITECH
2.5 (n=22) Quality Systems / NextGen
2.6 (n=26) Siemens
1.9 (n=18) Other: AthenaHealth (2x); Accretive (1x); IDX Flowcast (1x); Medhost (1x); Prognosis (1x)
7. Please describe a positive and a negative about vendors you have used.
See Appendix for a summary of responses.
8. Will any of the hospitals in your network be switching to a new clinical IT vendor?
28.0% Yes
72.0% No
How many facilities will be changing their clinical IT vendor? (n=14)
Mean Median Sum
Number of facilities expected to change IT vendor 6.2 1 87
Why will they be changing?
191
HEALTHCARE IT & DISTRIBUTION February 23, 2016

See Appendix for a summary of responses. Has that deal already been signed or will it be signed in the future? (n=14)
35.7% Already signed
64.3% Will be signed in future, specify calendar year: See Appendix
For the hospitals that will be switching clinical IT vendors, who is the current vendor that the hospital will be switching away
from and who will that hospital(s) be switching to? (n=14)
Existing Vendor Vendor Will Be Switching to
Cerner 7.1% 35.7%
CPSI 0.0% 0.0%
Allscripts / Eclipsys 14.3% 0.0%
Epic 0.0% 21.4%
Healthland 0.0% 0.0%
HMS 0.0% 0.0%
McKesson Horizon 28.6% 0.0%
McKesson Paragon 7.1% 0.0%
MEDITECH 7.1% 14.3%
Quality Systems / NextGen 0.0% 0.0%
Siemens 28.6% 0.0%
Other: Currently in selection process – not defined yet (1x); EcW (1x); Either Cerner or Epic (1x); Still evaluating (1x) 7.1% 28.6%
9. Will any of the hospitals in your network be replacing their financial and administrative systems?
36.7% Yes
63.3% No
For the hospitals that will be switching financial and administrative systems, who is the current vendor that the hospital will
be switching away from and who will that hospital(s) be switching to? (n=18)
Existing Vendor Vendor Will Be Switching to
Cerner 11.1% 27.8%
CPSI 0.0% 0.0%
Allscripts / Eclipsys 5.6% 0.0%
Epic 0.0% 11.1%
Healthland 5.6% 0.0%
HMS 0.0% 0.0%
McKesson Horizon 22.2% 0.0%
McKesson Paragon 0.0% 0.0%
MEDITECH 11.1% 11.1%
Quality Systems / NextGen 0.0% 5.6%
Siemens 16.7% 0.0%
Other: Cerner for Rev Cycle and Lawson for skin (1x); Either Cerner or EPIC (1x); FundWare / 3M (1x); GE (1x); IDX (1x); Infor (Lawson) (1x); MS GP (1x); Not determined (1x); Not yet determined (1x); PeopleSoft, Prognosis (1x); Still evaluating (1x); Various (1x) 27.8% 44.4%
When will that deal be signed? (n=18)
33.3% Already signed
66.7% Will be signed in the future, specify calendar year: See Appendix
Why will this change occur?
192
HEALTHCARE IT & DISTRIBUTION February 23, 2016

See Appendix for a summary of responses.
Will your IDN acquire more hospitals in the future? (n=18)
38.9% Yes
61.1% No
Will you convert those acquired entities to a new IT system? (n=18)
38.9% Yes
61.1% No
Which system will they convert to?
See Appendix for a summary of responses.
10. What is your capital budget in each of the following years and what percentage do you expect to be allocated to healthcare
information technology (HCIT)?
2015 2016 2017 2018 2019
Capital budget – MEAN $25,027,449
(n=49) $29,398,571
(n=49) $45,569,375
(n=48) $34,944,787
(n=47) $34,739,130
(n=46)
Capital budget – MEDIAN $6,600,000
(n=49) $9,700,000
(n=49) $9,950,000
(n=48) $10,000,000
(n=47) $10,000,000
(n=46)
Percent allocated to HCIT 20.8% 17.9% 17.4% (n=49) 16.9% (n=48) 17.7% (n=47)
Please explain the trend.
See Appendix for a summary of responses.
11. How do you expect the value of signed contracts with your core HCIT vendor to change relative to 2014?
2015 2016 2017 2018
Increase vs. 2014 6.0% 8.0% 12.0% 16.0%
Decrease vs. 2014 58.0% 64.0% 56.0% 56.0%
Stay the same 36.0% 28.0% 32.0% 28.0%
Why? See Appendix for a summary of responses.
12. For the majority of your employed doctors, have they already selected the clinical EMR system that they will use to attest to
Meaningful Use?
96.0% Yes
4.0% No
13. Which vendor(s) are your employed doctors using now (check all) and if they will be switching to a new vendor, which will they
be switching to (check all that apply)?
Using Now Switching to (n=26)
Allscripts 14.0% 3.8%
Eclipsys 4.0% 0.0%
Greenway 6.0% 0.0%
eClinical 12.0% 3.8%
McKesson 10.0% 0.0%
Sage 0.0% 0.0%
Quality Systems (NextGen) 12.0% 0.0%
Cerner 18.0% 19.2%
Athena 20.0% 11.5%
193
HEALTHCARE IT & DISTRIBUTION February 23, 2016

GE Centricity (IDX) 10.0% 0.0%
Micro MD 4.0% 0.0%
Epic 28.0% 23.1%
Nuance 4.0% 3.8%
Press Ganey 4.0% 3.8%
Imprivata 4.0% 3.8%
Other: Meditech (2x); Amazing Charts (1x); Cerner or EPIC (1x); E-MDs (1x); Healthland Centriq (1x); Home grown (1x); Medent (1x); NextGen (1x); Selection has not yet been made (1x); Sigmund (1x); Thrive (1x) 14.0% 23.1%
I don’t know 2.0% 15.4%
Please explain.
See Appendix for a summary of responses.
14. Is it important for the physicians in the community (employed or affiliated) to be on a local hospital’s IT platform in order to be able to participate in ACOs, bundled reimbursement, and other population health related items?
72.0% Yes
28.0% No
Why?
See Appendix for a summary of responses.
If athenahealth offers a solution to your physicians that would cover the “front-end” of a hospital, inpatient EMR solution, though the back-end is still a different vendor such as MEDITECH, Cerner, or Epic, would this be enough for you to include ATHN Athena in a network wide IDN EMR proposal and would this make you more likely to purchase / consider athenahealth for physician clinicals and a hospital solution? (n=36)
25.0% Yes, we are likely to consider Athena
58.3% No, this doesn’t make a difference; we want the hospital and doctors on one platform
16.7% We would consider Athena, but we’d still be more likely to go with another IDN solution
Please explain. See Appendix for a summary of responses.
Revenue Cycle
15. Are you currently using an external vendor to assist you with any aspects of the revenue cycle function?
34.0% Yes
66.0% No
Which vendor (s) are you using for revenue cycle? Please select all that apply. (n=17)
29.4% MedAssets
11.8% Accretive Health
5.9% Cerner Revenue Works
5.9% McKesson Revenue Cycle Services
17.6% Advisory Board
11.8% Athena
5.9% CPSI
17.6% Emdeon
0.0% Epocrates
0.0% Omnicell
0.0% EPIC
194
HEALTHCARE IT & DISTRIBUTION February 23, 2016

0.0% MedeAnalytics
0.0% Passport
0.0% Patient Keeper
0.0% PatientSafe Solutions
17.6% Other: Cymetrix (1x); Faircode (1x); Praxis (1x)
Please describe your experience with your vendor.
See Appendix for a summary of responses.
Will you purchase more or less from your revenue cycle vendor in the future? (n=17)
29.4% Will buy less
52.9% No change
17.6% Will buy more
Why? See Appendix for a summary of responses.
16. Which projects will your hospital invest capital into in order to build or expand HCIT capabilities? Select all that apply.
34.0% ACOs
74.0% Population health management
24.0% ICD 10s
10.0% Stage 2 items
44.0% Stage 3 items
44.0% Health information exchanges
32.0% Wireless communication
28.0% Bundled reimbursement
24.0% Patient access revenue cycle apps
16.0% Back-end revenue cycle apps
16.0% Denials management
12.0% Charge-master related products
0.0% Other
4.0% None
Please explain why and which vendors you will use. See Appendix for a summary of responses.
How much do you plan to invest in these initiatives?
Mean Median
ACOs (n=16) $1,078,125 $750,000
Population health management (n=34) $1,985,588 $750,000
ICD 10s (n=11) $267,727 $50,000
Stage 2 items (n=3) $116,667 $100,000
Stage 3 items (n=17) $940,882 $300,000
Health Information Exchanges (n=20) $285,450 $162,500
Wireless communication (n=15) $1,080,000 $250,000
Bundled reimbursement (n=13) $653,462 $100,000
Patient access revenue cycle apps (n=10) $15,745,000 $300,000
Back-end revenue cycle apps (n=7) $22,028,571 $300,000
Denials management (n=7) $410,714 $200,000
Charge-master related products (n=6) $422,500 $125,000
What year do you plan to invest in these initiatives? See Appendix for a summary of responses.
195
HEALTHCARE IT & DISTRIBUTION February 23, 2016

17. How do these investments compare to Meaningful Use spend? (n=48)
Mean Median
Estimated Meaningful Use Investments from 2010 – 2014 $M $5,644,250 $2,000,000
Estimated Investments in Initiatives Above from 2015 – 2018 $M $3,476,250 $2,000,000
18. What is your top IT investment priority in 2015 and 2016 and why is it a top priority?
See Appendix for a summary of responses.
How much will it cost? (n=45)
Mean Median
Estimated cost of IT investment $8,870,714 $2,000,000
19. What is your top capital budget allocation priority in 2015 – 2016 and how does IT fit into it? See Appendix for a summary of responses.
Cap-Ex Spending Expectations and Priorities
20. Do you expect to see any changes in your capital spending budget over the next 12 months?
28.0% Yes, it will increase
72.0% No, it will remain the same
0.0% Yes, it will decrease
5.8% Overall change
Cap-Ex Spend Details
21. Over the next 12 months, does your institution plan on spending more or less on the following items? Please choose one:
more, less, unchanged, undecided / unsure.
More Less Unchanged Undecided/Unsure
54.0% 6.0% 34.0% 6.0% Infrastructure Improvements / Remodeling
26.0% 6.0% 64.0% 4.0% Clinical HCIT Systems (EMR / Lab / Pharmacy)
22.0% 4.0% 70.0% 4.0% Equipment for the Operating Room
24.0% 4.0% 64.0% 8.0% X-Ray / Imaging Equipment
16.0% 8.0% 70.0% 6.0% Beds / Stretchers / Patient Lift Systems
12.0% 4.0% 76.0% 8.0% MRI Equipment
18.0% 4.0% 68.0% 10.0% Digital Mammography
8.0% 4.0% 80.0% 8.0% Ventilators
12.0% 4.0% 68.0% 16.0% Radiation Oncology Equipment (i.e., Linear Accelerators, etc.)
8.0% 4.0% 78.0% 10.0% Da Vinci Systems
4.0% 2.0% 62.0% 32.0% “Rio” / MAKO (hip / knee) Systems
Please specify technologies / products under consideration and reason for purchase. See Appendix for a summary of responses.
Please specify reason for decrease in spending. See Appendix for a summary of responses.
196
HEALTHCARE IT & DISTRIBUTION February 23, 2016

Ancillary Systems
22. How would you rate the overall quality of the vendors you have ever used for your ancillary systems? Please use a scale from
1-5 where 1 is the poor and 5 is excellent. If you have no experience with a vendor, enter “0”.
3.3 (n=26) Nuance
3.0 (n=28) M Modal
3.6 (n=41) 3M/Codewrite360
2.8 (n=26) Optum
3.3 (n=32) Imprivata
3.2 (n=26) Press Ganey
3.2 (n=38) The Advisory Board
23. Which ancillary systems did you invest in for 2015? Which will your hospital invest in 2016? Check all that apply.
2015 2016
52.0% 26.0% Speech recognition
42.0% 36.0% Clinical documentation improvement
34.0% 14.0% Computer assisted coding
28.0% 24.0% Patient experience measurement/surveys
32.0% 18.0% Single sign-on/authentication management
10.0% 10.0% Patient identification
46.0% 26.0% E-prescribing
26.0% 36.0% Secure messaging
28.0% 30.0% Other IT security
2.0% 6.0% Other: New PACs (1x)
24. How does your planned spending for ancillary systems in 2016 compare to 2015 spending?
20.0% Increased
78.0% Stayed the same
2.0% Decreased
3.1% Overall change
197
HEALTHCARE IT & DISTRIBUTION February 23, 2016

Appendix Question 1: What is the name of your hospital and where is it located? If you work for a health system with multiple facilities,
please answer based on the location where you work at specifically.
Name Location
1 Vanderbilt Nashville TN
2 JFK Health Edison, NJ
3 CUMC New York, NY
4 North Shore Manhasset, NY
5 Eisenhower Augusta, GA
6 Roger Williams Medical Center Providence, RI
7 Beaufort memorial hospital Beaufort, SC
8 Brylin Hospital Buffalo, NY
9 Holdenville general hospital Holdenville, Oklahoma
10 UCP Manhattan
11 Rush Copley Med Center Aurora, IL
12 Crouse health Syracuse, NY
13 Eastar Muskogee, OK
14 Washington regional medical center Fayetteville, AR
15 Penn highlands healthcare Dubois, PA
16 Anderson hospital Maryville, IL
17 Mena regional health system Mena, Arkansas
18 Rush university medical center Chicago, IL
19 St. Elizabeth healthcare Kentucky
20 FRHS Nebraska
21 Tulare regional medical center Tulare, CA
22 Saint Barnabas Livingston, NJ
23 Easton Med Easton, PA
24 Sharp Healthcare Sharp healthcare - San Diego
25 Saddleback memorial Laguna hills, CA
26 Greeley county health services Tribune, Kansas
27 NYC HHC New York City, NY
28 University of Michigan Michigan
29 Maury regional health system Columbia, TN
30 Virginia hospital center Arlington, VA
31 SJH North California
32 Lee memorial health system Fort Myers, FL
33 Hospital Authority of South Carolina Charleston, SC
34 Newton medical center Newton, KS
35 Carle Urbana, IL
36 Central Mt Med Ctr Lewistown, MT
37 St Thomas health Murfreesboro
38 Sanford Sheldon Sheldon, Iowa
39 ThedaCare Appleton, WI
40 Centra health Lynchburg, VA
41 Kimball health services Kimball, NE 69145
42 Texas health Presby Dallas, TX
43 Pawhuska hospital Pawhuska, OK
44 Logan regional Logan, UT
45 Silver cross hospital New Lenox, OH
46 CVHP Covina, CA
47 The Bellevue hospital Bellevue, OH
48 Clarion hospital Clarion, PA
49 VCU health Richmond, VA
50 McCamey County Hospital District McCamey, TX
198
HEALTHCARE IT & DISTRIBUTION February 23, 2016

Question 7: Please describe a positive and a negative about vendors you have used.
Positive Negative
1 Keeping up with new regulations Inflexible
2 Responsive to emerging needs Interoperability is weak
3 Responsive to emergency situations "Nickel and dime" the institution for small changes to
systems
4 Epic systems are very well integrated across our entire network
Cerner over-promised on the functionality
5 Quick response Haggling in times of crisis
6 Integration Lack of integration
7 Integration between modules Slow to adopt innovation
8 Good Bad
9 Price Responsiveness
10 Comprehensive Expensive
11 Configurable Difficult to use
12 Consistent Inter-operability struggles
13 Meditech is customizable With the above strength it gets cluttered with multiple
providers 'customs' showing up in searches
14 Highly customizable Limited customization
15 Leader in this space Dying on the vine
16 Meditech - low TCO Meditech - sometimes slow to make changes
17 Quick Response to Issues Patching process sometimes causes other issues.
18 Ease of use Cost
19 Vendor engagement Vendor disengagement
20 MEDITECH works great at smaller facilities Siemens support is awful and expensive
21 OEM Strategic vision Overly complex
22 Stability Bureaucracy
23 Service Pricing
24 Better workflow Costs
25 Very knowledgeable about product Hard to get changes made
26 Integrated, single patient chart Iterative SDLC methodology
27 Customer centric Expensive
28 Easy to customize Hard to implement
29 Vendor is willing to listen to the customer Slow to market with newer technologies
30 Breadth of functionality Cumbersome to design and build
31 Easy of use / flexible Cumbersome
32 There are good clinical products on the market now (Epic, Cerner)
There are also weak ones - confusing the market
33 Ease of use, features and functions Multiple databases
34 Meditech is the most affordable for our needs. None other used
35 Delivers what is sold Poor implementation and delivery
36 Good pricing Slow response, doctors think it’s cumbersome
37 Integrated system with progressive development Interface challenges
38 Customer focused Too many clicks
39
All vendors try to do the right thing. Epic is very customer focused, Meditech works very well for the functions it supports
Cerner is very focused on shareholder value, both Epic and Cerner are too expensive and not working to help reduce healthcare costs to consumers
40 Commitment to Interoperability Common platform for both inpatient and outpatient systems
41 They try hard They fail often
42 Flexibility System Navigation
43 Cost effective, reliable, intuitive Archaic programming platform upgrade failures
44 Ability to modify clinical applications Revenue Cycle Mgmt.
45 High level of interoperability Not Strategic
47 Functionality Too many upgrades and down time
48 Costs Costs
49 Integrated throughout Expensive, nickel and dime
50 Good support Not user friendly
199
HEALTHCARE IT & DISTRIBUTION February 23, 2016

Question 8: Why will they be changing their clinical IT vendor?
2 Sunset of current product
11 Conformity throughout the system
12 Expanded reporting needs
18 Moving to Epic in patient for system integration
20 Migrating from Siemens
21 Moving from Siemens OEM to Cerner OEM
22 Integrate with rest of system
29 Vendor's ability to respond to the changing environments and provide a sign record
30 End of contract
31 Converting to system standards
40 We are leaving McKesson - Their Paragon product has not been able to develop a large scale single solution for health systems
41 Not integrated
43 Current system is not meeting needs of providers, GL and patient accounting are not reliable
Question 8: Has that deal already been signed or will it be signed in the future? Specify calendar year.
11 2017
20 2016
22 2016
29 2017
30 2016
31 2016
40 2016
41 2016 or 2017
43 December 2016
Question 9: When will that deal be signed? Will be signed in the future, specify calendar year.
10 2016
14 2017
18 June 2016
20 2016
24 2019
30 2016
31 12 months
40 03/31/2016
41 2017
43 December 2016
44 2018
49 2018
Question 9: Why will this change occur?
2 Moving to single platform
10 The existing solution is not flexible enough for our expanding needs.
12 Increased reporting needs
14 Architecture and "bolt on modules" of current vendor - McKesson overcomplicating revenue cycle workflow.
18 System integration
20 Antiquated system
21 Q3 16
24 Integration
29 Vendor was unable to match the functionality of our changing needs
30 End of contract
31 System standard
40 We want as many services as possible under a single mega-suite vendor
41 Not integrated and too expensive
200
HEALTHCARE IT & DISTRIBUTION February 23, 2016

43 Current systems don't meet our needs
44 Decline in performance
45 Better integration between Clinical and Financial systems
49 IDX is being sunsetted -need tighter integration
Question 9: Which system will they convert to?
2 Cerner
18 Epic
21 Cerner
24 Cerner
40 Cerner
41 Epic
44 Cerner
Question 10: What is your capital budget in each of the following years and what percentage do you expect to be allocated to
healthcare information technology (HCIT)? Please explain the trend.
1 Replacing major systems
2 Normal growth
3 We see upgrades and enhancements in the pipeline for our HCIT systems
4 Major IT expenditures have been made
5 Constant
6 Estimated based on current expectations.
7 Reasonable expectation for IT vs other capital needs.
8 Currently installing new EMR
9 HCIT equipment not identified yet
10 We will be implementing a few new items (BI and accounting) in the 2016 calendar year.
12 Based on giving and allocated dollars
13 Steady state budgeting
14 As MU stages require new functionality typically the IT budget increases for the 1st new year of a MU stage.
15 We usually spend about 2% of the capital budget on IT projects.
16 2017 will have higher percentage as well as we continue long term plan to migrate to Meditech 6.0
17 Bond purchased for 3 years in 2016, 2017, and 2018.
18 Acquiring new technology campus
19 IT expenditures are typically refreshed each yr at 20%. In other words, assets are completely replaced every 5 years to normalize annual spend.
20 Purchase and implementation of EMR
21 Initial investment in new HIS/EHR
22 Merger with another system
23 Expansion
24 More being invested in construction
25 Increasing use of IT in clinical areas
26
Last year we appropriated a bit more than normal to cover the cost of meeting MU2 in the hospital. We anticipate additional expenditure for MU3 this year and next. Sometime around 2019 we are going to have to look at forklifting new equipment to replace outdated onsite equipment or move to hosted solutions. Either way, there will be significant increase in costs.
27 Heavy investment upfront for epic and then subsides
28 Consistent trend
29 Normal growth and replacement
30 Capitalizing a system conversion
31 Constant trend
32 We have replaced all our core systems with Epic. Much of the capital will now be implementation labor for new add-on modules, though there will be some new software purchases
33 HCIT CAPX will remain flat as overall CAPX spending will increase significantly because of new hospital construction
34 In 2016 and 2017 we will be purchasing and implementing the 6.1 Meditech upgrade
35 Have implemented all major systems... In maintenance mode at this point
36 Not projected out past 2017. Major investments upfront for meaningful use, then some back off after that. May have to do more to be able to manage ACO and value based purchasing
201
HEALTHCARE IT & DISTRIBUTION February 23, 2016

37 Steady expansion and upgrade plans
38 We should be at a point that we are reducing costs because we will be fully functioning at meaningful use
39 IT spend will be flat to lower in the next couple of years. In 2017 considering a new Acute Care facility. Spending after that will flat in '18 then increase in '19 to support managed care initiative (Total Cost of Care).
40 Big spending upfront as we convert to a new mega-suite vendor
41 We should be at fixed HCIT 2016-2019
42 Consistent trend in investment to modify and improve IT system
43 Large investment was made in EMR for 2015. Planning replacement with hosted service model for 2017. Hospital expansion planned for 2018
44 We will be spending less on IT, given we installed our EMR in 2015
45 No overall changes anticipated
47 Constant upgrade cost and replacement for hardware
49 Major infrastructure and buildings being done starting next year
50 Capital budget will increase incrementally as will HCIT investment.
Question 11: How do you expect the value of signed contracts with your core HCIT vendor to change relative to 2014? Why?
1 Replacing major systems
2 Per plan
3 We don't see any major changes to value.
4 Add population health module
5 Negotiation
6 Small increases of 2-3%
7 Expenses continue to rise and addition of more technology
8 Opinion
9 The trend we are seeing shows a steady increase
10 Just general heavier use of technologies in all sectors of our business. Also, mobile is increasing and costing more.
11 No need to increase
12 Cost are increasing as demands on data increase
13 No major changes to reporting expected until 2017
14 Expansion of health system, growth in integrated providers, and new construction on existing campus.
15 We spent well above or average amounts in 2013 to meet meaningful use. We are not back to normal levels.
16 No major new functionality that will be implemented. Once we upgrade to 6.x I would expect improvements in the Rev Cycle processes
17 Value has increased each year for the previous 12. Trends indicate no change soon.
18 They keep raising prices
19 Small changes in consumer price index drive software maintenance agreements
20 Still unsure
21 Phases of implementation and increase in scope of operations.
22 Population health
23 Changing population
24 More modules and functions
25 Inflation clause
26 Each year sees standard increases as well as additional requirements.
27 Continued investment in optimization.
28 More modules to implement
29 IT requirements to address population health and risk-based contracts
30 Renegotiating after contract expiration
31 We have escalators in contract
32 We have a acquired a lot of new software - will be leveling off
33 Additional LIC needed
34 We are updating to their 6.1 system
35 Stable environment
36 As time progresses will need to consider upgrades
37 Leverage capability of parent organization
38 The value should remain constant
39 As we add more functionality and grow our business our costs (operational) will increase accordingly
40 We are leaving this core vendor for Cerner
41 Major cost paid for, it’s a cloud product
202
HEALTHCARE IT & DISTRIBUTION February 23, 2016

42 Increase in spending on EMR and revenue cycle both for compliance and to meet changes in payment
43 Moving to hosted services for EMR and financial systems. Planning numerous services expansion projects
44 EMR installed in 2015
45 No overall changes
46 Unchanged
47 Upgrades
48 Mu3
49 Because Cerner is ridiculously adept and squeezing more and more money out of clients - more things are becoming subscription based as well
50 The value has increased year over year since 2008. There is no reason to believe this will change.
Question 13: Which vendor(s) are your employed doctors using now (check all) and if they will be switching to a new vendor,
which will they be switching to (check all that apply)? Please explain.
1 Change to Epic
2 Migrating to new platform
6 All practices are put on Athena at time of acquisition
7 Integration with hospital system
12 I am not significantly engaged in this arena
14 We are moving to consolidation of ambulatory EMR vendors. Either it will be Cerner (for full integrated health system workflow) or Allscripts.
15 We plan to migrate our physicians from GE to Cerner over the next 3 years.
17 Integrated with Hospital HIS.
18 Expanding EMR
20 Still evaluating
21 Move from NG to Cerner
24 Long term integration
25 Some next gen doctors will switch to epic
27 System license for epic
29 We are currently in a selection.
30 Contract expiration
31 Changing standard.
32 All employed docs are now on Epic
34 We are planning to utilize their 6.1 system which will unify the physician's and hospital records into one
36 Athena works well and is cost effective, and will communicate with CPSI on hospital side
37 System standard and no switch anticipated
40 We use a variety of outpatient systems currently across an employed group of 300+ providers. The plan is to consolidate to Cerner.
43 Moving employed physicians to same EcW
Question 14: Is it important for the physicians in the community (employed or affiliated) to be on a local hospital’s IT platform in
order to be able to participate in ACOs, bundled reimbursement, and other population health related items? Why?
Yes or No? Why?
1 No We can exchange what we need
2 Yes Makes sharing info and coordinating care easier
3 Yes We want our contracted physicians to be on our platform so that it is easier to integrate them with POE and resulting.
4 Yes Easier sharing of complete records or patient care and easier referrals between doctors
5 Yes Ease of communication
6 No It would be nice, but certainly not a requirement. Just necessitates additional data mining.
7 No Employed will be on hospital system, will be difficult to move affiliate.
8 Yes Ease of information sharing
9 Yes Ease of use
10 Yes Data collection and analysis.
11 Yes Interfacing information
12 No RHIO and Care Coordinators come into our system(s)
13 Yes It is important for continuity of care reduced 'repeat' exams and to meet ACO.
14 No We are using claims extraction tools and another third party to manage the cost of care across the
203
HEALTHCARE IT & DISTRIBUTION February 23, 2016

bundled continuum.
15 Yes Makes it much easier to get access to the key information
16 Yes Ease of data integration and thus reporting
17 No Not necessary at this time. Vendors used at other locations are able to work with our facility through an HIE.
18 Yes For all the benefits of the Affordable Care Act
19 Yes Clinical integration and sharing of clinical data / reporting with disparate solutions is just too difficult to manage.
20 Yes Better for continuity of care
21 Yes Exchange of information
22 Yes Care coordination
23 No We have seamless interfaces
24 Yes Care coordination
25 No Reports can be integrated with inpatient and outpatient data
26 Yes All of our systems (ambulatory and inpatient) are centrally housed and maintained.
27 Yes Helps with integration and data sharing
28 No We have a monopoly
29 Yes Payer based criteria
30 Yes Continuity of patient data at all points of care for the patient.
31 Yes Yes, it is important
32 Yes Important to share information but there is a trust issue among community physicians with doing that
33 Yes One record and one database makes it much easier to manage a patient's care
34 Yes Being on one record helps improve documentation and reduces physician frustration with more than one system
35 No We work primarily with our employed docs (400)
36 Yes Service will need coordination, and for that to happen IT must encompass all care
37 Yes Beneficial to access and share patient information to facilitate continuity of care
38 Yes From a patient care standpoint only
39 Yes Sharing of patient data for quality improvement
40 No We will never have all physicians (non-employed) on the same system as the hospital. Instead, we are using an IBM data warehouse strategy with connections to all providers using Relay Health.
41 Yes Negotiate with strength
42 Yes These are primary initiatives and the physicians must be supportive and active on the IT system
43 Yes We will negotiate rates for the physician and hospital and need reliable quality indicators
44 Yes Necessary for successful Population health mgmt.
45 Yes Sharing of data
47 No Not important currently. Maybe in the next three to five years
48 Yes TBD
49 Yes Because payment reform is coming and coming fast
50 No This is a small community. There are no physicians outside of our facility in this area.
Question 14: If athenahealth offers a solution to your physicians that would cover the “front-end” of a hospital, inpatient EMR
solution, though the back-end is still a different vendor such as Meditech, Cerner, or Epic, would this be enough for you to include ATHN Athena in a network wide IDN EMR proposal and would this make you more likely to purchase / consider athenahealth for physician clinicals and a hospital solution? Please explain.
Response Explain
2 We would consider Athena, but we’d still be more likely to go with Epic or Cerner or another IDN solution
Prefer a fully integrated environment but willing to review pro and cons
3 Yes, we are likely to consider Athena
Some of our outreach practices use Athena and if it would make their access to our data more seamless, we'd consider moving to them.
4 No, this doesn’t make a difference; we want the hospital and doctors on one platform Epic already in place for all
5 We would consider Athena, but we’d still be more likely to go with Epic or Cerner or another IDN solution Reputation and confidence
8 No, this doesn’t make a difference; we want the hospital and doctors on one platform New EMR
204
HEALTHCARE IT & DISTRIBUTION February 23, 2016

9 No, this doesn’t make a difference; we want the hospital and doctors on one platform Change is difficult for our providers
10 Yes, we are likely to consider Athena
I'd want to see the solution and how it's handled both at the front end; and how simply it works with another vendor in the backend.
11 We would consider Athena, but we’d still be more likely to go with Epic or Cerner or another IDN solution Better product
13 Yes, we are likely to consider Athena It would meet our needs
15 No, this doesn’t make a difference; we want the hospital and doctors on one platform
Full integration at the very core of the EMR platform is key for us.
16 No, this doesn’t make a difference; we want the hospital and doctors on one platform Lower TCO for one system
18 No, this doesn’t make a difference; we want the hospital and doctors on one platform System integration is key
19 No, this doesn’t make a difference; we want the hospital and doctors on one platform
Single platform drives the same clinical alerts and workflow
20 We would consider Athena, but we’d still be more likely to go with Epic or Cerner or another IDN solution Better for integrated system
22 No, this doesn’t make a difference; we want the hospital and doctors on one platform Good product, we are too deep
24 No, this doesn’t make a difference; we want the hospital and doctors on one platform
Don't believe it would be viable for a number of years for large IDN's
26 No, this doesn’t make a difference; we want the hospital and doctors on one platform
We do not want to have to manage multiple contracts and systems. More importantly, the problem of integration of patient information and how that affects care is minimized with the same vendor across the enterprise.
27 No, this doesn’t make a difference; we want the hospital and doctors on one platform Simplicity. Reduce complexity. Costs.
29 No, this doesn’t make a difference; we want the hospital and doctors on one platform
Our selections are needs based and our clinical surveys are showing a single record is most important to our providers
30 No, this doesn’t make a difference; we want the hospital and doctors on one platform
We will be going with a fully integrated DB and application solution
31 Yes, we are likely to consider Athena They have a great solution.
32 No, this doesn’t make a difference; we want the hospital and doctors on one platform
I think the key question is would an Athena solution be viable for non-employed docs in order to work alongside Epic for our employed docs, in order for both to coexist optimally in an ACO
33 No, this doesn’t make a difference; we want the hospital and doctors on one platform
So much easier for caregivers to use the same system across all care settings
34 Yes, we are likely to consider Athena We are currently exploring Athena offerings.
36 Yes, we are likely to consider Athena Already have it
37 We would consider Athena, but we’d still be more likely to go with Epic or Cerner or another IDN solution Parent company has network standard
38 No, this doesn’t make a difference; we want the hospital and doctors on one platform
It is important to have the same information available throughout the delivery system
39 Yes, we are likely to consider Athena If the user interface is easy for clinicians to navigate
41 Yes, we are likely to consider Athena We are there already
42 No, this doesn’t make a difference; we want the hospital and doctors on one platform
We are satisfied with Epic's higher enterprise level platform
43 No, this doesn’t make a difference; we want the hospital and doctors on one platform We want single source vendor if possible
44 No, this doesn’t make a difference; we want the hospital and doctors on one platform Want an integrated system
48 Yes, we are likely to consider Athena What are the annual costs?
49 No, this doesn’t make a difference; we want the hospital and doctors on one platform The investment to date is just too large
205
HEALTHCARE IT & DISTRIBUTION February 23, 2016

Question 15: Please describe your experience with your vendor.
3 Amicable and easy. No major issues.
12 Difficult
14 Excellent experience. Knowledgeable providers assisting with coding queries.
16 Good thus far
17 We are utilizing CPSI (Trubridge) to assist with coding and billing services.
21 Nickel and dime
29 Very positive
31 Both vendors have been good to us
32 Good
33 Medassets serves as intermediator between provider and payer; editing and scrubbing claims, providing remittance information
37 Improving
38 Ok
40 Both vendors do a good job, although Athena Health's model can get expensive for high dollar specialty outpatient services.
41 Painful as Athena converts Razor
43 Small company that lacks resources and does not currently meet industry benchmarks
44 Mixed.
48 Okay
Question 15: Will you purchase more or less from your revenue cycle vendor in the future? Why?
Response Why?
3 No Change We don't think we'll need more services.
12 Will buy less Better alternatives
14 No Change Volume at current levels fits within budget guidelines.
16 No Change Reviewing our progress this year
17 Will buy more Opportunity for another service meets one of our needs.
21 Will buy less Too expensive for commodity service
29 No Change No immediate needs to change
31 Will buy more We continue to see a greater reliance on vendors.
32 No Change We are already purchasing what we need
33 No Change We have all functionality needed
37 No Change Standard contract
38 No Change Get what we need
40 Will buy less We want to see how Cerner's rev cycle product can perform.
41 Will buy less More control in house
43 Will buy less Does not meet customer expectations
44 Will buy more Feel they know RCM better than Cerner
48 No Change Gets the job done.
Question 16: Please explain why and which vendors you will use.
1 Epic
2 Use Cerner
3 We're not certain which vendors we'll work with, but we believe these are critical investments to our HCIT capacity.
4 Pop Health for better ACO compliance HIE if our area gets together on one platform
5 We program most of our own
6 Not sure which vendors will be considered.
7 Influence Health (Navigate) for population health management. Tiani for HIE.
9 Cisco, 3m, and HMS
10 These are the most important components for us to strategically build up our HCIT capabilities. Vendors are to be determined.
11 We like them
12 We are enhancing our revenue base due to the consistent need to focus on quality and fee based services ever changing dynamic
206
HEALTHCARE IT & DISTRIBUTION February 23, 2016

13 Athena and meditech
14 We will retain current clinical EMR vendors and assess vendor options for acute care revenue cycle replacement.
15 These are key strategic initiatives and we use Cerner for these solutions.
16 Medicity for the HIE
17 SHARE Arkansas for our HIE. CPSI for Stage 3 software items in our HIS.
18 Epic
19 Currently using Advisory Board products to analyze utilization of claims
20 Depends on overall vendor selection
21 Cerner
22 Cerner, in analysis stage on others, Cisco
23 Cerner
24 Cerner and Cisco
25 Expand capabilities. No vendors have been chosen at this time.
26 These areas are under constant flux and will require additional software and/or hardware to address.
27 We have many taco and health arrangements.
28 We have everything
29 A variety of vendors at this time, we are evaluating those relationships.
30 These will be built into our system selection process this coming year. EPIC and Cerner will be the primes but we may need to supplement analytic capabilities
31 Pop health is a priority right now
32 Not sure which vendors yet - probably Epic or IBM (phytel/explorys)
33 Probably Epic but could go with Optum, Verisk, Phytel, Medventive, Evolent?
34 We have not chosen vendors for these projects. We do use the Advisory Crimson product.
35 Not sure what vendors... Know we need better analytics for population health
36 Need to cover to operate in the future
37 In-house development of technology
38 Patient access and upfront collections are important right now
39 Pop health - Epic, stage 3 unknown, wireless communications - Cisco, Charge master - Craneware
40
If you're not working on most of these items as a health system then you're not doing your job. We use Premier for ACO and Bundled Payment consulting, looking forward to Cerner's pop health platform, looking forward to Cerner's rev cycle systems.
41 Mostly with Athena
42 Will use Epic and likely a third party vendor such as Athena Health.
43 Highest current priorities for a hospital our size
44 Likely Accretive, possibly others for revenue cycle. Will explore other vendors for PHM.
47 Have already invested in some. Many will use McKesson or McKesson owned companies such as Relay Health
48 Medhost and Clinical Connect/UPMC
49 Cerner as our core vendor - so need to continue the tight integration
50 MU and HIE investments will be necessary in the coming years to meet guidelines. These investments will be through HMS/Medhost and eClinicalworks.
Question 16: What year do you plan to invest in these initiatives?
ACOs Population Health Management
ICD 10s Stage 2 Items Stage 3 Items Health Information Exchanges
1 -- 2016 -- -- -- --
2 2015 2015 -- -- -- 2015
3 2018 2018 -- -- -- 2018
4 -- 2017 -- -- -- 2017
6 -- 2017 -- -- -- --
7 -- 2016 -- -- -- 2016
8 -- -- 2015 -- -- --
9 -- -- 2016 -- -- 2015
10 -- 2017 2016 2016 2018 2016
11 -- 2018 2016 -- -- --
12 2017 2016 -- -- -- 2016
13 2015 2015 2015 -- -- --
14 -- 2016 -- -- 2017 --
207
HEALTHCARE IT & DISTRIBUTION February 23, 2016

15 2018 2017 -- -- -- 2017
16 -- 2017 -- -- -- 2017
17 -- -- 2016 -- 2017 2016
18 -- 2016 2016 -- 2016 --
19 -- 2016 -- -- -- --
20 2017 2017 -- 2015 2017 --
21 -- 2016 -- -- 2016 --
22 -- 2016 -- -- -- 2016
23 -- -- 2016 2016 2016 2015
24 -- 2017 -- -- -- --
25 2017 2017 -- -- 2017 --
26 2017 2017 2016 -- 2016 2016
27 2016 2017 -- -- 2016 --
29 2017 2017 -- -- 2017 2016
30 -- 2017 -- 2016 2017 2016
31 2016 2017 2016 -- -- --
32 2017 2017 -- -- -- --
33 2018 2018 -- -- -- --
34 -- 2017 -- -- -- --
35 -- 2017 -- -- -- --
36 2016 2017 -- -- 2016 2016
37 -- 2017 -- -- -- 2016
39 -- 2017 -- -- 2017 --
40 2018 2018 2016 -- 2017 --
41 -- 2018 -- -- 2018 2018
42 -- 2016 -- -- -- --
43 -- -- -- -- -- 2017
44 2017 2017 -- -- 2017 --
45 2016 2016 -- -- 2017 --
46 -- -- 2016 -- -- --
47 -- -- -- -- 2017 --
48 -- -- -- -- 2017 2016
49 -- -- -- -- 2016 2015
50 -- -- -- 2016 2018 2016
Wireless Communication
Bundled Reimbursement
Patient Access Revenue Cycle Apps
Back-End Revenue Cycle Apps]
Denials Management
Charge-master Related Products
1 -- -- 2017 2016 2017 2016
2 2015 -- -- -- -- --
8 2016 -- -- -- -- 2016
9 2017 -- -- -- -- --
10 2016 2017 -- 2016 -- --
12 -- 2016 -- -- 2017 --
14 -- -- 2017 2017 -- --
15 -- 2017 -- -- 2016 --
17 2016 -- -- -- -- --
18 2016 -- -- -- -- --
19 2017 -- -- -- -- --
21 -- -- 2016 -- -- --
22 2016 2016 -- -- -- --
23 2015 -- -- -- 2015 --
24 2018 -- -- -- -- --
25 2016 2018 -- -- -- --
29 -- 2017 -- -- -- --
30 2016 2017 2017 2017 2017 --
33 -- 2017 -- -- -- --
34 -- 2016 -- -- -- --
208
HEALTHCARE IT & DISTRIBUTION February 23, 2016

36 -- 2017 -- -- -- --
38 -- -- 2020 -- -- --
39 2016 -- -- -- -- 2016
40 2017 2016 2016 2016 2016 2016
41 -- -- -- -- -- 2017
42 -- -- 2016 2016 2016 --
43 2016 2017 2017 2016 -- --
44 -- -- 2018 -- -- --
45 2017 2016 2017 2017 2017 2017
47 -- -- 2016 -- -- --
49 -- 2017 2018 -- -- --
Question 18: What is your top IT investment priority in 2015 and 2016 and why is it a top priority?
Top IT investment priority in 2015 and 2016 Why is it a top priority?
1 Security Threat environment
2 System replacement Need new environment
3 Infrastructure upgrades, $3,500,000 Old infrastructure that needs to be replaced
4 Enhance clinical tools fit into the flow of our EMR for use by physicians Gives physicians information at point of care
5 Digital radiology Area of need
6 Security. Because the threats are becoming increasingly sophisticated, and we may not have sufficient tools/skills.
7 Upgrade with existing vendor Unification of all areas on one platform
8 EMR facility wide Would like to complete the project
9 Infrastructure To support the increase in use
10 Infrastructure and financial systems. We will spend approximately $1.3 million combined.
Bandwidth and mobility; tight financial controls necessary in this environment.
11 Meaningful use $$
12 Interoperability Due to ongoing reporting demands
13 ICD-10 included in planned upgrades to systems To meet regulatory requirements
14 Infrastructure replacement for expanded facility (new construction).
Market growth in clinical service lines and running out of medical surgical available beds.
15 Population health Need to position systems for the shift from volume to value
16 2015 was MU stage 2, 2016 is more of a review MU incentive payment
17 IT Infrastructure at roughly $750,000. Infrastructure is aging and no longer meets capacity needs for our HIS.
18 Lawson ERP implementation Huge process improvement and ROI
19 Population health Developing clinically integrated pho
20 Evaluating vendors Migrating away from Siemens
21 EHR/HIS and Financials New implementation to achieve MU
22 Population health Risk contracts
23 Stage 3 Reimbursement
24 Surgical System replacement Integration
25 Clinical systems integration Improve communication between inpatient and outpatient areas
26 Mu3 Required and reimbursable
27 Epic deployment Everyone on one platform
28 Analytics We want to drive decisions based on data
29 New EMR selection 40M Need to evolve
30 Total EHR Replacement, $50M Contract expiration
31 Meaningful use Get funds
32 Replacing ancillary systems, data warehouse, analytics, population health
Replacing old systems – ancillary, leveraging data for ACO/pop health
33 Changing nightly data back-up technology and establishing a Hot Spare data center Speed up data back-up process and Business continuity
34 Identify and commit to Physician EMR, possibly Athena or Meditech 6.1
The current product of the employed physicians (McKesson -PDS) needs changed.
209
HEALTHCARE IT & DISTRIBUTION February 23, 2016

35 Better analytics Need "next generation" data to manage pop health
36 Being able to comply with ACOs and last stage of meaningful use Future revenue streams
37 Data lake and information exchange Risk stratification and clinical information exchange
38 Cleaning up ICD 10 Accurate billing and coding
39 Added data security Threat to our customers
40 Execute a meg-suite solution for replacing McKesson Horizon and all Allscripts products
McKesson product is being sunset and the McKesson replacement solution is not viable
41 Athena EMR and Revenue Cycle It is a must
42 Revenue cycle management Efficiency in this area is a known deficiency
43 New vendor selection. Currently considering BETA with vendor who will make the investment
We have concerns in regards to the financial viability of current vendor
44 PHM To be successful in shift to value based reimbursement
45 Pop health, infrastructure Strategic plan
46 ICD 10 Revenue
47
Upgrades to current release including hardware. Approximately 1.2 million between software and hardware. Must do this for McKesson support
48 Medhost MU 3 modules 56000 To reach MU3
49 Oncology module Too many safety events related to chemo administration
50 The top IT investment for 2015/2016 is infrastructure. Investment in infrastructure was the top investment/priority due to moving into a newly built facility.
Question 19: What is your top capital budget allocation priority in 2015 – 2016 and how does IT fit into it?
Top capital budget allocation priority in 2015 – 2016 How does IT fit into it?
1 Renovations None
2 Ambulatory expansion. IT is at the table Ambulatory software and hardware
3 Upgrades to MR and CT facilities Infrastructure to support image transmission
4 Physical offices being consolidated into larger clinical buildings EMR, network, etc.
5 Digital radiology Network and staff
6 Expansion on acquired practices Infrastructure, connectivity and support of multiple additional locations.
7 Building updates and new cath lab machine Small IT component to these items.
8 There are many There are many
9 Communications All IT related
10 Building renovations -- Embedded IT infrastructures.
11 Conversion to Epic Same
12 New EMR Software
13 ACO Support of data and collection in real time
14 Adding second MRI PACS interoperability of image to EMR
15 Construction of new buildings to develop new services areas.
IT provides the systems and software to support the delivery of the new services.
16 Private patient rooms Cabling, network infrastructure
17 Meaningful use stage 2 Meaningful use stage 2
18 System integration Capsule deployment
19 Building new ambulatory center in new service market IT infrastructure to support new plant
20 Construction Wiring and infrastructure
21 ? Same as above
22 Construction It initiatives
23 New construction Hardware, software
24 New facility construction IT infrastructure to support
25 Expand surgical services Hardware and software
26 Hospital remodel Insuring proper location of equipment as well as appropriate communication systems (e.g. Wiring, etc.).
27 Epic implementation Almost completely IT
28 New building IT infrastructure
29 Infrastructure Data center and other supporting technologies
210
HEALTHCARE IT & DISTRIBUTION February 23, 2016

30 20 3, we are just in the planning stages and vendor selection this year
31 Pop health Pop health
32 Construction A part of our new facilities expansions
33 Brick and mortar; build new hospital Outfit new hospital with IT infrastructure
34 IT tops the capital budget list It tops the capital budget list
35 Clinical equipment None
36 New emergency room EMRs and integration into system
37 AESA project Data and analytics tools
38 Buildings Very little
39 Construction of a Cancer Center Equip the facility
40 Replacement of the IT system Cerner
41 EMR Rev cycle via Athena fees Same
42 25000000 3000000
43 CT and new PACs Interface and image storage
44 Robot A component of this
45 New construction Technology to support new building
46 EMR interoperability 20%
47 Ct scanner Software upgrades
48 New network infrastructure $410000.00 410,000.00
49 Parking remediation Very little
50 Unable to quantify at this time. SAA
Question 21: For each item you plan to spend more on, please specify technologies/products under consideration and reason for
purchase. For each item you plan to spend less on, please specify reason for decrease in spending. Infrastructure Improvements/Remodeling
Spend More Spend Less
4 AVAYA network additions --
6 Storage refresh --
9 Avaya, Cisco, HP, and Lenovo. Replace aging equipment --
10 Cisco mostly --
14 Apps, desktops, switches to support new construction. --
15 -- Cost Cutting
16 Private room project --
18 Data Center upgrade --
20 Construction --
22 New wing --
24 New bed towers --
25 Expanding surgical services --
26 Remodeling facilities will involve changes to IT infrastructure --
27 Networking --
28 IT network --
31 Needed for compliance --
32 Construction --
33 Renovations of hospital floors --
36 -- Just finished ED project
38 Flow changes necessary --
39 -- Current on needs
41 Paving and HVAC --
43 Considering replacement facility --
44 New wing- code reasons --
45 New building construction --
48 Network switches --
49 We have crumbling and aging infrastructure --
211
HEALTHCARE IT & DISTRIBUTION February 23, 2016

Clinical HCIT Systems (EMR/Lab/Pharmacy)
Spend more Spend less
7 Upgrade to system --
15 -- Cost Cutting
17 Stage 3 Meaningful use Applications -- 24 Cerner alerting, pop health --
26
The cost of these systems is always increasing and constantly requires augmentation to meet change requirements
--
27 Epic implementation -- 29 Replacing system -- 31 -- Trending down after meaningful use
32 Replacing old modules -- 40 Cerner -- 43 Purchasing replacement system -- 44 -- Installed in 2015
47 Upgrades -- 49 More and more functionality needed --
Equipment for the Operating Room
Spend More Spend Less
1 Expansion -- 14 Replacement instrumentation -- 15 -- Cost Cutting
17 New surgical procedures -- 22 New hybrid room -- 31 Replacement -- 32 Replacing aging equipment -- 33 Hybrid OR's -- 34 Ortho equipment -- 39 New technology -- 41 New air transfer -- 48 -- Just updated two OR rooms
X-Ray/Imaging Equipment
Spend More Spend Less
1 Age of equipment -- 3 Enhanced CT services -- 6 Modality purchases -- 7 New cath lab --
14 MRI and CT additions to handle more patient volume. -- 22 New 256 CT -- 31 Replacement -- 32 -- Have already replaced a lot of equipment
33 -- Refresh of existing technology
36 -- Just upgraded MRI and nuclear med
41 Portable X-ray -- 43 Replacing CT and Ultrasound -- 47 CT scanner --
Beds / Stretchers / Patient Lift Systems
Spend More Spend Less
10 Refresh period -- 14 New construction -- 16 Private room project -- 31 -- Not needed right now
32 -- Have already replaced
41 -- New beds last year
43 Replacing all beds in the facility --
212
HEALTHCARE IT & DISTRIBUTION February 23, 2016

44 Hill Rohm beds -- MRI Equipment
Spend More Spend Less
3 Enhanced MR services -- 14 Additional MRI to support more patient volume. -- 18 Increased workload -- 19 Replacing obsolete technology -- 31 Need open MRI -- 32 Replacing old equipment -- 36 -- Just upgraded MRI
37 -- Current equipment is up to date
Digital Mammography
Spend More Spend Less
1 Age of equipment -- 3 Better diagnostics -- 7 New 3D tomo machine --
14 -- Market flat in volume
15 Tomosynthesis -- 18 Increased workload -- 31 Need 3d tomo -- 32 Expansion -- 36 May need 3-d -- 37 -- Current equipment is updated
39 3D technology --
44 -- Got digital
Ventilators
Spend more Spend less
14 Increased acuity on higher volume of patients. -- 31 Need replacements -- 32 -- Have replaced
33 -- Up grading some vents
36 -- Less inpatient need
Radiation Oncology Equipment (i.e., Linear Accelerators, etc.)
Spend more Spend less
16 New service -- 19 Growth of service line -- 22 Cyberknife -- 25 -- Fewer procedures
31 Need upgrade -- 37 New device at one of the facilities -- 39 Building cancer center -- 44 -- Current good for few yrs.
Da Vinci Systems
Spend More Spend Less
14 -- No increase in volume.
25 added new robot system -- 31 adding another robot -- 32 -- have replaced
33 -- clinical results not compelling
44 Need for recruitment --
213
HEALTHCARE IT & DISTRIBUTION February 23, 2016

“Rio” / MAKO (hip/knee) Systems
Spend More Spend Less
14 Higher joint volume business -- 17 Surgical devices -- 31 No value --
ACKNOWLEDGEMENTS:
Shannon Leahy, Tessa Romero and Ben Rossi of Leerink Partners Equity Research contributed to this report.
Their contributions are greatly appreciated.
214
HEALTHCARE IT & DISTRIBUTION February 23, 2016

HEALTHCARE IT & DISTRIBUTION February 23, 2016
Disclosures AppendixAnalyst CertificationI, David Larsen, CFA, certify that the views expressed in this report accurately reflect my views and that no part of mycompensation was, is, or will be directly related to the specific recommendation or views contained in this report.
I, Steven Wardell, certify that the views expressed in this report accurately reflect my views and that no part of mycompensation was, is, or will be directly related to the specific recommendation or views contained in this report.
215

HEALTHCARE IT & DISTRIBUTION February 23, 2016
Distribution of Ratings/Investment Banking Services (IB) as of 12/31/15IB Serv./Past 12
Mos.Rating Count Percent Count PercentBUY [OP] 161 73.20 63 39.10HOLD [MP] 59 26.80 4 6.80SELL [UP] 0 0.00 0 0.00
Explanation of Ratings
Outperform (Buy): We expect this stock to outperform its benchmark over the next 12 months.
Market Perform (Hold/Neutral): We expect this stock to perform in line with its benchmark over the next 12months.
Underperform (Sell): We expect this stock to underperform its benchmark over the next 12 months.The degreeof outperformance or underperformance required to warrant an Outperform or an Underperform rating shouldbe commensurate with the risk profile of the company.
For the purposes of these definitions the relevant benchmark will be the S&P 600® Health Care Index forissuers with a market capitalization of less than $2 billion and the S&P 500® Health Care Index for issuers witha market capitalization over $2 billion.
216

HEALTHCARE IT & DISTRIBUTION February 23, 2016
Important Disclosures
This information (including, but not limited to, prices, quotes and statistics) has been obtained from sourcesthat we believe reliable, but we do not represent that it is accurate or complete and it should not be reliedupon as such. All information is subject to change without notice. This is provided for information purposesonly and should not be regarded as an offer to sell or as a solicitation of an offer to buy any product to whichthis information relates. The Firm, its officers, directors, employees, proprietary accounts and affiliates mayhave a position, long or short, in the securities referred to in this report, and/or other related securities, andfrom time to time may increase or decrease the position or express a view that is contrary to that containedin this report. The Firm's salespeople, traders and other professionals may provide oral or written marketcommentary or trading strategies that are contrary to opinions expressed in this report. The Firm's proprietaryaccounts may make investment decisions that are inconsistent with the opinions expressed in this report.The past performance of securities does not guarantee or predict future performance. Transaction strategiesdescribed herein may not be suitable for all investors. Additional information is available upon request bycontacting the Editorial Department at One Federal Street, 37th Floor, Boston, MA 02110.
Like all Firm employees, analysts receive compensation that is impacted by, among other factors, overall firmprofitability, which includes revenues from, among other business units, Institutional Equities, and InvestmentBanking. Analysts, however, are not compensated for a specific investment banking services transaction orcontributions to the Firm's investment banking activities.
MEDACorp is a network of healthcare professionals, attorneys, physicians, key opinion leaders and otherspecialists accessed by Leerink and it provides information used by its analysts in preparing research.
For price charts, statements of valuation and risk, as well as the specific disclosures for covered companies,client should refer to https://leerink2.bluematrix.com/bluematrix/Disclosure2 or send a request to LeerinkPartners Editorial Department, One Federal Street, 37th Floor, Boston, MA 02110.
While IMS Health has been used as a source, the analysis contained herein has been arrived at independentlyby the firm and IMS is not responsible for the analysis or use of the data.
Member FINRA/SIPC. ©2016 Leerink Partners LLC. All rights reserved. This document may not be reproducedor circulated without our written authority.
217

LEERINK PARTNERS LLC EQUITY RESEARCH
Director of Equity Research John L. Sullivan, CFA (617) 918-4875 [email protected]
Associate Director of Research Alice C. Avanian, CFA (617) 918-4544 [email protected]
Associate Director of Research James Kelly (212) 277-6096 [email protected]
Director of Therapeutic Research Geoffrey C. Porges, MBBS (212) 277-6092 [email protected]
Major Pharmaceuticals Seamus Fernandez (617) 918-4011 [email protected]
Le-Yi Wang, Ph.D. (617) 918-4568 [email protected]
Specialty Pharmaceuticals Jason M. Gerberry, JD (617) 918-4549 [email protected]
Derek C. Archila (617) 918-4851 [email protected]
Etzer Darout, Ph.D. (617) 918-4020 [email protected]
Large Cap Biotechnology Geoffrey C. Porges, MBBS (212) 277-6092 [email protected]
Mid and Small Cap Biotechnology Joseph P. Schwartz (617) 918-4575 [email protected]
Seamus Fernandez (617) 918-4011 [email protected]
Michael Schmidt, Ph.D. (617) 918-4588 [email protected]
Paul Matteis (617) 918-4585 [email protected]
Jonathan Chang, Ph.D. (617) 918-4015 [email protected]
Richard Goss (617) 918-4059 [email protected]
Dae Gon Ha, Ph.D. (617) 918-4093 [email protected]
Mayank Mamtani, MSc. (617) 918-4887 [email protected]
Mark Sevecka, Ph.D. (617) 918-4022 [email protected]
Life Science Tools & Diagnostics Dan Leonard (212) 277-6116 [email protected]
Kevin C. Chen (212) 277-6045 [email protected]
Michael A. Sarcone, CFA (212) 277-6013 [email protected]
Medical Devices, Cardiology Danielle Antalffy (212) 277-6044 [email protected]
Puneet Souda (212) 277-6091 [email protected]
Medical Devices, Orthopedics Richard Newitter (212) 277-6088 [email protected]
Ravi Misra (212) 277-6049 [email protected]
Healthcare Services, Managed Ana Gupte, Ph.D. (212) 277-6040 [email protected]
Care & Facilities
Healthcare Technology David Larsen, CFA (617) 918-4502 [email protected]
& Distribution Christopher Abbott (617) 918-4010 [email protected]
Digital Health Steven Wardell (617) 918-4097 [email protected]
Matt Dellelo, CFA (617) 918-4812 [email protected]
Sr. Editor/Supervisory Analyst Mary Ellen Eagan, CFA (617) 918-4837 [email protected]
Supervisory Analysts Randy Brougher [email protected]
Robert Egan [email protected]
Amy N. Sonne [email protected]
Boston One Federal St., 37th Fl.
New York 299 Park Ave., 21st Fl.
Charlotte 227 West Trade St., Ste. 2050
San Francisco 255 California St., 12th Fl.
Boston, MA 02110 New York, NY 10171 Charlotte, NC 28202 San Francisco, CA 94111 (800) 808-7525 (800) 778-1653 (704) 969-8944 (415) 905-7200