61st world statistics congress (wsc) in marrakech, from 16
TRANSCRIPT
1
61st World Statistics Congress (WSC)
in Marrakech, from 16 to 21 July 2017
Implementation of Quality Management - Palestine Case- and its impact on Quality
Dimensions
Ali. H. Hussein
Palestinian Central Bureau of Statistics (PCBS)
Abstract
In the context of increasing and more formal scrutiny of official statistics at national and
international levels and with regard to our goal in the National Strategy for the Development
of Official Statistics (NSDS) that states (Enhance the Quality of Statistics), the Palestinian
Central Bureau of Statistics (PCBS) launched a Quality Management Systems (QMSs) to
enhance and Improve the quality for all statistics to satisfy user needs.
The paper will address two main sections about the implementation of Quality Management
systems in PCBS.
The first one is the historical overview for the implantation of Quality Management systems,
and how PCBS developed each of those systems, where PCBS depending on international
systems managed to develop those systems to comply with local requirements such as ISO
9001:2008 Management System, The EFQM Excellence Model, the European Self
Assessment Checklist for Survey Managers (DESAP), Generic Statistical Business Process
Model (GSBPM), European Code of Practice (COP), Quality Reports. In addition to that,
PCBS developed an internal quality control system to regulate the quality for all statistical
surveys.
Secondly, the paper will focus on explaining how Quality Management Systems improve
Quality Dimensions, by clarifying the function of each system and its impact on every
dimension of the Quality Dimensions: Relevance, Accuracy, Timeliness, Clarity and
Accessibility, Comparability, Coherence and Completeness.
Keywords:, Quality Management Systems (QMS), National Strategy for the Development of
Official Statistics (NSDS), Quality Dimensions, DESAP, COP, GSBPM

2
Introduction About Quality Management System (QMS)
In simple terms a management system is a system for managing ways of working, to
minimize opportunities for things to go wrong and identify improvement opportunities.
QMS is the managing structure, responsibilities, procedures, processes, and management resources to implement principles and action lines needed to achieve quality objectives of an
organization.
A quality management system is an integrated system of principles, methods and best
practices that provide a framework for organizations to strive for excellence in everything
they do. It is a method for ensuring that all activities necessary to design, develop and
implement a product or service are effective and efficient with respect to the system and its
performance, taking into account cost, quality and time.
Quality management is part of the overall management of an organization. It is essentially
concerned with defining the quality policy (goals & objectives) and with implementing this
policy. A Quality management systems helps direct and control an organization with regard
to quality. Quality management systems provide the framework for continual improvement to
enhance customer satisfaction of other interested parties. It provides confidence to
organization and its customers that it is able to provide products/ services that consistently
fulfil requirements.
An organization without a documented QMS is at a disadvantage, because business processes
aren’t standardized, and the resultant recurring problems distract management from focusing
on strategic initiatives to stay ahead of the competition in rapidly changing markets. These
problems are a continuing struggle that frustrate employees and customers, waste time and
materials, and, perhaps most importantly, add unnecessary expenses to the company’s
operation.
Historical Overview for the implantation of Quality Management Systems
Quality Management System ISO 9001:2008
Palestinian Central Bureau of Statistics had started the preparation on establishing a quality
management system since 2008. The objective was to develop a system that will facilitate the
ISO certification. PCBS reviewed relevant literature on the subject of quality management
systems, examined the experiences of similar institutions in the field and conducted gap
analysis to identify requirements necessary to meet the objectives. During 2009, PCBS
identified necessary documents, trained employees on quality related subjects and prepared
needed procedures.
In 2010, PCBS applied the system of quality management in practice and conducted
awareness campaign targeting all of its employees to promote quality values and objectives.
Standard procedures were tested and tailored to meet the needs of PCBS as the provider of
Palestine’s official statistics. Internal and external quality audits were implemented to ensure
compliance with written requirements. In the last quarter of 2010, PCBS received the ISO-
9001:2008 certificate.
3
PCBS experience in implementing the QMS standards includes the following approaches and
good practices:
1. Building the system depending on self capacity
2. Preparing, mainly, the system documents by the same employees who will use those
documents
3. Implement internal audit on monthly bases
4. Accessibility to any employee for all procedures, forms, and instructions
5. is the center of All QMS components are centrally controlled by internal PCBS
website (Intranet)
6. Minimizing the paper signatures and approvals
7. Easy and reliable way to control system documents: the controlled copies are only
those on the PCBS intranet (online)
8. Granting quality management system committee full authorization to prepare and
amend all relevant documents.
9. Yearly quality indicators to be achieved
National Strategy for the Development of Official Statistics (NSDS)
The preparation of the new National Strategy for the Development of Official Statistics
(NSDS) 2014-2018 was based on scientific methodology that reviewed and assessed the
results of the previous NSDS of 2009-2013 to benefit from the accumulated experience and
build on this experience in the drafting of the new NSDS. The diagnosis and analysis of the
national statistical system identifies strengths and weaknesses and ascertains appropriate
solutions. PCBS listed the problems and challenges facing the national statistical system,
analyzed these problems and articulated objectives that will contribute into solving problems
and prioritizing objectives.
A technical team was formed to prepare the NSDS 2014-2018 led by the Director General of
Planning and Development directorate at PCBS and representatives of all PCBS directorates,
under the supervision and guidance of PCBS President. The NSDS 2014-2018 was prepared
in coordination with the Advisory Council for Official Statistics and data users in ministries,
government institutions, universities, NGOs and research centers. lists the names of
participants in the workshops conducted during the preparation of the NSDS.
A SWOT analysis has been carried out for the development of the (NSDS) 2014-2018.
identifying the strengths and the weaknesses in the National Statistical System (NSS). One of
the weaknesses identified; is the limited commitment by some statistical bodies to apply the
adopted standards in addition to weak physical and human resources in most of the statistical
bodies. For specific categories of users there is a weak statistical knowledge.
The EFQM Excellence Model
The EFQM Excellence Model provides a framework that encourages the cooperation,
collaboration and innovation that we will need to ensure this goal is achieved."
4
This is important for PCBS to achieve the third goal of the national strategy to develop
official statistics 2014-2018 (enhancing the quality of statistics), which needs to provide a
scientific basis for the statistical work to achieve and enhance the statistical outputs quality.
PCBS Activities in implementing EFQM
1. Self assessment process has been implemented in accordance with the European
EFQM Excellence conducted by local expert and team from PCBS .
2. Three training sessions were held for EFQM team and senior management regarding
to European excellence model:
• Journey of excellence
• Leaders of excellence
• Assessor
3. A pilot held assessment simulates the main assessment
4. The main 3 improvement project:
• Automation of administrative procedures
• Generic Statistical Business Process Model (GSBPM)
• Pilot Key performance indicators project/National Strategy and
Achievement of Quality Objective.
Follow-up with EFQM Foundation to evaluation improvement projects for certification are
committed to excellence, which is expected to be during the second quarter of year 2017
European Self Assessment Checklist for Survey Managers (DESAP)
The Program of self-assessment is a checklist for a systematic evaluation and assessment of
the quality of statistical surveys data in the statistical systems as translated from the self-
assessment of European management surveys and this checklist follows the existing
European quality of standards and including the relevant key aspects of the quality of
statistical data. It is general and applied to individual small statistics regardless of the subject
matter and methodology of the surveys. this list has been designed as a tool to help project
managers and surveys to assess the quality of statistics they produce and to think about the
procedures for the improvement and development of these statistics.
The checklist is designed so that it is met by the project managers, but it is preferable to the
involve other experts in the evaluation process (such as experts in the methodology), in
addition to the involvement of the technical committee or team in charge of the evaluation
process.
Objectives of the Development of a Self-Assessment program:
A checklist designed to meet a number of fictitious jobs including:
1. Assessment Tool: to assessing the general quality of surveys and give a full picture of
the quality in general.
2. A guide to thinking and reviewing the improvement of actions and processes.
3. Means of simple comparisons with the level of quality.
A Combination of self-assessment program, DESAP:
A checklist was designed in a practical, easy and simple way that is matching with reviewing
every process from A to Z. 15 factors were been identified of the surveys as it would appear
in the chart of Assessment Diagram.
5
Generic Statistical Business Process Model (GSBPM)
The original intention was for the GSBPM to provide a basis for statistical organizations to
agree on standard terminology to aid their discussions on developing statistical metadata
systems and processes. The GSBPM should therefore be seen as a flexible tool to describe
and define the set of business processes needed to produce official statistics. The use of this
model can also be envisaged in other separate, but often related contexts such as harmonizing
statistical computing infrastructures, facilitating the sharing of software components, in the
Statistical Data and Metadata exchange (SDMX). User Guide for explaining the use of
SDMX in a statistical organization, and providing a framework for process quality
assessment and improvement
European Code of Practice (COP)
PCBS adopted (COP) in 2008. During 2010, PCBS contributed to the development of COP
as contents being revised, developed and updated as well as reviewing all documents relating
to questionnaires. PCBS benefited from the European statistics sources and exchange of
experiences in applying COP. After completion of questionnaires review, the content was
modified in wording and sentencing to conform with the English versions of the
questionnaires. Arabic questionnaires are to be approved by Top management and senior
professionals at PCBS as well, COP report explained the results and the situation at PCBS
statistical system, Moreover, the report includes the strengths and challenges for the statistical
system and important recommendations to development. In February 2012, a TA mission
from European Statistics (Eurostat) conducted a review of COP practices to fulfill the
obligations and resolutions adopted by the Statistical Commission of the United Nations. The
mission report concluded that PCBS is on a conventional position and suggested a wide range
of proposals for further development. Afterwards, PCBS transferred a list of improvement
measures and sets mechanisms to specialized authorities, for follow-ups and implementation.
Within PCBS efforts towards developing capacities, the Light Peer Review (LPR) mission
has been received in February 2012 by three consultants from Eurostat being in charge of
implementing it. It is worth mentioning that the implementation of the said mission was in
response to achieving one of the requirements of the NSDS 2009-2013, and in abidance to the
decision made by the UNSC 43rd Session that was held in February 2012 at New York,
stressessing the necessity of implementing such type of reviews, in addition to the fact that
the implementation of such review mission is considered as one of the international good
practices.
LPR Recommendations: The final report of the LPR covered all findings of the review
mission by each principle of the European Statistics Codes of Practice. The report covers (31)
recommendations distributed over the years 2012-2016.

6
Applying the Code of Practice for the European Neighbourhood of South Countries
inside PCBS
The Code of Practice for the European Neighborhood of South Countries is based on 16
Principles covering the institutional environment, the statistical production processes and the
output of statistics. A set of indicators of good practice for each of the Principles provides a
reference for reviewing the implementation of the Code. The National Statistical Institutes
are responsible for the development, production and dissemination of Statistics, together with
governments, and ministries, commit themselves to adhere to the Code. The Principles of the
Code of Practice together with the general quality management principles represent a
common quality framework in the Statistical System.
Working on preparing the Code of joint cooperation between European Statistics and the
European Neighborhood of South Countries through the formation of a Quality working
Group (QWG), that conducted many meetings, and with constant cooperation between its
members to prepare this Code, the Code constitutes a fundamental pillar of the work of the
statistical systems to establishing an effective national frameworks for quality assurance.
Quality Reports
Processes and Data Quality Reports: by follow-up the activities according in project cycle to
GSBPM that are being tested and monitored during implemented the survey, to provide
recommendations to improve the quality of output surveys and statistical data.
National Quality Assurance Framework (NQAF) and the Quality Dimensions
PCBS started its work to establish the NQAF during 2012, and included this project in
Quality department work plan to enhance the Quality for all statistics, in order to achieve the
Quality policy and Objectives which states:
(In line with PCBS mission statement to produce and disseminate coherent, objective, high
quality, and timely official statistics to meet current and future needs of users at the national
and international level in a transparent and appropriate manner)
During 2013, a technical mission was conducted to put the road map for developing the
NQAF, PCBS using the UN template to get it as standard to built the NQAF, after that PCBS
finalized the self assessment Questionnaire, study the other frameworks that we was applied
in PCBS such as COP to create a state of compatibility between different frameworks
During 2014-2015 we finalized the self assessment, and study all improvement points, PCBS
work to strength the NQAF by:
7
1. NQAF is one of the main project on National Strategy for developing the official
statistics
2. Applying the GSBPM for all statistical projects
3. Apply the EFQM
4. Improvement the National Statistical System, and increase the dependency of using
administrative records
5. Preparation of National Quality Assurance Framework Document
6. Commitment of SDG’s indicators
Implementation of Quality Management and its impact on Quality Dimension Labour
Force Survey 2009 – 2011, Special Case
Relevance
This component related to the extent of which statistics would meet current and potential
users' needs, and was measured by the following indicators:
Indicator Application
The main objective
of the survey
Estimating the size of labour force and its proportion to
population, estimating the number of workers in labour force,
analyzing of labour force and categorize it by gender, employment
status, educational level, occupation and social and economic
activity to provide the fundamental changes that may occur on the
structure of labour force and its social and economic
characteristics, to estimate numbers of unemployed and analyzing
their general characteristics and estimate working hours rate and
wages of employees and to analyze other features.
What was
measured
Measure the investment of human resources of society in process
of economic production.
Frequency
The PCBS implementation of the family labour force survey
regularly and continuously since the second half of 1995, the
seventeenth annual report (in 2011) latest annual reports of the
labour force survey.
The PCBS performs the periodic survey on a quarterly basis
(quarterly) since the beginning of survey, with the exception of
the first and second sessions which was held on a semi-annual
basis.
Sample size Sample size was 30,625, 31,179, and 31,190 households in 2009,
2010, and 2011 respectively.
Sample frame
The sample frame consists of a comprehensive sample which was
selected from population, housing and facilities census in year
2007, this comprehensive sample was formed of closed size
geographic areas (number of households), which was the
enumeration areas used in census these units had been used as
Primary Sampling Units (PSUs) at the first stage of process of
selecting the sample.
8
Indicator Application
Sample design A stratified systematic random cluster sample was design that and
selected in two stages:
The first stage was to choose a stratified random sample consisted
of 481 regular enumeration areas in 2009 and 2010, at least 502 in
2011.
The second stage was to choose a regular random sample of
households within each selected enumeration areas, in each round
an average of 16 households were selected for one-enumeration
areas.
Estimation Some values had been estimated by respondents, especially when
acting, such as average weekly hours worked and work days and
monthly wages
Outliers A maximum wage was set and thus neglecting irregular values
that was higher than this limit. The Labour Force Survey referred
to the wages more than 800 shekels per day as an outliers
Weighting Weightings was calculated for families depending on type of
localities of population (urban, rural and refugee camps) and by
governorates, while the weights was calculated for individuals by
age, gender and region (West Bank, Gaza, and Palestinian
Territory)
Accuracy
The data accuracy reflects closeness of computations or estimates to the exact or true values
that the statistics were intended to measure
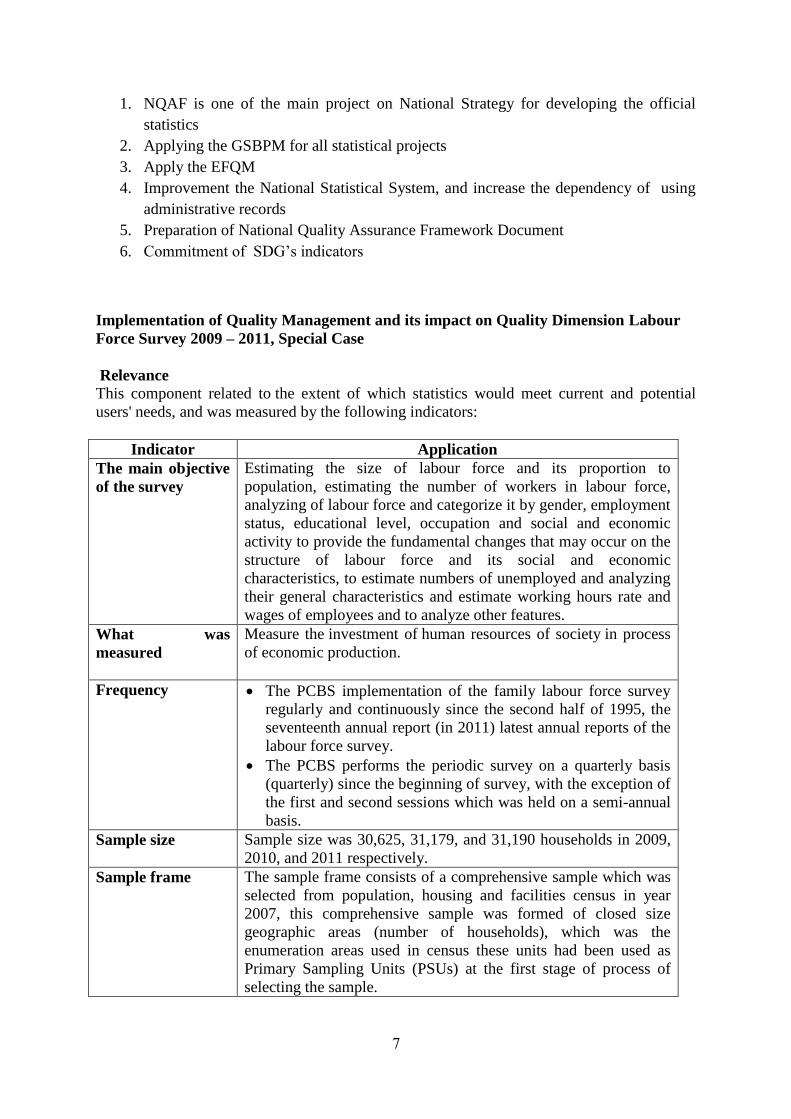
Figure 1: The percentage of the non-response by year
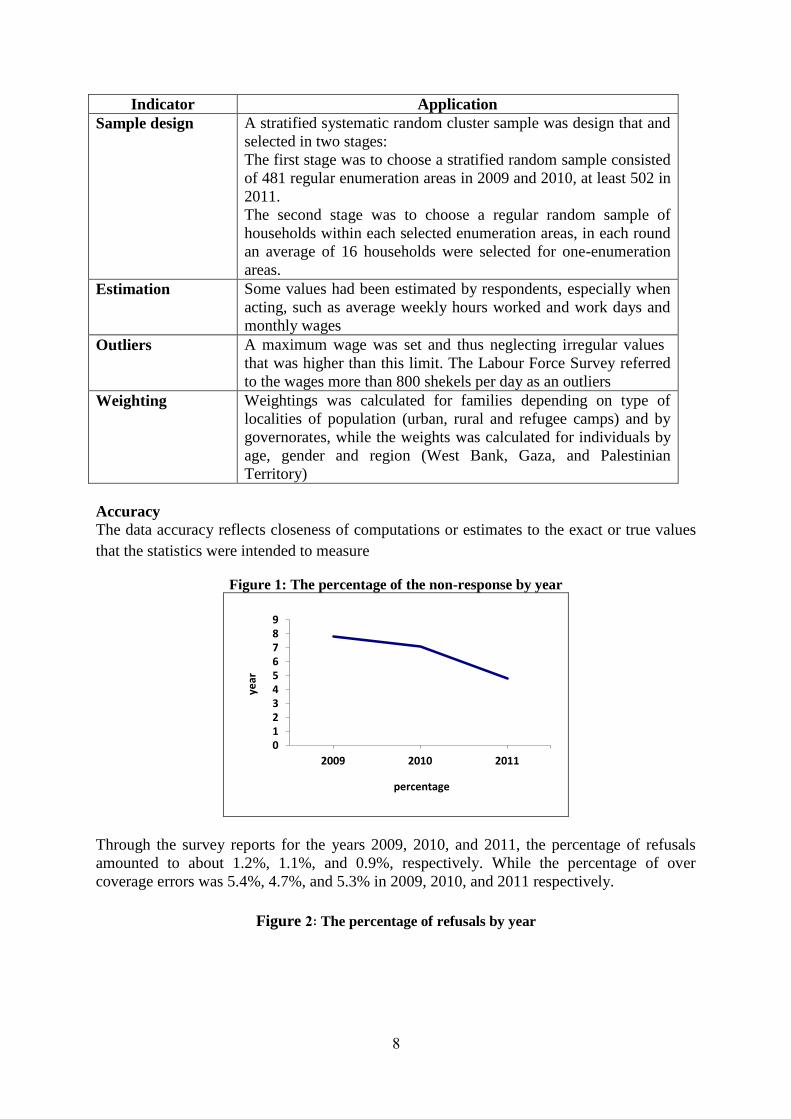
Through the survey reports for the years 2009, 2010, and 2011, the percentage of refusals
amounted to about 1.2%, 1.1%, and 0.9%, respectively. While the percentage of over
coverage errors was 5.4%, 4.7%, and 5.3% in 2009, 2010, and 2011 respectively.
Figure :2 The percentage of refusals by year
0 1 2 3 4 5 6 7 8 9
2009 2010 2011
year
percentage
9
Noted from the above that the accuracy achieved in 2009, 2010, and 2011, but it was better
than in 2011, as the non-response rate and the percentage of refusals was the least we could
this year, so in 2009 and 2010 the percentage of the non-response rate was higher than in
2011, the main reason of decrease the non-response rate in 2011, to decrease the cases of "no
one in the house", in addition to update the sample frame and improve field work phase and
other reasons.
Timeliness and Punctuality
Timeliness relates to length of time between data availability and the event or phenomenon
they describe, while punctuality relates to the time lag between the release date of data and
the target date when it should had been delivered, and it was measured using the following
indicators:
The reference-time reflected by data:
Reflect the labor force survey data in 2009, 2010, and 2011, the time period between
January and December of the same year the implementation of survey.
The lapse of time between publication and the period to which the date refer:
Found by examining survey reports that the time interval between the time of
reference data and the date of publication of the results about four and a half months
of survey in 2009, 2010, 2011, and this period within the standard period (between 3
months and 6 months).
The time lag between the actual and planned dates of publication:
Date of the planned publishing date was the same as the actual scheduled publishing
date in the statistical calendar, where the statistical results of Labour Force Survey in
2009 published in 20/04/2010, in 2010 published in 20\04\2011, in end in 2011
published in 01/05/2012.
It should be noted that timeliness and punctuality was clearly achieved in survey of 2009,
2010, and 2011, and quarterly report for every year, taking into account the delay in
publishing the results of survey in 2011 than it was in previous two years, which was a
weakness on punctuality.
Accessibility and clarity
0
0.2
0.4
0.6
0.8
1
1.2
1.4
2009 2010 2011 ye
ar
percentage
11
8. Reports and publications were published in several ways, including: Traditional
publishing, electronic publishing via the Internet, electronic publishing through CDs,
users services, communication with Media and beneficiaries, statistical data base,
micro data for public use, Metadata and research center
It should be noted that accessibility and clarity was clearly achieved in survey of 2009, 2010,
and 2011, and noted the non published the metadata and the survey data within the statistical
atlas for the year 2011, which was a weakness factor on accessibility and clarity.
Comparability
This dimension refers to the extent to which differences between statistics could be attributed to
differences between the true values of the statistical characteristics, and it was measured using
several indicators:
Comparison of time series data for the survey indicators:
Labour Force Annual and quarter report for every year consists of the most important survey
results, the 2009 survey report contained a time series from 1995 to 2009, and in 2010 from
1995 to 2010, and in 2011 from 1995 to 2011. The results in this report appear as texts,
tables and charts to suit the user's level whether they was researchers, students, decision
makers or others.
Compare survey indicators according to the geographical distribution of the
study population:
The most important indicators the report deals with was Labour force components’ for males
and females in the West Bank and Gaza divided according to age, years of study and
geographical distribution (regions, governorates, population gathering and work place) to be
able to make comparison. The report also deals with the workers features completely, and
limited in the field of economical activities, career and practical status, the unemployed and
their features, and individuals out of the Labour force and their most important features.
Thus, it was clear that comparison between data in a time reference was going smoothly for
Labour Force Survey indicators, and among the survey indicators geographical distribution
for society study.
Comparison of survey data to similar data from different and related surveys:
On the other hand, comparison would not occur between survey data for 2009, 2010, 2011
and similar data from different surveys, due to the lack of same data in other surveys.
Compare survey indicators by different partials to study population:
Survey indicators for 2009, 2010, 2011 cannot be compared in accordance with different
partials in the society study, but the Labour force indictor's comparison should be in
accordance with the all study society.
Coherence
Respect to this dimension of the extent to adequacy of statistics to be combined in different
ways and for various uses, and the presence of comparable methodologies and lead to similar
results in terms of measurements in different corners of the statistical system including the
primary and secondary data sources, and it was measured using several indicators:
Use the frame was a regularly updated for all surveys:
Examination of labour force survey for the years 2009, 2010, and 2011 using a careful frame,
so the frame was a updated continually to all surveys, so that work on the new framework
that was being updated by Sampling and Frame Department (according to the specificity of
labour force survey where you visit household 4 times).
11
Set procedures in place to ensure that the concepts, regulations, classifications
and standards that apply, to be consistent with the concepts, regulations,
classifications, and standards was international:
The procedures and concepts of Labour Force Survey in 2009, 2010, and 2011 was set in
accordance with concepts , regulations , classifications and international standards taking into
consideration some of the (Palestinian Privacy) , without breaking the international standards.
Compared with the same survey indicators of administrative records data (if
available):
Labour Force Survey in 2009, 2010, and 2011 after was checking, the indicators survey
would not be compared with the same indicators of the administrational records data, due to
the lack of administrational records related to work, Labour force and unemployed.
Compared with the same survey indicators of census data:
Labour Force Survey in 2009, 2010, and 2011 after was checking, the lack of comparability
of Labour Force Survey indicators with the census data, due to the need of researchers visit to
household to get some information which was difficult to get in the time of enumeration,
there was also indicators in Labour Force Survey ,the researcher need to visit the household
more than once to fulfill the data, and this cannot happen in the census in one day or more,
and it was difficult to collect data about Labour force in light of the large amount of questions
that would be queried in the census.
It should be notes that coherence was partly accepted in survey of 2009, 2010, and 2011,
taking into some indicators could not be achieved due to privacy of survey.
Completeness
This dimension focuses on the extent to which all statistics that was needed was available,
and the completeness of the statistics in terms of coverage of indicators and geographical
coverage, time coverage, and coverage in terms of target groups and other related matters,
this dimension was measured using the following indicators:
Extract the highest number of indicators that covers the survey subject:
Labour Force Survey report and quarter tackles the most important statistical indicators about
Labour force in Palestinian Territory, and its most prominent features its three components
(full employment, underemployment and unemployment) in term of number, geographical
distribution and demographical structure, as well as studying its relation of variant
distribution. Labour Force Survey report would also tackle the individuals outside the Labour
force and shows their most important features.
Covering all geographical regions in the study sample: It covers all geographical areas in the study sample; a stratified, cluster and random sample
were chosen systematically from enumeration area used in population, housings and
establishments census in 2007. The geographical areas were divided into variant levels: the
level of Palestinian Territory, the level of West Bank and Gaza Governorates in addition to
several geographical divisions: Governorate, type of locality, region.
It should be notes that completeness was largely accepted in survey of 2009, 2010, and 2011,
with some indicators (based on international recommendations and the recommendations of
the technical mission of the labour force survey) are published and made available such as
working conditions, labour migration and dropping out of school to work.
12
REFERACES
1. Palestinian Central Bureau of Statistics ( 2011), Annual Report, 2010, Ramallah –
Palestine.
2. Palestinian Central Bureau of Statistics ( 2012), Annual Report, 2011, Ramallah –
Palestine.
3. LRQA (2011), Internal QMS Auditor Pre-course Notes, UK.
4. CERCO Working Group on Quality (2000), Handbook for Implementing a Quality
Management
5. System in a National Mapping Agency.
6. Van Dalen, Andre (n.d.), Quality Management System, South Africa.
7. TRANSCO (2009), An Introduction to TRANSCO Integrated Management System,
Abu Dhabi.
8. Jones, Scott. (2009), Value of a QMS. Colorado-USA.
9. Marquis, Hank. (2009). How To Roll the Deming Wheel.
10. Palestinian Central Bureau of Statistics, 2012. Quality Report - Labour Force Survey,
2009 -2011. Ramallah - Palestine.
11. Joint UNECE/Eurostat/OECD Work Session on Statistical Metadata (METIS) Generic
Statistical Business Process Model Version 4.0 – April 2009 Prepared by the UNECE
Secretariat