60 ghz blockage study using phased arrays - arxiv.org · fig. 1. sibeam 60 ghz phased array. twelve...
TRANSCRIPT

60 GHz Blockage Study Using Phased ArraysChristopher Slezak, Aditya Dhananjay, and Sundeep Rangan
NYU Tandon School of [email protected], [email protected], [email protected]
Abstract—The millimeter wave (mmWave) frequencies offerthe potential for enormous capacity wireless links. However,designing robust communication systems at these frequenciesrequires that we understand the channel dynamics over both timeand space: mmWave signals are extremely vulnerable to blockingand the channel can thus rapidly appear and disappear withsmall movement of obstacles and reflectors. In rich scatteringenvironments, different paths may experience different blockingtrajectories and understanding these multi-path blocking dynam-ics is essential for developing and assessing beamforming andbeam-tracking algorithms. This paper presents the design andexperimental results of a novel measurement system which usesphased arrays to perform mmWave dynamic channel measure-ments. Specifically, human blockage and its effects across multiplepaths are investigated with only several microseconds betweensuccessive measurements. From these measurements we developa modeling technique which uses low-rank tensor factorizationto separate the available paths so that their joint statistics canbe understood.
Index Terms—Blockage, mmWave, Dynamics, Phased Array,Parafac, Principal Component Analysis, Tensor Decomposition
I. INTRODUCTION
Millimeter wave (mmWave) frequencies (roughly above10 GHz) have shown tremendous promise as an enablingtechnology for 5G [1], [2]. However, unlike conventionalcellular communications below 6 GHz, mmWave signals arehighly susceptible to blockage from objects present in theenvironment such as metal shelves, brick walls, and evenpeople. Hence, small movements of these objects can causerapid variations in received power. These rapid variations cancomplicate the operation of the entire protocol stack, anddesigners of 5G systems will need models which accuratelycharacterize these effects. Numerous procedures includingchannel estimation, channel quality tracking, beamforming,rate adaptation, handover and even congestion control alldepend critically on the precise dynamics of these channels[3], [4].
With the growing interest in mmWave, a number of studieshave been performed to understand these dynamics better.These studies include models based on ray tracing [5], [6],SISO measurements with fixed antennas [7], [8], measure-ments from MIMO systems with a small number of antennas[9], and measurements using omnidirectional antennas [10]. Alimitation of these previous measurement-based results is thatthey have been restricted to looking at a limited number ofdirections at a time since they are based on small numbers of
This work was supported in part by NSF grants 1302336, 1564142, and1547332, NSA, NIST, and the affiliate members of NYU WIRELESS.
Fig. 1. SiBeam 60 GHz phased array. Twelve elements are active at a time.
fixed antennas. In a rich scattering environment, it is possiblethat when one path is blocked, others may still be available.Understanding the statistics over multiple spatial paths duringblocking events is thus necessary to fully assess path diversityalgorithms.
In this paper, we present a novel measurement systemthat is capable of performing channel measurements overa large number of pointing angles almost simultaneously.These measurements allow us to jointly examine blockageacross multiple paths that are present in the channel. Toaid in the modeling and interpretation of the measurementdata, we propose an analysis technique which uses parallelfactor analysis (PARAFAC) to identify the distinct blockagetrajectories that these multiple paths experience.
II. HARDWARE SETUP
The critical pieces of hardware enabling this system to bebuilt are two SiBeam 60 GHz phased arrays shown in Fig.1. These arrays have 12 steerable elements active when trans-mitting or receiving, and allow the user to select an arbitrarysteering vector which defines the direction of arrival/departureof the array. The antennas are designed for a narrow fixedvertical beam of approximately ±10◦ and steerable horizontalrange of approximately ±45◦. The total antenna gain is 23 dBi.Applying a new steering vector to the array can be done injust a few microseconds which allows for measurements ofthe channel to be performed across different combinations oftransmitter (TX) and receiver (RX) pointing angles with verylittle time between measurements.
These arrays are combined with a baseband system imple-mented using two (one each at the TX and RX) National In-struments PCI eXtenstions for Instrumentation (PXIe) chassis.Each chassis has multiple Field Programmable Gate Arrays
arX
iv:1
712.
0545
7v1
[ee
ss.S
P] 1
4 D
ec 2
017
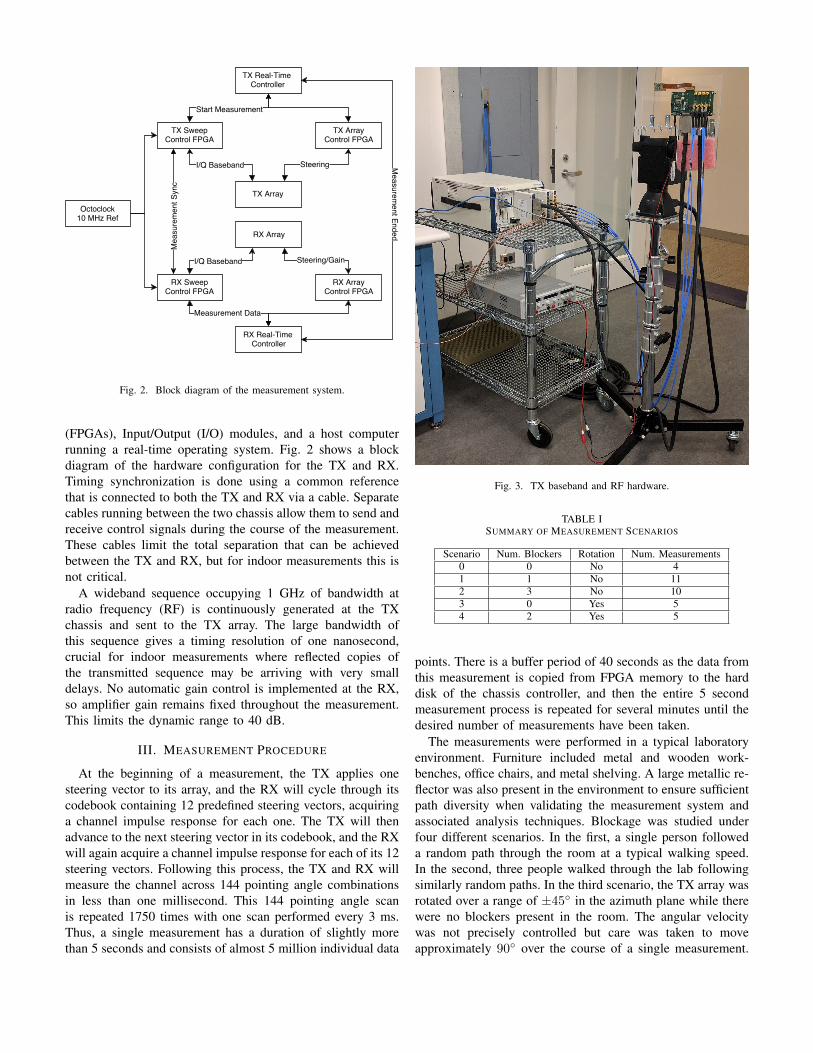
Fig. 2. Block diagram of the measurement system.
(FPGAs), Input/Output (I/O) modules, and a host computerrunning a real-time operating system. Fig. 2 shows a blockdiagram of the hardware configuration for the TX and RX.Timing synchronization is done using a common referencethat is connected to both the TX and RX via a cable. Separatecables running between the two chassis allow them to send andreceive control signals during the course of the measurement.These cables limit the total separation that can be achievedbetween the TX and RX, but for indoor measurements this isnot critical.
A wideband sequence occupying 1 GHz of bandwidth atradio frequency (RF) is continuously generated at the TXchassis and sent to the TX array. The large bandwidth ofthis sequence gives a timing resolution of one nanosecond,crucial for indoor measurements where reflected copies ofthe transmitted sequence may be arriving with very smalldelays. No automatic gain control is implemented at the RX,so amplifier gain remains fixed throughout the measurement.This limits the dynamic range to 40 dB.
III. MEASUREMENT PROCEDURE
At the beginning of a measurement, the TX applies onesteering vector to its array, and the RX will cycle through itscodebook containing 12 predefined steering vectors, acquiringa channel impulse response for each one. The TX will thenadvance to the next steering vector in its codebook, and the RXwill again acquire a channel impulse response for each of its 12steering vectors. Following this process, the TX and RX willmeasure the channel across 144 pointing angle combinationsin less than one millisecond. This 144 pointing angle scanis repeated 1750 times with one scan performed every 3 ms.Thus, a single measurement has a duration of slightly morethan 5 seconds and consists of almost 5 million individual data
Fig. 3. TX baseband and RF hardware.
TABLE ISUMMARY OF MEASUREMENT SCENARIOS
Scenario Num. Blockers Rotation Num. Measurements0 0 No 41 1 No 112 3 No 103 0 Yes 54 2 Yes 5
points. There is a buffer period of 40 seconds as the data fromthis measurement is copied from FPGA memory to the harddisk of the chassis controller, and then the entire 5 secondmeasurement process is repeated for several minutes until thedesired number of measurements have been taken.
The measurements were performed in a typical laboratoryenvironment. Furniture included metal and wooden work-benches, office chairs, and metal shelving. A large metallic re-flector was also present in the environment to ensure sufficientpath diversity when validating the measurement system andassociated analysis techniques. Blockage was studied underfour different scenarios. In the first, a single person followeda random path through the room at a typical walking speed.In the second, three people walked through the lab followingsimilarly random paths. In the third scenario, the TX array wasrotated over a range of ±45◦ in the azimuth plane while therewere no blockers present in the room. The angular velocitywas not precisely controlled but care was taken to moveapproximately 90◦ over the course of a single measurement.
0.75 1.5 2.25 3 3.75 4.5 5.25
Time (s)
20
40
60
80
100
120
140
Po
intin
g A
ng
le C
om
bin
atio
n
-18
-16
-14
-12
-10
-8
-6
-4
-2
0
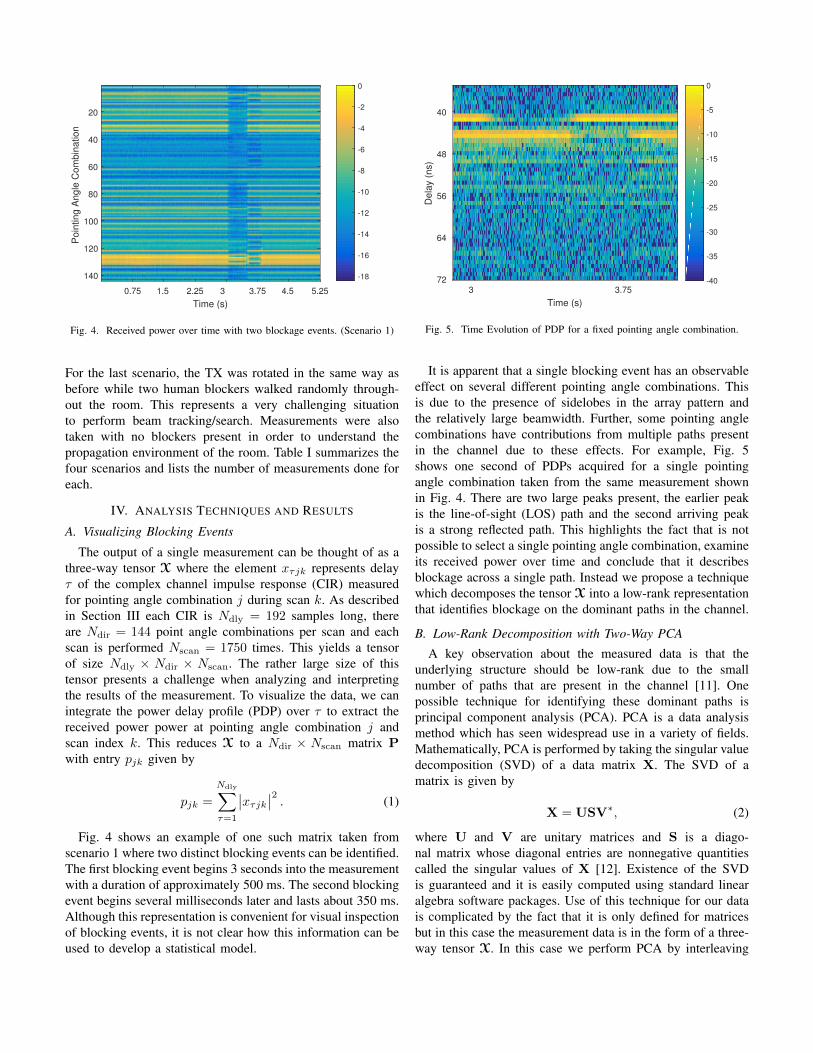
Fig. 4. Received power over time with two blockage events. (Scenario 1)
For the last scenario, the TX was rotated in the same way asbefore while two human blockers walked randomly through-out the room. This represents a very challenging situationto perform beam tracking/search. Measurements were alsotaken with no blockers present in order to understand thepropagation environment of the room. Table I summarizes thefour scenarios and lists the number of measurements done foreach.
IV. ANALYSIS TECHNIQUES AND RESULTS
A. Visualizing Blocking Events
The output of a single measurement can be thought of as athree-way tensor X where the element xτjk represents delayτ of the complex channel impulse response (CIR) measuredfor pointing angle combination j during scan k. As describedin Section III each CIR is Ndly = 192 samples long, thereare Ndir = 144 point angle combinations per scan and eachscan is performed Nscan = 1750 times. This yields a tensorof size Ndly × Ndir × Nscan. The rather large size of thistensor presents a challenge when analyzing and interpretingthe results of the measurement. To visualize the data, we canintegrate the power delay profile (PDP) over τ to extract thereceived power power at pointing angle combination j andscan index k. This reduces X to a Ndir × Nscan matrix Pwith entry pjk given by
pjk =
Ndly∑τ=1
∣∣xτjk∣∣2 . (1)
Fig. 4 shows an example of one such matrix taken fromscenario 1 where two distinct blocking events can be identified.The first blocking event begins 3 seconds into the measurementwith a duration of approximately 500 ms. The second blockingevent begins several milliseconds later and lasts about 350 ms.Although this representation is convenient for visual inspectionof blocking events, it is not clear how this information can beused to develop a statistical model.
3 3.75
Time (s)
40
48
56
64
72
De
lay (
ns)
-40
-35
-30
-25
-20
-15
-10
-5
0
Fig. 5. Time Evolution of PDP for a fixed pointing angle combination.
It is apparent that a single blocking event has an observableeffect on several different pointing angle combinations. Thisis due to the presence of sidelobes in the array pattern andthe relatively large beamwidth. Further, some pointing anglecombinations have contributions from multiple paths presentin the channel due to these effects. For example, Fig. 5shows one second of PDPs acquired for a single pointingangle combination taken from the same measurement shownin Fig. 4. There are two large peaks present, the earlier peakis the line-of-sight (LOS) path and the second arriving peakis a strong reflected path. This highlights the fact that is notpossible to select a single pointing angle combination, examineits received power over time and conclude that it describesblockage across a single path. Instead we propose a techniquewhich decomposes the tensor X into a low-rank representationthat identifies blockage on the dominant paths in the channel.
B. Low-Rank Decomposition with Two-Way PCA
A key observation about the measured data is that theunderlying structure should be low-rank due to the smallnumber of paths that are present in the channel [11]. Onepossible technique for identifying these dominant paths isprincipal component analysis (PCA). PCA is a data analysismethod which has seen widespread use in a variety of fields.Mathematically, PCA is performed by taking the singular valuedecomposition (SVD) of a data matrix X. The SVD of amatrix is given by
X = USV∗, (2)
where U and V are unitary matrices and S is a diago-nal matrix whose diagonal entries are nonnegative quantitiescalled the singular values of X [12]. Existence of the SVDis guaranteed and it is easily computed using standard linearalgebra software packages. Use of this technique for our datais complicated by the fact that it is only defined for matricesbut in this case the measurement data is in the form of a three-way tensor X. In this case we perform PCA by interleaving

0 10 20 30 40 50
Component
-35
-30
-25
-20
-15
-10
-5
0P
ow
er
(dB
)
Fig. 6. Scree plot of the 50 largest principal components of X.
all CIRs from a single scan together. This transforms X froma Ndly×Ndir×Nscan three-way tensor to a NdlyNdir×Nscan
matrix X (or equivalently a two-way tensor).This analysis was performed for the same measurement
shown in Fig. 4. A scree plot can be obtained by plottingthe relative magnitudes of the diagonal elements of S and isshown in Fig. 6. As expected due to the low-rank nature ofthe channel, the scree plot is dominated by a few componentswhich capture most of the variance in X.
The gain trajectory of principal component k can be ob-tained from this factorized form by multiplying the kth columnof V by the kth element on the diagonal of S. Fig. 7shows the gain trajectories of the three strongest principalcomponents that were identified by this analysis, again donefor the measurement shown in Fig. 4. It is clear from thisplot that two-way PCA failed to achieve the desired result.Component 1 is much stronger than the others throughout theduration of the measurement, and in this single component itis possible to see drops in received power which correspondto both blocking events that are visible in Fig. 4. An analysistechnique which can properly exploit the underlying structureof the tensor X is needed.
C. Low-Rank Tensor Decomposition with PARAFAC
The failure of the more well-known PCA technique moti-vates the use of a less widely used but powerful method calledparallel factor analysis (PARAFAC). PARAFAC is a tensordecomposition technique which can be thought of as a gen-eralization of PCA and the SVD [13]. It has seen widespreaduse in fields such as psychometrics and chemometrics, as wellas some use in the context of wireless communications [14]and array processing [15]. In this particular work we wish torepresent X as a sum of rank-one tensors, with each of theserank-one tensors corresponding to a single path present in thechannel. Each of these paths is described by a delay signature,spatial signature, and a gain trajectory over time. This mapsvery well to the PARAFAC model,
0 0.75 1.5 2.25 3 3.75 4.5 5.25
Time (s)
-35
-30
-25
-20
-15
-10
-5
0
5
Po
we
r (d
B)
Fig. 7. Gain trajectories obtained from two-way PCA.
Fig. 8. Illustration of the PARAFAC model [16].
X =
L∑`=1
d` ⊗ s` ⊗ g` + E, (3)
where d`, s`, g` are vectors which represent the delay sig-nature, spatial signature, and gain trajectory of the `th path,respectively, and E is a three-way tensor representing theresidual. Conceptually this is illustrated in Fig. 8 which showsa three-way tensor written as the sum of two rank-one tensors.
The simplicity of the PARAFAC model is a major advantagewhen compared to two-way PCA. Because the PARAFACmodel is more restrictive than the two-way PCA model, itis able to more closely match the underlying structure of thisdata. In general for an I×J×K tensor, the L-component PCAsolution will have L(I+JK) free parameters when the tensoris unraveled into a matrix suitable for PCA. The PARAFACmodel on the other hand will have L(I + J + K) freeparameters. If this simpler model is sufficient then the extradegrees of freedom in PCA will simply lead to modeling noiseor redundancies in the data [16]. One drawback of PARAFACis the fact that it is computationally more involved thantwo-way PCA. Computing the solution requires solving anoptimization problem, typically using alternating least squares.For this work the implementation of PARAFAC described in[17] was downloaded from the MATLAB File Exchange andused to perform the decomposition.
0 0.75 1.5 2.25 3 3.75 4.5 5.25
Time (s)
-35
-30
-25
-20
-15
-10
-5
0
5P
ow
er
(dB
)
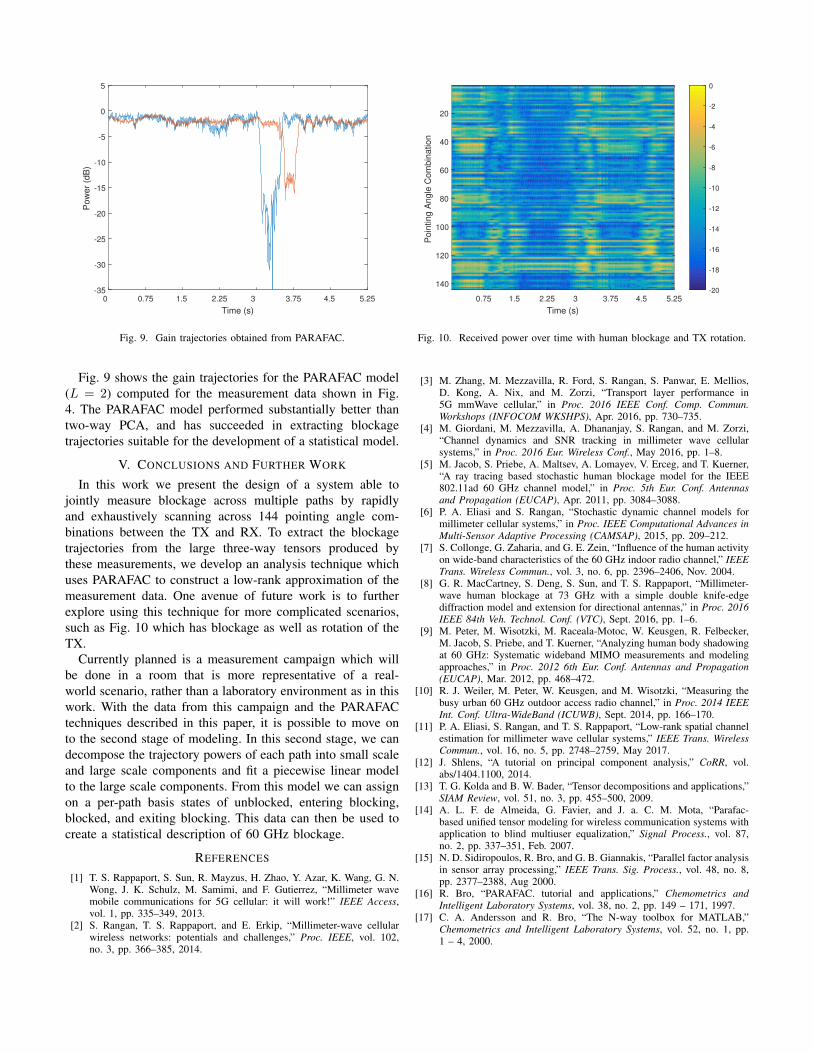
Fig. 9. Gain trajectories obtained from PARAFAC.
Fig. 9 shows the gain trajectories for the PARAFAC model(L = 2) computed for the measurement data shown in Fig.4. The PARAFAC model performed substantially better thantwo-way PCA, and has succeeded in extracting blockagetrajectories suitable for the development of a statistical model.
V. CONCLUSIONS AND FURTHER WORK
In this work we present the design of a system able tojointly measure blockage across multiple paths by rapidlyand exhaustively scanning across 144 pointing angle com-binations between the TX and RX. To extract the blockagetrajectories from the large three-way tensors produced bythese measurements, we develop an analysis technique whichuses PARAFAC to construct a low-rank approximation of themeasurement data. One avenue of future work is to furtherexplore using this technique for more complicated scenarios,such as Fig. 10 which has blockage as well as rotation of theTX.
Currently planned is a measurement campaign which willbe done in a room that is more representative of a real-world scenario, rather than a laboratory environment as in thiswork. With the data from this campaign and the PARAFACtechniques described in this paper, it is possible to move onto the second stage of modeling. In this second stage, we candecompose the trajectory powers of each path into small scaleand large scale components and fit a piecewise linear modelto the large scale components. From this model we can assignon a per-path basis states of unblocked, entering blocking,blocked, and exiting blocking. This data can then be used tocreate a statistical description of 60 GHz blockage.
REFERENCES
[1] T. S. Rappaport, S. Sun, R. Mayzus, H. Zhao, Y. Azar, K. Wang, G. N.Wong, J. K. Schulz, M. Samimi, and F. Gutierrez, “Millimeter wavemobile communications for 5G cellular: it will work!” IEEE Access,vol. 1, pp. 335–349, 2013.
[2] S. Rangan, T. S. Rappaport, and E. Erkip, “Millimeter-wave cellularwireless networks: potentials and challenges,” Proc. IEEE, vol. 102,no. 3, pp. 366–385, 2014.
0.75 1.5 2.25 3 3.75 4.5 5.25
Time (s)
20
40
60
80
100
120
140
Po
inting
Ang
le C
om
bin
ation
-20
-18
-16
-14
-12
-10
-8
-6
-4
-2
0
Fig. 10. Received power over time with human blockage and TX rotation.
[3] M. Zhang, M. Mezzavilla, R. Ford, S. Rangan, S. Panwar, E. Mellios,D. Kong, A. Nix, and M. Zorzi, “Transport layer performance in5G mmWave cellular,” in Proc. 2016 IEEE Conf. Comp. Commun.Workshops (INFOCOM WKSHPS), Apr. 2016, pp. 730–735.
[4] M. Giordani, M. Mezzavilla, A. Dhananjay, S. Rangan, and M. Zorzi,“Channel dynamics and SNR tracking in millimeter wave cellularsystems,” in Proc. 2016 Eur. Wireless Conf., May 2016, pp. 1–8.
[5] M. Jacob, S. Priebe, A. Maltsev, A. Lomayev, V. Erceg, and T. Kuerner,“A ray tracing based stochastic human blockage model for the IEEE802.11ad 60 GHz channel model,” in Proc. 5th Eur. Conf. Antennasand Propagation (EUCAP), Apr. 2011, pp. 3084–3088.
[6] P. A. Eliasi and S. Rangan, “Stochastic dynamic channel models formillimeter cellular systems,” in Proc. IEEE Computational Advances inMulti-Sensor Adaptive Processing (CAMSAP), 2015, pp. 209–212.
[7] S. Collonge, G. Zaharia, and G. E. Zein, “Influence of the human activityon wide-band characteristics of the 60 GHz indoor radio channel,” IEEETrans. Wireless Commun., vol. 3, no. 6, pp. 2396–2406, Nov. 2004.
[8] G. R. MacCartney, S. Deng, S. Sun, and T. S. Rappaport, “Millimeter-wave human blockage at 73 GHz with a simple double knife-edgediffraction model and extension for directional antennas,” in Proc. 2016IEEE 84th Veh. Technol. Conf. (VTC), Sept. 2016, pp. 1–6.
[9] M. Peter, M. Wisotzki, M. Raceala-Motoc, W. Keusgen, R. Felbecker,M. Jacob, S. Priebe, and T. Kuerner, “Analyzing human body shadowingat 60 GHz: Systematic wideband MIMO measurements and modelingapproaches,” in Proc. 2012 6th Eur. Conf. Antennas and Propagation(EUCAP), Mar. 2012, pp. 468–472.
[10] R. J. Weiler, M. Peter, W. Keusgen, and M. Wisotzki, “Measuring thebusy urban 60 GHz outdoor access radio channel,” in Proc. 2014 IEEEInt. Conf. Ultra-WideBand (ICUWB), Sept. 2014, pp. 166–170.
[11] P. A. Eliasi, S. Rangan, and T. S. Rappaport, “Low-rank spatial channelestimation for millimeter wave cellular systems,” IEEE Trans. WirelessCommun., vol. 16, no. 5, pp. 2748–2759, May 2017.
[12] J. Shlens, “A tutorial on principal component analysis,” CoRR, vol.abs/1404.1100, 2014.
[13] T. G. Kolda and B. W. Bader, “Tensor decompositions and applications,”SIAM Review, vol. 51, no. 3, pp. 455–500, 2009.
[14] A. L. F. de Almeida, G. Favier, and J. a. C. M. Mota, “Parafac-based unified tensor modeling for wireless communication systems withapplication to blind multiuser equalization,” Signal Process., vol. 87,no. 2, pp. 337–351, Feb. 2007.
[15] N. D. Sidiropoulos, R. Bro, and G. B. Giannakis, “Parallel factor analysisin sensor array processing,” IEEE Trans. Sig. Process., vol. 48, no. 8,pp. 2377–2388, Aug 2000.
[16] R. Bro, “PARAFAC. tutorial and applications,” Chemometrics andIntelligent Laboratory Systems, vol. 38, no. 2, pp. 149 – 171, 1997.
[17] C. A. Andersson and R. Bro, “The N-way toolbox for MATLAB,”Chemometrics and Intelligent Laboratory Systems, vol. 52, no. 1, pp.1 – 4, 2000.