6 - tom blue.ppt - firt · tom blue blue, johnson & associates, inc. 6101marble ne.,suite 8...
TRANSCRIPT
BLUE, JOHNSON & ASSOCIATES, INC. FERTILIZERS CHEMICALS MINERALS ENERGY
TFI FERTILIZER OUTLOOK &
TECHNOLOGY CONFERENCE
November 17, 2010
NITROGEN OUTLOOK Presentation Visuals
by Tom Blue
Blue, Johnson & Associates, Inc.
6101 MARBLE NE., SUITE 8 829 PINEHURST PLACE 2233 GLENBAR DRIVE ALBUQUERQUE, NEW MEXICO 87110 SAN RAMON, CALIFORNIA 94583 GERMANTOW N, TENNESSEE 38139
FAX (505) 254-2159 FAX (925) 833-9054 FAX (901) 757-4179
THOMAS A. BLUE (505) 254-2157 DENNIS R. JOHNSON (925) 833-1699 DAVID C. CENTKO (901) 757-4494 BLUEABQ@QW EST.NET GAYLE E. JOHNSON (925) 833-1699 [email protected]
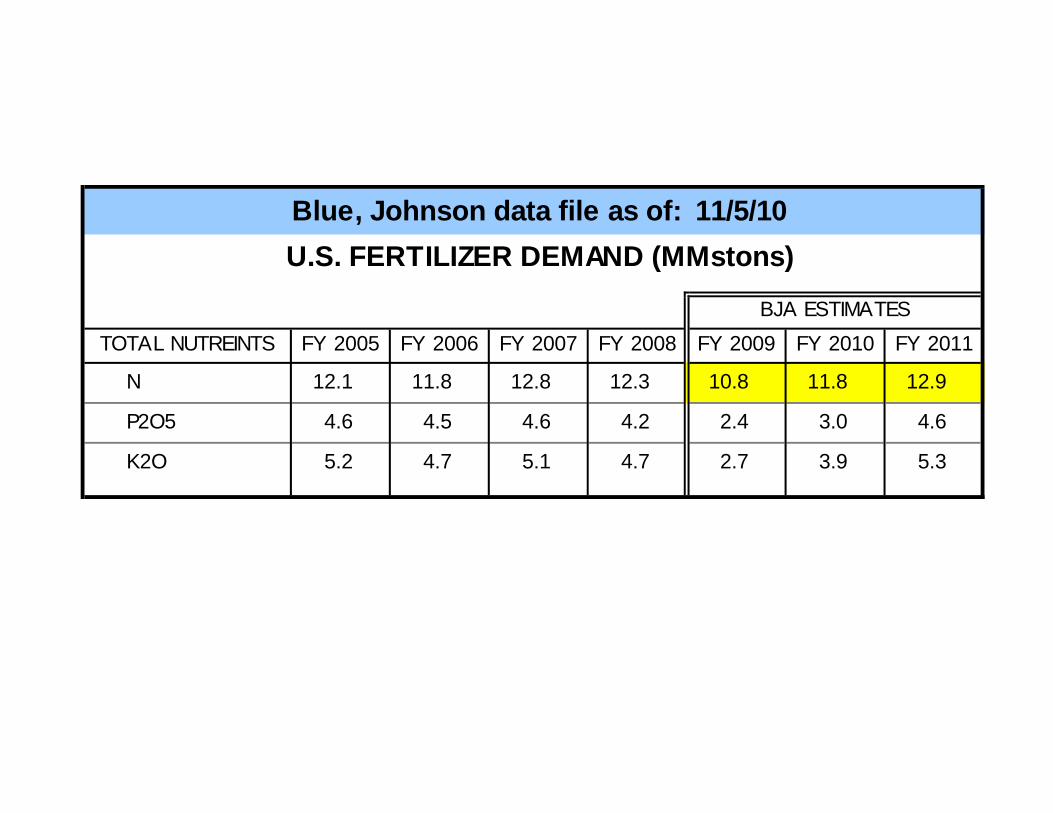
Blue, Johnson data file as of: 11/5/10U.S. FERTILIZER DEMAND (MMstons)
BJA ESTIMATESTOTAL NUTREINTS FY 2005 FY 2006 FY 2007 FY 2008 FY 2009 FY 2010 FY 2011
N 12.1 11.8 12.8 12.3 10.8 11.8 12.9
P2O5 4.6 4.5 4.6 4.2 2.4 3.0 4.6
K2O 5.2 4.7 5.1 4.7 2.7 3.9 5.3
Blue, Johnson data file as of: 11/5/10
0
5
10
15
20
1960 1970 1980 1990 2000 2010 20200
500
1000
1500
2000
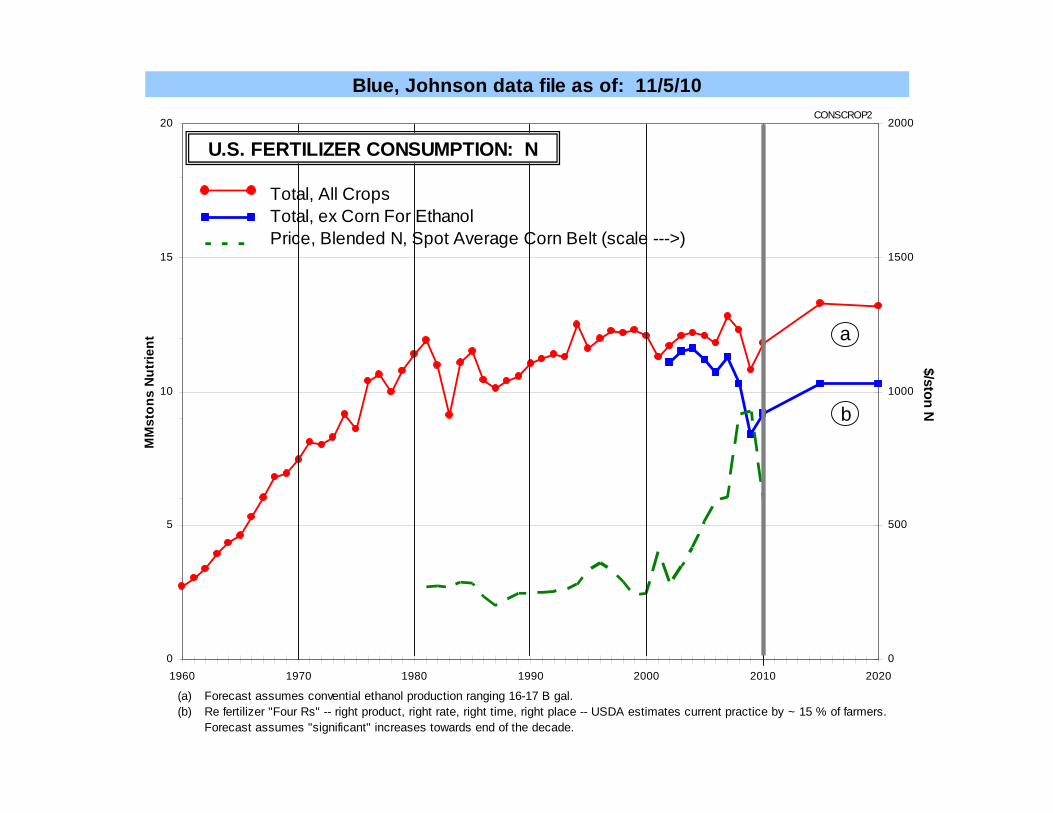
U.S. FERTILIZER CONSUMPTION: N
CONSCROP2
MM
ston
s N
utrie
nt
Total, All CropsTotal, ex Corn For EthanolPrice, Blended N, Spot Average Corn Belt (scale --->)
$/ston Nb
a
Forecast assumes convential ethanol production ranging 16-17 B gal.Re fertilizer "Four Rs" -- right product, right rate, right time, right place -- USDA estimates current practice by ~ 15 % of farmers. Forecast assumes "significant" increases towards end of the decade.
(a)(b)

Blue, Johnson data file as of: 11/5/10
0
5
10
15
20
1960 1970 1980 1990 2000 2010 2020
U.S. NUTRIENT CONSUMPTION: N
CONSCROP2M
Mst
ons
Nut
rient
Fertilizer,Total ex Corn For Ethanol (a)Energy (b)Other Industrial
Re fertilizer "Four Rs" -- right product, right rate, right time, right place -- USDA estimates current practice by ~ 15 % of farmers. Forecast assumes "significant" increases towards end of the decade.Energy includes corn for ethanol, AN for coal mining, and NH3-urea for emissions control (power plants, diesel engines).
(a)
(b)
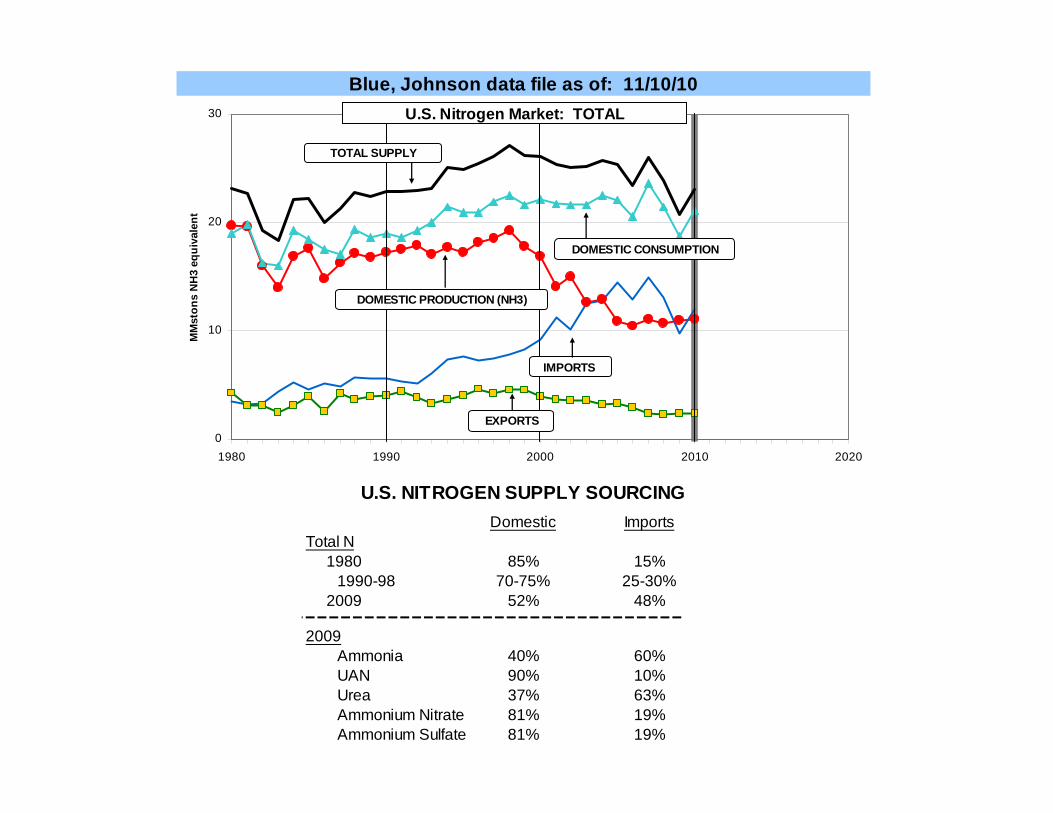
Blue, Johnson data file as of: 11/10/10
U.S. NITROGEN SUPPLY SOURCINGDomestic Imports
Total N1980 85% 15%
1990-98 70-75% 25-30%2009 52% 48%
2009 Ammonia 40% 60% UAN 90% 10% Urea 37% 63% Ammonium Nitrate 81% 19% Ammonium Sulfate 81% 19%
0
10
20
30
1980 1990 2000 2010 2020
MM
ston
s N
H3
equi
vale
nt
U.S. Nitrogen Market: TOTAL
DOMESTIC PRODUCTION (NH3)
IMPORTS
DOMESTIC CONSUMPTION
EXPORTS
TOTAL SUPPLY

250
750
1250
1750
J 2006 J 2007 J 2008 J 2009 J 2010 J
Mst
ons
prod
uct
25
50
75
100O
AMMONIA
U.S. PRODUCTION<--- scale
U.S. OPERATING RATEscale --->
Percent
U.S. IMPORTS<--- scale

Blue, Johnson data file as of: 11/5/10
25
50
75
100
J F M A M J J A S O N D J F M A M J J A S O N D J F M A M J J A S O N D
PE
RC
ENT
0
5
10
15
$/MM
Btu
2008 2009 2010
U.S. AMMONIA PRODUCTION vs. NATURAL GAS PRICE prdvsgas
AMMONIA INDUSTRYOPERATING RATE
<---- scale
NATURAL GAS PRICE:CENTRAL PLAINS DLV NH3 PLANTS,
BIDWEEK INDEX BASISscale ---->

Blue, Johnson data file as of: 9/27/10
U.S. NITROGEN CAPACITY TRENDS
5
10
15
20
1995 2000 2005 2010 2015
MM
ston
s
NSOL(UAN 32 Basis)
DRY UREA
DRY AMMONIUMNITRATE
AMMONIA
nitcapgr
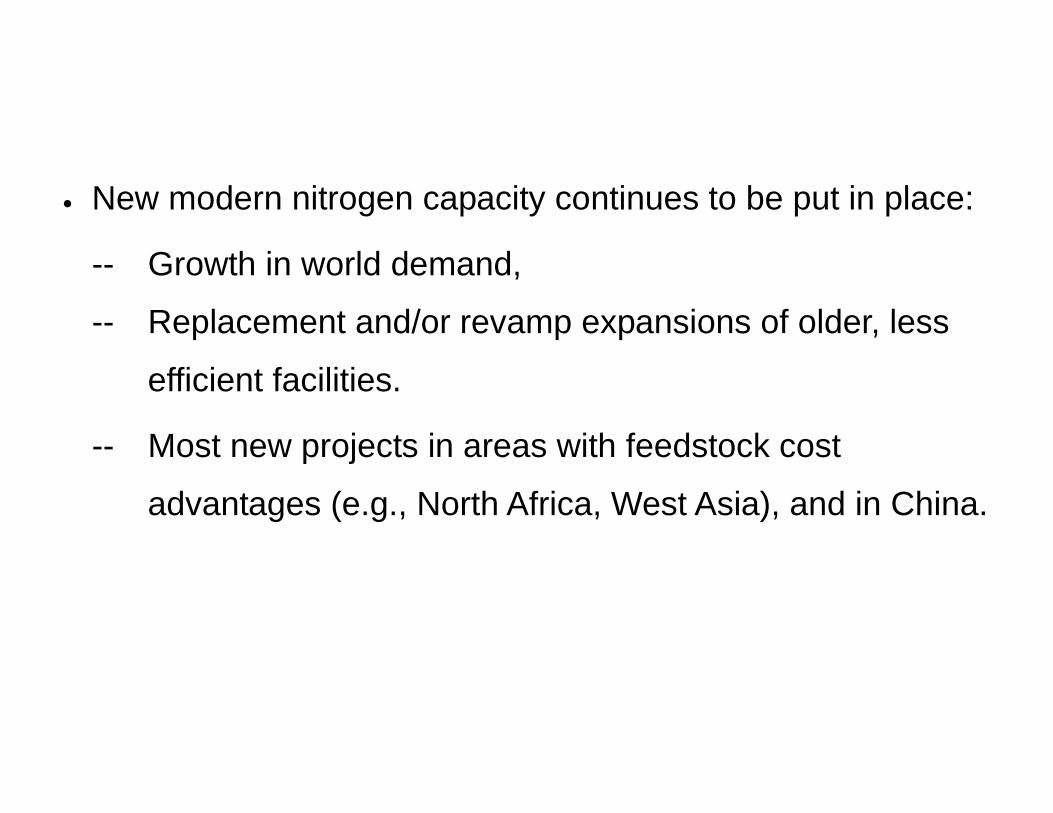
New modern nitrogen capacity continues to be put in place:
-- Growth in world demand,
-- Replacement and/or revamp expansions of older, less
efficient facilities.
-- Most new projects in areas with feedstock cost
advantages (e.g., North Africa, West Asia), and in China.
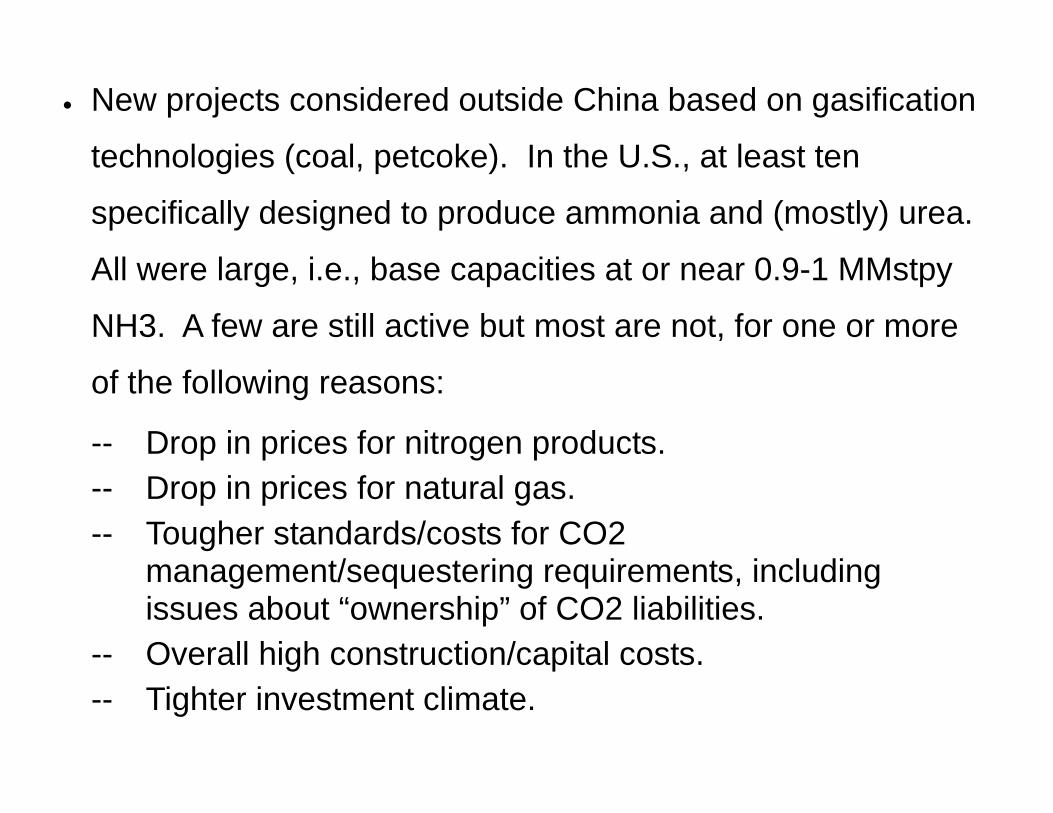
New projects considered outside China based on gasification
technologies (coal, petcoke). In the U.S., at least ten
specifically designed to produce ammonia and (mostly) urea.
All were large, i.e., base capacities at or near 0.9-1 MMstpy
NH3. A few are still active but most are not, for one or more
of the following reasons:
-- Drop in prices for nitrogen products. -- Drop in prices for natural gas. -- Tougher standards/costs for CO2
management/sequestering requirements, including issues about “ownership” of CO2 liabilities.
-- Overall high construction/capital costs. -- Tighter investment climate.
If any such projects get off the ground, none likely hit the
market much before 2015.

Blue, Johnson file as of: 11/10/10
MAJOR N PRODUCTS: ESTIMATED DOMESTIC SUPPLY
H2 2010 (H1 FY 2011) vs.
H2 2008
H2 2009
AMMONIA + 7% + 14%
UREA + 4% + 15%
UAN - 9% - 3%
AN - 26% - 2%
AS + 8% + 16%
NET N + 1% + 9%
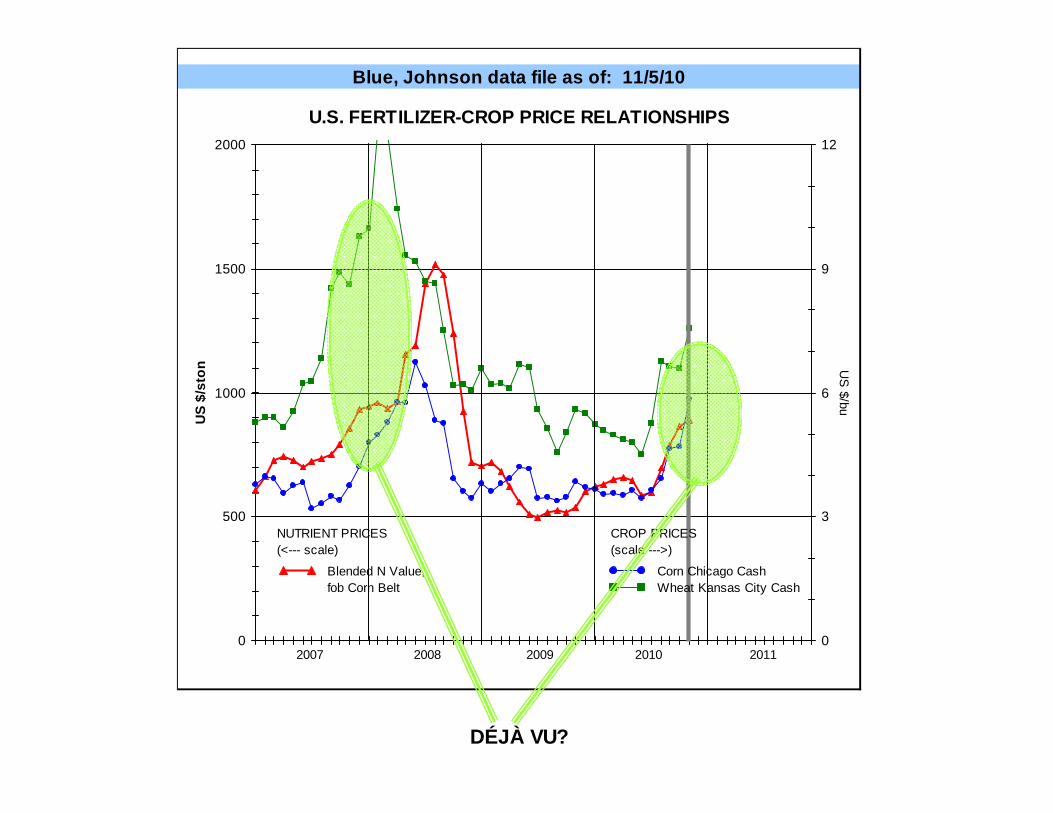
Blue, Johnson data file as of: 11/5/10
U.S. FERTILIZER-CROP PRICE RELATIONSHIPS
DÉJÀ VU?
0
500
1000
1500
2000
US
$/st
on
0
3
6
9
12
US
$/bu
2007
NUTRIENT PRICES(<--- scale)
CROP PRICES(scale --->)
Blended N Value,fob Corn Belt
Corn Chicago CashWheat Kansas City Cash
2008 2009 2010 2011
Blue, Johnson data file as of: 11/5/10
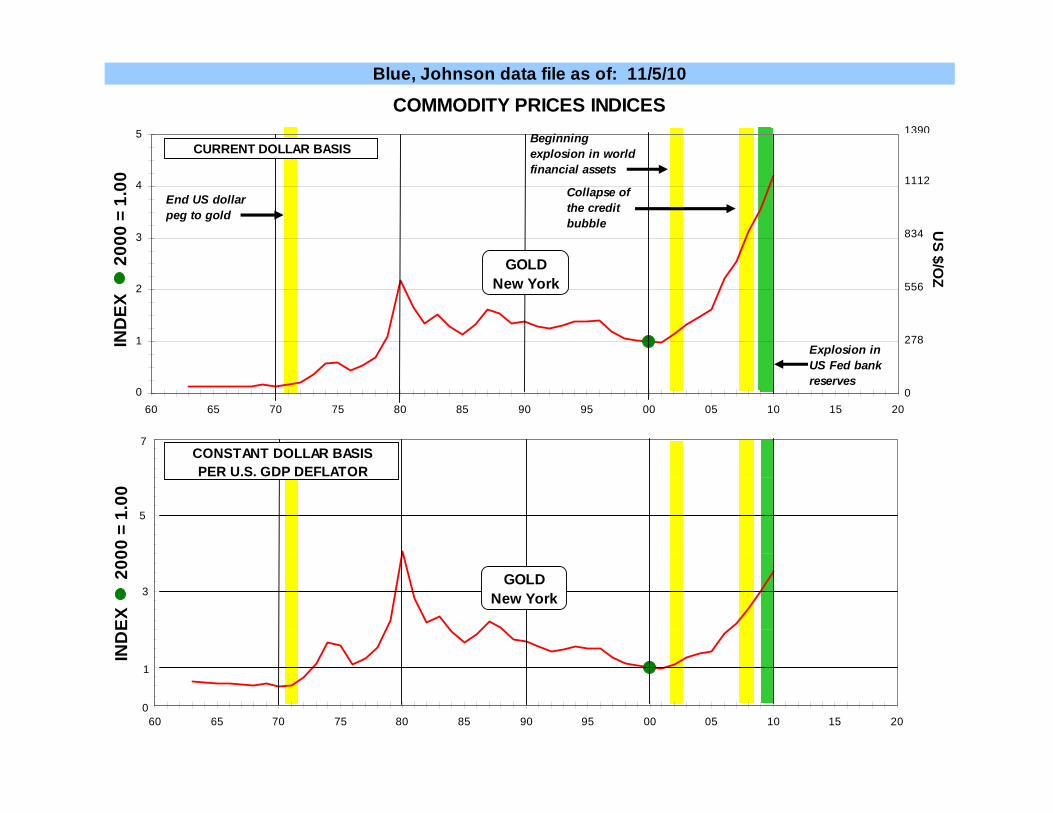
COMMODITY PRICES INDICES
0
1
2
3
4
5
60 65 70 75 80 85 90 95 00 05 10 15 20
CURRENT DOLLAR BASIS
60 65 70 75 80 85 90 95 00 05 10 15 20
CONSTANT DOLLAR BASISPER U.S. GDP DEFLATOR
IND
EX
20
00 =
1.0
0
GOLDNew York
IND
EX
20
00 =
1.0
0
GOLDNew York
0
1
3
5
7
US $/O
Z
0
278
556
834
1112
1390
End US dollarpeg to gold
Beginning explosion in world financial assets
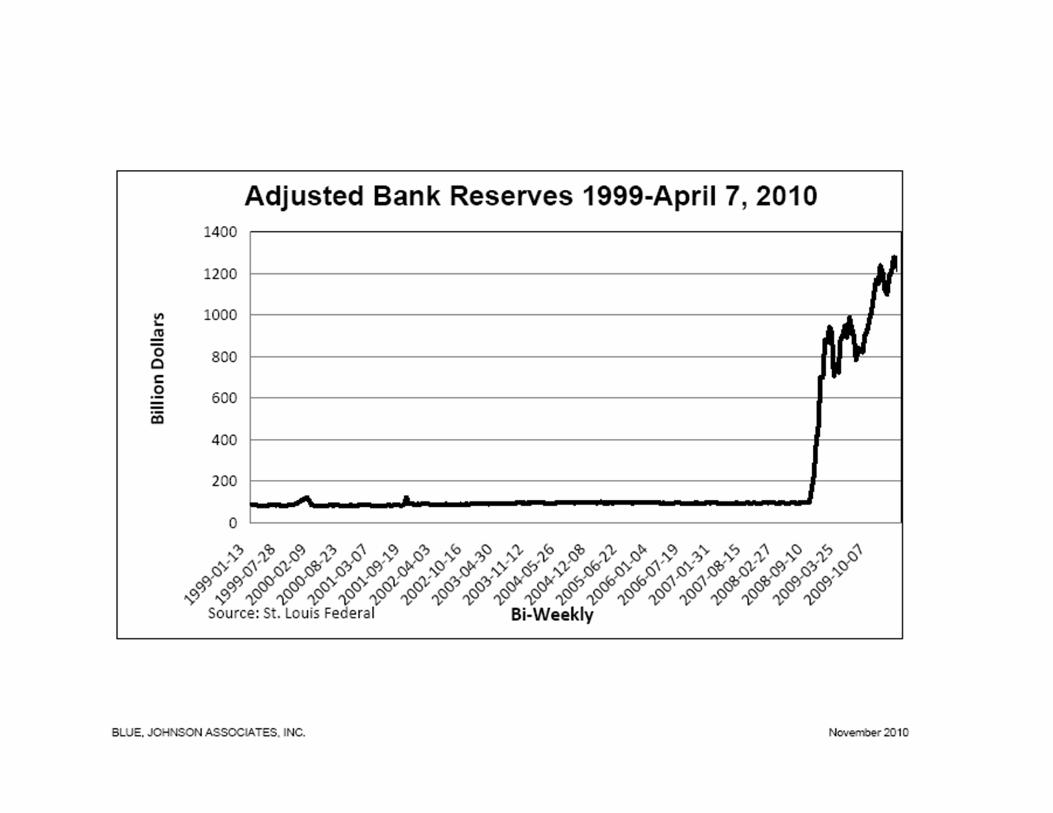
Explosion in US Fed bank reserves
Collapse of the credit bubble
Blue, Johnson data file as of: 11/5/10
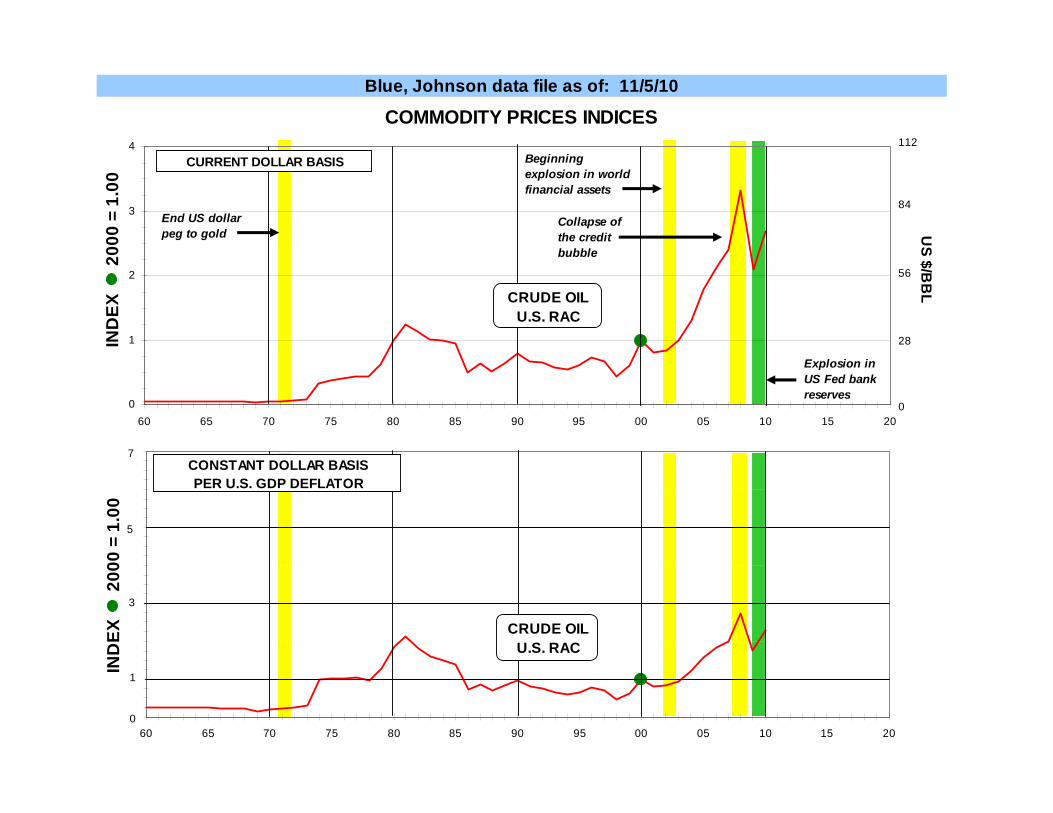
COMMODITY PRICES INDICES
60 65 70 75 80 85 90 95 00 05 10 15 20
CONSTANT DOLLAR BASISPER U.S. GDP DEFLATOR
0
1
2
3
4
60 65 70 75 80 85 90 95 00 05 10 15 20
CURRENT DOLLAR BASIS
End US dollarpeg to gold
Beginning explosion in world financial assets
Explosion in US Fed bank reserves
IND
EX
20
00 =
1.0
0
CRUDE OILU.S. RAC
IND
EX
20
00 =
1.0
0
CRUDE OILU.S. RAC
0
1
3
7
5
112
84
56
28
0
US $/B
BL
Collapse of the credit bubble
Blue, Johnson data file as of: 11/5/10
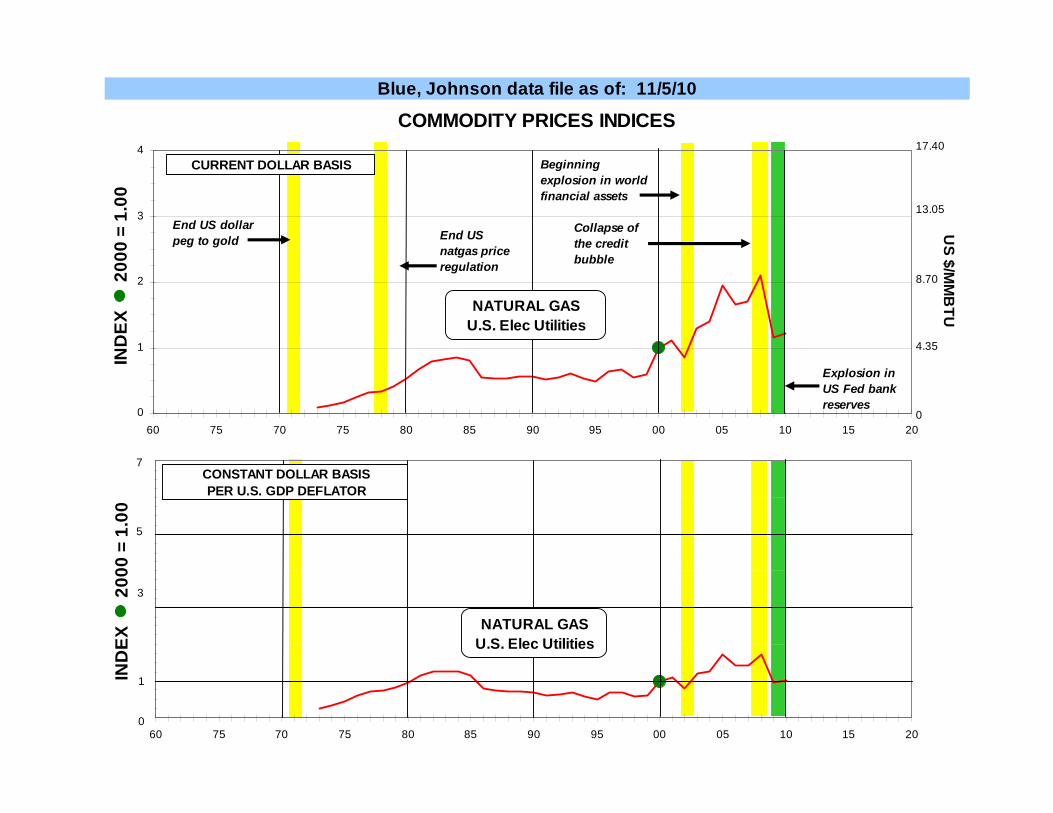
COMMODITY PRICES INDICES
0
1
2
3
4
60 75 70 75 80 85 90 95 00 05 10 15 20
CURRENT DOLLAR BASIS
End US dollarpeg to gold
Beginning explosion in world financial assets
Explosion in US Fed bank reserves
End US natgas price regulation
60 75 70 75 80 85 90 95 00 05 10 15 20
CONSTANT DOLLAR BASISPER U.S. GDP DEFLATOR
IND
EX
20
00 =
1.0
0
NATURAL GASU.S. Elec Utilities
IND
EX
20
00 =
1.0
0
NATURAL GASU.S. Elec Utilities
0
1
3
5
7
17.40
13.05
8.70
4.35
0
US $/M
MB
TU
Collapse of the credit bubble

Blue, Johnson data file as of: 11/5/10
COMMODITY PRICES INDICES
60 65 70 75 80 85 90 95 00 05 10 15 20
CONSTANT DOLLAR BASISPER U.S. GDP DEFLATOR
0
1
2
3
4
60 65 70 75 80 85 90 95 00 05 10 15 20
CURRENT DOLLAR BASIS
End US dollarpeg to gold
Beginning explosion in world financial assets
Explosion in US Fed bank reserves
IND
EX
20
00 =
1.0
0
UREANOLA Barge
IND
EX
20
00 =
1.0
0
UREANOLA Barge
0
1
3
5
7
US $/STO
N
0
143
286
429
572
Collapse of the credit bubble

Blue, Johnson data file as of: 4/29/10
0
100
200
300
1980 1990 2000 2010 2020
$ tri
llion
1
2
3
4
WORLD "WEALTH"
FINANCIAL ASSETSGDPRATIO: Assets to GDP(scale --->)
?
Blue, Johnson data file as of: 5/26/10
0
2
4
6
1980 1990 2000 2010 2020
US
$ tr
illio
ns
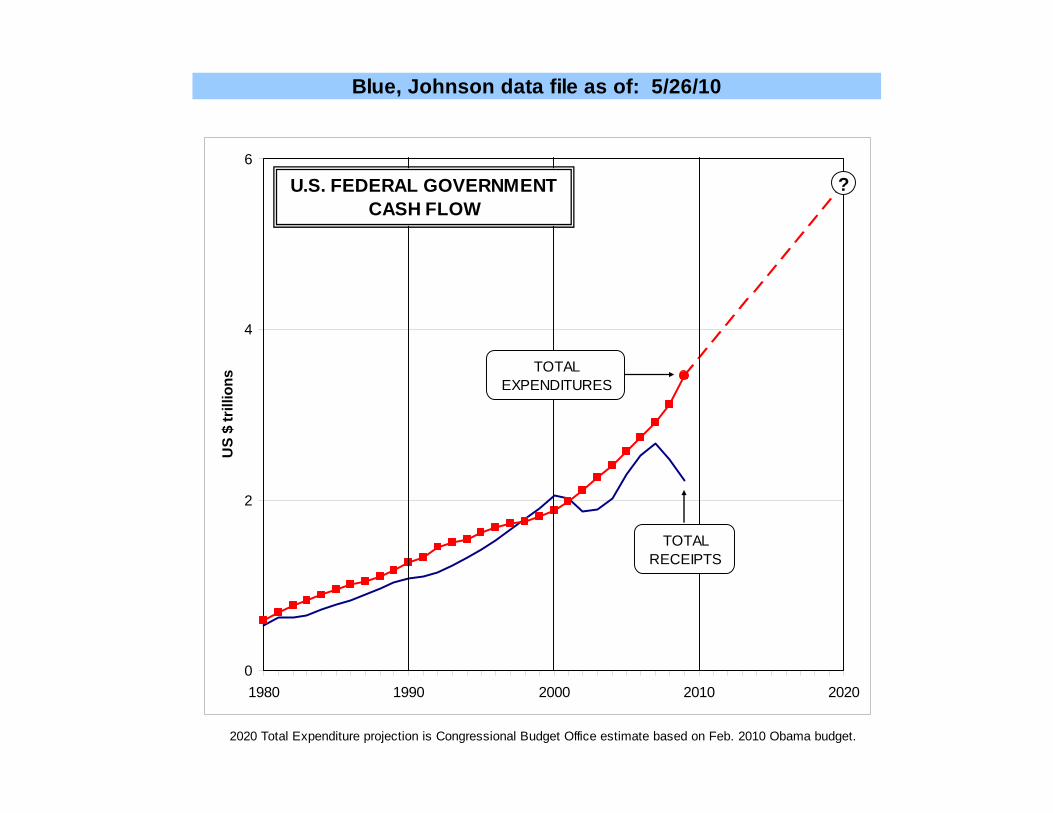
U.S. FEDERAL GOVERNMENT CASH FLOW
TOTAL RECEIPTS
2020 Total Expenditure projection is Congressional Budget Office estimate based on Feb. 2010 Obama budget.
?
TOTAL EXPENDITURES

Blue, Johnson data file as of: 11/5/10
0
500
1000
1500
J 2004 J 2005 J 2006 J 2007 J 2008 J 2009 J 2010
U.S
. $/s
ton
0
5
10
15
US
$/MM
Btu
AMMONIA: Monthly Prices vs. Gas Prices
Ammonia Price, Avg Corn Belt fob (<--- scale)Natural Gas Price, Central Plains Bidweek (scale --->)Central Plains Natural Gas Cost in Ammonia (<--- scale)
Blue, Johnson data file as of: 11/5/10
0
500
1000
1500
J 2004 J 2005 J 2006 J 2007 J 2008 J 2009 J 2010
U.S
. $/s
ton
0
5
10
15
US
$/MM
Btu
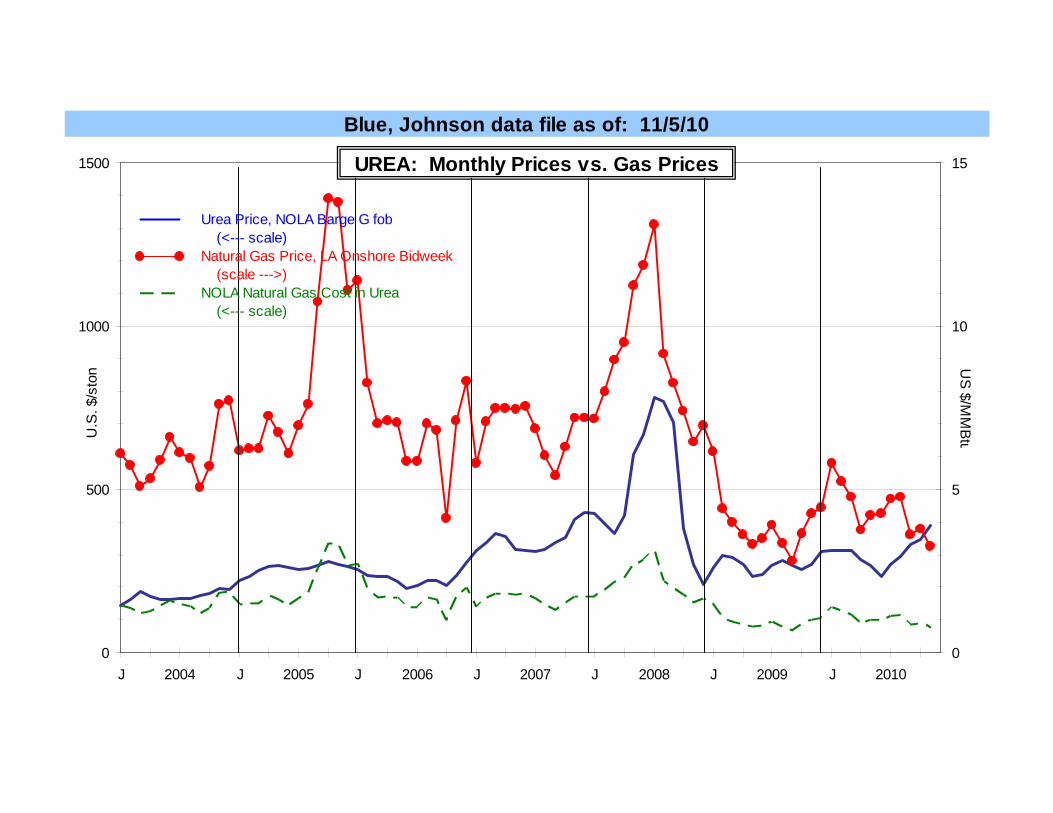
UREA: Monthly Prices vs. Gas Prices
Urea Price, NOLA Barge G fob (<--- scale)Natural Gas Price, LA Onshore Bidweek (scale --->)NOLA Natural Gas Cost in Urea (<--- scale)
Blue, Johnson data file as of: 11/5/10
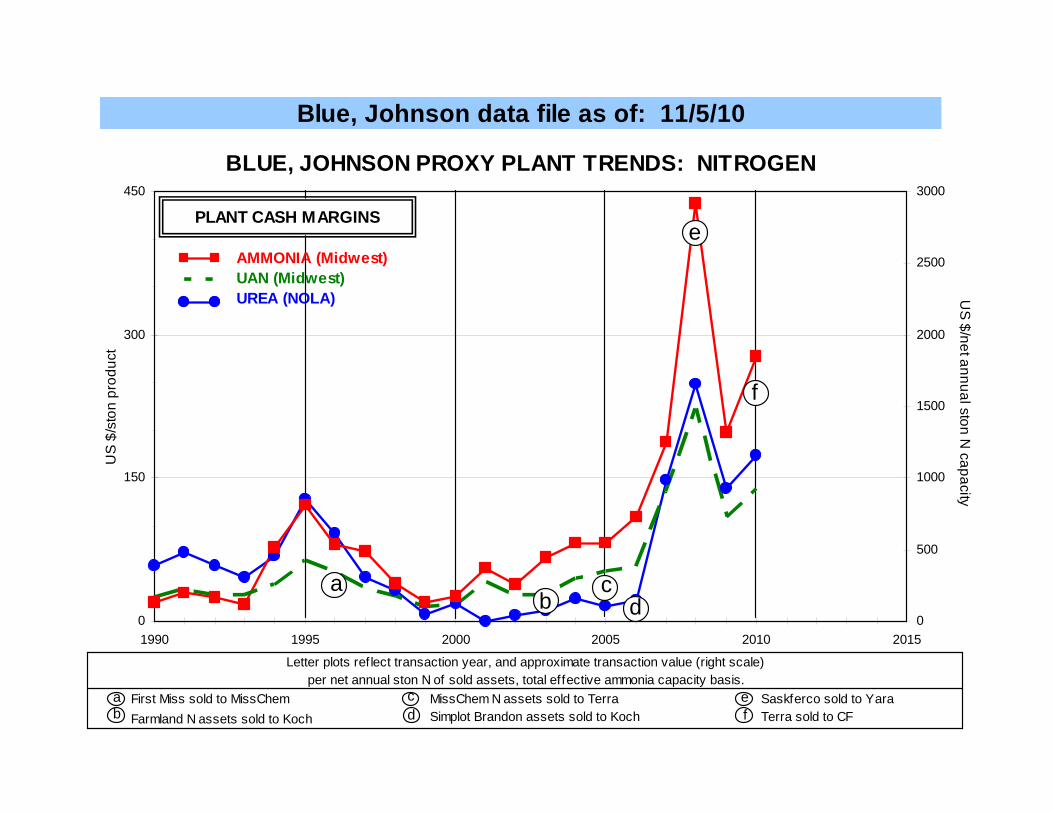
BLUE, JOHNSON PROXY PLANT TRENDS: NITROGEN
0
150
300
450
1990 1995 2000 2005 2010 2015
US
$/s
ton
prod
uct
0
500
1000
1500
2000
2500
3000
PLANT CASH MARGINS
Letter plots ref lect transaction year, and approximate transaction value (right scale)per net annual ston N of sold assets, total effective ammonia capacity basis.
MissChem N assets sold to TerraSimplot Brandon assets sold to Koch
e
f
dba
Saskferco sold to YaraTerra sold to CF
First Miss sold to MissChemFarmland N assets sold to Koch
a
US
$/net annual ston N capacity
bcd
e
c
f
AMMONIA (Midwest)UAN (Midwest)UREA (NOLA)
Blue, Johnson data file as of: 11/5/10
-600
-300
0
300
600
1980 1985 1990 1995 2000 2005 2010 2015
-600
-300
0
300
600
J 2007 J 2008 J 2009 J 2010 J 2011
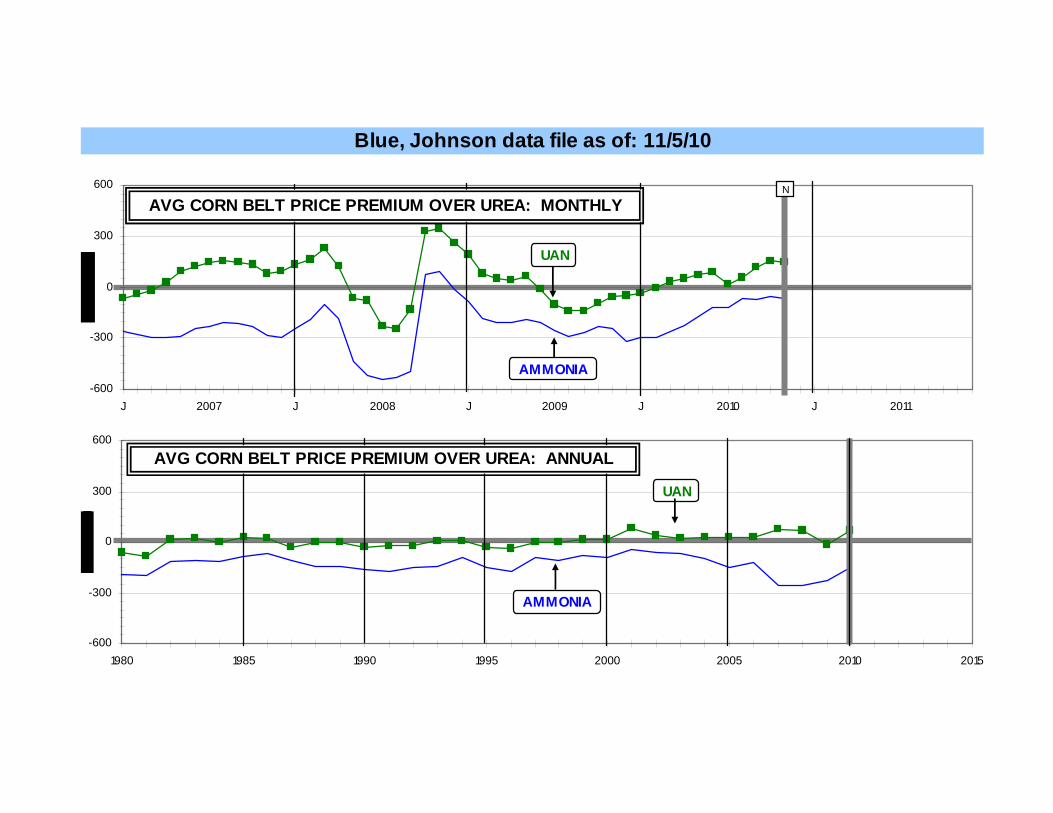
AVG CORN BELT PRICE PREMIUM OVER UREA: MONTHLY
AMMONIA
N
AVG CORN BELT PRICE PREMIUM OVER UREA: ANNUAL
AMMONIA
UAN
UAN
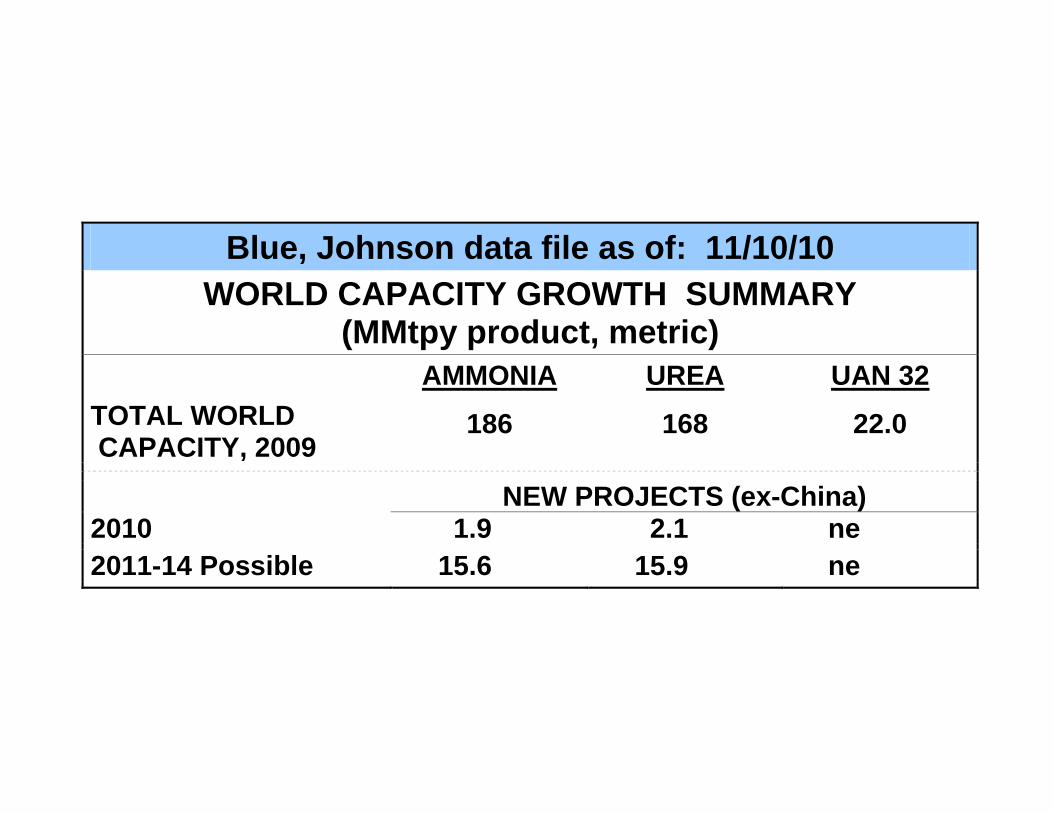
Blue, Johnson data file as of: 11/10/10 WORLD CAPACITY GROWTH SUMMARY
(MMtpy product, metric) AMMONIA UREA UAN 32 TOTAL WORLD CAPACITY, 2009
186 168 22.0 NEW PROJECTS (ex-China) 2010 1.9 2.1 ne 2011-14 Possible 15.6 15.9 ne
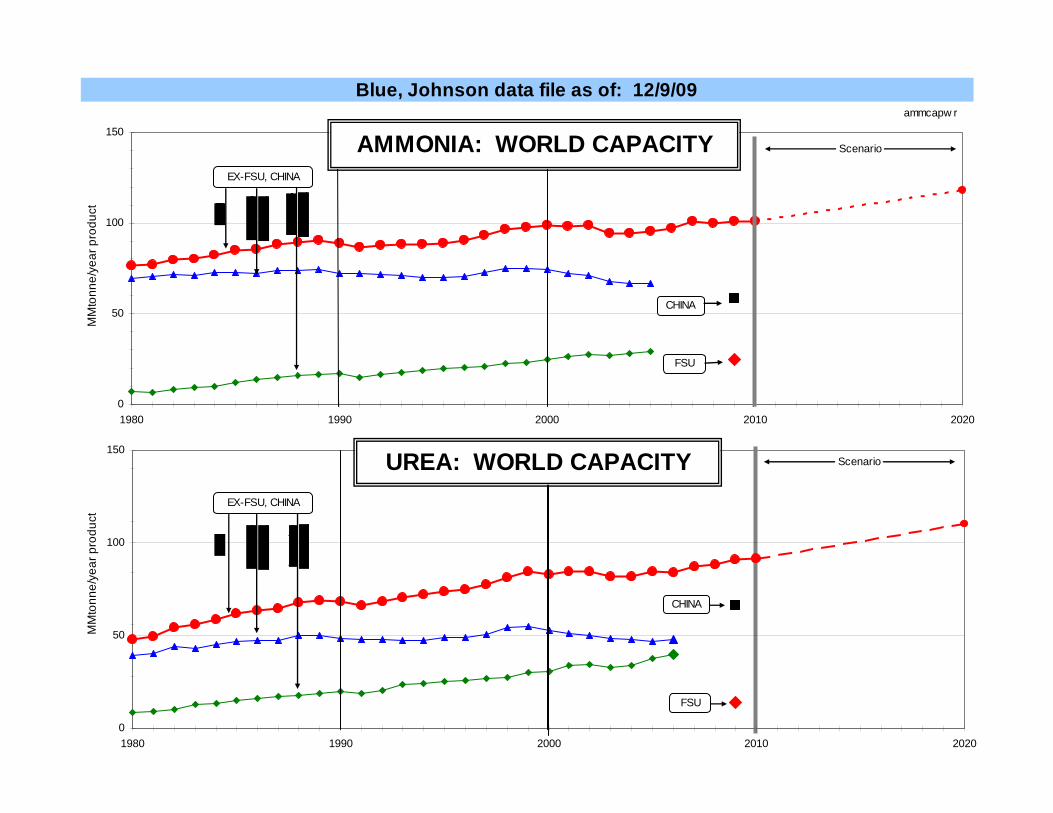
Blue, Johnson data file as of: 12/9/09
0
50
100
150
1980 1990 2000 2010 2020
0
50
100
150
1980 1990 2000 2010 2020
AMMONIA: WORLD CAPACITY
MM
tonn
e/ye
ar p
rodu
ct
EX-FSU, CHINA
FSU
CHINA
ammcapw r
MM
tonn
e/ye
ar p
rodu
ct
EX-FSU, CHINA
CHINA
FSU
UREA: WORLD CAPACITY
Scenario
Scenario
IN CONCLUSION . . . .
U.S. fertilizer use will be up in FY 2011, with N approaching
13 MMstons.
All fertilizer prices are up, significantly correlated to crop
prices. Major suppliers appear to be sticking with a strategy
of supplying/taking orders for one or two months only at a
given price, seems more prevalent than in past marketing
programs.

So, in a scenario where crop prices (especially corn) keep
ramping up, suppliers will have not “oversold” at “current”
prices (below opportunity). Or, if crop prices (corn) seriously
retreat for some reason, suppliers have the option to drop
prices so as to continue to move product. Lessons were
actually learned in 2007, 08, 09.
With corn harvest occurring relatively early, demand for P,
K, and ammonia for Fall application is/has been pretty
strong. Re P&K, though, the uncertainty becomes: if a lot

goes down now, to what degree will that impinge on Spring
demand?
In absolute terms, we see no basic, inherent shortage of N,
P & K supply capability for both the domestic and
international market. The principle issues are, as always,
supply at what price, and is it/will it be in the right place at
the right time?