6 · morbidity & mortality - usrds home pageusrds.org/2005/pdf/06_morb_and_mort_05.pdfb 6 122...
TRANSCRIPT

6morbidity& mortality
may sarton“death and the turtle”
Who will remember you when I have gone,My darling ones, or who remember me?Only in our wild hearts the dead live on.Yet these frail engines bound to mysteryBreak the harsh turn of all creation’s wheel,For we remember China, Greece, and Rome,Our mothers and our fathers, and we stealFrom death itself its rich store, and bring it
home.

B6
122
MORBIDITY & MORTALITYIntroduction
Because of the scope of issues related to mor-bidity and mortality in ESRD patients, we have significantly expanded this chapter. This year, we use interval analyses to present new data on patterns of hospitalization and mortality—over-all and cause-specific—in incident patients, and update analyses of survival in the prevalent pop-ulation. Infectious hospitalizations continue to be a concern, particularly those for pulmonary infections and infections related to vascular ac-cess. We also present Bayesian mortality and hospitalization ratios by provider.
We look again this year at cancer and preg-nancy in women with ESRD, further developing the definitions of these events. New figures com-pare data on morbidity in dialysis, transplant, CKD, and non-CKD patients, examining events such as myocardial infarction and pneumonia. And the final three spreads address withdrawal and hospice care in ESRD patients, incident and prevalent stroke, and dementia.
As illustrated in Figure 6., overall hospital admission rates have altered little since 993. Cause-specific rates, however, have changed dramatically. Infectious and cardiovascular hos-pitalizations are up 23 and 0 percent, respec-tively, while those related to vascular access have fallen 25 percent. By primary diagnosis (shown on the following page), admissions are greatest in patients with diabetes—declining during fol-lowup time for patients on hemodialysis or with a transplant, but rising for those treated with peritoneal dialysis.
Five-year survival rates have improved across all ESRD populations—most dramatically in the transplant population. And new this year is evi-dence that the prevalent mortality rate has de-clined in patients with less than two years on treatment, and that it continues to fall for those with 2–5 years of therapy, and even for those who have been on therapy five or more years. This is a new development, since the overall prevalent mortality rate had been fairly stable for the 6–7 years prior to 2003.
Interval data on cause-specific hospitaliza-tions show that older patients have higher early admission rates, which decline and then slowly increase during the five-year followup period. Asian patients have dramatically lower admis-sion rates, during the entire followup period, for all hospitalizations and for those related to infection and other causes. Rates of admission that include a cardiovascular procedure, par-ticularly stents and angioplasty, tend to increase over time, also true for the small percentage of admissions associated with valvular procedures. And rates of inpatient vascular access insertions fall dramatically during patients’ first five years on therapy.
Overall mortality rates are high in the first six months after initiation of ESRD therapy, then tend to fall in the next six months be-fore increasing steadily during the next four years. These patterns show the dramatic effect of increasing time on dialysis, and the associ-ated changing patterns of overall mortality and
124 · overall hospitalization &
mortality
126 · cause-specific hospitalization
128 · cause-specific mortality
130 · hospitalization & mortality, by modality
132 · Bayesian hospitalization &
mortality ratios
admission rates · survival probabilities · mortality by vintage · expected remaining lifetimes
interval analyses · cardiovascular procedures · vascular access
interval analyses · mortality rates for cardiovascular & other events
admissions & days · admissions for procedures & diagnoses · five-year survival · cause-specific mortality
provider-level ratios overall & for CV disease, infection, & VA, by unit affiliation & U.S. Census division
134 · cancer & pregnancy in
women with ESRD
136 · morbidity in ESRD, CKD, &
non-CKD patients
138 · withdrawal & hospice
140 · stroke
142 · dementia
144 · summary
hospitalization & treatment rates for cancer · pregnancy, birth, & complication rates · outcomes
AMI · CHF · stroke · PVD · pneumonia · bacteremia/septicemia · hip fracture · cancer · mortality rates
geographic variations in withdrawal rates & hospice use · causes of death
first & recurrent stroke · probability of hospitalization & death · DM & HTN
probability of hospitalization & death · costs

Figure 6.1 Cause-specific hospital admission rates have changed dramatically since 1993.
Infectious and cardiovascular hospitalizations are up 23 and 10 percent, respectively, while
those related to vascular access have fallen 25 percent. Figure 6.4 Five-year survival prob-
abilities for ESRD patients continue to rise, despite the greater disease burden now carried
by the incident population. Figures 6.5 Since peaking in 1988, overall mortality rates in
the prevalent dialysis population have fallen 11 percent, from 270 to 240 deaths per 1,000
patient years. Figures 6.90–91 Dementia in ESRD patients is associated with substantial
adverse outcomes: over two years, a 1.8 unadjusted risk of hospitalization, and a striking
two-fold increased risk of death—70 percent of those with dementia die, versus 41 percent
of those without.
93 95 97 99 01 03 0.0
0.5
1.0
1.5
2.0
2.5
Hemodialysis Peritoneal dialysis Transplant All dialysis
Admissions/pt yr at risk Hosp. days/pt yr at risk
93 95 97 99 01 03 0
5
10
15
20
25
95 97 99 01 03
3991 m
orf eg
nahc t
necreP
-30
-20
-10
0
10
20
30
All-cause (2003: -1.6%)
Cardiovascular (2003: 10.4%)
Infection (2003: 22.8%)
Vascular access (2003: -25.4%)
Change in hospital admission rates since 1993 (dialysis)
123
2005 Annual Data Report6MORBIDITY & MORTALITY
Chapter highlights
cause-specific mortality over time. Interestingly, patterns seen for infectious and cardiovascular death are very similar to these.
In the prevalent dialysis population, hospi-talizations for pulmonary infections continue to increase, particularly in patients on hemo-dialysis. Admissions for vascular access infec-tions grew steadily between 993 and 2002, but showed a modest decrease in 2003, possibly due to lower catheter insertion rates. Prevalent death rates continue to improve, yet rates for pa-tients on peritoneal dialysis five years or longer remain high.
This year we assess provider-related out-comes, using Bayesian mortality and hospital-ization ratios to compare data from 2002 and 2003. After adjusting for age, gender, race, pri-mary cause of kidney failure, and time on dialy-
sis, hospital-based units appear to have higher mortality rates than non-hospital-based units. In 2002, there were few significant differences between the individual large chains; in 2003, however, five of the large chains showed signifi-cant differences from each other, with the hos-pital-based units again having higher mortality rates than the non-chain and chain-based pro-viders. Caution should be used in interpreting these figures, since hospital-based units may treat patients with worse vascular access prob-lems and with additional comorbidities and complicating conditions, a basis for their in-creased mortality rates.
The complexity of the dialysis population is demonstrated by extraordinarily high event rates across all organ systems. Event rates in dialy-sis patients are much greater than those of non-CKD patients, and their mortality rates advance more dramatically with age than do the rates of transplant, CKD, and non-CKD patients.
Overall, hospitalization rates in dialysis pa-tients have leveled off and for infection and cardiovascular disease, have decreased slightly. Improvements in preventive care are most likely associated with decreases in rates of events such as those noted for vascular access and infectious hospitalizations, and with progressively lower mortality rates for both incident and prevalent populations. These findings suggest that in-creased attention to the clinical practice guide-lines may be having an impact on the morbidity and mortality of ESRD patients.
6. · Change in hospital admissions rates, & adjusted admissions & days by modality: prevalent patientstop graph: period prevalent dialysis patients; rates adjusted for age, gender, race, & primary diagnosis. ESRD patients, 2003, used as reference cohort. Vascular access hospital-izations are “pure” inpatient vascular access events, as described in Appendix A. Bottom graphs: period prevalent patients; rates adjusted for age, gender, race, & primary diagnosis. ESRD patients, 2003, used as reference cohort.
Months after day 90 of ESRD6 12 18 24 30 36 42 48 54 60
ksir ta raey tne it a
p rep s
noissi
md
A 1.0
1.4
1.8
2.2
2.6
Diabetes HTNGNOther
All Hemodialysis
6 12 18 24 30 36 42 48 54 601.0
1.4
1.8
2.2
2.6
6 12 18 24 30 36 42 481.0
1.4
1.8
2.2
2.6
6 12 18 24 300.0
0.5
1.0
1.5Peritoneal dialysis Transplant
Months after initiation
6 12 18 24 30 36 42 48 54 60
ksir ta raey tneita
p rep s
noissi
md
A 1.0
1.5
2.0
2.5
3.0
3.5
4.0
4.5
5.0Diabetes Hypertension Glomerulonephritis Other
6
124
MORBIDITY & MORTALITY
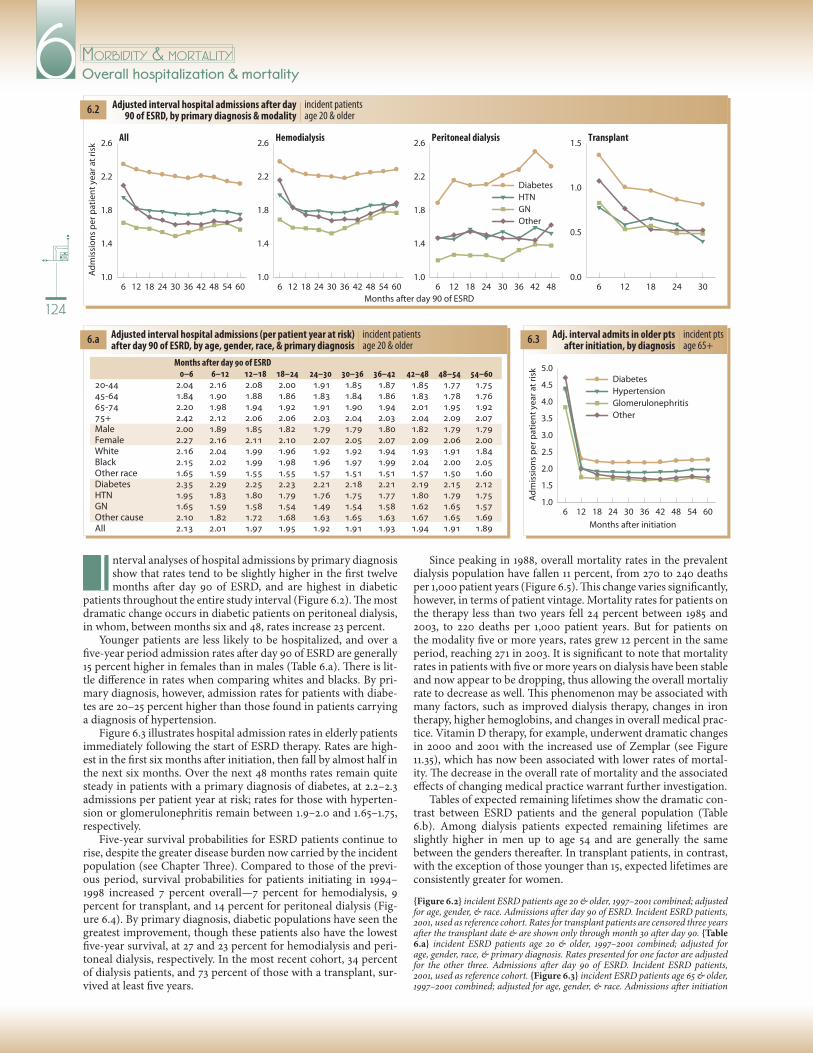
6.2 incident patients age 20 & older
Adjusted interval hospital admissions after day 90 of ESRD, by primary diagnosis & modality
nterval analyses of hospital admissions by primary diagnosis show that rates tend to be slightly higher in the first twelve months after day 90 of ESRD, and are highest in diabetic
patients throughout the entire study interval (Figure 6.2). The most dramatic change occurs in diabetic patients on peritoneal dialysis, in whom, between months six and 48, rates increase 23 percent.
Younger patients are less likely to be hospitalized, and over a five-year period admission rates after day 90 of ESRD are generally 5 percent higher in females than in males (Table 6.a). There is lit-tle difference in rates when comparing whites and blacks. By pri-mary diagnosis, however, admission rates for patients with diabe-tes are 20–25 percent higher than those found in patients carrying a diagnosis of hypertension.
Figure 6.3 illustrates hospital admission rates in elderly patients immediately following the start of ESRD therapy. Rates are high-est in the first six months after initiation, then fall by almost half in the next six months. Over the next 48 months rates remain quite steady in patients with a primary diagnosis of diabetes, at 2.2–2.3 admissions per patient year at risk; rates for those with hyperten-sion or glomerulonephritis remain between .9–2.0 and .65–.75, respectively.
Five-year survival probabilities for ESRD patients continue to rise, despite the greater disease burden now carried by the incident population (see Chapter Three). Compared to those of the previ-ous period, survival probabilities for patients initiating in 994–998 increased 7 percent overall—7 percent for hemodialysis, 9 percent for transplant, and 4 percent for peritoneal dialysis (Fig-ure 6.4). By primary diagnosis, diabetic populations have seen the greatest improvement, though these patients also have the lowest five-year survival, at 27 and 23 percent for hemodialysis and peri-toneal dialysis, respectively. In the most recent cohort, 34 percent of dialysis patients, and 73 percent of those with a transplant, sur-vived at least five years.
Overall hospitalization & mortality
6.3 incident pts age 65+
Adj. interval admits in older pts after initiation, by diagnosis6.a incident patients
age 20 & olderAdjusted interval hospital admissions (per patient year at risk) after day 90 of ESRD, by age, gender, race, & primary diagnosis
Since peaking in 988, overall mortality rates in the prevalent dialysis population have fallen percent, from 270 to 240 deaths per ,000 patient years (Figure 6.5). This change varies significantly, however, in terms of patient vintage. Mortality rates for patients on the therapy less than two years fell 24 percent between 985 and 2003, to 220 deaths per ,000 patient years. But for patients on the modality five or more years, rates grew 2 percent in the same period, reaching 27 in 2003. It is significant to note that mortality rates in patients with five or more years on dialysis have been stable and now appear to be dropping, thus allowing the overall mortaliy rate to decrease as well. This phenomenon may be associated with many factors, such as improved dialysis therapy, changes in iron therapy, higher hemoglobins, and changes in overall medical prac-tice. Vitamin D therapy, for example, underwent dramatic changes in 2000 and 200 with the increased use of Zemplar (see Figure .35), which has now been associated with lower rates of mortal-ity. The decrease in the overall rate of mortality and the associated effects of changing medical practice warrant further investigation.
Tables of expected remaining lifetimes show the dramatic con-trast between ESRD patients and the general population (Table 6.b). Among dialysis patients expected remaining lifetimes are slightly higher in men up to age 54 and are generally the same between the genders thereafter. In transplant patients, in contrast, with the exception of those younger than 5, expected lifetimes are consistently greater for women.
{Figure 6.2} incident ESRD patients age 20 & older, 997–200 combined; adjusted for age, gender, & race. Admissions after day 90 of ESRD. Incident ESRD patients, 200, used as reference cohort. Rates for transplant patients are censored three years after the transplant date & are shown only through month 30 after day 90. {Table 6.a} incident ESRD patients age 20 & older, 997–200 combined; adjusted for age, gender, race, & primary diagnosis. Rates presented for one factor are adjusted for the other three. Admissions after day 90 of ESRD. Incident ESRD patients, 200, used as reference cohort. {Figure 6.3} incident ESRD patients age 65 & older, 997–200 combined; adjusted for age, gender, & race. Admissions after initiation
Months after day 90 of ESRD 0–6 6–12 12–18 18–24 24–30 30–36 36–42 42–48 48–54 54–6020-44 2.04 2.16 2.08 2.00 1.91 1.85 1.87 1.85 1.77 1.7545-64 1.84 1.90 1.88 1.86 1.83 1.84 1.86 1.83 1.78 1.7665-74 2.20 1.98 1.94 1.92 1.91 1.90 1.94 2.01 1.95 1.9275+ 2.42 2.12 2.06 2.06 2.03 2.04 2.03 2.04 2.09 2.07Male 2.00 1.89 1.85 1.82 1.79 1.79 1.80 1.82 1.79 1.79Female 2.27 2.16 2.11 2.10 2.07 2.05 2.07 2.09 2.06 2.00White 2.16 2.04 1.99 1.96 1.92 1.92 1.94 1.93 1.91 1.84Black 2.15 2.02 1.99 1.98 1.96 1.97 1.99 2.04 2.00 2.05Other race 1.65 1.59 1.55 1.55 1.57 1.51 1.51 1.57 1.50 1.60Diabetes 2.35 2.29 2.25 2.23 2.21 2.18 2.21 2.19 2.15 2.12HTN 1.95 1.83 1.80 1.79 1.76 1.75 1.77 1.80 1.79 1.75GN 1.65 1.59 1.58 1.54 1.49 1.54 1.58 1.62 1.65 1.57Other cause 2.10 1.82 1.72 1.68 1.63 1.65 1.63 1.67 1.65 1.69All 2.13 2.01 1.97 1.95 1.92 1.91 1.93 1.94 1.91 1.89
I

0 12 24 36 48 60
ytiliba
bor
p lavivruS
0.2
0.4
0.6
0.8
1.0
Dial. ( 31.1)HD (31.6)PD ( 28.7)Tx (67.5)All (35.7)
All patients, by modality HD pts, by primary diagnosis
0 12 24 36 48 60
PD pts, by primary diagnosis
Months after initiation
0 12 24 36 48 60
DM (23.8)HTN (36.1)GN (42.0)Other (35.6) All (31.6)
DM (18.5)HTN (35.2)GN (43.1)Other (34.8) All (28.7)
86 88 90 92 94 96 98 00 02
ksir ta sraey tneita
p 000,1 rep s
htaeD 210
240
270
300
<2 years
2-<5 years
5+ years
All
0 12 24 36 48 60
ytiliba
bor
p la vi vru S
0.2
0.4
0.6
0.8
1.0
Dial. (33.6) HD (33.9)PD (32.7)Tx (73.3)All (38.1)
All patients, by modality HD pts, by primary diagnosis
Months after initiation
0 12 24 36 48 60
DM (26.7)HTN (38.0)GN (44.8)Other (36.3)All (33.9)
0 12 24 36 48 60
PD pts, by primary diagnosis
DM (22.8)HTN (38.6)GN (46.1)Other (39.5)All (32.7)
125
2005 Annual Data Report6MORBIDITY & MORTALITY
6.4 incident dialysis patients & patients receiving a first-transplant in the calendar year
Adjusted five-year survival, by modality & primary diagnosis
6.5 period prevalent dialysis patients
Adjusted mortality rates, by vintage
6.b general U.S. population, 2002, & prevalent dialysis & transplant patients, 2003
Expected remaining lifetimes (years) of the general U.S. population & dialysis & transplant patients, by age, gender, & race
of ESRD. Incident ESRD patients, 200, used as ref-erence cohort. {Figure 6.4} incident dialysis patients & patients receiving a first transplant in the calen-dar year. All probabilities are adjusted for age, gen-der, & race; overall probabilities are also adjusted for primary diagnosis. All ESRD patients, 996, used as reference cohort. Modality determined on first ESRD service date; excludes patients transplanted or dying during the first 90 days (five-year survival probabili-ties noted in parentheses). {Figure 6.5} period prev-alent dialysis patients; adjusted for age, gender, race, & primary diagnosis. Dialysis patients, 200, used as reference cohort. {Table 6.b} U.S. data: calcu-lated from Tables –9 in the United States life tables (Arias E). Available at www.cdc.gov/nchs/data/nvsr/nvsr53/nvsr53_06.pdf. ESRD data: prevalent dialysis & transplant patients, 2003. Expected remaining life-times by race & gender can be found in Reference Table H.3. *2003 prevalent ESRD population is the weight used to calculate the overall combined age remaining lifetime.
General U.S. population, 2002 All races White Black Age All M F All M F All M F0-14 70.9 68.2 73.4 71.3 68.7 73.7 66.4 62.9 69.715-19 61.1 58.4 63.6 61.4 58.9 63.9 56.7 53.3 59.920-24 56.3 53.8 58.7 56.7 54.2 59.0 52.0 48.7 55.025-29 51.6 49.1 53.9 51.9 49.5 54.2 47.4 44.3 50.230-34 46.8 44.4 49.0 47.1 44.8 49.3 42.8 39.8 45.535-39 42.1 39.8 44.2 42.4 40.1 44.5 38.3 35.4 40.840-44 37.5 35.2 39.5 37.7 35.6 39.7 33.9 31.1 36.345-49 33.0 30.8 34.9 33.2 31.1 35.1 29.7 26.9 32.050-54 28.6 26.6 30.4 28.8 26.8 30.5 25.7 23.1 27.855-59 24.4 22.5 26.0 24.5 22.7 26.1 22.0 19.6 23.960-64 20.4 18.7 21.9 20.5 18.8 21.9 18.5 16.4 20.165-69 16.8 15.2 18.0 16.8 15.2 18.0 15.3 13.5 16.770-74 13.4 12.0 14.4 13.4 12.0 14.4 12.4 10.8 13.575-79 10.4 9.3 11.1 10.3 9.2 11.1 9.9 8.6 10.780-84 7.8 6.9 8.3 7.7 6.9 8.2 7.8 6.8 8.385+ 4.3 3.8 4.5 4.2 3.7 4.3 4.6 4.2 4.8 overall* 25.2 23.4 26.6 25.3 23.5 26.7 23.0 20.8 24.7
1989–1993
1994–1998
ESRD patients, 2003 Dialysis Transplant Age All M F All M F0-14 18.3 19.2 17.3 50.0 50.2 49.915-19 16.0 16.9 15.1 39.7 39.6 39.820-24 13.9 14.8 12.9 36.2 36.1 36.425-29 12.0 12.7 11.3 32.3 32.1 32.630-34 10.5 10.8 10.0 28.5 28.3 28.935-39 9.0 9.2 8.7 25.2 24.8 25.840-44 7.8 8.0 7.6 21.9 21.5 22.745-49 6.8 7.0 6.7 19.0 18.5 19.850-54 5.9 6.0 5.9 16.3 15.7 17.255-59 5.0 5.0 5.0 13.8 13.2 14.760-64 4.3 4.3 4.4 11.5 11.0 12.565-69 3.7 3.6 3.7 9.6 9.1 10.670-74 3.1 3.1 3.1 7.9 7.4 8.975-79 2.6 2.6 2.7 6.7 6.2 7.780-84 2.2 2.2 2.2 85+ 1.8 1.7 1.8 overall* 5.5 5.6 5.4 15.1 14.6 15.9

White Black
ksir ta r aey tneit a
p rep s
no is si
md
A
1.5
2.0
2.5 All hospitalizations
0.3
0.4
0.5
0.6
0.7
0.8
Months after day 90 of ESRD
6 12 18 24 30 36 42 48 54 600.3
0.4
0.5
0.6
6 12 18 24 30 36 42 48 54 600.8
0.9
1.0
1.1
1.2
1.3
Cardiovascular disease
Infection Other
20-4445-64
65-7475+
ksir ta raey tn eit a
p rep s
nois si
md
A
1.5
2.0
2.5
Male Female
All hospitalizations
0.4
0.5
0.6
0.7
Months after day 90 of ESRD
6 12 18 24 30 36 42 48 54 600.3
0.4
0.5
0.6
6 12 18 24 30 36 42 48 54 600.8
0.9
1.0
1.1
1.2
Cardiovascular disease
Infection Other
ksir t a raey tne ita
p r ep s
no is si
md
A
1.0
1.5
2.0
2.5
Native American Asian
Hispanic
All hospitalizations
0.3
0.4
0.5
0.6
0.7
Months after day 90 of ESRD
6 12 18 24 30 36 42 48 54 600.2
0.3
0.4
0.5
0.6
6 12 18 24 30 36 42 48 54 600.4
0.6
0.8
1.0
1.2
1.4
Cardiovascular disease
Infection Other
6
126
MORBIDITY & MORTALITYCause-specific hospitalization
6.6 incident dialysis patients age 20 & older
by age
Adjusted interval cause-specific
hospital admissions after day 90
6.7 incident dialysis patients age 20 & older
by gender
6.8 incident dialysis patients age 20 & older
by race/ethnicity
t six months after day 90 of ESRD, hospital admissions over-all are highest in patients age 75 and older (Figure 6.6). At 2 months rates fall slightly and are comparable to those for
patients age 20–44; they remain so through the following four years. Not surprisingly, admissions for cardiovascular complications are highest in older patients.
Women tend to have slightly higher admission rates overall and for cardiovascular disease, infection, and other complications (Fig-ure 6.7). It is noteworthy that their cardiovascular admissions are higher—a cause for concern, since in the general population cardiac disease is the greatest cause of mortality in women.
Hospitalization rates for all causes are comparable in whites and blacks, and lowest in the Asian population (Figure 6.8). Asians also have lower admission rates for cardiovascular disease, though a clear increase in these rates is evident starting at month 24.
Figures 6.9– illustrate rates for admissions with cardiovascu-lar procedures. At month six, rates are highest in patients age 65–74, and a distinct upward trend is evident over the five-year period for patients age 45–64 (Figure 6.9). Patients age 45–74 are the most likely to have an admission for a bypass procedure, and admissions with a stent insertion or angioplasty are highest for this group as well.
Overall, women have approximately 0 percent higher rates for admissions with a cardiovascular procedure; rates by gender, how-ever, vary by procedure. Rates for admissions with bypass surgery, for example, are 5–4 percent lower in women, while those with stents or angioplasty are 7–20 percent lower (Figure 6.0).
By race, rates for admissions with all cardiovascular procedures are similar in whites and blacks, but cause-specific rates can vary considerably (Figure 6.). At month six, blacks have 47 percent fewer admissions with bypass surgery and 42 fewer admissions with a stent or angioplasty. This disparity is evident throughout the five-year period, though the differences do narrow in the later months.
Inpatient vascular access insertion rates are highest at month six for all age groups, and fall quite dramatically thereafter (Fig-ure 6.2). Catheter insertion rates are higher than those for fistu-las or grafts in all age groups—at month six, for example, rates for catheters are 6–8 times higher than those for fistulas and 3–4 times higher than those for grafts.
Overall inpatient vascular access insertion rates are higher in females than in males; this is also true for catheter and graft insertions (Figure 6.3). Women have 9–36 percent higher cath-eter insertion rates, but have slightly lower fistula creation rates. Rates of graft creation are higher in females, which may indicate that female vasculature is more suited to graft creation than fis-tula creation.
By race, overall inpatient vascular access insertion rates at month six are 40 percent higher in Hispanics than in whites, but while these higher rates are evident throughout the entire five-year interval, the relative difference decreases as time on ESRD grows (Figure 6.4). Insertion rates for catheters are highest in Hispanics through the first two years, but are then surpassed by rates for blacks until year four, at which point there is virtually no difference.
The remarkably high rate of inpatient catheter insertions should serve as a reminder that practitioners need to move toward greater compliance with K/DOQI vascular access guidelines, which call for increased use of fistulas as the primary vascular access.
{All figures} incident dialysis patients, 200, used as reference cohort; rates by age are adjusted for gender, race, & primary diagnosis; rates by gender are adjusted for age, race, & primary diagnosis; rates by race/ethnicity are adjusted for age, gen-der, & primary diagnosis. {Figures 6.6–8} incident dialysis patients age 20 & older, 997–200 combined; cause-specific categories determined from princi-pal ICD-9-CM diagnosis codes. {Figures 6.9–} incident dialysis patients age 20 & older, 997–200 combined. Values are admission (not event) rates. Rates reflect all admissions with a cardiovascular procedure (excluding vascular access proce-dures), not just those for the primary purpose of a cardiovascular procedure. A hospitalization that includes more than one type of cardiovascular procedure will be counted under each type. {Figures 6.2–4} incident hemodialysis patients age 20 & older, 997–200 combined. Vascular access insertions in an inpatient setting are obtained from Part B physician/supplier claims.
A

k sir t a sr aey tne ita
p 00 0,1 r ep s
nois si
md
A
300
350
400
450
500 All cardiovascular procedures
0
5
10
15
20
Months after day 90 of ESRD
6 12 18 24 30 36 42 48 54 6010
20
30
40
50
6 12 18 24 30 36 42 48 54 600
2
4
6
8
10
Bypass
Stent/angioplasty Valve procedures
20-4445-64
65-7475+
ksir ta srae y tneita
p 000, 1 rep s
no issi
md
A
300
350
400
450
500
Male Female
0
5
10
15
20
Months after day 90 of ESRD
6 12 18 24 30 36 42 48 54 6020
25
30
35
40
6 12 18 24 30 36 42 48 54 602
4
6
8
All cardiovascular procedures Bypass
Stent/angioplasty Valve procedures
6 12 18 24 30 36 42 48 54 600
2
4
6
8
10
ksir ta sra ey tneita
p 0 00 ,1 r ep s
noi ssi
md
A
250
300
350
400
450
White Black
Other Hisp.
0
5
10
15
20
Months after day 90 of ESRD
6 12 18 24 30 36 42 48 54 6010
20
30
40
50
All cardiovascular procedures Bypass
Stent/angioplasty Valve procedures
ksir ta sraey tneita
p 000,1 rep s
noitresnI
300
400
500
600
700 All vascular access insertions
200
300
400
500
Months after day 90 of ESRD
6 12 18 24 30 36 42 48 54 600
20
40
60
80
6 12 18 24 30 36 42 48 54 600
50
100
150
Catheters
Fistulas Grafts
65-7475+
20-4445-64
ksir ta sraey tneita
p 000,1 rep s
noitresnI
200
300
400
500
600
700
Male Female
200
300
400
500
Months after day 90 of ESRD
6 12 18 24 30 36 42 48 54 600
20
40
60
80
6 12 18 24 30 36 42 48 54 600
50
100
150
All vascular access insertions Catheters
Fistulas Grafts
ksir ta sraey tneita
p 000,1 rep s
noitr esnI
100
300
500
700
900
White Black OtherHispanic
200
300
400
500
600
Months after day 90 of ESRD
6 12 18 24 30 36 42 48 54 6010
30
50
70
90
6 12 18 24 30 36 42 48 54 600
50
100
150
200
All vascular access insertions Catheters
Fistulas Grafts
127
2005 Annual Data Report6MORBIDITY & MORTALITY
6.9 incident dialysis patients age 20 & older
by age
Adjusted interval admissions with
cardiovascular procedures after day 90
6.10 incident dialysis patients age 20 & older
by gender
6.11 incident dialysis patients age 20 & older
by race/ethnicity
6.12 incident hemodialysis patients age 20 & older
by age
Adjusted interval inpatient
Vascular access insertions after day 90
6.13 incident hemodialysis patients age 20 & older
by gender
6.14 incident hemodialysis patients age 20 & older
by race/ethnicity

Months after day 90
6 12 18 24 30 36 42 48 54 600
10
20
30
40
ksir ta sraey tneita
p 000 ,1 r ep s
htaeD
0
50
100
150
200
250
300 All
0
30
60
90
120
150
6 12 18 24 30 36 42 48 54 600
20
40
60
80
100
Cardiovascular disease
Infection Other45-6465-7475+
0-1920-44
ksir ta sra ey tnei ta
p 0 00, 1 rep s
htaeD
0
40
80
120
160
Male Female
All
0
20
40
60
80
Months after day 90
6 12 18 24 30 36 42 48 54 600
5
10
15
20
25
6 12 18 24 30 36 42 48 54 600
10
20
30
40
50
60
Cardiovascular disease
Infection Other
k sir ta sraey tn eita
p 00 0,1 rep s
hta eD
0
50
100
150
200 All
0
20
40
60
80
100
Months after day 90
6 12 18 24 30 36 42 48 54 600
10
20
30
40 White Black N AmAsian
6 12 18 24 30 36 42 48 54 600
20
40
60
80
Cardiovascular disease
Infection Other
6
128
MORBIDITY & MORTALITYCause-specific mortality
6.15 incident dialysis patients
by age
Adjusted interval cause-specific mortality
6.16 incident dialysis patients
by gender
nterval analyses of cause-specific mortality (starting 90 days after initiation of therapy) show that, across catego-ries of age, gender, and race, rates tend to be high at six
months, fall—often quite dramatically—over the next six months, and then rise steadily during the following four years (Figures 6.5–7).
By age, for example, overall mortality between months six and 2 falls nearly 2 percent for patients age 75 and older, and 25 per-cent for pediatric patients (Figure 6.5). The decrease is equally dramatic for mortality caused by cardiovascular disease, by infec-tion, and by other causes of death. Between months 2 and 60, rates increase steadily for most age groups; cardiovascular mortality, for example, rises 66 percent for patients age 20–44, and 55 percent for those age 45–64. Rates of infectious mortality in younger adults, in contrast, fall nearly 5 percent in the same period.
The pattern of a sharp fall followed by a steady increase is par-ticularly noticeable in rates by gender (Figure 6.6). Overall rates differ little between males and females. Cardiovascular mortality rates are quite similar in the first year; by five years, however, the rate is 0 percent higher in men. Rates of infectious mortality, how-ever, are consistently greater in women.
With the exception of infectious mortality, rates by race are highest among white patients, and they increase steadily for this population after one year (Figure 6.7). Some of the most dramatic growth by race is seen in the Asian population; overall rates rise 54 percent in the four years following the first year of therapy, while rates of cardiovascular and infectious mortality increase 76 and 63 percent, respectively.
Figures 6.8–26 present interval mortality analyses for major cardiovascular diagnoses, sudden death, malignancy, and infec-tions, including bacteremia/septicemia and pulmonary infection. Many of these also show rates decreasing between months six and 2, then rising steadily over the next four years. In dialysis patients, for example, rates of mortality due to AMI rise 45 percent between months 2 and 60, from 9 to 3 deaths per ,000 patient years (Fig-ure 6.8), while rates of sudden death rise 2 percent in the same period, from 62.5 to 75.4. Rates of mortality due to bacteremia/sep-ticemia in the same population increase 3 percent, from 2 to 6 (Figure 6.24).
Because the transplant population is smaller, and generally healthier as well, mortality rates within it are more volatile than those in the dialysis population. Clear across all causes of death, however, is the lower mortality rate for these patients. At five years after initiation, for example, the rate of mortality due to sudden death is 75 per ,000 patient years in dialysis patients, and only 4 for patients with a transplant.
{Figure 6.5} incident dialysis patients, 997–200 combined; adjusted for gender, race, & primary diagnosis. Incident patients, 996, used as reference cohort. {Fig-ure 6.6} incident dialysis patients, 997–200 combined; adjusted for age, race, & primary diagnosis. Incident patients, 996, used as reference cohort. {Figure 6.7} incident dialysis patients, 997–200 combined; adjusted for age, gender, & pri-mary diagnosis. Incident patients, 996, used as reference cohort. {Figures 6.8–26} incident ESRD patients; adjusted for age, gender, race, & primary diagnosis. Incident patients, 996, used as reference cohort. For Figure 6.2, “sudden death” includes cardiac arrhythmia & cardiac arrest.
6.17 incident dialysis patients
by race
I

8
10
12
14
161992-19961997-2001
Dialysis
6 12 18 24 30 36 42 48 54 60
ksir ta sra ey tnei ta
p 000 ,1 r ep s
hta eD
0
2
4
6Transplant
Months after day 90
2
4
6
81992-19961997-2001
Dialysis
6 12 18 24 30 36 42 48 54 60
ksir ta sraey tnei ta
p 0 00 ,1 r ep s
htaeD
0
1
2
3Transplant
Months after day 90
4
5
6
71992-19961997-2001
Dialysis
6 12 18 24 30 36 42 48 54 60
ksir ta sraey tneita
p 000,1 rep s
htaeD
0.0
0.1
0.2
0.3
0.4Transplant
Months after day 90
60
65
70
75
801992-19961997-2001
Dialysis
6 12 18 24 30 36 42 48 54 60
ksir ta sraey tnei ta
p 000,1 rep s
htaeD
0
10
20
30 Transplant
Months after day 90
5
6
7
8
9
101992-19961997-2001
Dialysis
6 12 18 24 30 36 42 48 54 60
ksir ta sraey tneita
p 000,1 r ep s
h ta eD
0
1
2
3 Transplant
Months after day 90
3
4
5
6
71992-19961997-2001
Dialysis
6 12 18 24 30 36 42 48 54 60
ksir ta sraey tneita
p 000,1 rep s
htaeD
0
1
2
3Transplant
Months after day 90
10
12
14
16
18
20
1992-19961997-2001
Dialysis
6 12 18 24 30 36 42 48 54 60
ksir ta srae y tne i ta
p 00 0, 1 rep s
htaeD
0
1
2
3
4
5
6 Transplant
Months after day 90
2
3
4
5
1997-20011992-1996
Dialysis
6 12 18 24 30 36 42 48 54 60
ksir ta sraey tnei ta
p 00 0, 1 rep s
htaeD
0
1
2
3
4 Transplant
Months after day 90
0
1
2
1992-1996
1997-2001
Dialysis
6 12 18 24 30 36 42 48 54 60
ksir ta sra ey tneita
p 000, 1 rep s
htaeD
0
1
2 Transplant
Months after day 90
129
2005 Annual Data Report6MORBIDITY & MORTALITY
6.18 incident ESRD patients
Adjusted mortality, by time period: AMI 6.19 incident
ESRD patientsAdjusted mortality, by
time period: ASHD 6.20 incident ESRD patients
Adjusted mortality, by time period: cardiomyopathy
6.21 incident ESRD patients
Adjusted mortality, by time period: sudden death 6.22 incident
ESRD ptsAdj. mortality, by time period:
cerebrovascular disease 6.23 incident ESRD patients
Adjusted mortality, by time period: malignancy
6.24 incident ESRD pts
Adjusted mortality, by time period: bacteremia/septicemia 6.25 incident
ESRD ptsAdj. mortality, by time
period: pulmonary infection 6.26 incident ESRD pts
Adjusted mortality, by time period: other infection

t month six after day 90 of ESRD, adjusted hospi-tal admission rates for peritoneal dialysis patients are 24 percent lower than those for hemodialy-
sis patients (Figure 6.27). As time on dialysis increases, however, these differences lessen, and by year three the rates are the same. Transplant patients are admitted to the hospital far less often than their dialysis counter-parts, and their admission rates fall as their time with a functioning graft increases. Transplant patients also spend less time in the hospital. At month six, for exam-ple, hospital days for these patients are 50 and 27 percent lower than those of hemodialysis and peritoneal dialysis patients, respectively.
In hemodialysis patients, admission rates for cardio-vascular disease are 8–33 percent higher than those for infection (Figure 6.28). The opposite holds true in peri-toneal patients, in whom, after month six, rates for infec-tion actually outpace rates for cardiovascular disease, and are 8–24 percent higher through year five. Rates of admission for cardiovascular disease and infection are
markedly lower in the transplant population, while hospital days for cardiovascular disease and infection over the study interval are similar within each modality.
Trend analyses show that hospi-tal admissions for pulmonary infec-tion in hemodialysis patients have grown 24 percent since 993, while a slight fall in vascular access infec-tions occurred in 2003, and may be due to a decreased use of hemodi-alysis catheters (Figure 6.29). Fur-ther study is warranted in this area. Admissions for peritonitis in peri-toneal dialysis patients have fallen 38 percent. For cardiovascular pro-cedures, rates have fallen 7 per-cent for hemodialysis patients, but have increased 2 and 3 percent in the peritoneal dialysis and trans-plant populations, respectively. And for heart catheterizations, admission rates have grown 4 and 2 percent in hemodialysis and peritoneal dial-ysis patients, but have fallen 22 per-cent for those with a transplant.
Between the 989–993 and 994–998 periods, five-year survival for
Months after day 90 of ESRD6 12 18 24 30 36 42 48
0.0
0.5
1.0
1.5
2.0
2.5
Hemodialysis Peritoneal dialysis Transplant
Admissions per patient year at risk Hospital days per patient year at risk
6 12 18 24 30 36 42 480
5
10
15
20
25
ksir ta raey tne ita
p rep s
noiss i
md
A 0.1
0.3
0.5
0.7
0.9
1.1
Cardiovascular disease Infection Other
Admissions: Hemodialysis Peritoneal dialysis Transplant
6 12 18 24 30 36 42 48
ksir ta ra ey tneit a
p r ep sy a
d l atip so
H 0
2
4
6
8
6 12 18 24 30 36 42 48 6 12 18 24 30
Months after day 90 of ESRD
Hospital days
93 95 97 99 01 03
ksir ta sra ey tp 00 0,1 r e
p sn oi ss i
md
A 40
60
80
100
120
140 Pulmonary infection Heart catheterizations
93 95 97 99 01 03 50
100
150
200 Infection (dialysis-related) Cardiovascular procedures
93 95 97 99 01 03 0
100
200
300
400
93 95 97 99 01 03 0
10
20
30
40
Hemodialysis
Peritonealdialysis
Transplant
Hemodialysis: vascular accessinfection
Peritoneal dialysis: peritonitis
Hemodialysis Hemodialysis
Peritoneal dialysis
Peritonealdialysis
Transplant Transplant
6
130
MORBIDITY & MORTALITYHospitalization & mortality, by modality
6.28 incident ESRD patients age 20 & older
Adjusted cause-specific hospital admissions & days, by modality
6.29 period prevalent ESRD patients
Adjusted admissions for principal procedures & diagnoses, by modality
6.27 incident ESRD patients age 20 & older
Adjusted hospital admissions & days, by modality
A

0 12 24 36 48 60
ytiliba
bor
p la vivruS
0.0
0.2
0.4
0.6
0.8
1.0HD 1989-93 (23.8)PD 1989-93 (18.5)HD 1994-98 (26.7)
PD 1994-98 (22.8)
Diabetes Other
Months after initiation
0 12 24 36 48 60
HD 1989-93 (37.3)PD 1989-93 (37.4)HD 1994-98 (39.0)
PD 1994-98 (41.1)
85 87 89 91 93 95 97 99 01 03
ksir ta sr ae y tneita
p 000,1 rep s
h taeD
200
220
240
260
280
300
<2 years2-<5 years 5+ years All (adjusted for vintage)
Hemodialysis Peritoneal dialysis
85 87 89 91 93 95 97 99 01 03 200
250
300
350
400
450
Months after day 90
6 12 18 24 30 36 42 48 54 60
ksir ta sraey tn ei ta
p 00 0,1 rep s
hta eD
0
50
100
150
200
Cardiovascular Infection Other All
Hemodialysis, 1992-1996 Peritoneal dialysis, 1992-1996
6 12 18 24 30 36 42 48 54 60 6 12 18 24 30 36 42 48 54 60 6 12 18 24 30 36 42 48 54 60
Hemodialysis, 1997-2001 Peritoneal dialysis, 1997-2001
131
2005 Annual Data Report6MORBIDITY & MORTALITY
6.30 incident dialysis patients
Adjusted five-year survival, by modality & primary diagnosis
6.31 period prevalent dialysis patients
Adjusted all-cause mortality, by vintage
6.32 incident dialysis patients
Adjusted cause-specific mortality, by modality
diabetic patients who begin therapy on peritoneal dial-ysis grew 23 percent; for patients starting on hemodial-ysis the change was 2 percent (Figure 6.30). These lat-ter patients, however, continue to have slightly better survival, with 27 percent living five years after initia-tion compared to 23 percent of those on peritoneal dial-ysis. Among patients with primary diagnoses other than diabetes, 37–4 percent survive five years; rates here are slightly higher for those on peritoneal dialysis.
The overall decrease in mortality rates since 985—8 percent for hemodialysis patients and 2 percent for those on peritoneal dialysis—continues to mask signif-icant differences by vintage (Figure 6.3). Compared to those on the modality less than two years, for example, hemodialysis patients with a vintage of five or more years had a 9 percent higher mortality rate in 2003. In the peritoneal dialysis population, this difference reaches 94 percent. Rates for patients of the youngest vintage have fallen 2 and 42 percent for hemodialysis and peritoneal dialysis, respectively; for patients of older vintage, how-ever, rates have increased and 2 percent.
Interval analyses of cause-specific mortality rates in incident hemodialysis patients show a dramatic fall between months six and 2, and parallel decreases for mortality due to cardiovascular disease, infection, or other causes (Figure 6.32). Rates for patients on peri-toneal dialysis, in contrast, do not exhibit this same ini-tial fall, but rather tend to increase steadily in the five years following initiation.
{Figures 6.27–28} incident ESRD patients age 20 & older, 997–200 combined; adjusted for age, gender, race, & primary diagnosis; inci-dent ESRD patients, 200, used as reference cohort. Rates for trans-plant patient are censored three years after the transplant date & are shown only through month 30. Cause-specific categories in Figure 6.28 determined from principal ICD-9-CM procedure codes. {Figure 6.29} period prevalent ESRD patients; rates adjusted for age, gender, race, & primary diagnosis. ESRD patients, 2003, used as reference cohort. Cardiovascular procedure category excludes vascular access proce-dures. {Figure 6.30} incident dialysis patients; adjusted for age, gen-der, & race. ESRD patients, 996, used as reference cohort. Modality determined on first ESRD service date; excludes patients transplanted or dying during the first 90 days (five-year survival probabilities noted in parentheses). {Figure 6.3} period prevalent dialysis patients; rates adjusted for age, gender, race, & primary diagnosis. Dialysis patients, 200, used as reference cohort. {Figure 6.32} incident dialy-sis patients; rates adjusted for age, gender, race, & primary diagnosis. ESRD patients, 996, used as reference cohort.

2003
1 2 3 4 5 6 NC HB
1 * * * 1
2 * * * * * 2
2002
3 * * 3
2003
4 * * * 4
5 * * 5
6 * 6
NC * * * * * * NC
HB * * * * * * * HB
1 2 3 4 5 6 NC HB
2002
Colored squares indicate the highest median value of the pair, & * indicates that p < 0.05. In a comparison of Chains 2 & 4 in 2002, for example, the blue box shows that Chain 2, in the blue title line at the bottom, has the greatest median value, & the asterisk indicates that the difference is significant.
Unit affiliation (see box at right)
o (l
n s
cale
)it ar ytilatr
oM
o (l
n s
cale
)it ar ytilatr
oM
.37
1.0
2.7
7.4
1 2 3 4 5 6 NC HB
2002
2003
PACMTN
WNCWSC
ENCESC
SAMA
NE
2002
2003
U.S. Census division (see box at right)
.37
1.0
2.7
1 2 3 4 5 6 NC HB
2002
2003
Unit affiliation (see box at right)
.37
1.0
2.7
PACMTN
WNCWSC
ENCESC
SAMA
NE
2002
2003
U.S. Census division (see box at right)
.37
1.0
2.7
1 2 3 4 5 6 NC HB
2002
2003
Unit affiliation (see box at right)
.14
.37
1.0
2.7
7.4
PACMTN
WNCWSC
ENCESC
SAMA
NE
2002
2003
U.S. Census division (see box at right)
.14
.37
1.0
2.7
7.4
o (l
n s
cale
)it ar ytilatr
oM
o (l
n s
cale
)it ar ytilatr
oM
o (l
n s
cale
)it ar ytilatr
oM
o (l
n s
cale
)it ar ytilatr
oM
6
132
MORBIDITY & MORTALITYBayesian mortality & hospitalization ratios
6.33 prevalent dialysis patients
Comparison of median provider-level BMRs for all-cause mortality
6.34 prevalent dialysis patients
BMRs, by unit affiliation
provider-level mortality ratios
6.35 prevalent dialysis patients
BMRs, by U.S. Census division
6.36 prevalent dialysis patients
BMRs, by unit affiliation
mortality from C.V. disease
6.37 prevalent dialysis patients
BMRs, by U.S. Census division
Mortality from infection
6.38 prevalent dialysis patients
BMRs, by unit affiliation
6.39 prevalent dialysis patients
BMRs, by U.S. Census division
n the 2004 ADR the USRDS introduced new methods to assess mortality on a provider level. These Bayesian methods help stabilize rates, particularly for smaller
units, which have considerably more variability in their death and hospitalization events compared to larger providers.
This year we report Bayesian mortality ratios by provider, and compare them to one another for 2002 and 2003, as shown in Figures 6.33–39. Overall mortality ratios show little difference among the chains, with hospital-based and non-chain providers having higher ratios than the others in 2002. The same analyses, however, repeated for 2003, show less significant differences in the non-chain providers and more variability among the chains. Fewer such inconsistencies appear in the cause-specific mortality ratios for cardiovascular disease, but there are greater differences for infectious mortality. These differences in outcomes also appear to relate to geographic location, which may merit increased atten-tion in the future.
Hospitalization ratios by provider and geographic location are reported in Figures 6.40–47. These analyses report overall results without direct comparisons of provider groups. Dialysis Clinics, Inc. appears to have lower ratios for all causes and for cardiovascu-lar hospitalizations. Hospital-based units have higher ratios, par-ticularly for infectious hospitalizations. The chain-specific infor-
I

East North Central
West NorthCentral
PacificMountain
West SouthCentral
EastSouth
Central
MiddleAtlantic
SouthAtlantic
NewEngland
1 2 3 4 5 6 NC HB
2002
2003
Unit affiliation (see box at right)
.37
1.0
2.7
PACMTN
WNCWSC
ENCESC
SAMA
NE
2002
2003
U.S. Census division (see box at right)
.37
1.0
2.7
1 2 3 4 5 6 NC HB
2002
2003
Unit affiliation (see box at right)
.37
1.0
2.7
PACMTN
WNCWSC
ENCESC
SAMA
NE
2002
2003
U.S. Census division (see box at right)
.37
1.0
2.7
1 2 3 4 5 6 NC HB
2002
2003
Unit affiliation (see box at right)
.37
1.0
2.7
2002
2003
PACMTN
WNCWSC
ENCESC
SAMA
NE
U.S. Census division (see box at right)
.37
1.0
2.7
1 2 3 4 5 6 NC HB
2002
2003
Unit affiliation (see box at right)
.37
1.0
2.7
PACMTN
WNCWSC
ENCESC
SAMA
NE
2002
2003
U.S. Census division (see box at right)
.37
1.0
2.7
o (l
n s
cale
)ita r
noitazila ti
pso
Ho
(ln
sca
le)
ita r n
oitazila tips
oH
o (l
n s
cale
)ita r
noitazila ti
pso
Ho
(ln
sca
le)
ita r n
oitazila tips
oH
o (l
n s
cale
)ita r
noitazila ti
pso
Ho
(ln
sca
le)
ita r n
oitazila tips
oH
o (l
n s
cale
)ita r
noitazila ti
pso
Ho
(ln
sca
le)
ita r n
oitazila tips
oH
133
2005 Annual Data Report6MORBIDITY & MORTALITY
6.40 prevalent dialysis patients
BHRs, by unit affiliation
provider-level hosp. ratios
6.41 prevalent dialysis patients
BHRs, by U.S. Census division
6.42 prevalent dialysis patients
BHRs, by unit affiliation
hospitalization for C.V. disease
6.43 prevalent dialysis patients
BHRs, by U.S. Census division
6.44
hospitalization for infection
6.45
6.46 prevalent dialysis patients
BHRs, by unit affiliation
hospitalization for Vasc. access
6.47 prevalent dialysis patients
BHRs, by U.S. Census division
prevalent dialysis patients
BHRs, by unit affiliation
prevalent dialysis patients
BHRs, by U.S. Census division
6.48 U.S. Census divisions
PAC · Pacific MTN · Mountain WNC · West North Central WSC · West South Central ENC · East North Central ESC · East South Central SA · South Atlantic MA · Middle Atlantic NE · New England
Chain · Fresenius Chain 2 · GambroC hain 3 · DaVitaChain 4 · Renal Care GroupChain 5 · Dialysis Clinics,
Inc.Chain 6 · Nat’l Nephrology
Assoc.NC · Non-chain unitsHB · Hospital-based units
mation shows divergence, with Gambro having higher infectious and cardiovas-cular hospitalization ratios compared to other chains. These data will require more complete assessments to determine if these results are consistent or whether they vary as do those reported for mortality.
These comparisons highlight the dif-ficulty of using any single year to assess a provider network, and show trends should be addressed over time. Also, while pro-viders are consolidating, assessing them may be difficult since new acquisitions may require more time to address pro-grammatic changes. From this perspec-tive, it may be better to address outcomes in providers that have been in a system for at least one year to account for changing procedures. The USRDS will explore these approaches to provide the clearest picture of how providers are doing in terms of overall outcomes.
{Figures 6.33–47} period prevalent dialysis patients, 2002 & 2003, in all dialysis providers; adjusted for age, gender, race, primary diagnosis, & vintage. Informa-tion on the U.S. Census divisions is available at www.census.gov/geo/www/us_regdiv.pdf.

93 94 95 96 97 98 99 00 01 02 03
ksir ta srae y tp 000,1 re
p sn
oiss im
dA 0.0
0.5
1.0
1.5
2.0
2.5
3.0
Breast
Cervical, uterine, & ovarian
93 95 97 99 01 03
ksir ta sraey tp 000,1 re
p sn
oissim
dA 0.0
0.5
1.0
1.5
2.0
2.5
3.0
DiabeticNon-diabetic
93 95 97 99 01 03
Breast Cervical, uterine, & ovarian
93 95 97 99 01 03
ksir ta sra ey tp 0 00 ,1 re
p sn
o issim
dA 0.0
0.5
1.0
1.5
2.0
2.5
3.0
3.5
WhiteOther
93 95 97 99 01 03
Breast Cervical, uterine, & ovarian
93 95 97 99 01 03
stneita
p fo t
necr eP
0
10
20
30
40
50RadiationChemotherapyEither
93 95 97 99 01 03
Breast Cervical, uterine, & ovarian
6
134
MORBIDITY & MORTALITYCancer & pregnancy in women with ESRD
6.49 period prevalent female dialysis patients age 20 & older
Cancer hospitalization rates
6.50 period prevalent female dialysis patients age 20 & older
Cancer hospitalization rates, by diabetic status
6.51 period prevalent female dialysis patients age 20 & older
Cancer hospitalization rates, by race
6.52 period prevalent female dialysis patients with cancer, age 20 & older
Treatment rates for cancer
ince 993, hospitalization rates for breast cancer and for cer-vical, uterine, and ovarian cancer have decreased by 23 and 6 percent, respectively (Figure 6.49). These changes may be
a positive indication of a more proactive role by renal practitioners in prescribing cancer monitoring in these patients. When com-pared to admission rates for cervical, uterine, and ovarian cancer, breast cancer admission rates are considerably higher—6 percent in 2003. While these higher rates may at first be a cause for alarm, they may be explained by the inference that increased monitoring has led to earlier detection of breast cancer, with subsequent hos-pitalizations for the treatment of this disease.
Hospitalization rates for breast cancer in diabetics and non-diabetics have fallen 4 and 32 percent, respectively, since 993, while rates for cervical, uterine, and ovarian cancer are and 20 percent lower (Figure 6.50). When comparing yearly trend rates between diabetics and non-diabetics for each cancer, no clear pat-terns emerge.
By race, hospitalization rates for breast cancer and for cervical, uterine, and ovarian cancer have fallen for both whites and indi-viduals of other races since 993, and as of 2003 rates by race for each cancer type were virtually the same (Figure 6.5)
Treatment rates for cancer reflect changes in clinical practice over the past decade (Figure 6.52). In breast cancer patients, for instance, chemotherapy treatment rates have doubled. In patients with cervical, uterine, or ovarian cancer, the use of radiation ther-apy has fallen 46 percent, accompanied by a substantial increase (38 percent) in chemotherapy treatment rates over the same period.
Data on pregnancy and outcomes in women with ESRD show that the mean age of pregnant patients was 3.5 in 2002 for those on dialysis, and 28.3 for those with a transplant—both higher than in the general population (Figure 6.53). Dialysis patients tend to have considerably more cardiovascular comorbidity, GI disease, liver disease, and dysrhythmia; transplant patients, however, are more likely to have diabetes (Figure 6.54).
Since 99 the number of obstetrician visits in the three months before delivery has grown slightly for dialysis patients, while remaining relatively stable for those with a transplant (Figure 6.55). The number varies little by race, and in 2002 reached 6–9 visits.
Pregnancy rates and their trends over time vary significantly by modality (Figure 6.56). Since 99 the rate in the dialysis popula-tion has increased 20–23 percent overall and in non-white patients, while falling 3.9 percent in whites. In the transplant population, in contrast, the rate has fallen 48.6 percent overall, 66 percent for non-whites, and 38 percent for whites.
Complications related to pregnancy follow no clear trends (Fig-ure 6.57). In 2002, 25 percent of dialysis patients, and 2 percent of those with a transplant, suffered a hemorrhage, while 6 and 26 percent, respectively, went into early labor.
While the rate of live births is considerably higher in transplant patients than in those on dialysis, it has, like the pregnancy rate, fallen sharply since 99—50 percent for those younger than the mean age, and 54 percent for those older (Figure 6.58). For both modalities, the live birth rate is greatest in the youngest patients.
Hemoglobins increase in 68 percent of patients following their pregnancy (Figure 6.59). The average increase is .02 g/dl—from 0.24 before the pregnancy to .26 after.
Two years after the start of a pregnancy, the probability of sur-vival is 20 percent higher in non-diabetic patients compared to diabetics, at 0.7 and 0.9, respectively (Figure 6.60).
{Figures 6.49–5} period prevalent female dialysis patients, age 20 & older. Female dialysis patients, 2003, used as reference cohort; cancer admissions determined from principal ICD-9-CM diagnosis codes. {Figure 6.49} adjusted for age, race, primary diagnosis, & vintage. {Figure 6.50} adjusted for age, race, & vintage. {Figure 6.5} adjusted for age, primary diagnosis, & vintage. {Figure 6.52} prevalent female dialysis patients, age 20 & older, with at least one inpatient cancer claim during the year. Includes only patients alive, with Medicare as a primary payor, & with-out a transplant for the complete year. {Figures 6.53–60} point prevalent female ESRD patients, age 4–45, 99–2002. Transplant cohorts include only patients within two years of most recent graft on January . {Figure 6.53} average
S

91 93 95 97 99 01
)sraey ni( e
ga ega rev
A
25
27
29
31
33
General population
Dialysis
Transplant
ASHD CHF CVA/TIA PVD Cardiac COPD GI Liver dis. Arrhyth- mia
Cancer Diabetesother
stneita
p tna
nger
p fo t
necr eP
0
5
10
15
20
25
30
35Dialysis
Transplant
2
4
6
8
10
12
White Other
91 93 95 97 99 01 2
4
6
8
10
12
yreviled
ot roir
p sh t
no
m eerht
ni s tisiv fo re
bm u
N
Dialysis
Transplant
ksir ta sr aey tne ita
p 000,1 rep etaR
0
5
10
15
20
25
White Other All
Dialysis
91 93 95 97 99 01 0
20
40
60
80 Transplant
se icna
nger
p fo t
n ecreP
0
10
20
30
40 Dialysis
91 93 95 97 99 01 0
10
20
30
40 Transplant
Infection Hemorrhage
Preeclampsia Early labor
0
2
4
6
8
10
12
< mean> mean
ksir ta sraey tnei ta
p 000,1 rep etaR
Dialysis: Age
WhiteOther
Diabetes HTN
Race Primary diagnosis
91 93 95 97 99 01 0
10
20
30
40
91 93 95 97 99 01 91 93 95 97 99 01
Transplant
Hemoglobin before pregnancy (g/dl)
0 5 10 15 20
ycna
nger
p r et fa ni
bol
go
m eH
0
5
10
15
20R2 =.0261
Months after start of pregnancy
0 3 6 9 12 15 18 21 24
ytiliba
bor
p lavivruS
0.6
0.7
0.8
0.9
1.0
Non-diabetic
Diabetic
135
2005 Annual Data Report6MORBIDITY & MORTALITY
6.53 prevalent female patients age 14–45
Average age at pregnancy
6.58 prevalent female patients age 14–45
Live birth rates, by age, race, & primary diagnosis
6.54 prevalent female patients age 14–45
Comorbid conditions of pregnant patients
6.55 prevalent female patients age 14–45
Obstetrician visits prior to delivery 6.56 prevalent female
patients age 14–45Pregnancy rates,
by modality & race 6.57 prevalent female patients age 14–45
Complications in pregnancy, by modality
6.59 prevalent female patients age 14–45
Hemoglobin before & after pregnancy
6.60 point prevalent female ESRD patients age 14–45
Survival after start of pregnancy
age for general popula-tion taken from NVSS (Mathews et al., 2002). {Figure 6.54} comor-bidity assessed from claims during fol-lowup for all pregnant patients, 99–2002. {Figure 6.55} OB vis-its assessed from claims during 9 days prior to delivery for all preg-nant patients with live births from 99–2002. {Figure 6.57} compli-cations include ante-partum & postpartum conditions. Preeclamp-sia determined from claim diagnosis codes. {Figure 6.59} hemo-globin measurements from EPO claims imme-diately before & after pregnancy. {Figure 6.60} survival from start of pregnancy to either start of next preg-nancy or death, for all pregnant patients, 99–2002. {Figures 6.5 & 6.55–56, & 6.58} “other” reflects combined races due to low counts.

20-44 45-64 65+
ksir ta sry tp 000, 1 re
p stne ve t
neitap
nI
0
50
100
150
200
250 Dialysis Transplant CKD Non-CKD
20-44 45-64 65+
ksir ta sry tp 00 0, 1 re
p stn eve t
n eit ap
nI
0
25
50
75
Dialysis Transplant CKD Non-CKD
Age group Age group
Age groupAge group
20-44 45-64 65+
ksir ta sry tp 000,1 re
p stneve t
nei tap
nI
0
100
200
300
400
500
Dialysis Transplant CKDNon-CKD
20-44 45-64 65+
ksir ta sry tp 00 0, 1 r e
p s tnev e t
n eitap
nI
0
25
50
75
100
Dialysis Transplant CKD Non-CKD
6
136
MORBIDITY & MORTALITYMorbidity in ESRD, CKD, & non-CKD patients
6.61 prevalent adult Medicare patients
Adjusted rates of myocardial infarction, by age
6.63 prevalent adult Medicare patients
Adjusted rates of stroke, by age
6.62 prevalent adult Medicare patients
Adjusted rates of congestive heart failure, by age
6.64 prevalent adult Medicare patients
Adjusted rates of peripheral vascular disease, by age
igures 6.6–69 compare inpatient morbidity and mortality event rates in four patient cohorts:
ESRD patients (dialysis and transplant), and non-ESRD Medicare patients (with and without CKD). ESRD patients were point prevalent on January , 2002. For the prevalent CKD and non-CKD cohorts, dia-betes and CKD were defined during a one-year entry period in 200. The followup period for ascertainment of clinical events in all four groups extended from January , 2002, to December 3, 2003. Clinical events were defined by inpatient ICD-9-CM diag-nosis codes, and the rates presented were adjusted for race, gender, and diabetes.
Several general patterns are present that are common to all event types. Within each age category, event rates tend to increase as follows: non-CKD < transplant < CKD < dialysis. Increments in event rates with increasing age are greater in the dialysis population than in the other three popula-
tions. Rates in the youngest group of dialy-sis patients usually exceed those seen in the oldest group of non-CKD patients.
The data in these figures also allow one to compare rates of different clinical events within each of the four cohorts defined above. In dialysis patients, congestive heart failure is the most frequent clinical event, followed by peripheral vascular disease and bacteremia/septicemia. Among transplant and CKD patients, congestive heart failure is the most frequent clinical event, followed by peripheral vascular disease and pneu-monia. Among non-CKD patients, con-gestive heart failure is the most frequent event, followed by pneumonia and periph-eral vascular disease.
These data show that both the presence and the severity of chronic kidney disease appear to be risk multipliers for common, serious medical conditions. This risk multi-plier effect is most obvious in dialysis pop-ulations, where the likelihood of develop-
F

20-44 45-64 65+
ksir ta sry tp 00 0, 1 r e
p s tn ev e t
n eitap
nI
0
20
40
60
Dialysis Transplant CKDNon-CKD
20-64 65+
ksir ta sry tp 00 0,1 re
p stneve t
neitap
nI
0
10
20
30
40
Dialysis Transplant CKD Non-CKD
20-44 45-64 65+
ksir ta sry tp 000, 1 re
p stneve t
neitap
nI
0
50
100
150
200
Dialysis Transplant CKD Non-CKD
20-44 45-64 65+
ksir ta sry tp 00 0,1 r e
p stnev e t
n eit ap
nI
0
50
100
150
200Dialysis Transplant CKD
Age group Age group
Age groupAge group
Age group
Non-CKD
20-44 45-64 65+
ksir ta sr aey tne ita
p 000,1 rep s
hta eD 0
100
200
300
400
Dialysis Transplant CKD Non-CKD
137
2005 Annual Data Report6MORBIDITY & MORTALITY
6.65 prevalent adult Medicare patients
Adjusted rates of pneumonia, by age
6.67 prevalent adult Medicare patients
Adjusted rates of hip fracture, by age
6.66 prevalent adult Medicare patients
Adjusted rates of bacteremia/septicemia, by age
6.68 prevalent adult Medicare patients
Adjusted rates of cancer, by age
6.69 prevalent adult Medicare patients
Adjusted rates of mortality, by age
ing one of these life-threatening events is very high.
{Figures 6.6–69} prevalent adult Medicare patients. ESRD (dialysis & transplant): patients point preva-lent on January , 2002 & with Medicare as a pri-mary payor. CKD & non-CKD (general Medicare patients): included patients survive a one-year entry period in 200, have continuous Medicare cover-age with no HMO coverage, & do not have ESRD; CKD & diabetic status are defined during the one-year entry period. Followup is a maximum of two years, from January , 2002, to December 3, 2003. Events are defined by the first cause-specific inpatient ICD-9-CM diagnosis code during followup. Rates are adjusted for gender, race, & diabetic status. The ref-erence cohort consists of all included patients (ESRD, CKD, & non-CKD).

*Other diagnoses, each accounting for <1%
stneita
p fo t
necreP
0
10
20
30
40
50
Accessfailure
Txfailure
Chronicfailure
to thrive
Acutemedicalcomp.
Other
shtae
d fo t
necr eP
0
5
10
15
20
25
Withdrawal
Hospice
Withdrawal
using hospice
All
Withdrawal
Hospice
13.5%
21.8%
Cardiac Card. arrest Cancer Septicemia Stroke Dementia Cachexia Other Unknown <1%*
stneita
p fo t
necreP
0
5
10
15
20
25
41.9%of 21.8%
Withdrawal Hospice
Other
Asian
N Am
Black
White
Withdrawal Hospice
stneita
p fo t
necr eP
0
20
40
60
80
100 Age RaceGender
Withdrawal Hospice
-
85+
80-84
75 79
70-74
65-69
45-64
20-44
0-19 Female
Male
6
138
MORBIDITY & MORTALITYWithdrawal & hospice care in the Medicare ESRD population
6.71 ESRD patients
Reasons for withdrawal from dialysis
6.72 ESRD patients
Withdrawal & hospice status, by age, gender, & race
6.70
6.73 ESRDpatients
Causes of death among withdrawal & hospice patients
ecause of the shortened life expec-tancy and high comorbidity of ESRD patients, ESRD is included
in the list of chronic diseases for which hos-pice is recommended. Only 3.5 percent of dying ESRD patients use hospice, compared to the national average of over 22 percent. The American Society of Nephrology and the Renal Physicians Association have pub-lished a clinical practice guideline and posi-tion statement endorsing hospice care for ESRD patients as an essential part of quality end-of-life care (RPA/ASN 2000, 2002).
Here we describe patterns of use of dial-ysis withdrawal and hospice care among 5,239 deceased patients in the USRDS 200–2002 two-year Medicare cohort. With-drawal and hospice status of the deceased cohort are depicted in Figure 6.70. Almost 22 percent withdrew from dialysis, and 3.5 percent used hospice. Of those who with-drew, only 4.9 percent utilized hospice. “Chronic failure to thrive” (an outdated term previously used in geriatrics to describe symptoms of dementia, functional decline, and/or depression) is the most common reason given for withdrawal (42.9 percent), followed by the non-specific “acute medi-cal complications” and “other” (Figure 6.7). As described in Figure 6.72, most patients who used withdrawal or hospice were white, and their use increased with age. The mean age of those who withdrew or used hospice was about 74, compared to 69 for those who used neither.
To analyze the site of death and costs during the last six months of life, we used a subset of 9,687 subjects of the above cohort who were on dialysis for the entire six months prior to death. Table 6.e shows the site of death for this cohort by withdrawal and hospice use. Three times as many hos-pice patients died at home compared to non-hospice patients, but only 23 percent of hospice patients died in the hospital com-pared to 69 percent of non-hospice patients. Among hospice patients, the mean Medi-care costs and number of hospital days dur-ing the last week of life were half of those for all patients who died (Table 6.f).
Using the two-year cohort, Tables 6.c–d list the ten states with the highest and low-est percentage of patients who used hospice, among those who withdrew from dialysis. There is marked variation, between states, in the the percentage using hospice after withdrawal, from 6.7 percent in Maine to 54.6 percent in Iowa, even though they had a similar percentage who withdrew (39. percent and 37. percent, respectively).
The three maps in Figures 6.74–76 illus-trate geographic variations in use of with-drawal and hospice, and the percentage of those who used hospice among those who withdrew. In Figure 6.77, the mean age of all those deceased is shown in the left map, and mean age among those who used hospice in the right map. Although there is some cor-relation between mean age by state and hos-
Dialysis withdrawal & hospice status in deceased ESRD pts
ESRDpatients
B

38.0 + (39.8)28.9 to <38.023.3 to <28.917.6 to <23.3below 17.6 (14.0)
16.6 + (21.5)14.8 to <16.612.3 to <14.8
9.8 to <12.3below 9.8 (7.2)
46.1 + (55.0)38.6 to <46.134.7 to <38.631.6 to <34.7below 31.6 (26.0)
71.0 + (71.8)70.2 to <71.068.7 to <70.267.6 to <68.7below 67.6 (67.0)
74.7 + (75.7)74.1 to <74.773.0 to <74.172.0 to <73.0below 72.0 (71.0)
139
2005 Annual Data Report6MORBIDITY & MORTALITY
6.74 ESRDpatients
Geographic variations in the % of patients who withdraw, by state
6.77 ESRDpatients
Geographic variations in mean age, by state
6.75 ESRDpatients
Geographic variations in the % of patients using hospice, by state
6.c ESRDpatients
Highest % of withdrawing patients who use hospice 6.d ESRD
patientsLowest % of withdrawing patients who use hospice
6.e ESRDpatients
Site of hospice days & death 6.f ESRD
patientsCosts & site of death
for deceased patients
Count: Percent: Total Withdrawal Withdrawal withdrawal using hospice using hospiceArizona 517 339 65.6Florida 1,674 1,096 65.5Nevada 84 51 60.7Colorado 273 161 59.0Iowa 335 183 54.6Ohio 959 523 54.5Michigan 1,200 649 54.1Texas 2,018 1,015 50.3Illinois 973 472 48.5Utah 159 74 46.5
Count: Percent: Total Withdrawal Withdrawal withdrawal using hospice using hospiceMaine 144 24 16.7New Hampshire 119 26 21.8Virginia 750 198 26.4Montana 90 25 27.8Hawaii 77 22 28.6Massachusetts 581 168 28.9South Carolina 275 81 29.5West Virginia 198 60 30.3South Dakota 89 27 30.3Tennessee 521 162 31.1*excludes Alaska, with only 26 withdrawals
Site of Site of Mean days Count Percent death death (%) in hospiceSix-month cohort 91,687 Hospital 63 2.0 ± 12.6 Home 16.7 Other 11.1 Unknown 8.4 Hospice: yes 12,058 13.2 Hospital 22.9 14.2 ± 30.5 Home 37.6 Hospice: no 79,629 86.8 Hospital 69.0 0 Home 13.6 Withdrawal: yes 19,517 21.3 Hospital 49.2 4.4 ± 15.5 Home 25.3 Withdrawal: yes 8,200 42.0 Hospital 22.5 10.1 ± 21.9 Hospice: yes Home 45.3 Withdrawal: yes 11,317 58.0 Hospital 68.5 0Hospice: no Home 10.8
Withdrawal Hospice AllN 19,517 12,058 91,687
Mean costs: last six months of life $52,305 $48,979 $53,021
Mean costs: last week of life $4,918 $3,339 $6,612
Mean hospital days: last week of life 2.8 1.4 3.0
6.76 ESRDpatients
Percent of patients withdrawing who used hospice, by state
Overall Patients who use hospice
pice use by state, and more use of dialysis in many Sunbelt states or those with mean older ages, other local factors also play a role. These include local access to hospice care, hospice policies and reimbursement among facilities, and variation in education of clinicians, patients, and families regard-ing the benefits of hospice care.
These findings demonstrate that ESRD patients lag significantly behind oncology patients in hospice use, despite the fact that they have comparable morbidity, and incident ESRD patients have on average a five-year survival that is half of that for patients with cancer (33 percent vs 65 per-cent; National Center for Health Statistics, 2000). End-of-life care conversations held early in the course of maintenance dialysis, and improved education of the nephrol-ogy community and patients regarding the benefits of hospice care, are needed.
{Figures 6.70–77 & Tables 6.c–f} incident & prev-alent ESRD patients dying in 200–2002. Cohort for Tables 6.e–f includes only patients whose ESRD began at least six months prior to the date of death.

67-74 75-84 85+67-74 75-84 85+
sraey tneita
p 0 01 rep et aR
0
10
20
30
40
50
60 Hemodialysis: n=20,006 Peritoneal dialysis: n=730
Months after first stroke0 3 6 9 12 15 18 21 24
noitazilati
psoh f
o yt ilib a
borP
0.0
0.2
0.4
0.6
0.8
1.0
HD: strokeHD: no strokePD: strokePD: no stroke
Months after first stroke0 3 6 9 12 15 18 21 24
lavivrus f
o ytiliba
borP
0.0
0.2
0.4
0.6
0.8
1.0
HD: strokeHD: no strokePD: strokePD: no stroke
67-74 75-8467-74 75-84 85+
sraey tnei ta
p 00 1 rep e taR
0
50
100
150
200 Hemodialysis: n=4,539 Peritoneal dialysis: n=109
Months after second stroke0 2 4 6 8 10 12
noitazilati
p soh f
o yt il iba
bo rP
0.0
0.2
0.4
0.6
0.8
1.0
HD: strokeHD: no strokePD: stroke
Months after second stroke0 2 4 6 8 10 12
htaed fo yt il i
bab
o rP
0.0
0.2
0.4
0.6
0.8
1.0
HD: Stroke HD: no stroke PD: stroke
White
Black
Other
White
Black
Other
6
140
MORBIDITY & MORTALITYIncident & prevalent stroke
6.78 incident dialysis patients, 2000
Rate of incident stroke, by age, race, & modality
6.79 incident dialysis patients, 2000
Time to hospitalization following incident stroke
Incident stroke in Incident dialysis patients
6.80 incident dialyis patients, 2000
Survival rates following incident stroke
6.81 incident dialysis patients, 2000
Rate of recurrent stroke, by age, race, & modality
6.82 incident dialysis patients, 2000
Time to first hospitalization following second stroke
recurrent Stroke in incident ESRD patients
6.83 incident dialysis patients, 2000
Survival rates following second stroke
he epidemiology of stroke in ESRD patients has begun to receive more attention in the lit-
erature, but stroke still ranks below other cardiovascular disease outcomes in identifi-cation of modifiable risk factors, clinical tri-als, and implementation of preventive mea-sures. This is surprising, given its substantial impact on cognition, function, quality of life, and mortality.
In these analyses we define both stroke and TIA as stroke (TIA constitutes approx-imately 30 percent of the combined stroke/TIA counts here), and include claims from both Medicare Parts A and B—i.e., not only strokes that occur during hospitalization, because some patients with strokes may choose not to be hospitalized. Stroke rates here are thus substantially higher than those reported in the literature.
The rate of incident stroke in both inci-dent and prevalent hemodialysis popula-tions is markedly elevated compared to the non-ESRD population, and increases with age (Figures 6.78, 6.84, 6.85). In incident hemodialysis patients ages 67-74, the rate is 27.2 and 29.3 strokes per 00 patient years in whites and blacks, respectively.
The prevalence of stroke in white peri-toneal dialysis patients is slightly lower than that of hemodialysis patients, but for those age 85 and older, rates for black peritoneal dialysis patients are double those of black hemodialysis patients, at 87.4 versus 45.8 (Figure 6.84). Among transplant patients, stroke prevalence rates are about one-third to one-half of those for hemodialysis patients, except again in blacks age 85 and older, in whom the rate is similar to that of peritoneal dialysis patients.
Incident stroke in the 2000 ESRD pop-ulation is associated with high rates of hos-pitalization and mortality over a two-year followup period (Figures 6.79–80). At the end of one and two years of followup, about 85 and 95 percent of hemodialysis and peri-toneal dialysis patients have been hospital-ized at least once, compared to 64 and 83 percent hospitalized among hemodialysis patients without incident stroke.
Survival following incident stroke in dialysis patients is abysmal, similar to the poor survival associated with other cardio-vascular events in ESRD patients. Less than 50 percent are alive at 2 months, compared to more than 70 percent in those without
T

18-45 46-64 65-74 75-84 85+18-45 46-64 65-74 75-84 85+18-45 46-64 65-74 75-84 85+
sraey tneita
p 001 rep eta
R
0
20
40
60
80
100 Hemodialysis: n=257,822 Transplant; n=33,635Peritoneal dialysis: n=21,350
18-45 46-64 65-74 75-84 85+18-45 46-64 65-74 75-84 85+18-45 46-64 65-74 75-84 85+
sraey tneita
p 001 rep e taR
0
10
20
30 Hemodialysis: n=87,726 Transplant: n=21,082Peritoneal dialysis: n=6,602
18-45 46-64 65-74 75-8418-45 46-64 65-74 75-84 85+
sraey tneita
p 001 rep et aR
0
20
40
60
Diabetes (DM)HypertensionDM + hypertensionNeither
Hemodialysis: n=87,726 Transplant: n=21,082Peritoneal dialysis: n=6,602
18-45 46-64 65-74 75-84
18-45 46-64 65-74 75-84 85+
sraey tnei ta
p 0 01 rep et aR
0
5
10
15
20
Ischemic
Hemorrhagic
TIA
White
Black
Other
White
Black
Other
18-45 46-64 65-74 75-84 85+0
10
20
30
40Stroke Percent of stroke patients with AFIB
141
2005 Annual Data Report6MORBIDITY & MORTALITY
6.84 period prevalent ESRD patients, 2003
Prevalent stroke, by age, race, & modality
6.85 point prevalent ESRD patients, 2003
Incident stroke, by age, race, & modality
6.86 point prevalent ESRD patients, 2003
Association of diabetes & hypertension with incident stroke, by age & modality
6.87 point prevalent ESRD patients, 2003
Incident stroke & percent of incident stroke patients with AFIB, by age & type of stroke
incident stroke, and two-thirds are dead at two years followup, compared to half without stroke. The mortality rate for peri-toneal dialysis patients with incident stroke is slightly lower than that of hemodialysis patients until 2 months of followup, after which it surpasses the hemodialysis rate and reaches 74 percent at two years.
The rate of recurrent stroke by age in incident dialysis patients is over twice that of incident stroke; in white and black hemo-dialysis patients age 67–74 it is 73. and 90.4 strokes per 00 patient years, respectively (Figure 6.8). Among black and other race patients, as well as all peritoneal dialysis patients age 75–84, the rate approaches 0.
Hospitalization and mortality rates in the year following recurrent stroke are similar to those for incident stroke (Figures 6.82–83).
The associations of diabetes and hyper-tension with incident stroke are not unex-pected; hypertension and diabetes together have a stronger effect than either alone, but diabetes by itself is more strongly asso-ciated with stroke than hypertension in both hemodialysis and peritoneal dialysis patients (Figure 6.86). The oldest diabetic peritoneal dialysis patients have the highest rate of incident stroke, similar to their high rates of other cardiovascular outcomes.
The majority of incident strokes and vas-cular episodes in prevalent ESRD patients are ischemic, occurring twice as often as TIAs and ten times as often as hemorrhagic strokes (Figure 6.87). The percent of patients with each type of stroke who also have atrial fibrillation is only slightly higher in those with ischemic stroke than hemorrhagic, and increases substantially with age.
These data point to the remarkably high disease burden associated with stroke in dial-ysis patients, and the need to design effective interventions for stroke prevention. Aggres-sive management of diabetes, hypertension, and atrial fibrillation are starting points, but the roles of elevated lipids, homocysteine, and inflammatory markers in the evolution of stroke in ESRD patients also need to be further explored.
{Figures 6.78 & 6.8, 6.84–87} per 00 patient years. {Figures 6.78–83} incident dialysis patients, 2000, without stroke claims in previous two years. For Fig-ures 6.79–82, event occurring at least 30 days after ini-tial stroke; Figures 6.78 & 6.8, racial PD data missing due to low counts. Figures 6.82–83, “PD no stroke” cat-egory missing due to low counts. {Figure 6.84} period prevalent ESRD patients, 2003. {Figures 6.85–87} point prevalent ESRD patients, 2003, with Medicare as primary payor for two years.

stneita
p fo t
n ecr eP
0
2
4
6
8 2001: Hemodialysis TransplantPeritoneal dialysis
45-64 65-74 75-84 85+0
2
4
6
8
45-64 65-74 75+ 45-64 65+
2003
s tneit a
p fo t
n ecreP
0
5
10
15
20
25 2001: Hemodialysis TransplantPeritoneal dialysis
45-64 65-74 75-84 85+0
5
10
15
20
25
45-64 65-74 75+ 45-64 65+
2003
Months
noitazilati
pso
h fo yt iliba
bor
p eerf-tnevE
0.0
0.2
0.4
0.6
0.8
1.0
0 6 12 18 240.0
0.2
0.4
0.6
0.8
1.0
Hemodialysis
Peritoneal dialysis
Months
htaed f
o ytilib a
bor
p eerf-tn evE
0.0
0.2
0.4
0.6
0.8
1.0
0 6 12 18 240.0
0.2
0.4
0.6
0.8
1.0
Hemodialysis
Peritoneal dialysis
Months0 6 12 18 24
)$ fo s000,1( stsoc re
bme
m rep evital
um
uC
0
20
40
60
80
100
Without dementia
Without dementia
Without dementia
Without dementia
Without dementia
With dementia
With dementia
With dementia
With dementia
With dementia
White
Black
Other
Alzheimer’s
Vascular dementia
Other
6
142
MORBIDITY & MORTALITYDementia
6.88 point prevalent ESRD patients
Occurrence of prevalent dementia, by age, race, & modality
6.91 point prev. ESRD pts
Survival probability in pts with & w/o dementia, by modality
6.90 point prev. ESRD pts
Event-free hosp. in patients with & w/o dementia, by modality
6.92 point prev. ESRD pts
Cumulative Medicare per member costs in pts with & w/o dementia
prevalent dementia in prevalent patients
6.89 point prevalent ESRD patients
Occurrence of prevalent dementia, by age, dementia type, & modality
he epidemiology of dementia in ESRD patients has received little attention. Here we describe the prevalence and
incidence of dementia in point prevalent ESRD populations. Because dialysis patients are not routinely assessed for dementia, these rates are largely underestimates.
The prevalence of dementia in hemodi-alysis patients rose 7 percent between 200 and 2003, but incidence grew 5 percent, a high rate relative to the rise in prevalence (total prevalence and incidence not shown). This is likely due to their low two-year sur-vival rate of 30 percent (Figure 6.9), dia-betes becoming the most common primary diagnosis (diabetes doubles the risk of
dementia in non-ESRD patients), and pos-sibly to improved reporting of dementia.
As in the non-ESRD population, age is strongly associated with prevalent demen-tia in hemodialysis patients (Figures 6.88–89). In 2003, incident dementia rates among blacks grew from .4 percent in those age 44–65, to 0.3 percent in patients age 85 and older; among whites, the rates were .2 and 6.4 percent respectively. Dementia rates in peritoneal dialysis patients are much lower than in hemodialysis patients, and very low in transplant patients (Figures 6.88 and 6.93).
In 200 and 2003, the prevalence and incidence of dementia across all age groups
T

were higher in blacks than in whites (Fig-ures 6.88 & 6.93), a pattern also seen in the non-ESRD population.
Alzheimer’s disease comprises 65–70 percent of all dementias in the non-ESRD U.S. population; in the hemodialysis popula-tion, in contrast, vascular dementia (due to cerebral ischemia) is almost as common as Alzheimer’s (Figure 6.89). This may reflect the high cardiovascular risk factor profile most dialysis patients bring to dialysis initia-tion, and the approximate 30 percent preva-lence of stroke in hemodialysis patients over age 65 (Figure 6.84).
Dementia in ESRD patients is associated with substantial adverse outcomes: over two years, a .8 unadjusted risk of hospitaliza-tion, and a striking two-fold increased risk of death—70 percent of those with demen-tia die, versus 4 percent of those without (Figures 6.90–9). In 2002, approximately 9,00 more Medicare dollars were spent for an ESRD patient with prevalent demen-tia than for one without (Figure 6.92).
Factors associated with incident demen-tia on logistic regression are age, stroke (AOR of 2.3), diabetes, black race, and hyperten-sion (Table 6.g). Improved stroke prevention measures such as more aggressive combined management of diabetes, hypertension, and atrial fibrillation may help decrease the risk of dementia in ESRD patients.
These data suggest the need for a stan-dard cognitive evaluation, prior to dialysis initiation and annually thereafter, to assess the patient’s ability to comply with medica-tions and fluid intake, and to make informed decisions regarding initiation and continua-tion of maintainence dialysis.
{Figures 6.88–94} 200 cohort: point prevalent patients alive during 2000–200, with dialysis modal-ity defined on December 3, 200. Transplant patients received graft during 2000–200, & had a functioning graft on 3 December 200. The 2003 cohort is defined analogously. {Figures 6.90–9} 200 cohort; patients followed from December 3, 200, until ear-liest of hospitalization (for Figure 6.90), change in modality, death, or December 3, 2003. {Figure 6.92} 200 cohort: patients followed from December 3, 200 until December 3, 2003. {Figures 6.93–94} 200 cohort: incident dementia defined as no dementia diagnosis in 999–2000, followed by dementia diag-nosis in 200. The 2003 cohort is defined analogously. {Table 6.g} pooled 200 & 2003 cohorts.
Alzheimer’s
Vascular dementia
Other
stneita
p fo t
n ecr eP
0
2
4
6
8
10
12 2001: Hemodialysis TransplantPeritoneal dialysis
45-64 65-74 75-84 85+0
2
4
6
8
10
12
45-64 65-74 75+ 45-64 65+
2003
stnei ta
p fo t
n ecreP
0
1
2
3
4 2001: Hemodialysis TransplantPeritoneal dialysis
45-64 65-74 75-84 85+0
1
2
3
4
45-64 65-74 75+ 45-64 65+
2003
White
Black
Other
143
2005 Annual Data Report6MORBIDITY & MORTALITY
6.93 point prevalent ESRD patients
First diagnosis of dementia, by age, race, & modality
incident (new) dementia in prevalent patients
6.94 point prevalent ESRD patients
First diagnosis of dementia, by age, dementia type, & modality
6.g point prevalent ESRD patients
Odds ratios of incident dementia
Hemodialysis Peritoneal dialysis Transplant OR CI p-value OR CI p-value OR CI p-value45-64 1.00 (reference) 45-64 1.00 (reference) 45-64 1.00 (reference) 65-74 2.59 (2.39-2.81) 0.00 65-74 3.73 (2.34-5.94) 0.00 65+ 3.72 (2.47-5.61) 0.0075-84 3.93 (3.63-4.26) 0.00 75+ 5.76 (3.55-9.35) 0.00 85+ 6.20 (5.55-6.91) 0.00 Female 1.00 (reference) Female 1.00 (reference) Female 1.00 (reference) Male 0.92 (0.87-0.97) 0.00 Male 1.07 (0.75-1.52) 0.73 Male 1.38 (0.89-2.13) 0.15White 1.00 (reference) White 1.00 (reference) White 1.00 (reference) Black 1.30 (1.22-1.38) 0.00 Black 1.49 (0.98-2.27) 0.06 Black 1.62 (1.04-2.52) 0.03Other race 0.86 (0.75-0.98) 0.03 Other race 1.06 (0.53-2.14) 0.86 Other race 0.78 (0.28-2.15) 0.63Diabetes 1.46 (1.36-1.58) 0.00 Diabetes 1.78 (1.14-2.79) 0.01 Diabetes 2.29 (1.43-3.66) 0.00Hypertension 1.24 (1.14-1.34) 0.00 Hypertension 1.39 (0.87-2.21) 0.17 Hypertension 0.82 (0.43-1.56) 0.54Other cause 1.00 (reference) Other cause 1.00 (reference) Other cause 1.00 (reference) Stroke 2.31 (2.16-2.47) 0.00 Stroke 2.51 (1.59-3.97) 0.00 Stroke 3.59 (2.10-6.13) 0.00

6
144
MORBIDITY & MORTALITYChapter summary
Figure 6. Cause-specific hospital ad-mission rates have changed dramatically since 993. Infectious and cardiovascu-lar hospitalizations are up 23 and 0 per-cent, respectively, while those related to vascular access have fallen 25 percent.
Figure 6.4 Five-year survival probabili-ties for ESRD patients continue to rise, despite the greater disease burden now carried by the incident population.
Figures 6.2–4 The remarkably high rate of inpatient catheter insertions should serve as a reminder that practitioners need to move toward greater compliance with K/DOQI vascular access guidelines, which call for increased use of fistulas as the primary vascular access.
Figures 6.5–7 Interval analyses of cause-specific mortality show that rates tend to be high at six months, fall over the next six months, and then rise steadily during the following four years. Figures 6.8–26 Clear across all causes of death is the lower mortality rate for transplant patients. At five years af-ter initiation, the rate of mortality due to sudden death is 75 per ,000 patient years in dialysis patients, and only 4 for patients with a transplant.
Figure 6.29 Hospital admissions for pul-monary infection in hemodialysis pa-tients have grown 24 percent since 993, while a slight fall in vascular access in-fections occurred in 2003—possibly due to lower use of catheters. Figure 6.3 Compared to those on the modality less than two years, hemodialysis patients with a vintage of five or more years had a 20 percent higher mortality rate in 2003. In the peritoneal dialysis population, this difference reaches 94 percent.
introduction
overall hospitalization & mortality
cause- specific hospitalization
cause- specific mortality
hospitalization & mortality, by modality
Comparisons of Bayesian mortality and hospitalization ratios highlight the diffi-culty of using any single year to assess a provider network.
Figure 6.56 Since 99 the pregnancy rate in the dialysis population has increased 20–23 percent overall and in non-white patients, while falling 3.9 percent in whites. In the transplant population, in contrast, the rate has fallen 48.6 percent overall, 66 percent for non-whites, and 38 percent for whites.
Figures 6.6–68 Both the presence and the severity of chronic kidney disease ap-pear to be risk multipliers for common, serious medical conditions. This risk multiplier effect is most obvious in dialy-sis populations, where the likelihood of developing one of these life-threatening events is very high.
Figure 6.70 Only 3.5 percent of dying ESRD patients use hospice, compared to the national average of over 22 percent. ESRD patients lag significantly behind oncology patients in hospice use, despite the fact that they have comparable mor-bidity.
Figures 6.79–80 Incident stroke in the 2000 ESRD population is associated with high rates of hospitalization and mortal-ity over a two-year followup period.
Figures 6.90–9 Dementia in ESRD pa-tients is associated with substantial ad-verse outcomes: over two years, a .8 unadjusted risk of hospitalization, and a striking two-fold increased risk of death—70 percent of those with demen-tia die, versus 4 percent of those with-out.
Bayesian mortality & hospitalization ratios
cancer & pregnancy in women with ESRD
morbidity in the CKD, ESRD, & general populations
withdrawal & hospice
stroke
dementia