6. methodology for entrepreneurship research · 6. methodology for entrepreneurship research theme...
TRANSCRIPT

506
6. Methodology for entrepreneurship research Theme leaders: Bjorn Bjerke and Benoit Gailly 27th August 9:00-10:00 Session 1 Paper for European Summer University on Entrepreneurship Education and Research, 25-30 August 2006, Hämeenlinna (Finland)
Mahamadou Biga Diambeidou (1, 3), Damien François (2), Benoît Gailly (1, 125) Michel Verleysen (3, 4), Vincent Wertz (2)
Université catholique de Louvain 1Center for Research in Change, Innovation and Strategy - Louvain School of Management, Place des Doyens, 1 B-1348 LLN, Belgium 2Machine Learning Group – CESAME, av. G. Lemaître, 4 B-1348 LLN, Belgium 3Machine Learning Group – DICE, place du Levant 3, B-1348 LLN, Belgium 4Université Paris I Panthéon Sorbonne, SAMOS-MATISSE, 90, rue de Tolbiac, F-75634 Paris Cedex 13, France
Acknowledgements:
This research is supported by a grant from the National Bank of Belgium. Part of this work is supported by the Belgian Programme on Interuniversity Attraction Poles, initiated by the Belgian Federal Science Policy Office. The scientific responsibility rests with its authors. The work of D. François is funded by a grant from the Belgian F.R.I.A. M. Verleysen is a Senior Research Associate of the Belgian F.N.R.S. (National Fund For Scientific Research). Preliminary results of this paper were presented at ERIM workshop “Perspectives on the Longitudinal Analysis of New Firm Growth” in 2005 (Rotterdam), and at CRECIS- Louvain School of Management 125 Corresponding author: Tel.: +32-10-47-84-20; Fax: +32-10-47-83-24 E-mail addresses: {biga.mahamadou, francois.damien, gailly.benoit, verleysen.michel, wertz.vincent}@uclouvain.be
507
seminar in 2006 (Louvain-la-Neuve). We thank E. Stam, E. Garnsey, F. Janssen, C. Deroy and N. Delobe for their comments.
Empirical Taxonomy of Start-Up Firms Growth Trajectories
Abstract
This article provides a method that can accommodate, in a systematic way, the analysis of new firm growth trajectories. Exploiting longitudinal data of 741 promising firms, we used a multiple indicator measure of growth, financial and productivity performance as well as firm demographic profile, as a foundation of a multidimensional construct of firm development process. In addition to graphical approach, cluster analysis based on State Sequences Analysis is developed from a combination of Principal Component Analysis and Markov Chain Model to drive taxonomy of new firm growth trajectories. Findings show that new firm growth trajectories are nor linear neither a random phenomenon. While the strategy of growth of promising firm are very heterogeneous, our approach allows us to develop a typology of growth paths based on four states of which three are stable.
1. Introduction
Over the past several decades, new and small firms growth have received considerable attention from researchers and policy-makers around the world because they have been identified as engines of growth, innovation and wealth creation (Venkataraman, 1994; Birch, 1981; Storey, 1994; Davidson, 1995; Levie, 1997; Welbourne, 1997; Davidsson Lindmark et Olofsson, 1998; Audretsch and Thurik, 2000; OCDE, 1994, 1998b, 2002).
However, empirical evidence has shown that only a small proportion accounts for a significant percentage of new job creation and accelerates the development of new technologies and products that have played a fundamental role in the prosperity of many countries (Birch, Haggetty and Parsons, 1997; Storey 1997, Julien et al., 2001). New and small firms are therefore a key element in regional economic development, and represent as such an interesting research subject.
Despite their importance, as the foundations of economic dynamism, to regional development, knowledge about new and small firm growth is still scattered (Davidson and Wiklund, 2000; Delmar, 1997) and little evidence is available on how firms grow and perform over time (Geroski 2001). This can be partly attributed to methodological problems such as the difficulties experienced in identifying entrepreneurial firm.

508
Secondly, instead a substantial contribution made to understand firm growth, scholars show that research has largely failed to generate cumulative results because there is great variability in researchers’ use of indicators, formulae and time spans (Wiklund and Shepherd, 2005; Delmar et al, 2003; Davidsson and Wiklund 2000, Weinzimmer et al, 1998, Murphy et al, 1996 Chandler & Hanks, 1993).
Additionally, while most previous researchers used only a unidimensional concept to measure growth (Weinzimmer et al 1998), this approach has been criticized by many researches (Delmar et al, 2003; Delmar and Davidsson, 1998; Birley & Westhed, 1990). The critic posits that using a single measure of growth defined by a single criterion investigates one particular kind of growth and the results can not most likely be generalized to other forms of growth (Delmar and Davidsson, 1998). To this concern, Delmar et al, (2003) has made a substantial contribution. Indeed, they have identified growth as a multidimensional and complex process and, showed that the study of firm growth is heterogeneous in nature.
Furthermore, recent entrepreneurship research found that there are strong needs for a conceptual scheme and call for a longitudinal research enabling the dynamic analysis of entrepreneurial firm performance over time across organisational contexts (Garnsey et al. 2006; Busenitz et al, 2003; Chandler & Lyon 2001; Pettigrew et al. 2001; Davidsson & Wiklund 2000). More specifically, scholars recognize that explaining change and development in organization needs appropriate research methods rather than common alternative approaches used by most researchers. For example, while most new and small firm growth studies have focused on the explanation of the performance using cross-sectional data and/or have assumed that growth is an uninterrupted process, longitudinal approach has shown that linear growth is the exception rather than the rule (Garnsey et al., 2006; Garnsey & Heffernan, 2005; Gailly et al. 2004; Stam 2003, OECD, 2002; McMachon, 2001).
In brief, although new firm growth is essential for the foundations of economic dynamism, little evidence is available about the growth trajectories of firms, and research in this field needs a sound conceptual base that calls for new methods. This article provides an alternative method that can accommodate, in a systematic way, the analysis of new firm growth over time based on a multidimensional approach. The study attempts to extend prior research with similar objectives, including an investigation detailed in previous work by the presents authors (Gailly et al., 2004). More specifically we address two questions: 1) what types of distinct growth patterns new firms’ exhibit. 2) How these growth patterns and corresponding firms differ from each other in terms of their performance and their demographic affiliation.
An early attempt to investigate these matters is reported by (Garnsey et al., 2006; Delmar et al,. 2003; OECD, 2002; Delmar and Davidsson, 1996). This study produced evidence from quantitative research of promising firm growth trajectories. It focuses on the design and conduct of longitudinal research and deals with both

509
graphic and analytical methods to track and interpret growth trajectories in multidimensional quantitative data. To this concern, we firstly developed a conceptual framework based on Principle Component Analysis to address the graphic strategy. Secondly, cluster analysis based on State Sequences Analysis is developed from a combination of Principal Component Analysis and Markov Chain Model to derive taxonomy of new firm growth trajectories. Furthermore, Bivariate analysis is used to examine underlying acquired and innate factors of related firms to growth trajectories.
Preliminary findings show that, new firms exhibit distinct growth trajectories patterns. These growth trajectories are neither a linear nor a random phenomenon. Moreover, while the strategy of growth of promising firm remains very heterogeneous, our approach allows us to develop a cluster of growth paths over time based on four states of which three are stable. These distinct growth paths are associated both to demographic affiliation and the strategic choices of the firms. Therefore, this research provide empirical support and methodological sound in new firm growth research
This article is organized into 5 sections. Next section discusses the state-of-the-art on new firm growth. We review the literature on organizational growth and some perspectives on growth path over time. Section 3 introduces our methodology. Section 4 documents research findings following the two methods proposed. Finally, section 5 conclude and present further work.
2. Literature Review
Over the past decade, a rich literature has been generated on the topic of new firm and small business growth. This section provides a review of existing knowledge regarding organisational growth and growth trajectory (process).
2.1. Organisation growth
Understanding the determinants of new firm growth has been a central research issue in the field of entrepreneurship (Davidsson and Wiklund, 2000). However, in spite of increasing research efforts in recent years, existing research lacks consensus regarding the basic constructs which affects a new venture performance. This happens because the phenomenon of entrepreneurial growth is studied with academic specialisation, which does not currently encourage integrated and systemic analysis (Garnsey & Heffernan, 2005). Research was done from different theoretical imperatives such as industrial organisation perspective, resource-based view, strategic adaptation perspective and evolutionary economic perspective. Thus, researches from one research imperative tend to ignore important findings of

510
competing schools. For example, since the original “theory of the growth of the firm” in Penrose (1959), where managerial resources played a pivotal role, several factors have been suggested as affecting growth. Some of them, such as environmental carrying capacity or market forces, are external to the organization (Aldrich, 1990; Singh and Lumsden, 1990). Others are internal like capabilities, culture, or strategy and have been mainly addressed from the resource-based view of the firm (Wernerfelt, 1984; Teece et al., 1997; Boeker, 1997; Zahra et al., 2000; Canals, 2000). In particular, numerous studies of organizational growth defined various approaches to assess the amount of growth that a firm has experienced. However, research in this area has largely failed to generate cumulative results (Delmar et al, 2003; Weinzimmer et al, 1998). The common explanation is that variation in definition, measures and variation in firm growth indicators were used in organizational growth studies (Weinzimmer et al, 1998; Delmar, 1997; Murphy et al, 1996 Chandler & Hanks, 1993).
Moreover, while reflection persists on the definition and measurement of growth, the resource based-theory argues that firm success is dependent on the firm’s resources (Penrose 1959). Technological resources are one of the most important sources of competitive advantage (Penrose, 1959; Zahra and Bogner, 2000; Cooper and Folta, 2000). In particular, new firm technology resources can generate a competitive advantage that improves its performance. Hence, empirical evidence shows that most papers looking at “promising firms” have focused on a sample limited to new technology based firms, from sectors such as software products, telecommunications or biotechnology (Baldwin, Chandler and Papailiadis, 1994; Vyakarnam, Jacobs and Handelberg, 1997; Woywod and Lessat, 2001; Calvo and Lorenzo, 2001; Julien 2001; Zaralis, 2001). However, researchers found that prior research fails to identify which technological resources significantly influence new venture growth. Furthermore, limited research is available concerning technological based new firms over time, as well as their characteristics (Heirman and Bart Clarysse) and how they differ from other start-ups (Davidsson and Delmar, 1998; Mustar, 2001).
In addition, firm growth concepts remain another point of debate in entrepreneurial research. According to the recent literature in the field, while most previous researchers used only one single conceptual dimension to measure growth (Weinzimmer et al, 1998), firm growth has been identified as a complex, multidimensional process and non linear phenomenon and few studies take into account the many forms growth can take (Birley and Westhead, 1990; Delmar and Davidsson, 1998; Delmar et al., 2003; Gailly et al, 2004). The argument behind the disadvantage of unidimensional approach posits that different growth measures affect model building and theory development differently. Therefore using a single measure of growth defined by a single criterion does not seem to suffice. Moreover, such studies will not address growth; they investigate one particular kind of growth and the results cannot likely be generalized to other forms of growth (Delmar and Davidsson, 1998).

511
2.2. Growth Trajectories (growth process)
The change and development processes are central to organizational phenomena, and process studies are fundamental in understanding the dynamics of organizational life and to the development and testing of theories of organizational creation, innovation, adaptation and termination (Poole et al, 2000, p362). However, concerning firm growth study, most studies have focused on the explanation of the performance using cross-sectional data and/or have assumed that growth is an uninterrupted process. Recently, a longitudinal approach has shown that linear growth is the exception rather than the rule. (Stam 2003, Garnsey et al, 2006; Stam and Garsney, 2005; Garnsey & Heffernan, 2005; Biga et al, 2005). The limit of static, cross-sectional design is that it appears to have focused on the occurrence of growth, not on the dynamic evolution of change, over time, within these growing firms. To this concern, scholars recognize that explaining change and development in organization needs appropriate research methods rather than common alternative approaches used by most researchers (see: the special issue126 on Evolutionary Approaches to Entrepreneurship in honor of Howard Aldrich). Particularly, in the new firm growth field, we need longitudinal research because it mainly allows direct observation of change, causal statements, temporal context and feedback effects (Davidsson & Wiklund 2000; Chandler & Lyon 2001; Pettigrew et al. 2001).
In brief, although new firm growth is essential for the foundations of economic dynamism, little evidence is available about the growth trajectories of firms, and research in this field needs a sound conceptual base that calls for new methods. Therefore the main purpose of this paper is to provide a novel method that can accommodate, in a systematic way, the analysis of new firm growth based on a multidimensional approach.
3. Research Design and Methods
In this section, we will present our methodology following three specific points: the general approach of the project followed by research design and research methods.
3.1. General approach of the research
Part of our ongoing research effort focusing to better understand the dynamics of new firm growth process, this study consists at identifying and characterizing specific clusters among the growth trajectories of promising firms.
126 Journal of Business Venturing 19 (2004) 3009-312
512
Three steps with several procedures were developed for the purpose to find stable cluster solution and secure its internal and external validity:
• The first step is to prepare data. • The second step consists to cluster the growth trajectories based on two
alternative methods developed. • The final step is to interpret the stable cluster solution using related firm
characteristics
These three points will be presented in a following section
3.2. Data employed
A valuable opportunity to address the key study issue in this article has been provided by the availability, through BEL-FIRST database developed by the Bureau van Dijk Electronic Publishing (BvD), one of Europe's leading electronic publishers of business information.
Our ongoing research collected rich and longitudinal financial information and demographic indicators of all Belgium firms created between 1992 and 2002. A cohort of 741 promising firms is well identified. From this population, we used a multiple indicator measure of size growth (Employment, Sales and Total assets) completed by 7 financial variables to evaluate firm performance (Value added, Operating income, Current income, Net income, Cash-flow, Working capital and Shareholders’ equities). Firm demographic profiles for external validly are: industry, firm age, Ownership and Location. Details information about data collection strategy and theoretical arguments for the choice of variables are well reported by authors Gailly et al., (2004); Biga et al., (2005).
Although the first ten variables (in absolute volume) have served as a foundation of a multidimensional construct of firm growth path (see Gailly et al.,) in this study we extended our approach by using also ratio based indicators based on the initial variables. Figure 1 present a matrix of sub set developed in order select most convenient data set for this study.
We know that determining a firm’s performance requires an analysis of its financial situation as well as a review of how well it is satisfying a broad range of stakeholders (stockholders, employee and customers). However, this complete conceptual could be performed in future work.

513
Figure 1: Scenario matrix. EM: Employement, CA: Sales, TA: Total Assetes, VA: Value Added, RE: Operating Income, RC: Current Income, REN: Net Income, FR: Working Capital, CF: Cash Flow, CP: Shareholders Equity. All the rest variables are a manipulation of previous original variable in order to set up ratio based approach.
3.3. Methods
While cluster analysis procedures were used in this research, two approaches are implemented: Visualisation approach and Sequence analysis approach. We present these two approaches in the following section.
Clustering based on visual approach: Principal Component Analysis
Once the scenarios matrix of observations has been built according to the above-described procedure, statistical data analysis tools have been used on these data, to select the most convenient data set for this study, and then, to visualise it efficiently. More specifically, the Principal Component Analysis (PCA), as used in our previous research reported by Gailly et al., 2004, has been used to project the N-dimensional data (the N dimensions related to selected set.) onto a two-dimensional plane, allowing the visualization of firm trajectories over the years.
As in the previous work (Gailly et al., 2004), we restrict the use of the PCA to the two first principal axes. Analysis procedure is the same as described in above mentioned paper.
Clustering based on Sequence Analysis: a combination of PCA and Markov Chain Model
Relative financial variables
Absolute financial variables
Size

514
To deal with automatic tracking and recognition of growth trajectories, we extended our previous approach by using a sequence analysis in an original way. This alternative approach is developed by a combination of PCA and Markov model.
Sequence analysis involves the temporal ordering of events, which mark the transitions of one phase state into another. This approach, related to the temporal process methods, needs advanced methods to tackle five key tasks (Poole et al., 2000, p 53): 1) Identification of events and event type; 2) Characterisation of event sequences and their properties; 3) Specification of dependencies in temporal sequences; 4) Evaluation of hypotheses of formal and final causality; 5) Recognise the coherent pattern that integrates the narrative action.
In our context, PCA and Markov chain model were combined to deal with required actions from previous key tasks. The PCA is applied to identify state and state types. Going beyond the graphical strategy, PCA coordinates of initial data will be used. In addition, we attempt to take into account all the information about a firm, to make interpretability possible at the appropriate analysis level. To this concern, we maintained the same subset used (scenario based on absolute volume of variable) in the previous approach for PCA analysis.
However, from ratio based variables used to set up the scenarios matrix, five ratios will be taken into account to complement the analysis. These ratios are often used to assess firm performance based on the profitability, asset management and productivity: Return on assets (ROA: Net income over Total assets), Return on equity (ROE: Net income over Total equity), Total assets turnover (Sales over Total assets), Labour productivity (Value added over employment) and Capital productivity (Value added over total asset).
Then, we will focus on stochastic model to discern and describe connections among states. Particularly, Markov chain model is to be preferred as the foundation four our analysis, because it predicts the probability of occurrence of a state at time t + K as function of the state occurring at immediately earlier time periods. Additionally, it is directly applicable to discrete-state, captures dependencies among sequential observations and provides a powerful and useful summary of the nature of state dependencies.
The overall goal of the two approaches presented is to find a stable cluster solution of growth trajectories and assess its internal validity. Bivariate analysis is applied to investigate the external validity of cluster by using the firm demographic characteristics retained in this research.

515
4.Research Findings
We will present findings following the two approaches set up, Visual strategy and State sequences analysis, in the following sections.
4.1. Exploring growth trajectories with PCA methodology: Graphic Strategy
The method used consisted to Principle component analysis and visual mapping approach on the selected scenario implemented from the 7 scenarios exploited. 4 steps were developed to examine the patterns of growth trajectories:
• In the first step, we used adopted data reduction approach using principal component analysis in order to evaluate the six scenarios implemented. As graphical interpretation is more adequate in two dimensions approach, we defined as the most convenient case each scenario with two components which accounted for more then a threshold of 60 percent of cumulative variance.
• The second step concerned the extraction of patterns of correlated firms based on the retained scenario and using the PCA method.
• The third step concerned the interpretation of the factorials axis based on a visual approach using the PCA Graph.
• Finally, in the third step, in order to interpret the emerged patterns of growth trajectories, we set up a useful conceptual framework which helped us to classify the patterns of growth trajectories firms’ exhibit.
Findings of Graphical strategy
We present the results of this graphical strategy based on the above method design in the following points. Choice of the most convenient scenario for the clustering analysis
In order to evaluate the six scenarios based on the cumulative percentage of variance exhibited by the principal components of each case, we set up a matrix (Fig. 1) with on the one hand, the six scenarios (in column). On the second hand, the total variance related to the number of principal component from 2 to 11. Finding showed that only the scenario based on absolute volume of variable accounted for more than the threshold of 60% of total variance fixed, with his 2 first principal components (n=72.41%). Therefore, we decided to analyse this scenario. However, going beyond two dimensions approach, finding showed that two other scenarios with a combination of absolute volume and ratios approach reached our threshold of 60% with three first principal components. Moreover, with the 11 first principle components, we can explore all our scenarios without losing information from initial data. This showed the potential to extend our method going beyond data reduction approach.

516
Table 1: Choice of the most convenient scenario based on PCA analysis of 7 scenarios implemented.
Cumulative percentage of
variance with …..
2 first PCs
3 first PCs
4 first PCs
5 first PCs
6 first PCs
7 first PCs
8 first PCs
9 first PCs
10 first PCs
11 first PCs
PCA S_1 (10) - Absolute
72.414 82.590 88.375 92.976 95.508 97.595 99.081 99.763 100.00
PCA S_2 (14) – Mix
44.756 60.593 73.175 80.321 85.573 90.360 93.646 95.527 97.019 98.279
PCA S_3 (14) – Mix
40.237 55.938 71.613 78.869 85.989 90.109 94.142 96.215 97.862 99.105
PCA S_4 (11) – Ratio
31.142 44.476 55.857 65.635 74.809 83.617 89.978 94.568 98.000 100.00
PCA S_5 (21 ) – Mix
40.974 49.503 57.511 64.306 69.774 74.959 79.785 84.081 87.250 90.122
PCA S_6 (15) – Mix
33.113 44.866 55.698 64.986 72.204 78.974 84.899 88.625 91.875 94.709
PCA S_7 (14) - Mix
34.851 46.547 57.034 66.077 73.804 81.056 87.209 90.885 94.330 97.001
Interpretation of principal component analysis
Previous finding showed that only the scenario based on absolute volume of variable accounted for more then the threshold of 60% of total variance fixed with its 2 first principal components (n=72.41%). Therefore, it will serve as support to this study.
In order to interpret the reference axes, we used a threshold of 0.5% of correlated coefficient to assess the association between each variable and each axe. Thus, the axe is interpretated using only the most correlated variables with.
The result showed that the first axe is negatively correlated with all variables without employment. And the second axe is positively correlated with the composite indicators of size (three variables) and value added, and negatively correlated with two financial variables. Considering the characteristics of these two axes, we see that this unrotated direct extraction of orthogonal reference axes by PCA did not adequately illuminate the interrelationships between the collections of variables. As a consequence, the reference axes were rotated using varimax rotation method. This useful method isolates more meaningful dimensions by an approach based on the maximisation of correlated coefficient of correlated variables. After varimax rotation, the first 2 axes (out of a total of 10 components) accounted for 72.41 percent of total variance.
On the basis of the component loadings, the 2 components were given the following descriptive label. The first axe is negatively correlated with 4 financial variables: Net income, Cash-flow, Operating income and Current income before taxes. As those variables indicate firm profitability profiles and are often used as financial

517
performance indicators, we define this axe as “PROFITABILITY” axe. The second axe is related to the Sales, Total Asset, Employment and Value Added variable. The three first variables are identified as size indicator in firm growth study. Therefore, we defined this component as “SIZE” axe. The third axe is negatively correlated with two financial variables Working capital and Shareholders equities), we define this axe “SOLVENCY” axe. From these three first axes, all the ten variables of the scenario are still used. Although, the others axes label are: Axe 4 is related to Employment and negatively correlated to Sales. Axe 5 is related to Current income and negatively with Total assets. Axe 6 is correlated to Cash flow and negatively with Shareholders equities. Axe 7 is only related to Value added. Axe 8 is correlated Sales and negatively with Total assets. Axe 9 is negatively related to Net income. Axe 10 is negatively associated to Operating Income and Current Income.
In summary, based on Graphical representation, the first two axes (Profitability and Size axes) will be used to explore the emerged patterns of growth trajectories from our sample of 741 promising firms. Identification of growth trajectories
The projection of several firm trajectories on those two axes is illustrated in Fig. 2. Each square represents the two principal axes with the horizontal axe being the First Principal Component. Each trajectory is represented in a separate box to avoid overlapping of the trajectories that could make the drawing difficult to read. Each projection of the yearly data of a firm is represented with a plus sign, the plusses are connected according to their temporal order and circle indicates the first year. Moreover, trajectories have been gathered together according to their shapes. The first group (the top six charts) seems to represent rather linear trajectories: the firms grow according to both directions (related to both principal components) at the same time. The second group (the top five charts) gathers sigma-shaped trajectories. They indicate that the growth of the firms has not been smooth over the years, with some periods that may even correspond to decay of the firm. The third group (the top three charts) presents angular trajectories going up first then bifurcating to the left, which can be interpretated as a growth in two stages: first increasing size then increasing financial performance.
The method has thus helped us to represent and to identify “typologies” firm trajectories, possibly relating to different growth strategies. However, a fine interpretation is needed, in order to better understand emerged patterns.

518
Fig. 2: An illustration of the projection of 25 firms trajectories on PCA graph. Each trajectory is presented in a separate box.
Growth trajectories options: developing a conceptual framework
While the previous approach is helpful to track firm growth trajectory, visual interpretation and comparison of growth path need supplementary work. To address this issue, we implemented a conceptual framework based on a map view.
According to the PCA methodology, the origin of the axes on the PCA graph (placed at the center of gravity of clouds of points) represents the virtual “average” profile of all data projected. Additionally, the proximity of growth trajectories in IRP means that the growth trajectories have the same “profile” over all the p variables and that the p variables have the same weight in the computation of distance. Therefore, we can transform the box (PCA graph) in map view (Fig. 3A). To this end, each reference axe was divided in three levels (High, Medium and Low) according to PCA methodology using the position of the projection of variable on each axe. In our longitudinal context, each level corresponds to one zone; therefore we have high zone (40% of total zone), medium zone (20%), and low zone (40%) (Fig. 3.B). Finally we set up a matrix (3x3) with 9 zones representing each option of growth. Each zone represents a class of combination of one level of profit and one level of growth (Fig. 3.C). This configuration was implemented in our projection tools in order to have each growth trajectory projection on this map view.
This approach facilitated the growth trajectories tracking within the zone. However, while this matrix based on two dimensions is better than the original box, and allowed to observe the nearest interrelationship between zones, a longitudinal aspect of growth trajectories is not well represented. To this end, we set up another matrix (9x10) were the 9 zones of the matrix were put on one column and the time period in line (Fig 3.D). Moreover, this new matrix is set up to give us a map view with three
‘‘Profitability’’
‘‘Size’’
‘ ‘ P r o f i t ’ ’
"Size
"
‘ ‘ P r o f i t ’ ’
"Size
"
‘ ‘ P r o f i t ’ ’
"Size
"
‘ ‘ P r o f i t ’ ’
"Size
"

519
big zones (high profit, medium profit and low profit). Each big zone is divided in 3 small zones with the three levels for growth.
Thus, the visual representation becomes easier to interpretate. For example, the evolution into one big zone explains a firm size growth evolution. When firm moves outside of a big zone, this indicates a firm profitability evolution. Therefore the combination of these two map view served as conceptual framework in order to better examine the pattern of growth trajectories.
Using this conceptual framework, we analyse the different patterns of growth trajectories exhibited by the 741 firms of our data set. Finding showed that the strategy of firm development is very heterogeneous (see figures 4.A. and 4.B.). However, due to the high level of firm growth analysed, this approach is limited for clustering in a systematic way.
In summary, visual tools based to Principal Component Analysis method was built in order to investigate the growth trajectories of promising firms. The method developed produces useful growth patterns, based on multidimensional approach. Additionally, it shows that firm growth trajectories are heterogeneous. This supports the new trend of new firm growth process research (e.g. Delmar et al, 2003). Hence, using multiple measures and methods for exploring organizational growth is important for understanding a firm growth process.
In addition, due the high heterogeneity of growth trajectories and the high number of firms investigated, this method does not suffice to build a typology. Moreover, the current approach allows the preservation of some dimensions of data but excludes others; it is not obvious that discarding some of the information, even if it represents a small percentage of it, does not have consequences on the results and conclusions. Therefore, we need to extend the approach with other methods to built clusters of patterns that can be further interpreted.

520
Low :LH igh
H igh :H
‘‘
C on ceptual Fram ew ork (1/2): based on PC A graphC onceptual Fram ew ork (1/2): based on P C A grap h
From PCA graph after
varim axrotation…
M ediu mHigh Low
H
M
L
Class(L,H )
To m ap view …
0,251
M ediu mHigh Low
H
M
L
Class(L,H )
M ediu mHigh Low
H
M
L
P rofit’’
‘‘ Size’’
C lass(L,H )
To m ap view …
0,251 0,251
Low
L LM LH L
L MM MH M
L HM HH H
e.g. of a class profile:( H igh Profit, H igh Size)
Low
L LM LH L
L MM MH M
L HM HH H
L LM LH L
L MM MH M
L HM HH H
e.g. of a class profile:( H igh Profit, H igh Size)
Low
L LM LH L
L MM MH M
L HM HH H
L LM LH L
L MM MH M
L HM HH H
… to three dim ensional m ap view
t9 t10t8t7t6t5t4t3t2t1
LL
LM
LH
M L
M M
M H
H L
H M
H H
Longitu din al tracking
Eve
ntc
lass
t9 t10t8t7t6t5t4t3t2t1
LL
LM
LH
M L
M M
M H
H L
H M
H H
Longitu din al tracking
Eve
ntc
lass
H igh profit
M edium profit
Low profit
H igh Size
M e diu m Size
Low Size
H igh Size
M ediu m Size
Low Size
H igh Size
M ed iu m Size
Low Size
H igh profit
M edium profit
Low profit
H igh Size
M e diu m Size
Low Size
H igh Size
M e diu m Size
Low Size
H igh Size
M ediu m Size
Low Size
H igh Size
M ediu m Size
Low Size
H igh Size
M ed iu m Size
Low Size
H igh Size
M ed iu m Size
Low Size
C onceptual Fram ew ork (2/2): m aking sense of m ap viewC oncep tual Fram ew ork (2/2) : m aking sense of m ap view
From tw o dim ensional m ap view … ..
P rofit’’
‘‘ Size’’
P rofit’’
‘‘ Size’’
C lass(L,H )
To m ap view …
0,251 0,251
Low
L LM LH L
L MM MH M
L HM HH H
e.g. of a class profile:( H igh Profit, H igh Size)
Low
L LM LH L
L MM MH M
L HM HH H
L LM LH L
L MM MH M
L HM HH H
e.g. of a class profile:( H igh Profit, H igh Size)
Low
L LM LH L
L MM MH M
L HM HH H
L LM LH L
L MM MH M
L HM HH H
Class(L,H )
To m ap view …
0,251 0,251
Low
L LM LH L
L MM MH M
L HM HH H
e.g. of a class profile:( H igh Profit, H igh Size)
Low
L LM LH L
L MM MH M
L HM HH H
L LM LH L
L MM MH M
L HM HH H
e.g. of a class profile:( H igh Profit, H igh Size)
Low
L LM LH L
L MM MH M
L HM HH H
L LM LH L
L MM MH M
L HM HH H
… to three dim ensional m ap view
t9 t10t8t7t6t5t4t3t2t1
LL
LM
LH
M L
M M
M H
H L
H M
H H
Longitu din al tracking
Eve
ntc
lass
t9 t10t8t7t6t5t4t3t2t1
LL
LM
LH
M L
M M
M H
H L
H M
H H
Longitu din al tracking
Eve
ntc
lass
H igh profit
M edium profit
Low profit
H igh Size
M e diu m Size
Low Size
H igh Size
M ediu m Size
Low Size
H igh Size
M ed iu m Size
Low Size
H igh profit
M edium profit
Low profit
H igh Size
M e diu m Size
Low Size
H igh Size
M e diu m Size
Low Size
H igh Size
M ediu m Size
Low Size
H igh Size
M ediu m Size
Low Size
H igh Size
M ed iu m Size
Low Size
H igh Size
M ed iu m Size
Low Size
C onceptual Fram ew ork (2/2): m aking sense of m ap viewC oncep tual Fram ew ork (2/2) : m aking sense of m ap view
From tw o dim ensional m ap view … ..
t9 t10t8t7t6t5t4t3t2t1
LL
LM
LH
ML
MM
MH
HL
HM
HH
Longitudinal tracking
Eve
nt
clas
s
x
x
x x x
x
x
xx
t9 t10t8t7t6t5t4t3t2t1
LL
LM
LH
ML
MM
MH
HL
HM
HH
Longitudinal tracking
Eve
nt
clas
s
x
x x
x x x x
t9 t10t8t7t6t5t4t3t2t1
LL
LM
LH
ML
MM
MH
HL
HM
HH
Longitudinal tracking
Eve
nt
clas
s
x x x xx x x
x
t9
t10
t8
t7t6
t5
t4
t3
t2
t1
LL
LM
LH
ML
MM
MH
HL
HM
HH
Longitudinal tracking
Eve
nt
clas
s
x
x
x x
x
x
x
xx
t9 t10t8t7t6t5t4t3t2t1
LL
LM
LH
ML
MM
MH
HL
HM
HH
Longitudinal tracking
Eve
nt
clas
s
x
x
x x x
x
x
xx
t9 t10t8t7t6t5t4t3t2t1
LL
LM
LH
ML
MM
MH
HL
HM
HH
Longitudinal tracking
Eve
nt
clas
s
x
x
x x x
x
x
xx
t9 t10t8t7t6t5t4t3t2t1
LL
LM
LH
ML
MM
MH
HL
HM
HH
Longitudinal tracking
Eve
nt
clas
s
t9 t10t8t7t6t5t4t3t2t1
LL
LM
LH
ML
MM
MH
HL
HM
HH
Longitudinal tracking
Eve
nt
clas
s
x
x
x x x
x
x
xx
t9 t10t8t7t6t5t4t3t2t1
LL
LM
LH
ML
MM
MH
HL
HM
HH
Longitudinal tracking
Eve
nt
clas
s
x
x x
x x x x
t9 t10t8t7t6t5t4t3t2t1
LL
LM
LH
ML
MM
MH
HL
HM
HH
Longitudinal tracking
Eve
nt
clas
s
x
x x
x x x x
t9 t10t8t7t6t5t4t3t2t1
LL
LM
LH
ML
MM
MH
HL
HM
HH
Longitudinal tracking
Eve
nt
clas
s
t9 t10t8t7t6t5t4t3t2t1
LL
LM
LH
ML
MM
MH
HL
HM
HH
Longitudinal tracking
Eve
nt
clas
s
x
x x
x x x x
t9 t10t8t7t6t5t4t3t2t1
LL
LM
LH
ML
MM
MH
HL
HM
HH
Longitudinal tracking
Eve
nt
clas
s
x x x xx x x
x
t9 t10t8t7t6t5t4t3t2t1
LL
LM
LH
ML
MM
MH
HL
HM
HH
Longitudinal tracking
Eve
nt
clas
s
t9 t10t8t7t6t5t4t3t2t1
LL
LM
LH
ML
MM
MH
HL
HM
HH
Longitudinal tracking
Eve
nt
clas
s
x x x xx x x
xx x x xx x x
x
t9
t10
t8
t7t6
t5
t4
t3
t2
t1
LL
LM
LH
ML
MM
MH
HL
HM
HH
Longitudinal tracking
Eve
nt
clas
s
x
x
x x
x
x
x
xx
t9
t10
t8
t7t6
t5
t4
t3
t2
t1
LL
LM
LH
ML
MM
MH
HL
HM
HH
Longitudinal tracking
Eve
nt
clas
s
t9
t10
t8
t7t6
t5
t4
t3
t2
t1
LL
LM
LH
ML
MM
MH
HL
HM
HH
Longitudinal tracking
Eve
nt
clas
s
x
x
x x
x
x
x
xx
Wholesale industrial sector : an illustration of 4 cases
t9 t10t8t7t6t5t4t3t2t1
LL
LM
LH
ML
MM
MH
HL
HM
HH
Longitudinal tracking
Eve
nt
clas
s
x x
x x x x
x x
Manufacture
t9 t10t8t7t6t5t4t3t2t1
LL
LM
LH
ML
MM
MH
HL
HM
HH
Longitudinal tracking
Eve
nt
clas
s
t9 t10t8t7t6t5t4t3t2t1
LL
LM
LH
ML
MM
MH
HL
HM
HH
Longitudinal tracking
Eve
nt
clas
s
x x
x x x x
x x
Manufacture
t9 t10t8t7t6t5t4t3t2t1
LL
LM
LH
ML
MM
MH
HL
HM
HH
Longitudinal tracking
Eve
nt
clas
s
x
x
x x x
x
x
xx
Trade
t9 t10t8t7t6t5t4t3t2t1
LL
LM
LH
ML
MM
MH
HL
HM
HH
Longitudinal tracking
Eve
nt
clas
s
x
x
x x x
x
x
xx
t9 t10t8t7t6t5t4t3t2t1
LL
LM
LH
ML
MM
MH
HL
HM
HH
Longitudinal tracking
Eve
nt
clas
s
t9 t10t8t7t6t5t4t3t2t1
LL
LM
LH
ML
MM
MH
HL
HM
HH
Longitudinal tracking
Eve
nt
clas
s
x
x
x x x
x
x
xx
Trade
t9 t10t8t7t6t5t4t3t2t1
LL
LM
LH
ML
MM
MH
HL
HM
HH
Longitudinal tracking
Eve
nt
clas
s
x
x
x x x
x x
Transport
t9 t10t8t7t6t5t4t3t2t1
LL
LM
LH
ML
MM
MH
HL
HM
HH
Longitudinal tracking
Eve
nt
clas
s
x
x
x x x
x x
t9 t10t8t7t6t5t4t3t2t1
LL
LM
LH
ML
MM
MH
HL
HM
HH
Longitudinal tracking
Eve
nt
clas
s
t9 t10t8t7t6t5t4t3t2t1
LL
LM
LH
ML
MM
MH
HL
HM
HH
Longitudinal tracking
Eve
nt
clas
s
x
x
x x x
x x
Transport
t9 t10t8t7t6t5t4t3t2t1
LL
LM
LH
ML
MM
MH
HL
HM
HH
Longitudinal tracking
Eve
nt
clas
s
x
x x
x x x x
Trade
t9 t10t8t7t6t5t4t3t2t1
LL
LM
LH
ML
MM
MH
HL
HM
HH
Longitudinal tracking
Eve
nt
clas
s
x
x x
x x x x
t9 t10t8t7t6t5t4t3t2t1
LL
LM
LH
ML
MM
MH
HL
HM
HH
Longitudinal tracking
Eve
ntc
lass
XX
X
X
X X
Computer services
t9
t10
t8
t7
t6
t5
t4
t3
t2
t1
LL
LM
LH
ML
MM
MH
HL
HM
HH
Longitudinal tracking
Eve
ntc
lass
XX
X
X
X X
t9
t10
t8
t7
t6
t5
t4
t3
t2
t1
LL
LM
LH
ML
MM
MH
HL
HM
HH
Longitudinal tracking
Eve
ntc
lass
t9
t10
t8
t7
t6
t5
t4
t3
t2
t1
LL
LM
LH
ML
MM
MH
HL
HM
HH
Longitudinal tracking
Eve
ntc
lass
XX
X
X
X X
Computer services
t9
t10
t8
t7
t6
t5
t4
t3
t2
t1
LL
LM
LH
ML
MM
MH
HL
HM
HH
Longitudinal tracking
Eve
nt
clas
s
X
X
X
X
XX
Computer services
t9
t10
t8
t7
t6
t5
t4
t3
t2
t1
LL
LM
LH
ML
MM
MH
HL
HM
HH
Longitudinal tracking
Eve
nt
clas
s
X
X
X
X
XX
t9
t10
t8
t7
t6
t5
t4
t3
t2
t1
LL
LM
LH
ML
MM
MH
HL
HM
HH
Longitudinal tracking
Eve
nt
clas
s
t9
t10
t8
t7
t6
t5
t4
t3
t2
t1
LL
LM
LH
ML
MM
MH
HL
HM
HH
Longitudinal tracking
Eve
nt
clas
s
X
X
X
X
XX
X
X
X
X
XX
Computer services
An illustration of 6 cases from 4 industrial sector
t9 t10t8t7t6t5t4t3t2t1
LL
LM
LH
ML
MM
MH
HL
HM
HH
Longitudinal tracking
Eve
nt
clas
s
x
x
x x x
x
x
xx
t9 t10t8t7t6t5t4t3t2t1
LL
LM
LH
ML
MM
MH
HL
HM
HH
Longitudinal tracking
Eve
nt
clas
s
x
x x
x x x x
t9 t10t8t7t6t5t4t3t2t1
LL
LM
LH
ML
MM
MH
HL
HM
HH
Longitudinal tracking
Eve
nt
clas
s
x x x xx x x
x
t9
t10
t8
t7t6
t5
t4
t3
t2
t1
LL
LM
LH
ML
MM
MH
HL
HM
HH
Longitudinal tracking
Eve
nt
clas
s
x
x
x x
x
x
x
xx
t9 t10t8t7t6t5t4t3t2t1
LL
LM
LH
ML
MM
MH
HL
HM
HH
Longitudinal tracking
Eve
nt
clas
s
x
x
x x x
x
x
xx
t9 t10t8t7t6t5t4t3t2t1
LL
LM
LH
ML
MM
MH
HL
HM
HH
Longitudinal tracking
Eve
nt
clas
s
x
x
x x x
x
x
xx
t9 t10t8t7t6t5t4t3t2t1
LL
LM
LH
ML
MM
MH
HL
HM
HH
Longitudinal tracking
Eve
nt
clas
s
t9 t10t8t7t6t5t4t3t2t1
LL
LM
LH
ML
MM
MH
HL
HM
HH
Longitudinal tracking
Eve
nt
clas
s
x
x
x x x
x
x
xx
t9 t10t8t7t6t5t4t3t2t1
LL
LM
LH
ML
MM
MH
HL
HM
HH
Longitudinal tracking
Eve
nt
clas
s
x
x x
x x x x
t9 t10t8t7t6t5t4t3t2t1
LL
LM
LH
ML
MM
MH
HL
HM
HH
Longitudinal tracking
Eve
nt
clas
s
x
x x
x x x x
t9 t10t8t7t6t5t4t3t2t1
LL
LM
LH
ML
MM
MH
HL
HM
HH
Longitudinal tracking
Eve
nt
clas
s
t9 t10t8t7t6t5t4t3t2t1
LL
LM
LH
ML
MM
MH
HL
HM
HH
Longitudinal tracking
Eve
nt
clas
s
x
x x
x x x x
t9 t10t8t7t6t5t4t3t2t1
LL
LM
LH
ML
MM
MH
HL
HM
HH
Longitudinal tracking
Eve
nt
clas
s
x x x xx x x
x
t9 t10t8t7t6t5t4t3t2t1
LL
LM
LH
ML
MM
MH
HL
HM
HH
Longitudinal tracking
Eve
nt
clas
s
t9 t10t8t7t6t5t4t3t2t1
LL
LM
LH
ML
MM
MH
HL
HM
HH
Longitudinal tracking
Eve
nt
clas
s
x x x xx x x
xx x x xx x x
x
t9
t10
t8
t7t6
t5
t4
t3
t2
t1
LL
LM
LH
ML
MM
MH
HL
HM
HH
Longitudinal tracking
Eve
nt
clas
s
x
x
x x
x
x
x
xx
t9
t10
t8
t7t6
t5
t4
t3
t2
t1
LL
LM
LH
ML
MM
MH
HL
HM
HH
Longitudinal tracking
Eve
nt
clas
s
t9
t10
t8
t7t6
t5
t4
t3
t2
t1
LL
LM
LH
ML
MM
MH
HL
HM
HH
Longitudinal tracking
Eve
nt
clas
s
x
x
x x
x
x
x
xx
Wholesale industrial sector : an illustration of 4 cases
t9 t10t8t7t6t5t4t3t2t1
LL
LM
LH
ML
MM
MH
HL
HM
HH
Longitudinal tracking
Eve
nt
clas
s
x x
x x x x
x x
Manufacture
t9 t10t8t7t6t5t4t3t2t1
LL
LM
LH
ML
MM
MH
HL
HM
HH
Longitudinal tracking
Eve
nt
clas
s
t9 t10t8t7t6t5t4t3t2t1
LL
LM
LH
ML
MM
MH
HL
HM
HH
Longitudinal tracking
Eve
nt
clas
s
x x
x x x x
x x
Manufacture
t9 t10t8t7t6t5t4t3t2t1
LL
LM
LH
ML
MM
MH
HL
HM
HH
Longitudinal tracking
Eve
nt
clas
s
x
x
x x x
x
x
xx
Trade
t9 t10t8t7t6t5t4t3t2t1
LL
LM
LH
ML
MM
MH
HL
HM
HH
Longitudinal tracking
Eve
nt
clas
s
x
x
x x x
x
x
xx
t9 t10t8t7t6t5t4t3t2t1
LL
LM
LH
ML
MM
MH
HL
HM
HH
Longitudinal tracking
Eve
nt
clas
s
t9 t10t8t7t6t5t4t3t2t1
LL
LM
LH
ML
MM
MH
HL
HM
HH
Longitudinal tracking
Eve
nt
clas
s
x
x
x x x
x
x
xx
Trade
t9 t10t8t7t6t5t4t3t2t1
LL
LM
LH
ML
MM
MH
HL
HM
HH
Longitudinal tracking
Eve
nt
clas
s
x
x
x x x
x x
Transport
t9 t10t8t7t6t5t4t3t2t1
LL
LM
LH
ML
MM
MH
HL
HM
HH
Longitudinal tracking
Eve
nt
clas
s
x
x
x x x
x x
t9 t10t8t7t6t5t4t3t2t1
LL
LM
LH
ML
MM
MH
HL
HM
HH
Longitudinal tracking
Eve
nt
clas
s
t9 t10t8t7t6t5t4t3t2t1
LL
LM
LH
ML
MM
MH
HL
HM
HH
Longitudinal tracking
Eve
nt
clas
s
x
x
x x x
x x
Transport
t9 t10t8t7t6t5t4t3t2t1
LL
LM
LH
ML
MM
MH
HL
HM
HH
Longitudinal tracking
Eve
nt
clas
s
x
x x
x x x x
Trade
t9 t10t8t7t6t5t4t3t2t1
LL
LM
LH
ML
MM
MH
HL
HM
HH
Longitudinal tracking
Eve
nt
clas
s
x
x x
x x x x
t9 t10t8t7t6t5t4t3t2t1
LL
LM
LH
ML
MM
MH
HL
HM
HH
Longitudinal tracking
Eve
nt
clas
s
t9 t10t8t7t6t5t4t3t2t1
LL
LM
LH
ML
MM
MH
HL
HM
HH
Longitudinal tracking
Eve
nt
clas
s
x
x x
x x x
Trade
Heterogeneity of growth trajectories of promising firmsHeterogeneity of growth trajectories of promising firms
9 0
t8
t6
t5
t321
LL
LM
LH
ML
MM
MH
HL
HM
HH
Longitudinal tracking
Eve
ntc
lass
XX
X
X
X X
Computer services
9 0
t8
t7
t6
t5
t4
t3
t2
t1
LL
LM
LH
ML
MM
MH
HL
HM
HH
Longitudinal tracking
Eve
ntc
lass
XX
X
X
X X
t9
t10
t8
t7
t6
t5
t4
t3
t2
t1
LL
LM
LH
ML
MM
MH
HL
HM
HH
Longitudinal tracking
Eve
ntc
lass
t9
t10
t8
t7
t6
t5
t4
t3
t2
t1
LL
LM
LH
ML
MM
MH
HL
HM
HH
Longitudinal tracking
Eve
ntc
lass
XX
X
X
X X
Computer services
t9
t10
t8
t7
t6
t5
t4
t3
t2
t1
LL
LM
LH
ML
MM
MH
HL
HM
HH
Longitudinal tracking
Eve
nt
clas
s
X
X
X
X
XX
Computer services
t9
t10
t8
t7
t6
t5
t4
t3
t2
t1
LL
LM
LH
ML
MM
MH
HL
HM
HH
Longitudinal tracking
Eve
nt
clas
s
X
X
X
X
XX
t9
t10
t8
t7
t6
t5
t4
t3
t2
t1
LL
LM
LH
ML
MM
MH
HL
HM
HH
Longitudinal tracking
Eve
nt
clas
s
t987
t6
t43
t2
t1
LL
LM
LH
ML
MM
MH
HL
HM
HH
Longitudinal tracking
Eve
nt
clas
s
X
X
X
X
XX
X
X
X
X
XX
Computer services
An illustration of 6 cases from 4 industrial sector
t9 t10t8t7t6t5t4t3t2t1
LL
LM
LH
ML
MM
MH
HL
HM
HH
Longitudinal tracking
Eve
nt
clas
s
x
x
x x x
x
x
xx
t9 t10t8t7t6t5t4t3t2t1
LL
LM
LH
ML
MM
MH
HL
HM
HH
Longitudinal tracking
Eve
nt
clas
s
x
x x
x x x x
t9 t10t8t7t6t5t4
t9 t10t8t7t6t5t4t3t2t1
LL
LM
LH
ML
MM
MH
HL
HM
HH
Longitudinal tracking
Eve
nt
clas
s
x
x
x x x
x
x
xx
t9 t10t8t7t6t5t4t3t2t1
LL
LM
LH
ML
MM
MH
HL
HM
HH
Longitudinal tracking
Eve
nt
clas
s
x
x x
x x x x
t9 t10t8t7t6t5t4t3t2t1
LL
LM
LH
ML
MM
MH
HL
HM
HH
Longitudinal tracking
Eve
nt
clas
s
x x x xx x x
x
t9
t10
t8
t7t6
t5
t4
t3
t2
t1
LL
LM
LH
ML
MM
MH
HL
HM
HH
Longitudinal tracking
Eve
nt
clas
s
x
x
x x
x
x
x
xx
t9 t10t8t7t6t5t4t3
t3t2t1
LL
LM
LH
ML
MM
MH
HL
HM
HH
Longitudinal tracking
Eve
nt
clas
s
x x x xx x x
x
t9
t10
t8
t7t6
t5
t4
t3
t2
t1
LL
LM
LH
ML
MM
MH
HL
HM
HH
Longitudinal tracking
Eve
nt
clas
s
x
x
x x
x
x
x
xx
t9 t10t8t7t6t5t4t3t2t1
LL
LM
LH
ML
MM
MH
HL
HM
HH
Longitudinal tracking
Eve
nt
clas
s
x
x
x x x
x
x
xx
t9 t10t8t7t6t5t4t3t2t1
LL
LM
LH
ML
MM
MH
HL
HM
HH
Longitudinal tracking
Eve
nt
clas
s
x
x
x x x
x
x
xx
t9 t10t8t7t6t5t4t3t2t1
LL
LM
LH
ML
MM
MH
HL
t2t1
LL
LM
LH
ML
MM
MH
HL
HM
HH
Longitudinal tracking
Eve
nt
clas
s
x
x
x x x
x
x
xx
t9 t10t8t7t6t5t4t3t2t1
LL
LM
LH
ML
MM
MH
HL
HM
HH
Longitudinal tracking
Eve
nt
clas
s
x
x
x x x
x
x
xx
t9 t10t8t7t6t5t4t3t2t1
LL
LM
LH
ML
MM
MH
HL
HM
HH
Longitudinal tracking
Eve
nt
clas
s
t9 t10t8t7t6t5t4t3t2t1
LL
LM
LH
ML
MM
MH
HL
HM
HH
Longitudinal tracking
Eve
nt
clas
s
x
x
x x x
x
x
xx
t9 t10t8t7t6t5t4t3t2t1
LL
LM
LH
ML
MM
MH
HL
HM
HH
Longitudinal tracking
Eve
nt
clas
s
x
x x
x x x xHM
HH
Longitudinal tracking
Eve
nt
clas
s
t9 t10t8t7t6t5t4t3t2t1
LL
LM
LH
ML
MM
MH
HL
HM
HH
Longitudinal tracking
Eve
nt
clas
s
x
x
x x x
x
x
xx
t9 t10t8t7t6t5t4t3t2t1
LL
LM
LH
ML
MM
MH
HL
HM
HH
Longitudinal tracking
Eve
nt
clas
s
x
x x
x x x x
t9 t10t8t7t6t5t4t3t2t1
LL
LM
LH
ML
MM
MH
HL
HM
HH
Longitudinal tracking
Eve
nt
clas
s
x
x x
x x x x
t9 t10t8t7t6t5t4t3t2t1
LL
LM
LH
ML
MM
MH
HL
HM
HH
Longitudinal tracking
Eve
nt
clas
s
t9 t10t8t7t6t5t4t3t2t1
LL
LM
LH
t9 t10t8t7t6t5t4t3t2t1
LL
LM
LH
ML
MM
MH
HL
HM
HH
Longitudinal tracking
Eve
nt
clas
s
x
x x
x x x x
t9 t10t8t7t6t5t4t3t2t1
LL
LM
LH
ML
MM
MH
HL
HM
HH
Longitudinal tracking
Eve
nt
clas
s
t9 t10t8t7t6t5t4t3t2t1
LL
LM
LH
ML
MM
MH
HL
HM
HH
Longitudinal tracking
Eve
nt
clas
s
x
x x
x x x x
t9 t10t8t7t6t5t4t3t2t1
LL
LM
LH
ML
MM
MH
HL
HM
HH
Longitudinal tracking
Eve
nt
clas
s
x x x xx x x
x
t9 t10t8t7t6t5t4t3t2t1
LL
LM
LH
ML
MM
MH
HL
HM
HH
ML
MM
MH
HL
HM
HH
Longitudinal tracking
Eve
nt
clas
s
x
x x
x x x x
t9 t10t8t7t6t5t4t3t2t1
LL
LM
LH
ML
MM
MH
HL
HM
HH
Longitudinal tracking
Eve
nt
clas
s
x x x xx x x
x
t9 t10t8t7t6t5t4t3t2t1
LL
LM
LH
ML
MM
MH
HL
HM
HH
Longitudinal tracking
Eve
nt
clas
s
t9 t10t8t7t6t5t4t3t2t1
LL
LM
LH
ML
MM
MH
HL
HM
HH
Longitudinal tracking
Eve
nt
clas
s
x x x xx x x
xx x x xx x x
x
t9
t10
t8
t7t6
t5
t4
t3
t2
t1
LL
LM
LH
ML
MM
MH
HL
HM
HH
Longitudinal tracking
Eve
nt
clas
s
t9 t10t8t7t6t5t4t3t2t1
LL
LM
LH
ML
MM
MH
HL
HM
HH
Longitudinal tracking
Eve
nt
clas
s
x x x xx x x
xx x x xx x x
x
t9
t10
t8
t7t6
t5
t4
t3
t2
t1
LL
LM
LH
ML
MM
MH
HL
HM
HH
Longitudinal tracking
Eve
nt
clas
s
x
x
x x
x
x
x
xx
t9
t10
t8
t7t6
t5
t4
t3
t2
t1
LL
LM
LH
ML
MM
MH
HL
HM
HH
Longitudinal tracking
Eve
nt
clas
s
t9
t10
t8
t7t6
t5
t4
t3
t2
t1
LL
LM
LH
ML
MM
MH
HL
HM
HH
Longitudinal tracking
Eve
nt
clas
s
x
x
x x
x
x
x
xx
t9
t10
t8
t7t6
t5
t4
t3
t2
t1
LL
LM
LH
ML
MM
MH
HL
HM
HH
Longitudinal tracking
Eve
nt
clas
s
t9
t10
t8
t7t6
t5
t4
t3
t2
t1
LL
LM
LH
ML
MM
MH
HL
HM
HH
Longitudinal tracking
Eve
nt
clas
s
x
x
x x
x
x
x
xx
Wholesale industrial sector : an illustration of 4 cases
t9 t10t8t7t6t5t4t3t2t1
LL
LM
LH
ML
MM
MH
HL
HM
HH
Longitudinal tracking
Eve
nt
clas
s
x x
x x x x
x x
Manufacture
t9 t10t8t7t6t5t4t3t2t1
LL
LM
LH
ML
MM
MH
HL
HM
HH
Longitudinal tracking
Eve
nt
clas
s
t9 t10
Longitudinal tracking
Eve
nt
clas
s
x
x
x x
x
x
x
xx
Wholesale industrial sector : an illustration of 4 cases
t9 t10t8t7t6t5t4t3t2t1
LL
LM
LH
ML
MM
MH
HL
HM
HH
Longitudinal tracking
Eve
nt
clas
s
x x
x x x x
x x
Manufacture
t9 t10t8t7t6t5t4t3t2t1
LL
LM
LH
ML
MM
MH
HL
HM
HH
Longitudinal tracking
Eve
nt
clas
s
t9 t10t8t7t6t5t4t3t2t1
LL
LM
LH
ML
MM
MH
HL
HM
HH
Longitudinal tracking
Eve
nt
clas
s
x x
x x x x
x x
Manufacture
t9 t10t8t7t6t5t4t3t2t1
LL
LM
LH
ML
MM
MH
HL
HM
HH
Longitudinal tracking
Eve
nt
clas
s
x
x
x x x
x
x
xx
Trade
t9 t10t8t7t6t5t4t3t8t7t6t5t4t3t2t1
LL
LM
LH
ML
MM
MH
HL
HM
HH
Longitudinal tracking
Eve
nt
clas
s
x x
x x x x
x x
Manufacture
t9 t10t8t7t6t5t4t3t2t1
LL
LM
LH
ML
MM
MH
HL
HM
HH
Longitudinal tracking
Eve
nt
clas
s
x
x
x x x
x
x
xx
Trade
t9 t10t8t7t6t5t4t3t2t1
LL
LM
LH
ML
MM
MH
HL
HM
HH
Longitudinal tracking
Eve
nt
clas
s
x
x
x x x
x
x
xx
t9 t10t8t7t6t5t4t3t2t1
LL
LM
LH
ML
MM
MH
HL
HM
HH
Longitudinal tracking
Eve
nt
clas
s
t9 t10t8t7t6t5t4t3t2t1
LL
LM
LH
ML
MM
MH
HL
HM
HH
t2t1
LL
LM
LH
ML
MM
MH
HL
HM
HH
Longitudinal tracking
Eve
nt
clas
s
x
x
x x x
x
x
xx
t9 t10t8t7t6t5t4t3t2t1
LL
LM
LH
ML
MM
MH
HL
HM
HH
Longitudinal tracking
Eve
nt
clas
s
t9 t10t8t7t6t5t4t3t2t1
LL
LM
LH
ML
MM
MH
HL
HM
HH
Longitudinal tracking
Eve
nt
clas
s
x
x
x x x
x
x
xx
Trade
t9 t10t8t7t6t5t4t3t2t1
LL
LM
LH
ML
MM
MH
HL
HM
HH
Longitudinal tracking
Eve
nt
clas
s
x
x
x x x
x x
Transport
t9 t10t8t7t6t5t4t3t2t1
LL
LM
LH
ML
MM
MH
HL
HM
HH
Longitudinal tracking
Eve
nt
clas
s
x
x
x x x
x x
Longitudinal tracking
Eve
nt
clas
s
x
x
x x x
x
x
xx
Trade
t9 t10t8t7t6t5t4t3t2t1
LL
LM
LH
ML
MM
MH
HL
HM
HH
Longitudinal tracking
Eve
nt
clas
s
x
x
x x x
x x
Transport
t9 t10t8t7t6t5t4t3t2t1
LL
LM
LH
ML
MM
MH
HL
HM
HH
Longitudinal tracking
Eve
nt
clas
s
x
x
x x x
x x
t9 t10t8t7t6t5t4t3t2t1
LL
LM
LH
ML
MM
MH
HL
HM
HH
Longitudinal tracking
Eve
nt
clas
s
t9 t10t8t7t6t5t4t3t2t1
LL
LM
LH
ML
MM
MH
HL
HM
HH
Longitudinal tracking
Eve
nt
clas
s
x
x
x x x
x x
Transport
t9 t10t8t7t6t5t4t3t2t1
LL
LM
t9 t10t8t7t6t5t4t3t2t1
LL
LM
LH
ML
MM
MH
HL
HM
HH
Longitudinal tracking
Eve
nt
clas
s
t9 t10t8t7t6t5t4t3t2t1
LL
LM
LH
ML
MM
MH
HL
HM
HH
Longitudinal tracking
Eve
nt
clas
s
x
x
x x x
x x
Transport
t9 t10t8t7t6t5t4t3t2t1
LL
LM
LH
ML
MM
MH
HL
HM
HH
Longitudinal tracking
Eve
nt
clas
s
x
x x
x x x x
Trade
t9 t10t8t7t6t5t4t3t2t1
LL
LM
LH
ML
MM
MH
HL
HM
HH
Longitudinal tracking
Eve
nt
clas
s
x
x x
x x x x
t9 t10t8t7t6t5t4t3t2t1
LL
LM
LH
ML
MM
MH
HL
HM
HH
LH
ML
MM
MH
HL
HM
HH
Longitudinal tracking
Eve
nt
clas
s
x
x x
x x x x
Trade
t9 t10t8t7t6t5t4t3t2t1
LL
LM
LH
ML
MM
MH
HL
HM
HH
Longitudinal tracking
Eve
nt
clas
s
x
x x
x x x x
t9 t10t8t7t6t5t4t3t2t1
LL
LM
LH
ML
MM
MH
HL
HM
HH
Longitudinal tracking
Eve
ntc
lass
XX
X
X
X X
Computer services
t9
t10
t8
t7
t6
t5
t4
t3
t2
t1
LL
LM
LH
ML
MM
MH
HL
HM
HH
Longitudinal tracking
Eve
ntc
lass
XX
X
X
X X
t9
t10
t8
t7
t6
t5
t4
t3
t2
t1
LL
LM
LH
ML
MM
MH
HL
HM
HH
Longitudinal tracking
Eve
ntc
lass
XX
X
X
X X
Computer services
t9
t10
t8
t7
t6
t5
t4
t3
t2
t1
LL
LM
LH
ML
MM
MH
HL
HM
HH
Longitudinal tracking
Eve
ntc
lass
XX
X
X
X X
t9
t10
t8
t7
t6
t5
t4
t3
t2
t1
LL
LM
LH
ML
MM
MH
HL
HM
HH
Longitudinal tracking
Eve
ntc
lass
t9
t10
t8
t7
t6
t5
t4
t3
t2
t1
LL
LM
LH
ML
MM
MH
HL
HM
HH
Longitudinal tracking
Eve
ntc
lass
XX
X
X
X X
Computer services
t9
t10
t8
t7
t6
t5
t4
t3
t2
t1
LL
LM
LH
ML
MM
MH
HL
HM
HH
Longitudinal tracking
Eve
ntc
lass
t9
t10
t8
t7
t6
t5
t4
t3
t2
t1
LL
LM
LH
ML
MM
MH
HL
HM
HH
Longitudinal tracking
Eve
ntc
lass
XX
X
X
X X
Computer services
t9
t10
t8
t7
t6
t5
t4
t3
t2
t1
LL
LM
LH
ML
MM
MH
HL
HM
HH
Longitudinal tracking
Eve
nt
clas
s
X
X
X
X
XX
Computer services
t9
t10
t8
t7
t6
t5
t4
t3
t2
t1
LL
LM
LH
ML
MM
MH
HL
HM
HH
Longitudinal tracking
Eve
nt
clas
s
X
X
X
X
XX
t9
t10
t8
t7
t6
t5
t4
t3
t2
t1
LL
LM
LH
ML
MM
Longitudinal tracking
Eve
nt
clas
s
X
X
X
X
XX
Computer services
t9
t10
t8
t7
t6
t5
t4
t3
t2
t1
LL
LM
LH
ML
MM
MH
HL
HM
HH
Longitudinal tracking
Eve
nt
clas
s
X
X
X
X
XX
t9
t10
t8
t7
t6
t5
t4
t3
t2
t1
LL
LM
LH
ML
MM
MH
HL
HM
HH
Longitudinal tracking
Eve
nt
clas
s
t9
t10
t8
t7
t6
t5
t4
t3
t2
t1
LL
LM
LH
ML
MM
MH
HL
HM
HH
Longitudinal tracking
Eve
nt
clas
s
X
X
X
X
XX
X
X
X
X
XX
Computer services
An illustration of 6 cases from 4 industrial sector
t9 t10t8t7t6t5t4t3t2t1
LL
MH
HL
HM
HH
Longitudinal tracking
Eve
nt
clas
s
t9
t10
t8
t7
t6
t5
t4
t3
t2
t1
LL
LM
LH
ML
MM
MH
HL
HM
HH
Longitudinal tracking
Eve
nt
clas
s
X
X
X
X
XX
X
X
X
X
XX
Computer services
An illustration of 6 cases from 4 industrial sector
t9 t10t8t7t6t5t4t3t2t1
LL
LM
LH
ML
MM
MH
HL
HM
HH
Longitudinal tracking
Eve
nt
clas
s
x
x
x x x
x
x
xx
t9 t10t8t7t6t5t4t3t2t1
LL
LM
LH
ML
MM
MH
HL
HM
HH
Longitudinal tracking
Eve
nt
clas
s
x
x x
x x x x
t9 t10t8t7t6t5t4t3t2t1
LL
LM
LH
ML
MM
MH
HL
HM
HH
LM
LH
ML
MM
MH
HL
HM
HH
Longitudinal tracking
Eve
nt
clas
s
x
x
x x x
x
x
xx
t9 t10t8t7t6t5t4t3t2t1
LL
LM
LH
ML
MM
MH
HL
HM
HH
Longitudinal tracking
Eve
nt
clas
s
x
x x
x x x x
t9 t10t8t7t6t5t4t3t2t1
LL
LM
LH
ML
MM
MH
HL
HM
HH
Longitudinal tracking
Eve
nt
clas
s
x x x xx x x
x
t9
t10
t8
t7t6
t5
t4
t3
t2
t1
LL
LM
LH
ML
MM
MH
HL
HM
HH
Longitudinal tracking
Eve
nt
clas
s
x
x
x x
x
x
x
xx
t9 t10t8t7t6t5t4t3t2t1
LL
LM
LH
ML
MM
MH
HL
HM
HH
Longitudinal tracking
Eve
nt
clas
s
x x x xx x x
x
t9
t10
t8
t7t6
t5
t4
t3
t2
t1
LL
LM
LH
ML
MM
MH
HL
HM
HH
Longitudinal tracking
Eve
nt
clas
s
x
x
x x
x
x
x
xx
t9 t10t8t7t6t5t4t3t2t1
LL
LM
LH
ML
MM
MH
HL
HM
HH
Longitudinal tracking
Eve
nt
clas
s
x
x
x x x
x
x
xx
t9 t10t8t7t6t5t4t3t2t1
LL
LM
LH
ML
MM
MH
HL
HM
HH
Longitudinal tracking
Eve
nt
clas
s
x
x
x x x
x
x
xx
t9 t10t8t7t6t5t4t3t2t1
LL
LM
LH
ML
MM
MH
HL
HM
HH
Longitudinal tracking
Eve
nt
clas
s
t9 t10
Longitudinal tracking
Eve
nt
clas
s
x
x
x x x
x
x
xx
t9 t10t8t7t6t5t4t3t2t1
LL
LM
LH
ML
MM
MH
HL
HM
HH
Longitudinal tracking
Eve
nt
clas
s
x
x
x x x
x
x
xx
t9 t10t8t7t6t5t4t3t2t1
LL
LM
LH
ML
MM
MH
HL
HM
HH
Longitudinal tracking
Eve
nt
clas
s
t9 t10t8t7t6t5t4t3t2t1
LL
LM
LH
ML
MM
MH
HL
HM
HH
Longitudinal tracking
Eve
nt
clas
s
x
x
x x x
x
x
xx
t9 t10t8t7t6t5t4t3t2t1
LL
LM
LH
ML
MM
MH
HL
HM
HH
Longitudinal tracking
Eve
nt
clas
s
x
x x
x x x x
t9 t10t8t7t6t5t4t3t2t1 t8t7t6t5t4t3t2t1
LL
LM
LH
ML
MM
MH
HL
HM
HH
Longitudinal tracking
Eve
nt
clas
s
x
x
x x x
x
x
xx
t9 t10t8t7t6t5t4t3t2t1
LL
LM
LH
ML
MM
MH
HL
HM
HH
Longitudinal tracking
Eve
nt
clas
s
x
x x
x x x x
t9 t10t8t7t6t5t4t3t2t1
LL
LM
LH
ML
MM
MH
HL
HM
HH
Longitudinal tracking
Eve
nt
clas
s
x
x x
x x x x
t9 t10t8t7t6t5t4t3t2t1
LL
LM
LH
ML
MM
MH
HL
HM
HH
Longitudinal tracking
Eve
nt
clas
s
t9 t10t8t7t6t5t4t3t2t1
LL
LM
LH
ML
MM
MH
HL
HM
HH
Longitudinal tracking
LL
LM
LH
ML
MM
MH
HL
HM
HH
Longitudinal tracking
Eve
nt
clas
s
x
x x
x x x x
t9 t10t8t7t6t5t4t3t2t1
LL
LM
LH
ML
MM
MH
HL
HM
HH
Longitudinal tracking
Eve
nt
clas
s
t9 t10t8t7t6t5t4t3t2t1
LL
LM
LH
ML
MM
MH
HL
HM
HH
Longitudinal tracking
Eve
nt
clas
s
x
x x
x x x x
t9 t10t8t7t6t5t4t3t2t1
LL
LM
LH
ML
MM
MH
HL
HM
HH
Longitudinal tracking
Eve
nt
clas
s
x x x xx x x
x
t9 t10t8t7t6t5t4t3t2t1
LL
LM
LH
ML
MM
MH
HL
HM
HH
Longitudinal tracking
Eve
nt
clas
s
t9 t10t8t7t6t5
Eve
nt
clas
s
x
x x
x x x x
t9 t10t8t7t6t5t4t3t2t1
LL
LM
LH
ML
MM
MH
HL
HM
HH
Longitudinal tracking
Eve
nt
clas
s
x x x xx x x
x
t9 t10t8t7t6t5t4t3t2t1
LL
LM
LH
ML
MM
MH
HL
HM
HH
Longitudinal tracking
Eve
nt
clas
s
t9 t10t8t7t6t5t4t3t2t1
LL
LM
LH
ML
MM
MH
HL
HM
HH
Longitudinal tracking
Eve
nt
clas
s
x x x xx x x
xx x x xx x x
x
t9
t10
t8
t7t6
t5
t4
t3
t2
t1
LL
LM
LH
ML
MM
MH
HL
HM
HH
Longitudinal tracking
Eve
nt
clas
s
x
x
x x
x
x
x
xx
t9
t1t4t3t2t1
LL
LM
LH
ML
MM
MH
HL
HM
HH
Longitudinal tracking
Eve
nt
clas
s
x x x xx x x
xx x x xx x x
x
t9
t10
t8
t7t6
t5
t4
t3
t2
t1
LL
LM
LH
ML
MM
MH
HL
HM
HH
Longitudinal tracking
Eve
nt
clas
s
x
x
x x
x
x
x
xx
t9
t10
t8
t7t6
t5
t4
t3
t2
t1
LL
LM
LH
ML
MM
MH
HL
HM
HH
Longitudinal tracking
Eve
nt
clas
s
t9
t10
t8
t7t6
t5
t4
t3
t2
t1
LL
LM
LH
ML
MM
MH
HL
HM
HH
Longitudinal tracking
Eve
nt
clas
s
x
x
x x
x
x
x
xx
Wholesale industrial sector : an illustration of 4 cases
t9
0t8
t7t6
t5
t4
t3
t2
t1
LL
LM
LH
ML
MM
MH
HL
HM
HH
Longitudinal tracking
Eve
nt
clas
s
t9
t10
t8
t7t6
t5
t4
t3
t2
t1
LL
LM
LH
ML
MM
MH
HL
HM
HH
Longitudinal tracking
Eve
nt
clas
s
x
x
x x
x
x
x
xx
Wholesale industrial sector : an illustration of 4 cases
t9 t10t8t7t6t5t4t3t2t1
LL
LM
LH
ML
MM
MH
HL
HM
HH
Longitudinal tracking
Eve
nt
clas
s
x x
x x x x
x x
Manufacture
t9 t10t8t7t6t5t4t3t2t1
LL
LM
LH
ML
MM
MH
HL
HM
HH
Longitudinal tracking
Eve
nt
clas
s
t9 t10t8t7t6t5t4t3t2t1
LL
LM
LH
ML
MM
t10t8t7t6t5t4t3t2t1
LL
LM
LH
ML
MM
MH
HL
HM
HH
Longitudinal tracking
Eve
nt
clas
s
x x
x x x x
x x
Manufacture
t9 t10t8t7t6t5t4t3t2t1
LL
LM
LH
ML
MM
MH
HL
HM
HH
Longitudinal tracking
Eve
nt
clas
s
t9 t10t8t7t6t5t4t3t2t1
LL
LM
LH
ML
MM
MH
HL
HM
HH
Longitudinal tracking
Eve
nt
clas
s
x x
x x x x
x x
Manufacture
t9 t10t8t7t6t5t4t3t2t1
LL
LM
LH
ML
MM
MH
HL
HM
HH
Longitudinal tracking
Eve
nt
clas
s
x
x
x x x
x
x
xx
Trade
t9 t10t8t7t6t5t4t3t2t1
LL
LM
LH
ML
MM
MH
HL
HM
HH
MH
HL
HM
HH
Longitudinal tracking
Eve
nt
clas
s
x x
x x x x
x x
Manufacture
t9 t10t8t7t6t5t4t3t2t1
LL
LM
LH
ML
MM
MH
HL
HM
HH
Longitudinal tracking
Eve
nt
clas
s
x
x
x x x
x
x
xx
Trade
t9 t10t8t7t6t5t4t3t2t1
LL
LM
LH
ML
MM
MH
HL
HM
HH
Longitudinal tracking
Eve
nt
clas
s
x
x
x x x
x
x
xx
t9 t10t8t7t6t5t4t3t2t1
LL
LM
LH
ML
MM
MH
HL
HM
HH
Longitudinal tracking
Eve
nt
clas
s
t9 t10t8t7t6t5t4t3t2t1
LL
LM
LH
ML
MM
MH
HL
HM
HH
Longitudinal tracking
Eve
nt
clas
s
x
x
x x x
x
x
xx
Trade
t9 t10
Longitudinal tracking
Eve
nt
clas
s
x
x
x x x
x
x
xx
t9 t10t8t7t6t5t4t3t2t1
LL
LM
LH
ML
MM
MH
HL
HM
HH
Longitudinal tracking
Eve
nt
clas
s
t9 t10t8t7t6t5t4t3t2t1
LL
LM
LH
ML
MM
MH
HL
HM
HH
Longitudinal tracking
Eve
nt
clas
s
x
x
x x x
x
x
xx
Trade
t9 t10t8t7t6t5t4t3t2t1
LL
LM
LH
ML
MM
MH
HL
HM
HH
Longitudinal tracking
Eve
nt
clas
s
x
x
x x x
x x
Transport
t9 t10t8t7t6t5t4t3t2t1
LL
LM
LH
ML
MM
MH
HL
HM
HH
Longitudinal tracking
Eve
nt
clas
s
x
x
x x x
x x
t9 t10t8t7t6t5t4t3t2t1
LL
t8t7t6t5t4t3t2t1
LL
LM
LH
ML
MM
MH
HL
HM
HH
Longitudinal tracking
Eve
nt
clas
s
x
x
x x x
x x
Transport
t9 t10t8t7t6t5t4t3t2t1
LL
LM
LH
ML
MM
MH
HL
HM
HH
Longitudinal tracking
Eve
nt
clas
s
x
x
x x x
x x
t9 t10t8t7t6t5t4t3t2t1
LL
LM
LH
ML
MM
MH
HL
HM
HH
Longitudinal tracking
Eve
nt
clas
s
t9 t10t8t7t6t5t4t3t2t1
LL
LM
LH
ML
MM
MH
HL
HM
HH
Longitudinal tracking
Eve
nt
clas
s
x
x
x x x
x x
Transport
t9 t10t8t7t6t5t4t3t2t1
LL
LM
LH
ML
MM
MH
HL
HM
HH
LM
LH
ML
MM
MH
HL
HM
HH
Longitudinal tracking
Eve
nt
clas
s
t9 t10t8t7t6t5t4t3t2t1
LL
LM
LH
ML
MM
MH
HL
HM
HH
Longitudinal tracking
Eve
nt
clas
s
x
x
x x x
x x
Transport
t9 t10t8t7t6t5t4t3t2t1
LL
LM
LH
ML
MM
MH
HL
HM
HH
Longitudinal tracking
Eve
nt
clas
s
x
x x
x x x x
Trade
t9 t10t8t7t6t5t4t3t2t1
LL
LM
LH
ML
MM
MH
HL
HM
HH
Longitudinal tracking
Eve
nt
clas
s
x
x x
x x x x
t9 t10t8t7t6t5t4t3t2t1
LL
LM
LH
ML
MM
MH
HL
HM
HH
Longitudinal tracking
Eve
nt
clas
s
t9 t10t8t7t6t5t4t3
Longitudinal tracking
Eve
nt
clas
s
x
x x
x x x x
Trade
t9 t10t8t7t6t5t4t3t2t1
LL
LM
LH
ML
MM
MH
HL
HM
HH
Longitudinal tracking
Eve
nt
clas
s
x
x x
x x x x
t9 t10t8t7t6t5t4t3t2t1
LL
LM
LH
ML
MM
MH
HL
HM
HH
Longitudinal tracking
Eve
nt
clas
s
t9 t10t8t7t6t5t4t3t2t1
LL
LM
LH
ML
MM
MH
HL
HM
HH
Longitudinal tracking
Eve
nt
clas
s
x
x x
x x x
Trade
Heterogeneity of growth trajectories of promising firmsHeterogeneity of growth trajectories of promising firms
9 0
t8
t6
t5
t321
LL
LM
LH
ML
MM
MH
HL
HM
HH
Longitudinal tracking
Eve
ntc
lass
XX
X
X
X X
Computer services
9 0
t8
t7
t6
t5
t4
t3
t2
t1
LL
LM
LH
ML
MM
MH
HL
HM
HH
Longitudinal tracking
Eve
ntc
lass
XX
X
X
X X
t9
t10
t8
t7
t6
t5
t4
t3
t2
t1
LL
LM
LH
ML
MM
MH
HL
HM
HH
Longitudinal tracking
Eve
ntc
lass
t9
t108
t7
t6
t5
t4
t3
t2
t1
LL
LM
LH
ML
MM
MH
HL
HM
HH
Longitudinal tracking
Eve
ntc
lass
XX
X
X
X X
t9
t10
t8
t7
t6
t5
t4
t3
t2
t1
LL
LM
LH
ML
MM
MH
HL
HM
HH
Longitudinal tracking
Eve
ntc
lass
t9
t10
t8
t7
t6
t5
t4
t3
t2
t1
LL
LM
LH
ML
MM
MH
HL
HM
HH
Longitudinal tracking
Eve
ntc
lass
XX
X
X
X X
Computer services
t9
t10
t8
t7
t6
t5
t4
t3
t2
t1
LL
LM
LH
ML
MM
MH
HL
HM
HH
Longitudinal tracking
Eve
nt
clas
s
X
X
X
X
XX
t8
t7
t6
t5
t4
t3
t2
t1
LL
LM
LH
ML
MM
MH
HL
HM
HH
Longitudinal tracking
Eve
ntc
lass
XX
X
X
X X
Computer services
t9
t10
t8
t7
t6
t5
t4
t3
t2
t1
LL
LM
LH
ML
MM
MH
HL
HM
HH
Longitudinal tracking
Eve
nt
clas
s
X
X
X
X
XX
Computer services
t9
t10
t8
t7
t6
t5
t4
t3
t2
t1
LL
LM
LH
ML
MM
MH
HL
HM
HH
Longitudinal tracking
Eve
nt
clas
s
X
X
X
X
XX
t9
t10
t8
t7
t6
t5
t4
t3
t2
t1
LL
LM
LH
ML
MM
MH
HL
HM
HH
Computer services
t9
t10
t8
t7
t6
t5
t4
t3
t2
t1
LL
LM
LH
ML
MM
MH
HL
HM
HH
Longitudinal tracking
Eve
nt
clas
s
X
X
X
X
XX
t9
t10
t8
t7
t6
t5
t4
t3
t2
t1
LL
LM
LH
ML
MM
MH
HL
HM
HH
Longitudinal tracking
Eve
nt
clas
s
t987
t6
t43
t2
t1
LL
LM
LH
ML
MM
MH
HL
HM
HH
Longitudinal tracking
Eve
nt
clas
s
X
X
X
X
XX
X
X
X
X
XX
Computer services
An illustration of 6 cases from 4 industrial sector
Fig. 3.B Fig. 3.A
Fig. 3.C
Fig. 4.B
Fig. 4.A
Fig. 3.D

521
4.2. Exploring Growth Trajectories based on State Sequence Analysis: A combination of PCA and Markov Chain Model
As indicated in section 3, we combined PCA and Markov chain model to provide state sequences analysis for extending previous approach and performing clustering solutions of growth trajectories. Four procedures were developed to derive taxonomy of promising firm:
• The first procedure focused on the identification and characterisation of state and type of state.
• Characteristics of state dependencies and their properties were explored in the second procedure.
• The third procedure explored the growth trajectories and identified the stable cluster.
• The final procedure presents some preliminary results concerning external validity.
Findings of State Sequence Analysis
We present the results of the state sequence analysis in the following points.
Identification and characterisation of state and type of state
Based on our alternative approach indicated in section 3, the subset (scenario with only absolute volume) is used to identify the states. The previous result of the PCA, presented above, showed that this scenario is the most convenient to take into account the maximum information of initial data. Indeed, with only the first three axes, the cumulative variance explained from the PCA is more than 82%. Additionally, this subset allows us to take into account all the ten initial variables of the scenario. To this concern, the previous interpretation axes showed that while the two first axes, used in visual approach, are labeled “Profitability” and “Size”, the third axe is most explained by Shareholder equity and Cash flow variable and was labeled “Solvency”. Thus, this composite indicator complemented by ratio indicators retained127 gives us interesting conceptual framework to investigate firm growth trajectory based on firm tangible resource.
As indicated in our method, from PCA on the subset presented above, we used only the first “Profitability” and third “Solvency” axes to define the states. The second “Size” axe was used in expost characterisation of clusters, as well as the 6 ratios. Emerging states will be used for the further sequence analysis.
127 (ROA, ROE, Total assets turnover, Labour productivity and Capital productivity)

522
Using a two dimensional approach from the two PCA axes retained, four states are considered as base of clustering in a static way. We presented these four states using the PCA graph which is the natural projection plan of individual firm. In addition, PCA coordinates of initial data (longitudinal data set of 741firms) are used to cluster individual firm. Thus, each individual firm can be located on this graph based on its coordinates defined by its yearly data.
In order to start sequence analysis, we transform the PCA coordinates into categorical data (Fig. 5). Hence, our initial longitudinal data set of 741 firms is represented in categorical data. Statistical description of new data set (Fig. 6) showed that three states (1, 3 and 4) seem to be stable over time. State 2 starts with a high number (60% the first year) compare to others and then decreases over time.
Figure 5: Definition of State patterns and data transformation using visual approach based on PCA graph
Figure 6: State patterns structure from total firms (n = 741) State characteristics
The four states are defined using two dimensions based on Profitability and Solvency axes as starting point. Then, we explore their characteristics using the empirical distribution of the 10 initial variables and the 5 ratios. Empirical densities of each variable, from the four states, are investigated altogether. (Fig.7: give some illustrations).
We present the preliminary findings in the table below.
Distribution of state by age over time
0 % 0 %7%
19 %3 0 %
4 2 %
58 %71%
14 %2 6 %
2 4 %
2 4 %
19 %
15%
10 %
6 %
4 %
6 0 %4 5% 3 6 %
2 7% 2 0 %
17%
13 %
9 %
4 %
10 % 15% 17% 16 % 17%13 %
9 %7%
3 %16 % 15% 16 % 15% 14 % 13 % 11% 7% 5%
8 4 %
0%
10%
20%
30%
40%
50%
60%
70%
80%
90%
100%
t1 t2 t3 t4 t5 t6 t7 t8 t9
State 0 State-1 State-2 State-3 Event4
High profitabilityLow Solvency
High profitabilityLow Solvency
High profitabilityLow Solvency
Low profitabilityHigh Solvency
Profitability axe
So
lve
ncy
ax
e
31
42
State initial patterns State patterns coded
High profitabilityLow Solvency
High profitabilityLow Solvency
High profitabilityLow Solvency
Low profitabilityHigh Solvency
Profitability axe
High profitabilityLow Solvency
High profitabilityLow Solvency
High profitabilityLow Solvency
Low profitabilityHigh Solvency
Profitability axe
So
lve
ncy
ax
e
31
42
31
42
State initial patterns State patterns coded

523
Fig.7: States characteristics based on the empirical density of Operating income, Working capital, Labour productivity (proxied with Value added over Employment) and Employment. The states are identified by their specific codes defined . Characteristics of state dependencies and their properties
We applied Markov chain model on states data developed. Then, we inspected the transition matrix which reports the probabilities of moving between the four states defined. We represented the results in a Diagraph (Fig. 8). According to Bakerman and Gottman (1986), such diagraph rendering quite visible just how states were sequenced in time.
Findings showed that, the probability to maintain initial state is higher (p > .61). This behaviour can be interpretated by firm defensive strategy or firm inertia. Secondly, when interruption arises, substantial growth, moving from low level of both profitability and solvency, to high level of the same parameters, is rare. Thirdly, other transitions have variable probabilities. Finally, when we inspected unbalanced reversible scheme there is more probability of setbacks than progress (see diagraph of forward and backward random walks).
3
1 2
4
0.66 0.12
0.20 0.02
0.17
0.180.03
0.120.61
0.07
0.120.06
0.66
0.20
0.65
0.13
0.20 0.19
0.26 0.35
3
1 2
4
0.66 0.12
0.20 0.02
0.17
0.180.03
0.120.61
0.07
0.120.06
0.66
0.20
0.65
0.13
0.20 0.19
0.26 0.35
3
1 2
4
0.66 0.12
0.20 0.02
0.17
0.180.03
0.120.61
0.07
0.120.06
0.66
0.20
0.65
0.13
0.20 0.19
0.26 0.35
1 2 3 41 2 3 4
1 2 3 41 2 3 4
Forward random walk
Backward random walk

524
Figure 8: Diagraphs for firm growth transition probability matrices. In these diagraphs, circles represent states (in our case, the state of one given type of growth), and labeled arrows connecting the circles represent the transitional probabilities among them. The box represents the probability to start in the specific state from sample
In addition, the structure (see Fig. 9) of state sequences showed variable length dependent on firm age. Consequently, growth trajectory can be explored in different way based on firm age. Therefore, we decided to retain length of 4 years as departure point. 602 firms are concerned.
Growth trajectories explored
As we have 4 states at our disposal for 4 years, the total number of possible combinations, of 4 states sequences, is equal to 256. This corresponds to the expected growth trajectories. From our data set, the observed growth trajectories are 115 (45% of expected number) (Fig.10). From these, the top 22 are related to 71% of firm and the top 11 to 60% of firm (see Fig.11).
Explored the stable cluster
Additionally, based on the top 11 growth trajectories, we identified 7 possible patterns from which two main behaviours, stable and instable, emerged. As consequence we can classify firm growth trajectories following the 7 patterns: cluster 1= (s4444), cluster 2 = (s3333), cluster 3= (s2222), cluster 4 (s1111), cluster 5= (s2221; s2211; s2111), cluster 6= (s2223), cluster 7= (s2444; s2244; s2224).
53
86 8190
117
97102
115
0
20
40
60
80
100
120
num
ber o
f tra
ject
orie
s
a-2 a-3 a-4 a-5 a-6 a-7 a-8 a-9
Length
Growt h t ra ject ories of firm dist ribu t ion by t ra ject ory len gh t
Fig.9 : Structure of states sequences by length
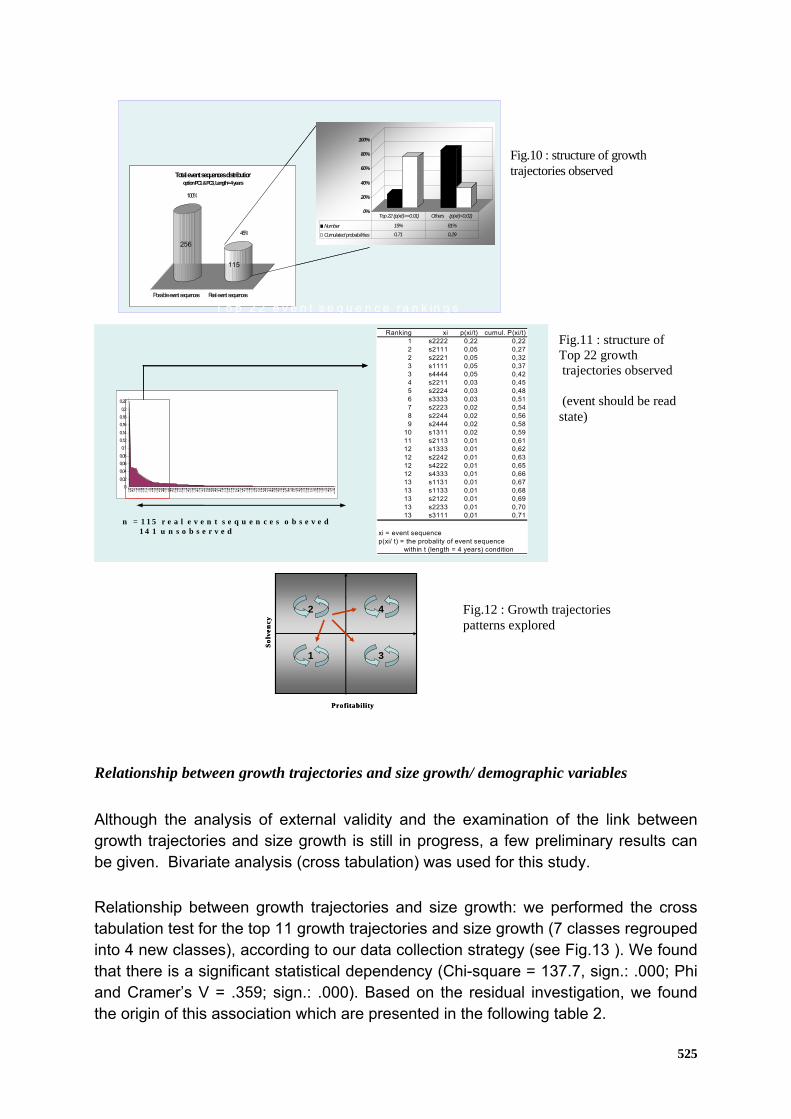
525
Relationship between growth trajectories and size growth/ demographic variables
Although the analysis of external validity and the examination of the link between growth trajectories and size growth is still in progress, a few preliminary results can be given. Bivariate analysis (cross tabulation) was used for this study.
Relationship between growth trajectories and size growth: we performed the cross tabulation test for the top 11 growth trajectories and size growth (7 classes regrouped into 4 new classes), according to our data collection strategy (see Fig.13 ). We found that there is a significant statistical dependency (Chi-square = 137.7, sign.: .000; Phi and Cramer’s V = .359; sign.: .000). Based on the residual investigation, we found the origin of this association which are presented in the following table 2.
100%
45%
Possible event sequences Real event sequences
Total event sequences distributionoption PC1 & PC3, Length= 4 years
256
115
100%
45%
Possible event sequences Real event sequences
Total event sequences distributionoption PC1 & PC3, Length= 4 years
256
115
0%
20%
40%
60%
80%
100%
Number 19% 81%
Cumulated probabilities 0,71 0,29
Top 22 (p(xit)>=0,01) Others (p(xit)<0,01)
T o p 2 2 e v e n t s e q u e n c e r a n k in g s
Ranking xi p(xi/t) cumul. P(xi/t)1 s2222 0,22 0,222 s2111 0,05 0,272 s2221 0,05 0,323 s1111 0,05 0,373 s4444 0,05 0,424 s2211 0,03 0,455 s2224 0,03 0,486 s3333 0,03 0,517 s2223 0,02 0,548 s2244 0,02 0,569 s2444 0,02 0,58
10 s1311 0,02 0,5911 s2113 0,01 0,6112 s1333 0,01 0,6212 s2242 0,01 0,6312 s4222 0,01 0,6512 s4333 0,01 0,6613 s1131 0,01 0,6713 s1133 0,01 0,6813 s2122 0,01 0,6913 s2233 0,01 0,7013 s3111 0,01 0,71
xi = event sequencep(xi/ t) = the probality of event sequence within t (length = 4 years) condition
00,02
0,040,060,08
0,10,120,14
0,160,180,2
0,22
00,02
0,040,060,08
0,10,120,14
0,160,180,2
0,22
n = 1 1 5 r e a l e v e n t s e q u e n c e s o b s e v e d1 4 1 u n s o b s e r v e d
31
42
Profitability
So
lve
ncy
31
42
Profitability
So
lve
ncy
Fig.12 : Growth trajectories patterns explored
Fig.11 : structure of Top 22 growth trajectories observed (event should be read state)
Fig.10 : structure of growth trajectories observed

526
Table 2: origin of association matrix
Figure 13: This figure show the 7 possible forms of size growth used to select our original data
• External validity: we performed the cross tabulation test between the top 11 growth trajectories and the following variables: General sector (in 4 classes), Legal form (5 classes regrouped into 3 new classes) and Ownership (4 classes regrouped into 2 new classes). We found a significant statistical dependency only for General sector variable (Chi-square = 37.3, sign.: .116; Phi and Cramer’s V = .189; sign.: .116). Based on the residual investigation, we found the origin of this association which are presented in the following table 3
Top 11 Growth trajectories
Employment Sales Total assets
Others
s2222 xxx xxx xxx s2111 xxx xxx s2221 xxx xxx s1111 xxx xxx s4444 xxx xxx s2211 xxx xxx s2224 xxx xxx s3333 xxx s2223 xxx s2244 s2444 xxx
2
4
3 6
5
7
Employment
Assets Sales

527
Table 3: origin of association matrix
5. Implication, conclusions and further work
Although new firm growth is essential for the foundations of economic dynamism, little evidence is available about the growth trajectories of firms and research in this field needs a sound conceptual base that calls for new methods. However, a longitudinal study of firm growth process based on multidimensional approach is a challenge.
We propose an alternative method that can accommodate, in a systematic way, the analysis of new firm growth over time based on a multidimensional approach. Based on our preliminary results, empirical evidence shows that new firm growth paths are neither linear nor random phenomenon. Moreover, while the strategy of growth of promising firm remains very heterogeneous, our approach allows us to develop 7 stable clusters of growth trajectories based on four states of which three are stables. Finally, these distinct growth trajectories patterns are influenced both by demographic affiliation and the strategic choices of the firms.
However, it is worth noting that these results are partial and a deeper analysis is in progress. Clearly, we will concentrate on the characterisation of both state patterns and the 7 stable clusters. Investigation of connections between growth trajectories and others firm resources (like intangible assets) will be set up and performed.
While our findings provide, in advance, empirical support and methodological sound in new firm growth research, it is highly relevant to further our final results by examining the relationship between innovative and technological sources and growth trajectories in high vs. low technological industry. Moreover, this relationship controlled by environment characteristics will add knowledge to our understanding of a new firm growth process.
Top 11 Growth trajectories
Construction Manufacturing Service Fishing
s2222 s2111 XXX s2221 XXX s1111 s4444 XXX s2211 s2224 XXX s3333 s2223 s2244 s2444

528
6. References
Audrestch, D.B. and Thurik, A.R. (2000) Capitalism and democracy in the 21st Century: from the managed to the entrepreneurial economy. Journal of Evolutionary Econmics 10, pp. 17-34.
Aldrich, H. 1990. Using an ecological perspective to study organizational founding dates. Entrepreneurship Theory and Practice Spring: 7-24.
Bakerman, R., and Gottman, J. M. (1986). Observing interaction: An introduction to sequential analysis. Cambridge: Cambridge University Press.
Baldwin, J.R., C. Chandler et T. Papailiadis 1994. Stratégies pour le succès. Le profil des PME en croissance au Canada, Ottawa. Statistique Canada, n° 61-523ER.
Barney, J., 1991. Firm resources and sustained competitive advantage. Journal of Management, 17, 99–119.
Biga D.M., Gailly B., François D., Verleysen M., Wertz V. (2005) "The Growth Trajectories of Start-Up Firms: An Exploratory Study" CRECIS- Louvain School working paper series.
Birch, D. 1981. Who creates jobs?. The public Interest 65
Birch, D., A. Haggetty, et W. Parsons, 1997. Corporate Almanac, Cambridge (Mass.), Cognetic Inc.
Birley, S., and Westhead, P. 1990. Growth and Performance Contrasts Between ‘Types’ of Small Firms. Strategic Management Journal, 2: 535–557.
Boeker, W. 1997. Strategic change: The influence of managerial characteristics and organizational growth. Academy of Management Journal, 40 (1): 152-170.
Busenitz, L.W., West, P., Shepherd, D., Nelson, T., Zacharakis, A., and Chandler, G. 2003. Entrepreneurship in emergence: Past trends and future directions. Journal of Management, 29(3): 285-308.
Calvo, J. L., et M. J. Lorenzo 2001. Une caractérisation des entreprises manufacturières espagnoles à forte croissance: 1994-1998. Revue Internationale P.M.E., vol. 14, n°s 3-4.
Canals, J. 2000. Managing Corporate Growth. New York: Oxford University Press.
Chandler, G. N., & Lyon, D. W. (2001). Issues of Research Design and Construct Measurement in Entrepreneurship Research: the Past Decade. Entrepreneurship Theory and Practice, 25(4), 101-113.
Chandler, G. N., and Hanks, S. H. 1993. “Measuring Performance of Emerging Businesses.” Journal of Business Venturing, 8: 32–40.
Cooper, A.C. and Folta, T.B. (2000) Entrepreneurship and High-Technology Clusters. In: Sexton, D.L. and Landström, H. (eds) The Blackwell Handbook of Entrepreneurship, pp. 348-367. Oxford: Blackwell.
Davidson, P. 1995. SMEs and job creation in Sweden, Communication présentée au séminaire OCDE sur "les PME: l'empoi, l'innovation et la croissance." Washington, D.C.
Davidsson, P., & Wiklund, J. (2000). Conceptual and empirical challenges in the study of firm growth. In D. Sexton & H. Landström (Eds.), The Blackwell Handbook of Entrepreneurship. Oxford, MA:: Blackwell Business.
Davidsson, P., 1989b. Entrepreneurship-and after? A study of growth willingness in small firms. Journal of Business Venturing 4, 211–226.

529
Davidsson, P., L. Lindmark et C. Olofsson 1998. The extent of overestimation of small firm job creation - an empirical examination of the regression bias. Small Business Economics, vol. 11.
Delmar, F. 1996. “Measuring Growth: Methodological Considerations and Empirical Results.” Paper presented at the RENT X, Brussels.
Delmar, F., 1997. Measuring growth: methodological considerations and empirical results. In: Donckels, R., Miettinen, A. (Eds.), Entrepreneurship and SME Research: On its Way to the Next Millennium, pp. 199–216.
Delmar, F., Davidsson, P., Gartner, W., 2003. Arriving at the high-growth firm. Journal of Business Venturing, 18: (2003) 189–216.
Delmar, F., P. Davidsson 1998. A Taxonomy of High-Growth Firms. Frontiers of Entrepreneurship Research. http://www.babson.edu/entrep/fer/papers98/XIV/XIV_A/XIV_A.html
Gailly B., François D., Biga D.M., Verleysen M., Wertz V." The Growth Trajectories of Start-Up Firms: An Exploratory Study" ESU 2004, European Summer University in Entrepreneurship, Twente (The Netherlands), 19-21 September 2004, pp. 1-16.
Garnsey, E. and Heffernan, P. (2005) "Growth setbacks in new firms." Futures, 37(7): 675-697
Garnsey, E., Stam, E. and Heffernan, P. (2006) New Firm Growth: Exploring processes and paths, Industry and Innovation 13.1, forthcoming.
George, P. Huber and A., H. Van de Ven (1995) Longitudinal field research methods: Studying processes of organisational change. Organization Sciences, Sage publications
Geroski, P A, 2001. "Exploring the Niche Overlaps between Organizational Ecology and Industrial Economics," Industrial and Corporate Change, Oxford University Press, vol. 10(2), pages 507-40.
Julien, P.-A., P. Mustar, M.-F. Estimé 2001. Les PME à forte croissance: une comparaison internationale. Revue Internationale P.M.E., vol. 14, n°s 3-4.
Levie, J. 1997. Patterns of growth and performance: an empirical study of young growing ventures in France, Ireland and Scotland. Frontiers of Entrepreneurship Research.
http://www.babson.edu/entrep/fer/papers97/levie/levie.htm
Mata, J., 1994. Firm growth during infancy. Small Business Economics 6, 27–39.
Murphy, G.B., Trailer, J.W., Hill, R.C., 1996. Measuring performance in entrepreneurship. Journal of Business Research, 36, 15–23.
Mustar, P. 2001. Diversité et unité des entreprises à forte croissance du secteur manufacturier en France. Revue Internationale P.M.E., vol. 14, n°s 3-4.
OCDE 1994. The OCDE Jobs Study, Paris
OCDE 1998b. Technology, Productivity and Job Creation: Best Policy Practices, Paris.
OCDE 2002. High-Growth SMEs: Their Contribution to Employment and Their Characteristics, Paris
Penrose, E., 1959. The Theory of the Growth of the Firm. Oxford Univ. Press, Oxford.
Pettigrew A.M., Woodman R.W., Cameron K.S., “Studying Organizational Change and Development: Challenges for Future Research”, Academy of Management Journal, vol.44, N°4, 2001, p.697-713.

530
Poole M. S., Van de Ven A. H., Dooley K., Holmes M. E. (2000) Organisational Change and Innovation Process: Theory and Methods for Research. (eds) Oxford University Press
Schreyer, P., 1999. High growth firms and employment. DSTI/INT/PME (99) 6. OECD Working Party on SMEs, Paris.
Siegel, R., Siegel, E., MacMillan, I.C., 1993. Characteristics distinguishing high-growth ventures. Journal of Business Venturing, 8, 169–180.
Singh, J., Lumsden, C. 1990. Theory and research in organizational ecology. Annual Review of Sociology, 16: 161-195.
Stam, E. (2003), Why Butterflies don’t Leave. Locational Evolution of Evolving Enterprises. Utrecht: Utrecht University (PhD thesis).
Stam, E. and Garnsey, E. (2006) New Firms Evolving in the Knowledge Economy; Problems and solutions around turning points. In: Dolfsma, W. and Soete, L. (eds.), Understanding the Dynamics of a Knowledge Economy, Cheltenham, Edward Elgar. In press
Storey, D. 1994. Understanding the small business sector. Londres, Routledge.
Storey, D.J., 1995. Symposium on Harrison’s ‘‘Lean and mean’’: a job generation perspective. Small Business Economics 7 (5), 5–8.
Teece, D. J., Pisano, G., Shuen, A. 1997. Dynamic capabilities and strategic management. Strategic Management Journal, 18(7): 509-533.
Vyakarnam, S., R. C. Jacobs, J. Handelberg 1997. Formation and development of entrepreneurial teams in rapid growth businesses. Frontiers of Entrepreneurship Research.
http://www.babson.edu/entrep/fer/papers97/sum97/vya.htm
Wagner, J., 1992. Firm size, firm growth and persistence of chance. Testing GIBRAT’s law with establishment data from Lower Saxony, 1978–1989. Small Business Economics 4, 125–131.
Weinzimmer, L.G., Nystron, P.C., Freeman, S.J., 1998. Measuring organizational growth: issues, consequences and guidelines. Journal of Management. 24 (2), 235–262.
Welbourne, T.M., 1997. Valuing employees: a success strategy for fast growth firms and fast paced individuals. In: Reynolds, P.D., Bygrave, W.D., Davidsson, P., Gartner, W.B., Mason, C.M., McDougall, P.P. (Eds.), Frontiers of Entrepreneurship Research. Center for Entrepreneurship Research, Babson Park, MA, pp. 17–31.
Wernerfelt, B. 1984. A resource-based view of the firm. Strategic Management Journal, 5: 171-181.
Wiklund, J., 1999. The sustainability of the entrepreneurial orientation-performance relationship. Entrepreneurship Theory and Practice, 24, 1, 37-48.
Woywod, M., et V. Lessat 2001. Les facteurs de succès des entreprises à croissance rapide en Allemagne. Revue Internationale P.M.E., vol. 14, n°s 3-4.
Zahra, S. A., Ireland, R. D., Hitt, M. A. 2000. International expansion by new venture firms: International diversity, mode of market entry, technological learning, and performance. Academy of Management Journal, 43(5): 925-950.