6. correlation of high-resolution seismic data with …
TRANSCRIPT

Kroon, D., Zachos, J.C., and Richter, C. (Eds.)Proceedings of the Ocean Drilling Program, Scientific Results Volume 208
6. CORRELATION OF HIGH-RESOLUTION SEISMIC DATA WITH ODP LEG 208 BOREHOLE MEASUREMENTS1
Thomas Bartels,2 Sebastian Krastel,2 and Volkhard Spiess2
ABSTRACT
Walvis Ridge, located in the eastern South Atlantic Ocean, is one ofthe few known locations where it is possible to recover undisturbed,complete, and possibly expanded Paleogene sediments over a widerange of water depths. The main objective of Ocean Drilling Program(ODP) Leg 208, realized on outer Walvis Ridge in the summer of 2003,was recovery of intact composite sequences of “critical” transitions likethe Cretaceous/Tertiary (K/T) boundary, Eocene/Oligocene (E/O)boundary, Paleocene/Eocene Thermal Maximum (PETM), and the Elmoevent.
Meteor Cruise M49/1, in early 2001, was the main seismic presite sur-vey for Leg 208. The high-resolution multichannel seismic system ofthe University of Bremen was used to identify drill sites at outer WalvisRidge that promised recovery of undisturbed, complete, and possiblyexpanded Cenozoic sequences. Based on these new seismic data, sixsites were drilled at water depths between 2500 and 4755 m on thenortheastern flank of Walvis Ridge during Leg 208.
To ground truth the seismic record, synthetic seismograms were cal-culated from closely spaced core logging density measurements of Leg208 cores. The high quality of both seismic and core logging data allowsgood correlation between synthetic seismograms and recorded seismicdata. These results allow identification and characterization of target re-flection horizons like the E/O boundary, Elmo horizon, PETM, and K/Tboundary in seismic images and dating of individual reflectors.
Total sediment thickness in the survey area varies between 200 and530 m, and the study area can be separated into three zones that have
1Bartels, T., Krastel, S., and Spiess, V., 2007. Correlation of high-resolution seismic data with ODP Leg 208 borehole measurements. In Kroon, D., Zachos, J.C., and Richter, C. (Eds.), Proc. ODP, Sci. Results, 208: College Station, TX (Ocean Drilling Program), 1–27. doi:10.2973/odp.proc.sr.208.204.20072Department of Geosciences, University Bremen, PO Box 330440, D-288334 Bremen, Germany. Correspondence author: [email protected]
Initial receipt: 5 September 2005Acceptance: 28 February 2007Web publication: 17 April 2007Ms 208SR-204

T. BARTELS ET AL.HIGH-RESOLUTION SEISMIC DATA 2
different deposition conditions. In general, seismic data show a de-crease in total sediment thickness with increasing distance from theridge crest, but lateral variations in sedimentation rates were foundacross the entire survey area. Especially close to the crest of the ridge,these lateral variations in sedimentation rates might indicate the influ-ence of bottom water currents on sedimentation at the outer WalvisRidge.
INTRODUCTION
Walvis Ridge is a northeast-southwest–trending aseismic ridge thateffectively divides the eastern South Atlantic Ocean into two basins:Angola Basin to the north and Cape Basin to the south (Fig. F1). Theridge consists of a series of interconnected crustal blocks that slopegradually toward the northwest and more steeply toward the southeast.Magnetic and gravity anomalies indicate that the ridge was formed byhotspot volcanism near the mid-ocean ridge as the basin gradually wid-ened (Rabinowitz and Simpson, 1984). Walvis Ridge is well known as anearly impassable barrier for bottom waters (Arhan et al., 2003). Pelagicsediments drape most of the ridge and generally increase in thicknesstoward the continental margin (Moore, Rabinowitz, et al., 1984). It isassumed that the ridge followed a simple thermal subsidence of ~1.1km since the Maastrichtian (Moore, Rabinowitz, et al., 1984).
The thickness of pelagic sediments varies from ~200 m on the deep(>4.5 km) seafloor adjacent to the ridge to ~530 m near the summit(~2.5 km). These sediments are primarily calcareous oozes and chalksthat range in age from Campanian to Holocene. In the Neogene sec-tion, nannofossil and foraminiferal nannofossil oozes with relativelyhigh carbonate contents of as much as 90 wt% were found. The lowerto middle Miocene sections are characterized by lower carbonate valuesbetween 0 and 20 wt%. Some intercalated slumps and turbidites wereidentified in Neogene deposits. Paleogene sediments are dominated bynannofossil- and foraminifer-bearing nannofossil oozes to chalk. Thesediments have high carbonate contents, up to 80 wt%, through mostof the Paleocene, Eocene, and Oligocene. Some smaller carbonate-poorintervals indicate episodes of carbonate compensation depth (CCD)shoaling (Zachos, Kroon, Blum, et al., 2004).
In spring 2003, six sites were drilled on outer Walvis Ridge duringOcean Drilling Program (ODP) Leg 208. The main objectives of Leg 208were to analyze extreme climatic conditions in the Paleogene, date andutilize astronomical cycles, and reconstruct the eastern equatorial pale-oceanographic development. Meteor Cruise M49/1 in early 2001 acted asmain seismic presite survey for Leg 208 to optimize drill site locations.
To ground truth seismic records and to construct a more precise seis-mic stratigraphy, it is possible to correlate seismic records with well datafrom a nearby drill site by modeling reflection patterns. This was ac-complished by visual correlation of seismic traces with synthetic seis-mograms, calculated from drill site density and velocity measurements(e.g., Zühlsdorff and Spiess, 2001; White and Hu, 1998). The best resultsare commonly achieved when downhole logging data from near-verti-cal wells are available (White and Hu, 1998), but if, as in this study, nodownhole velocity log exists, it is possible to estimate sonic data fromdensity logs (e.g., Adcock, 1993; Zühlsdorff and Spiess, 2001). Thereforevelocity and density profiles were constructed from measurements onrock samples or from core logging data as provided by the gamma ray
0° 1°E 2° 3° 4°
29°
28°
27°S
0 50
km
GeoB01-030
GeoB
01-031
GeoB01-032
GeoB01-034
GeoB01-035
Geo
B01
-037
GeoB01-038
GeoB01-036
GeoB01-41
Geo
B01-
42
GeoB01-43 Site 1264Site 1263
Site 1267
Site 1262
GeoB01-068
526
529
525
Leg 208ODP/DSDP
527
m491
5°W 5°E 15° 25°
35°
30°
25°
20°S
Angola Basin
Cape Basin
Africa
Wav
is Ridg
e
Zone 1
Zone 2
Zone 3
GeoB01-61
GeoB01
-048
Geo
B01
-067
Site 1265
GeoB
01-033
GeoB01-040
Seismic Profile M49/1
Seismic profile (figured)
Channel (Zone 2)
Wat
er d
epth
(m
)
GeoB01
-044Site 1266
Geo
B01-0
39
GeoB01-46528
m49
1
m491m491
6000
5000
4000
3000
2000
1000
0
F1. Seismic presite survey, p. 13.
T. BARTELS ET AL.HIGH-RESOLUTION SEISMIC DATA 3
attenuation (GRA) densitometer and the P-wave logger (PWL). Correla-tion of seismic data collected during Meteor Cruise M49/1 and core log-ging data measured during Leg 208 is a very promising approachbecause of the high quality of both data sets. In this paper we presentseismic data from the presite survey collected during Meteor CruiseM49/1 and identify the target horizons of Leg 208 sites using syntheticseismograms. Using the stratigraphy of Leg 208 cores (Shipboard Scien-tific Party, 2003), this method permits assignment of ages to individualreflectors and characterization of the seismic signature of target hori-zons. Seismic data will also be used for a first investigation of sedimen-tary features at outer Walvis Ridge.
DATA AND METHODS
Seismic Data
Meteor Cruise M 49/1 in early 2001 from Cape Town (South Africa) toMontevideo (Uruguay) was the main presite survey for Leg 208. Themain objectives were to collect high-resolution seismic reflection pro-files to identify drill sites that promise recovery of undisturbed, com-plete, and possibly expanded Paleogene sequences in different waterdepths. Seismic profiles with a total length of ~1800 were acquired inthe study area in water depths between ~2.5 and 4.5 km (Fig. F1).
The multichannel seismic system of the University of Bremen is spe-cifically designed to collect seismic data with high lateral and verticalresolution. The alternating operation of a small-chamber water gun(0.16 L; 200–1600 Hz), a generator-injector (GI) gun with reducedchamber volume (0.4 L; 100–500 Hz), and a GI gun with normal cham-ber volume (1.7 L; 30–200 Hz) yielded three seismic data sets simulta-neously. For recording of the GI gun and water gun data, a 96-channelSyntron streamer 600 m in length and equipped with separately pro-grammable hydrophone groups was used. In this manuscript, we willonly present GI gun data. A total of 48 channels consisting of 13 hydro-phones each, a group length of 6.25 m, and a group distance of 12.5 mwere used for recording GI gun data. The shot interval was 9 s, resultingin a shot distance of ~25 m when sailing with an average speed of 6 kt.Ten birds kept the streamer at a constant water depth of ~3 m below thesea surface within a range of 1 m. A magnetic compass at every bird al-lowed determination of hydrophone group position relative to theship’s course. GI gun data were digitally recorded at a sampling fre-quency of 4 kHz over a record length of 3000 ms. Positioning was basedon Global Positioning System (GPS). For processing of seismic data acombination of in-house and commercial (Vista) software (Seismic Im-age Software LTD) was used. Standard seismic processing proceduresemployed included trace editing, setting up geometry, static and delaycorrections, velocity analysis, normal move-out (NMO) corrections,bandpass frequency filtering, stacking, and time migration. A commonmidpoint (CMP) distance of 10 m was chosen for processing.
Calculation of Synthetic Seismograms
The reflection coefficient (R) between media of densities ρ1 and ρ2
and velocities v1 and v2 is given for vertical incidence waves by the Zoe-pritz equation:

T. BARTELS ET AL.HIGH-RESOLUTION SEISMIC DATA 4
R = [(ρ1 · v1) – (ρ2 · v2)]/[(ρ1 · v1) + (ρ2 · v2)].
The sequence of velocity and density changes with depth below the sea-floor is referred to as Earth’s reflection coefficient series. This series canbe transformed into two-way traveltime (TWT) scale using velocitymeasurements. The synthetic seismogram can be calculated by mathe-matically convolving this series with the seismic wavelet. The impulseresponse function for seismic modeling was computed using the statespace approach (Mendel et al., 1979), which also takes all possible inter-nal reflections into account. By comparing reflectors in the syntheticseismogram with core density measurements, it is possible to assign re-flectors to geologic events. The detailed procedure for calculating thesynthetic seismogram is described below.
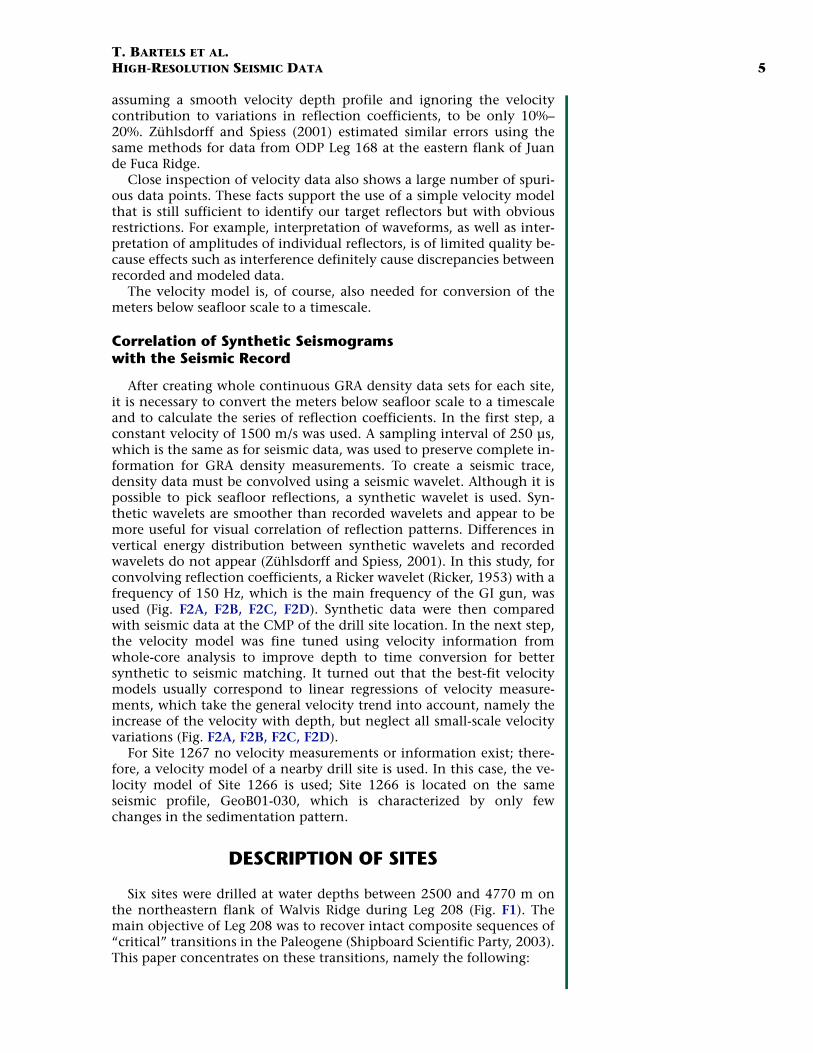
Editing of GRA Density Data
GRA density measurements with a sampling interval of 2 to 3 cm areavailable for all Leg 208 sites. All sites consist of two to four holes. As in-dividual holes usually do not recover the entire stratigraphy of a site, itis necessary to merge and edit the density data to create composite datasets for each site (Fig. F2A, F2B). This was done using stratigraphic tiepoints determined during the cruise (Shipboard Scientific Party, 2003).
After creating a composite data set for each site, a moving windowwith a length of 50 measured values was used to calculate a local aver-age density and to detect spurious density values, likely caused byvoids, cracks, or gas bubbles within the cores and at the ends of the coresections. These artifacts cause unrealistic values for reflection coeffi-cients and thus are replaced by the last density value accepted by themoving window. The criterion to replace was that a value should notdiffer more than four times the root mean square deviation of the win-dow. Furthermore, data gaps that could not be filled were linearly inter-polated to avoid unnatural reflection coefficients caused by small datagaps. A correction of the GRA density values to in situ conditions,which accounts for decrease in hydrostatic pressure, temperaturechange, and porosity rebound during core recovery (Hamilton, 1976),was not carried out because relative density variations especially for theupper 150 m of the sediment column will not be significantly changed(e.g., Mosher et al., 1993; Rohr and Gröschel-Becker, 1994).
P-Wave Velocity Models
Sampling intervals of whole-core velocity data sets are ~25 cm andmore, which is much larger than the sampling intervals of the GRAdensity measurements of Leg 208 cores (Shipboard Scientific Party,2003). This discrepancy makes it impossible to calculate reflection coef-ficients with a detailed velocity model. Additionally, detailed velocitymeasurements were not done at all depths of each site. Adventitious ve-locity data are less important for the calculation of reflection coeffi-cients because values scatter around a mean trend and variations inmarine surface sediments do not exceed 5% (e.g., Weber et al., 1997;Breitzke, 2000). In contrast, associated density variations within marinesurface sediments are usually >20% (e.g., Weber et al., 1997; Breitzke,2000). A careful analysis of velocity and GRA density measurementsshows a positive correlation of smaller velocity excursions and densityvariations. Therefore, the effect of the velocity data on the reflection co-efficient is small. We estimate the overall error, which is introduced by
Density (g/cm3) Velocity (m/s) Reflection coefficient Amplitude
Site 1262
Two-
way
trav
eltim
e (s
)
Dep
th (
mbs
f)
0
20
40
60
80
100
120
140
160
180
200
220
240
260
280
300
320
0.00
0.04
0.08
0.12
0.16
0.20
0.24
0.28
0.32
0.36
0.40
-1-1 1 11.5 2.0 1500 1600 1700 0 0
A
F2. Core data, p. 14.
T. BARTELS ET AL.HIGH-RESOLUTION SEISMIC DATA 5
assuming a smooth velocity depth profile and ignoring the velocitycontribution to variations in reflection coefficients, to be only 10%–20%. Zühlsdorff and Spiess (2001) estimated similar errors using thesame methods for data from ODP Leg 168 at the eastern flank of Juande Fuca Ridge.
Close inspection of velocity data also shows a large number of spuri-ous data points. These facts support the use of a simple velocity modelthat is still sufficient to identify our target reflectors but with obviousrestrictions. For example, interpretation of waveforms, as well as inter-pretation of amplitudes of individual reflectors, is of limited quality be-cause effects such as interference definitely cause discrepancies betweenrecorded and modeled data.
The velocity model is, of course, also needed for conversion of themeters below seafloor scale to a timescale.
Correlation of Synthetic Seismograms with the Seismic Record
After creating whole continuous GRA density data sets for each site,it is necessary to convert the meters below seafloor scale to a timescaleand to calculate the series of reflection coefficients. In the first step, aconstant velocity of 1500 m/s was used. A sampling interval of 250 µs,which is the same as for seismic data, was used to preserve complete in-formation for GRA density measurements. To create a seismic trace,density data must be convolved using a seismic wavelet. Although it ispossible to pick seafloor reflections, a synthetic wavelet is used. Syn-thetic wavelets are smoother than recorded wavelets and appear to bemore useful for visual correlation of reflection patterns. Differences invertical energy distribution between synthetic wavelets and recordedwavelets do not appear (Zühlsdorff and Spiess, 2001). In this study, forconvolving reflection coefficients, a Ricker wavelet (Ricker, 1953) with afrequency of 150 Hz, which is the main frequency of the GI gun, wasused (Fig. F2A, F2B, F2C, F2D). Synthetic data were then comparedwith seismic data at the CMP of the drill site location. In the next step,the velocity model was fine tuned using velocity information fromwhole-core analysis to improve depth to time conversion for bettersynthetic to seismic matching. It turned out that the best-fit velocitymodels usually correspond to linear regressions of velocity measure-ments, which take the general velocity trend into account, namely theincrease of the velocity with depth, but neglect all small-scale velocityvariations (Fig. F2A, F2B, F2C, F2D).
For Site 1267 no velocity measurements or information exist; there-fore, a velocity model of a nearby drill site is used. In this case, the ve-locity model of Site 1266 is used; Site 1266 is located on the sameseismic profile, GeoB01-030, which is characterized by only fewchanges in the sedimentation pattern.
DESCRIPTION OF SITES
Six sites were drilled at water depths between 2500 and 4770 m onthe northeastern flank of Walvis Ridge during Leg 208 (Fig. F1). Themain objective of Leg 208 was to recover intact composite sequences of“critical” transitions in the Paleogene (Shipboard Scientific Party, 2003).This paper concentrates on these transitions, namely the following:

T. BARTELS ET AL.HIGH-RESOLUTION SEISMIC DATA 6
1. Eocene/Oligocene (E/O) boundary (35.7 Ma): this sharp transi-tion is marked by a step increase in magnetic measurements anda step decrease in color lightness (Shipboard Scientific Party,2003).
2. Chron C24n Elmo event (53.2 Ma): this event is characterized bya drop in calcium carbonate content in the sediment (ScientificShipboard Party, 2003) and is characterized by a density contrastof ~10% in comparison to the surrounding sediments. The layerwas reached at five of the six sites and has a thickness of ~30 cm(Shipboard Scientific Party, 2003).
3. Paleocene/Eocene Thermal Maximum (PETM, 55 Ma): isotoperecords suggest that at ~55 Ma the deep ocean and high-latitudesurface waters warmed by 4°C and 8°C, respectively (e.g., Kaihoet al., 1996). The PETM at Leg 208 sites is a clay layer without car-bonate content. The thickness of the layer varies from 50 cm atthe deepest site to 80 cm at shallower sites. Like the Elmo hori-zon, the density of the PETM increases ~10% (Shipboard Scien-tific Party, 2003).
Additionally, it is possible to identify the Miocene Bolivina Acme event(18 Ma), which represents a foraminiferal assemblage dominated bysmall, smooth, thin-walled bolivinids (Smart and Murray, 1994), at allsites and the Cretaceous/Tertiary (K/T) boundary (66.4 Ma) at the twodeepest sites, Sites 1262 and 1267.
Identification of critical transitions on seismic data was done by cor-relating the synthetic seismograms. Figure F3 shows data examples forSites 1262, 1264 1266, and 1267. Because of the high quality of bothdata sets, the reflection patterns of the synthetic seismograms fit wellwith the seismic traces. This “event modeling” offers the possibility toassign characteristic layers of the drill sites to seismic reflectors. Thedepth values of the target horizons described below are calculated fromseismic traveltime, including the simplified linear velocity model usedfor calculation of synthetic seismograms. Scaling the resolution of thetop and base of the target horizons (such as the PETM and Elmo) on ameter to submeter scale is not possible with a GI gun (~150 Hz) as aseismic source. For this task a wavelet with a length not smaller thantwo times the thickness of the layer is needed (Badley, 1985). However,the fit of the reflection pattern, together with the knowledge of thephysical properties of each event (Scientific Shipboard Party, 2003), al-lows identification of seismic reflectors in which each event must be in-cluded. Because of changing density values (e.g., the increase of 10% forthe Elmo horizon and the PETM), those reflectors are mostly character-ized by stronger amplitudes.
Synthetic seismograms for Sites 1263 and 1265 are missing becauseof spurious data values in the GRA density values, where synthetic seis-mograms do not fit with the seismic data. Hence, identification of tar-get horizons at both sites is based on correlation between Leg 208 sitesby tracing the target horizons along the seismic profiles. Table T1 sum-marizes depths of the target horizons for each Leg 208 site.
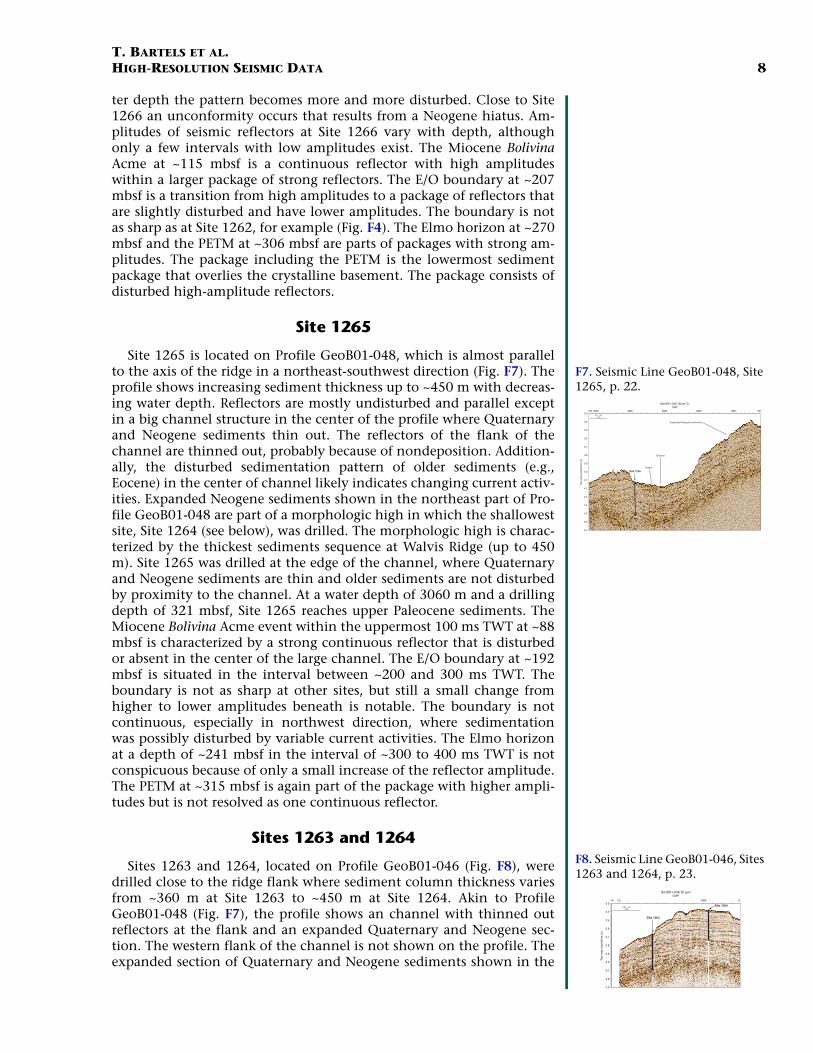
Site 1262
Site 1262 (Fig. F4), located on Profile GeoB01-035 at a water depth of~4755 m, is the deepest site of the drilling transect, situated at the edgeof Angola Basin. The seismic profile is characterized by an undulatingtopography with a number of sedimentary ridges located on top of
Site 1267 GI gun
Site 1267Water depth: 4355 mMax. penetration: 329 mbsf
2
3
4
5
1
5.00
5.10
5.20
5.30
5.40
5.50
5.60
Site 1266Water depth: 3798 mMax. penetration: 334 mbsf
1
2
3
4
Data gap
6.20
6.30
6.40
6.50
6.60
6.70
6.80
Two-
way
trav
eltim
e (s
)Tw
o-w
ay tr
avel
time
(s)
Site 1262Water depth: 4755 mMax. penetration: 209 mbsf
1
2
3
4
5
CMP
Site 1264Water depth: 2505 mMax. penetration: 283 mbsf
1
Site 1266 GI gun
CMP
Site 1264 GI gunSite 1262 GI gun
5.80
5.90
6.00
6.10
6.20
6.30
6.40
3.30
3.40
3.50
3.60
3.70
3.80
3.90
4800 4900 5000 510012750 12850 12950 13050CMPCMP
30002700 2800 2900 900 1000 1100 1200A B
C D
F3. Synthetic seismograms and seismic data, p. 18.
T1. Depth of target horizons, p. 27.
6.1
6.2
6.3
6.4
6.5
6.6
6.7
6.8
6.9
7.0
7.1
7.2
7.3
GeoB01-035
Two-
way
trav
eltim
e (s
)
CMP
V.E. = 345 km
Site 1262
BasinBasin Debris flow
Debris flow
Debris flow
1
3
4
2
5
2000300040005000W E
F4. Seismic Line GeoB01-035, Site 1262, p. 19.

T. BARTELS ET AL.HIGH-RESOLUTION SEISMIC DATA 7
basement highs and small sedimentary basins in between. Several de-bris flows and/or slumps were imaged as transparent zones in the sedi-mentary basins. Total sediment thickness is between 150 and 220 m(Fig. F4). Site 1262 is located in one of the small sedimentary basins.The upper ~100 ms TWT is characterized by continuous reflectors withhigh amplitudes. A debris flow or slump is located in this depth intervaldirectly west of the site. The upper ~100 ms TWT represents Neogeneand Eocene sediments. The Miocene Bolivina Acme event is found inthis interval at ~53 mbsf and can be characterized by a reflector withhigh amplitudes. At the depth of ~100 ms TWT, the seismic patternchanges with a clear decrease of amplitude at the E/O boundary at adepth of ~78 mbsf. Seismic data below ~100 ms TWT show interlayer-ing of weak and strong reflector packages, including the Elmo horizonand the PETM, down to the basement at ~300 ms TWT. Both clay layersare characterized by strong amplitudes. The Elmo horizon at ~115 mbsfappears as a single distinct continuous reflector, whereas the PETM at~139 mbsf appears as the first reflector of a package of several reflectorswith strong amplitudes. With a drilling depth of 209 mbsf it was possi-ble to recover all critical transitions, including the K/T boundary, whichis characterized by a strong amplitude reflection close to the crystallinebasement at a depth of ~195 mbsf.
Site 1267
Site 1267, located on Profile GeoB01-030, is situated close to the edgeof Angola Basin at a water depth of 4355 m (Fig. F5). The profile runsperpendicular to the ridge axis in a northwest-southeast direction. Sedi-ment thickness in the northwest part of the profile is ~340 m. Site 1267is located close to a basement high, which results in mostly parallel andundisturbed but inclined reflectors. Upper Maastrichtian sediments,which were the oldest sediments drilled during Leg 208, were reachedat a drilling depth of 329 mbsf. The interval 0–150 ms TWT consists ofQuaternary and Neogene sediments and includes a package of dis-turbed reflectors embedded with parallel reflectors with strong ampli-tudes. The Miocene Bolivina Acme is the first reflector of a package ofstronger reflectors at ~111 mbsf. The E/O boundary at ~128 mbsf is astrong continuous reflector. In contrast to Site 1262, underlying reflec-tors also show high amplitudes. The Elmo horizon at ~179 mbsf is char-acterized by a continuous distinct reflector with strong amplitudessurrounded by sediments with lower amplitudes. The PETM at ~231mbsf is embedded within a package of parallel reflectors with averageamplitudes. At Site 1267, the K/T boundary was reached at a drillingdepth of ~298 mbsf. The reflector representing the K/T boundary is lo-cated only ~30 m above the crystalline basement and shows strong am-plitudes. Because of the proximity of the K/T reflector to basement withits rough surface, the reflector is not continuous along the profile.
Site 1266
Site 1266, in a water depth of 3798 m, is also situated on ProfileGeoB01-30 at the flank of the ridge (Fig. F6). It reaches upper Paleocenesediments at a drill depth of 334 mbsf. Sediments of Profile GeoB01-030in the vicinity of Site 1266 along the flank of the ridge have a thicknessof ~370 m, which is only slightly more than those at Site 1267. Thenorthwest part of the profile is characterized by mostly undisturbed andparallel reflectors, but in the direction of the ridge with decreasing wa-
3000 4000 5000 6000 7000
5.7
5.8
5.9
6.0
6.1
6.2
6.3
6.4
6.5
6.6
Site 1267
GeoB01-030 (Zone 2)CMP
Two-
way
trav
eltim
e (s
)
10 kmV.E. = 44
1
2
4
5
3
NW SE
F5. Seismic Line GeoB01-030, Site 1267, p. 20.
Two-
way
trav
eltim
e (s
)
GeoB01-030 (Zone 2)CMP
10 km
Site 1266
V.E. = 35
1
2
3
4
Hiatus
11000 12000 13000 14000 15000NW SE
4.7
4.8
4.9
5.0
5.1
5.2
5.3
5.4
5.5
5.6
5.7
5.8
5.9
F6. Seismic Line GeoB01-030, Site 1266, p. 21.
T. BARTELS ET AL.HIGH-RESOLUTION SEISMIC DATA 8
ter depth the pattern becomes more and more disturbed. Close to Site1266 an unconformity occurs that results from a Neogene hiatus. Am-plitudes of seismic reflectors at Site 1266 vary with depth, althoughonly a few intervals with low amplitudes exist. The Miocene BolivinaAcme at ~115 mbsf is a continuous reflector with high amplitudeswithin a larger package of strong reflectors. The E/O boundary at ~207mbsf is a transition from high amplitudes to a package of reflectors thatare slightly disturbed and have lower amplitudes. The boundary is notas sharp as at Site 1262, for example (Fig. F4). The Elmo horizon at ~270mbsf and the PETM at ~306 mbsf are parts of packages with strong am-plitudes. The package including the PETM is the lowermost sedimentpackage that overlies the crystalline basement. The package consists ofdisturbed high-amplitude reflectors.
Site 1265
Site 1265 is located on Profile GeoB01-048, which is almost parallelto the axis of the ridge in a northeast-southwest direction (Fig. F7). Theprofile shows increasing sediment thickness up to ~450 m with decreas-ing water depth. Reflectors are mostly undisturbed and parallel exceptin a big channel structure in the center of the profile where Quaternaryand Neogene sediments thin out. The reflectors of the flank of thechannel are thinned out, probably because of nondeposition. Addition-ally, the disturbed sedimentation pattern of older sediments (e.g.,Eocene) in the center of channel likely indicates changing current activ-ities. Expanded Neogene sediments shown in the northeast part of Pro-file GeoB01-048 are part of a morphologic high in which the shallowestsite, Site 1264 (see below), was drilled. The morphologic high is charac-terized by the thickest sediments sequence at Walvis Ridge (up to 450m). Site 1265 was drilled at the edge of the channel, where Quaternaryand Neogene sediments are thin and older sediments are not disturbedby proximity to the channel. At a water depth of 3060 m and a drillingdepth of 321 mbsf, Site 1265 reaches upper Paleocene sediments. TheMiocene Bolivina Acme event within the uppermost 100 ms TWT at ~88mbsf is characterized by a strong continuous reflector that is disturbedor absent in the center of the large channel. The E/O boundary at ~192mbsf is situated in the interval between ~200 and 300 ms TWT. Theboundary is not as sharp at other sites, but still a small change fromhigher to lower amplitudes beneath is notable. The boundary is notcontinuous, especially in northwest direction, where sedimentationwas possibly disturbed by variable current activities. The Elmo horizonat a depth of ~241 mbsf in the interval of ~300 to 400 ms TWT is notconspicuous because of only a small increase of the reflector amplitude.The PETM at ~315 mbsf is again part of the package with higher ampli-tudes but is not resolved as one continuous reflector.
Sites 1263 and 1264
Sites 1263 and 1264, located on Profile GeoB01-046 (Fig. F8), weredrilled close to the ridge flank where sediment column thickness variesfrom ~360 m at Site 1263 to ~450 m at Site 1264. Akin to ProfileGeoB01-048 (Fig. F7), the profile shows an channel with thinned outreflectors at the flank and an expanded Quaternary and Neogene sec-tion. The western flank of the channel is not shown on the profile. Theexpanded section of Quaternary and Neogene sediments shown in the
3.3
3.4
3.5
3.6
3.7
3.8
3.9
4.0
4.1
4.2
4.3
4.4
4.5
4.6
4.7
GeoB01-048 (Zone 3)
Site 1265
CMP
Two-
way
trav
eltim
e (s
)
Channel
Expanded Neogene sediments
1
4
3
2
Hiatus
5 kmV.E. = 32
NE10002000300040005000SW
F7. Seismic Line GeoB01-048, Site 1265, p. 22.
CMPGeoB01-046 GI gun
3.3
3.4
3.5
3.6
3.7
3.8
3.9
4.0
4.1
4.2
4.3
Site 1264
Two-
way
trav
eltim
e (s
)
Site 1263
3 kmV.E. = 12
2
3
4
1
1
1.0 1000W E
F8. Seismic Line GeoB01-046, Sites 1263 and 1264, p. 23.

T. BARTELS ET AL.HIGH-RESOLUTION SEISMIC DATA 9
eastern part of Profile GeoB01-046 are part of the morphologic high,which also appears on Profile GeoB01-048.
Site 1263, at a water depth of 2717 m, was drilled into an apparentbottom water channel where Quaternary and Neogene sediments areabsent or thin and thus Paleogene sediments are shallow in depth. Theupper ~100 ms TWT represents thinned out Quaternary and Neogenesediment sequences. It includes the Miocene Bolivina Acme at ~44 mbsf,which appears as a continuous reflector with high amplitudes. The par-allel to subparallel reflectors below ~100 to ~300 ms TWT show highamplitudes and good continuity. At ~100 mbsf the E/O boundary ap-pears as a sequence of continuous reflectors with high amplitudes. Re-flectors below ~300 ms TWT start to undulate with depth. This unitshows varying amplitudes and includes the Elmo event as a strong re-flector at ~265 mbsf. The site reaches Paleocene sediments, includingthe PETM, which is surrounded by reflectors with high amplitudes at~335 mbsf.
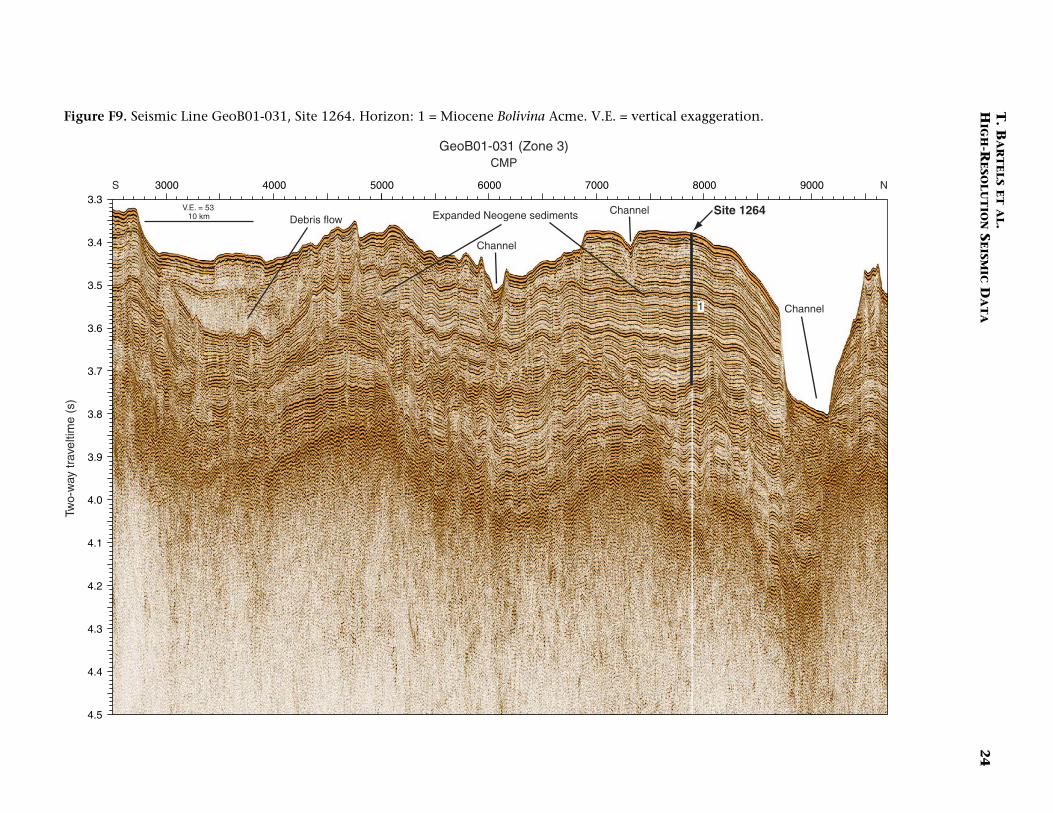
Site 1264 was drilled into an expanded section of Neogene sedimentson the morphologic high close to the ridge flank. The location of thesite is the crosspoint of Profiles GeoB01-046 (Fig. F8) and GeoB01-031(Fig. F9). The morphologic high, illustrated on both profiles, is charac-terized by parallel layered sediment sequences. The sediments are dis-turbed by a slump or debris flow deposition shown in the south ofProfile GeoB01-031 and smaller channels in the younger sediments inthe north of the profile.
Site 1264, in a water depth of 2505 m, reaches Oligocene sedimentsat 282 mbsf. The parallel layered sediments represent a high-resolutiondata set of Quaternary and Neogene sediments with a pattern of vary-ing strong and weak amplitudes in which the Miocene Bolivina Acmeappears at ~159 mbsf as a continuous reflector with strong amplitudes.
DISCUSSION
Seismic Characterization of Target Horizons
The main objective of the project is stratigraphy and correlation be-tween seismic and well data, which is based on pattern recognition of re-flector sequences in the first place. Identification of the critical transitionin the entire survey area is of great importance for this approach. Asdemonstrated above, we can identify the critical transitions in the seis-mic data at the locations of the Leg 208 drill sites, demonstrating thatour relatively simple event modeling is sufficient for this task. Seismiccharacteristics for each target horizon at Leg 208 drill sites were studied.
Miocene Bolivina Acme Event
The Miocene Bolivina Acme Event is a continuous reflector withstrong amplitudes within Neogene sediments. Depending on the thick-ness of the Neogene sequences, it is surrounded by sediments withlower amplitudes (Sites 1264 and 1265) or is part of a package withstrong amplitudes (Sites 1262, 1266, and 1267).
E/O Boundary
The E/O boundary in core samples is marked by a step increase inmagnetic susceptibility (Shipboard Scientific Party, 2003), which sug-
3000 4000 5000 6000 7000 8000 90003.3
3.4
3.5
3.6
3.7
3.8
3.9
4.0
4.1
4.2
4.3
4.4
4.5
Site 1264
Channel
Channel
Channel
10 km
GeoB01-031 (Zone 3)CMP
Two-
way
trav
eltim
e (s
)
V.E. = 53
1
Expanded Neogene sedimentsDebris flow
S N
F9. Seismic Line GeoB01-031, Site 1264, p. 24.
T. BARTELS ET AL.HIGH-RESOLUTION SEISMIC DATA 10
gests a change of the physical properties of the sediments. In seismicdata the E/O boundary is represented by a sharp transition from a pack-age of sediments imaged as reflectors with strong amplitudes to a pack-age of sediments imaged with lower amplitudes at all sites except at Site1266, where possibly synsedimentary slumping during the Oligocenedisturbed the sedimentation pattern.
Elmo Horizon
The Elmo horizon is represented as a strong, continuous, mostly iso-lated reflector surrounded by sediments with lower amplitudes. TheElmo horizon, which is characterized by a 30- to 50-cm-thick layer with10% higher density than the surrounding sediments, includes a drop incalcium carbonate content (Shipboard Scientific Party, 2003). It has astrong impedance contrast resulting in a continuous reflector with highamplitudes.
PETM
The PETM is also characterized by low carbonate content and 10%higher density. Because of a surrounding sediment with strong ampli-tudes, the 50- to 80-cm-thick clay layer (Shipboard Scientific Party,2003) cannot be resolved as an individual reflector with GI gun data.Therefore, the PETM is not imaged as an individual reflector, but sedi-ments at the depth of the PETM are characterized by strong amplitudesat all sites except for Site 1264, which was not drilled to PETM depth.
K/T Boundary
The K/T boundary at Sites 1262 and 1267 occurs as the first reflectorof a reflector package with strong amplitudes and a sharp transition im-mediately above basement. The basal contact of this clay layer is alsosharply defined by an increase the in magnetic susceptibility data.
Sedimentary Features on Outer Walvis Ridge
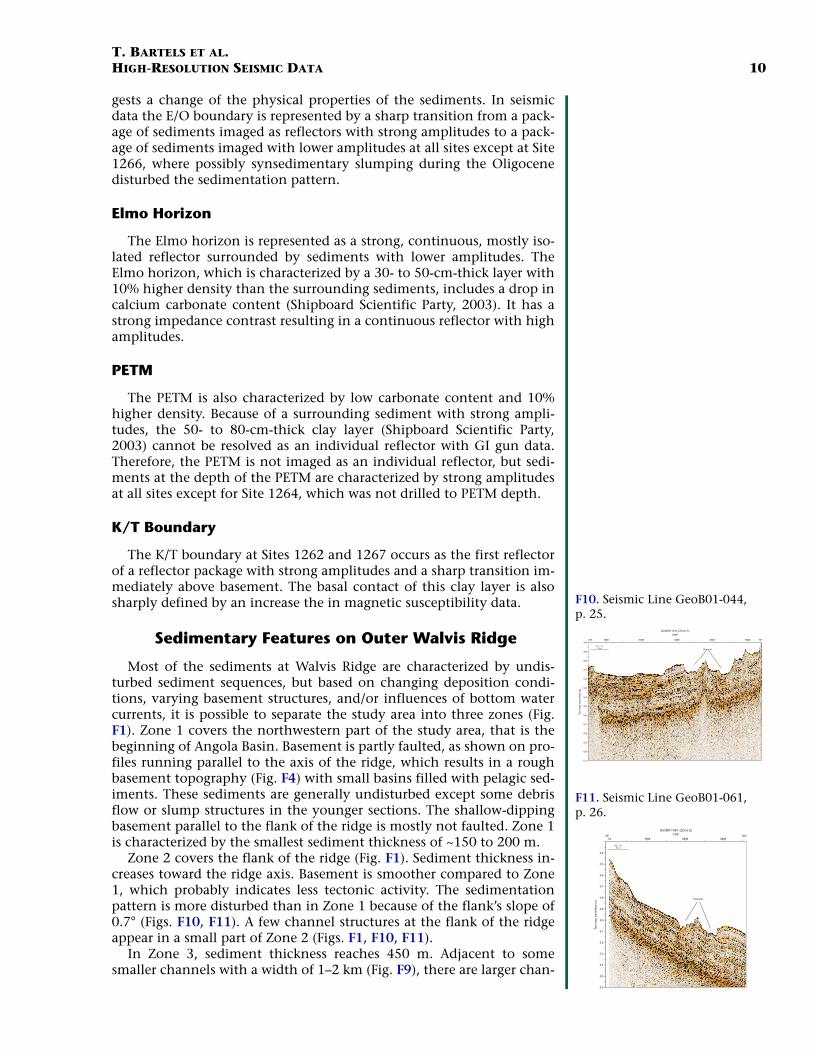
Most of the sediments at Walvis Ridge are characterized by undis-turbed sediment sequences, but based on changing deposition condi-tions, varying basement structures, and/or influences of bottom watercurrents, it is possible to separate the study area into three zones (Fig.F1). Zone 1 covers the northwestern part of the study area, that is thebeginning of Angola Basin. Basement is partly faulted, as shown on pro-files running parallel to the axis of the ridge, which results in a roughbasement topography (Fig. F4) with small basins filled with pelagic sed-iments. These sediments are generally undisturbed except some debrisflow or slump structures in the younger sections. The shallow-dippingbasement parallel to the flank of the ridge is mostly not faulted. Zone 1is characterized by the smallest sediment thickness of ~150 to 200 m.
Zone 2 covers the flank of the ridge (Fig. F1). Sediment thickness in-creases toward the ridge axis. Basement is smoother compared to Zone1, which probably indicates less tectonic activity. The sedimentationpattern is more disturbed than in Zone 1 because of the flank’s slope of0.7° (Figs. F10, F11). A few channel structures at the flank of the ridgeappear in a small part of Zone 2 (Figs. F1, F10, F11).
In Zone 3, sediment thickness reaches 450 m. Adjacent to somesmaller channels with a width of 1–2 km (Fig. F9), there are larger chan-
Two-
way
trav
eltim
e (s
)
Channel
V.E. = 355 km
GeoB01-044 (Zone 2)CMP
1000 2000 3000 4000 5000SW NE
4.9
5.0
5.1
5.2
5.3
5.4
5.5
5.6
5.7
5.8
5.9
6.0
6.1
4.8
F10. Seismic Line GeoB01-044, p. 25.
1.0 20001000 3000
4.5
4.4
4.6
4.7
4.8
4.9
5.0
5.1
5.2
5.3
5.4
5.5
5.6
CDP
Two-
way
trav
eltim
e (s
)
V.E. = 315 km
GeoB01-061 (Zone 2)
Channel
SE NW
F11. Seismic Line GeoB01-061, p. 26.
T. BARTELS ET AL.HIGH-RESOLUTION SEISMIC DATA 11
nel structures with widths up to some tens of kilometers, indicating alarge zone influenced by bottom water currents (Fig. F7). The thicknessof Neogene sediments is significantly decreased in this area, whereasolder sediment packages show a similar thickness as the surrounding ar-eas. Hence, confined bottom currents occurred mainly in the Neogene.These changing deposition conditions offered the possibility to drillSites 1263, 1264, and 1265 within a few kilometers with varying thick-ness of Neogene sediments (Figs. F7, F8, F9). No major faults were iden-tified along the axis of the ridge, suggesting a mostly undisturbedsedimentary sequence.
CONCLUSIONS
The collected seismic data from Meteor Expedition M49/1 are of highquality, allowing excellent site selection for Leg 208 drilling locations.Correlation of seismic data with borehole data was accomplished bycalculating synthetic seismograms using GRA density measurements ofthe cores and an averaged velocity model. This method allowed “sim-ple” event modeling to assign ages to the seismic reflectors and to iden-tify key horizons/boundaries like the E/O and the K/T boundaries or theMiocene Bolivina Acme, Elmo, and PETM horizons. Characteristics ofthese target horizons show similar properties at different sites, whichindicates the regional distribution of each.
Sediment thickness of the study area increases from Angola Basin(~150 m) to the axis of Walvis Ridge (~450 m). Because of the changingdeposition conditions, the Leg 208 study area is separated into threezones. Zone 1 is characterized by basement faulting that results in for-mation of a small basins at the beginning of Angola Basin. Basins arefilled up with mostly undisturbed pelagic sediments, whereas youngersediments in these basins partly constitute debris flow or slump depos-its. Zone 2 on the flank of the ridge is characterized by an increasingsediment thickness and an area with several smaller channel structuresindicating bottom water currents. Zone 3, at the axis of the ridge, showsthe most varying sedimentation pattern. Among some expanded Neo-gene and Quaternary sections with the largest sediment thickness ofthe study area, several erosive channels of variable width occur, suggest-ing strong bottom current activities.
ACKNOWLEDGMENTS
We are grateful for the support of the captain and the crew membersas well as all cruise members of Meteor Cruise M49/1 for their help dur-ing the expedition. We also want to thank the Scientific ShipboardParty of the ODP Leg 208, who did a great job, especially Jim Zachos forhis comments and help during this study. This research used samplesand/or data provided by the Ocean Drilling Program (ODP). ODP isfunded by the U.S. National Science Foundation (NSF) and participat-ing countries under management of Joint Oceanographic Institutions(JOI), Inc. This research was funded by Deutsche Forschungs Gemein-schaft, Grant Sp 296/24-1, “Sedimentation processes on Walvis Ridge—correlation of high resolution seismic records with ODP Leg 208 physi-cal properties data.”
T. BARTELS ET AL.HIGH-RESOLUTION SEISMIC DATA 12
REFERENCES
Adcock, S., 1993. In search of the well tie: what if I don’t have a sonic log? LeadingEdge, 12(12):1161–1164. doi:10.1190/1.1436929
Arhan, M., Mercier, H., and Park, Y.-H., 2003. On the deep water circulation of theeastern South Atlantic Ocean. Deep-Sea Res., Part I, 50(7):889–916. doi:10.1016/S0967-0637(03)00072-4
Badley, M.E., 1985. Practical Seismic Interpretation: Englewood Cliffs, NJ (PrenticeHall).
Breitzke, M., 2000. Physical properties of marine sediments. In Schulz, H.D., andZabel, M. (Eds.), Marine Geochemistry: Berlin (Springer Verlag), 29–72.
Hamilton, E.L., 1976. Variations of density and porosity with depth in deep sea sedi-ments. J. Sediment. Petrol., 46:280–300.
Kaiho, K., Arinobu, T., Ishiwatari, R., Morgans, H.E.G., Okada, H., Takeda, N., Tazaki,K., Zhou, G., Kajiwara, Y., Matsumoto, R., Hirai, A., Niitsuma, N., and Wada, H.,1996. Latest Paleocene benthic foraminiferal extinction and environmentalchanges at Tawanui, New Zealand. Paleoceanography, 11(4):447–466. doi:10.1029/96PA01021
Mendel, J.M., Nahi, N.E., and Chan, M., 1979. Synthetic seismograms using the state-space approach. Geophysics, 44(5):880–895. doi:10.1190/1.1440983
Moore, T.C., Jr., Rabinowitz, P.D., et al., 1984. Init. Repts. DSDP, 74: Washington, D.C.(U.S. Govt. Printing Office).
Mosher, D.C., Mayer, L.A., Shipley, T.H., Winterer, E.L., Hagen, R.A., Marsters, J.C.,Bassinot, F., Wilkens, R.H., and Lyle, M., 1993. Seismic stratigraphy of the OntongJava Plateau. In Berger, W.H., Kroenke, L.W., Mayer, L.A., et al., Proc. ODP, Sci.Results, 130: College Station, TX (Ocean Drilling Program), 33–49. doi:10.2973/odp.proc.sr.130.047.1993
Rabinowitz, P.D., and Simpson, E.S.W., 1984. Geophysical site survey results on theWalvis Ridge. In Moore, T.C., Jr., Rabinowitz, P.D., et al., Init. Repts. DSDP, 74:Washington (U.S. Government Printing Office), 795–825.
Ricker, N., 1953. The form and laws of propagation of seismic wavelets. Geophysics,18(1):10–40. doi:10.1190/1.1437843
Rohr, K.M.M., and Gröschel-Becker, H., 1994. Correlation of well logs, physical prop-erties, and surface seismic reflection data, Middle Valley, Juan de Fuca Ridge. InMottl, M.J., Davis, E.E., Fisher, A.T., and Slack, J.F. (Eds.), Proc. ODP, Sci. Results, 139:College Station, TX (Ocean Drilling Program), 585–596. doi:10.2973/odp.proc.sr.139.257.1994
Shipboard Scientific Party, 2003. Leg 208 Preliminary Report. ODP Prelim. Rpt., 108[Online]. Available from World Wide Web: <http://www-odp.tamu.edu/publica-tions/prelim/208_prel/208PREL.PDF>.
Smart, C.W., and Murray, J.W., 1994. An early Miocene Atlantic-wide foraminiferal/palaeoceanographic event. Palaeogeogr., Palaeoclimatol., Palaeoecol., 108(1–2):139–148. doi:10.1016/0031-0182(94)90026-4
Weber, M.E., Niessen, F., Kuhn, G., and Wiedicke, M., 1997. Calibration and applica-tion of marine sedimentary physical properties using a multi-sensor core logger.Mar. Geol., 136(3–4):151–172. doi:10.1016/S0025-3227(96)00071-0
White, R.E., and Hu, T., 1998. How accurate can a well tie be? Leading Edge,17(8):1065–1071. doi:10.1190/1.1438091
Zachos, J.C., Kroon, D., Blum, P., et al., 2004. Proc. ODP, Init. Repts., 208: College Sta-tion, TX (Ocean Drilling Program). doi:10.2973/odp.proc.ir.208.2004
Zühlsdorff, L., and Spiess, V., 2001. Modeling seismic reflection patterns from OceanDrilling Program Leg 168 core density logs: insight into lateral variations in physi-cal properties and sediment input at the eastern flank of the Juan de Fuca Ridge. J.Geophys. Res., 106(B8):16119–16134. doi:10.1029/2001JB900005
T. BARTELS ET AL.HIGH-RESOLUTION SEISMIC DATA 13
Figure F1. Seismic presite survey ODP Leg 208. ODP = Ocean Drilling Program, DSDP = Deep Sea DrillingProject.
0° 1°E 2° 3° 4°
29°
28°
27°S
0 50
km
GeoB01-030
GeoB
01-031
GeoB01-032
GeoB01-034
GeoB01-035
Geo
B01
-037
GeoB01-038
GeoB01-036
GeoB01-41
Geo
B01-
42
GeoB01-43 Site 1264Site 1263
Site 1267
Site 1262
GeoB01-068
526
529
525
Leg 208ODP/DSDP
527
m491
5°W 5°E 15° 25°
35°
30°
25°
20°S
Angola Basin
Cape Basin
Africa
Wav
is Ridg
e
Zone 1
Zone 2
Zone 3
GeoB01-61
GeoB01
-048
Geo
B01
-067
Site 1265
GeoB
01-033
GeoB01-040
Seismic Profile M49/1
Seismic profile (figured)
Channel (Zone 2)
Wat
er d
epth
(m
)
GeoB01
-044Site 1266
Geo
B01-0
39
GeoB01-46528
m49
1
m491m491
6000
5000
4000
3000
2000
1000
0

T. BARTELS ET AL.HIGH-RESOLUTION SEISMIC DATA 14
Figure F2. GRA density, velocity, reflection coefficients, and synthetic seismograms. A. Site 1262. GRA den-sity constructed using Splice Tables and data from Holes 1262A, 1262B, 1262C, and 1262D for A, Holes1264A, 1264B, and 1264C for B, Holes 1266A, 1266B and 1266C for C, and Holes 1267A and 1267B for D.Red line = regression line used for conversion from a depth scale to a timescale. Ricker wavelet with 150 Hzwas used for synthetic seismograms. (Continued on next three pages.)
Density (g/cm3) Velocity (m/s) Reflection coefficient Amplitude
Site 1262
Two-
way
trav
eltim
e (s
)
Dep
th (
mbs
f)
0
20
40
60
80
100
120
140
160
180
200
220
240
260
280
300
320
0.00
0.04
0.08
0.12
0.16
0.20
0.24
0.28
0.32
0.36
0.40
-1-1 1 11.5 2.0 1500 1600 1700 0 0
A

T. BARTELS ET AL.HIGH-RESOLUTION SEISMIC DATA 15
Figure F2 (continued). B. Site 1264. (Continued on next page.)
Density (g/cm3) Velocity (m/s) Reflection coefficient Amplitude
Site 1264
-1-1 1 11.5 2.0 1500 1600 1700 0 0
B
Two-
way
trav
eltim
e (s
)
0.00
0.04
0.08
0.12
0.16
0.20
0.24
0.28
0.32
0.36
0.40
Dep
th (
mbs
f)
0
20
40
60
80
100
120
140
160
180
200
220
240
260
280
300
320

T. BARTELS ET AL.HIGH-RESOLUTION SEISMIC DATA 16
Figure F2 (continued). C. Site 1266. (Continued on next page.)
Density (g/cm3) Velocity (m/s) Reflection coefficient Amplitude
Site 1266
-1-1 1 11.5 2.0 1500 1600 1700 0 0
C
Two-
way
trav
eltim
e (s
)
0.00
0.04
0.08
0.12
0.16
0.20
0.24
0.28
0.32
0.36
0.40
Dep
th (
mbs
f)
0
20
40
60
80
100
120
140
160
180
200
220
240
260
280
300
320

T. BARTELS ET AL.HIGH-RESOLUTION SEISMIC DATA 17
Figure F2 (continued). D. Site 1267.
Density (g/cm3) Reflection coefficient Amplitude
Site 1267
-1-1 1 11.5 2.0 0 0
DD
epth
(m
bsf)
0
20
40
60
80
100
120
140
160
180
200
220
240
260
280
300
320
Two-
way
trav
eltim
e (s
)
0.00
0.04
0.08
0.12
0.16
0.20
0.24
0.28
0.32
0.36
0.40
T. BARTELS ET AL.HIGH-RESOLUTION SEISMIC DATA 18
Figure F3. Correlation of synthetic seismograms with the seismic data for Sites (A) 1262, (B) 1264, (C) 1266,and (D) 1267. Horizons: 1 = Miocene Bolivina Acme, 2 = E/O boundary, 3 = Elmo horizon, 4 = PETM, 5 =K/T boundary. CMP = common midpoint, GI = generator injector.
Site 1267 GI gun
Site 1267Water depth: 4355 mMax. penetration: 329 mbsf
2
3
4
5
1
5.00
5.10
5.20
5.30
5.40
5.50
5.60
Site 1266Water depth: 3798 mMax. penetration: 334 mbsf
1
2
3
4
Data gap
6.20
6.30
6.40
6.50
6.60
6.70
6.80
Two-
way
trav
eltim
e (s
)Tw
o-w
ay tr
avel
time
(s)
Site 1262Water depth: 4755 mMax. penetration: 209 mbsf
1
2
3
4
5
CMP
Site 1264Water depth: 2505 mMax. penetration: 283 mbsf
1
Site 1266 GI gun
CMP
Site 1264 GI gunSite 1262 GI gun
5.80
5.90
6.00
6.10
6.20
6.30
6.40
3.30
3.40
3.50
3.60
3.70
3.80
3.90
4800 4900 5000 510012750 12850 12950 13050CMPCMP
30002700 2800 2900 900 1000 1100 1200A B
C D

T. B
AR
TE
LS E
T AL.
HIG
H-R
ESO
LU
TIO
N S
EISM
IC DA
TA
19
Figure mo horizon, 4 = PETM, 5 = K/Tbound
6.1
6.2
6.3
6.4
6.5
6.6
6.7
6.8
6.9
7.0
7.1
7.2
7.3
Two-
way
trav
eltim
e (s
)
E
F4. Seismic Line GeoB01-035, Site 1262. Horizons: 1 = Miocene Bolivina Acme, 2 = E/O boundary, 3 = Elary. V.E. = vertical exaggeration.
GeoB01-035
CMP
V.E. = 345 km
Site 1262
BasinBasin Debris flow
Debris flow
Debris flow
1
3
4
2
5
2000300040005000W

T. B
AR
TE
LS E
T AL.
HIG
H-R
ESO
LU
TIO
N S
EISM
IC DA
TA
20
Figure Elmo horizon, 4 = PETM, 5 = K/Tbound
7000
5.7
5.8
5.9
6.0
6.1
6.2
6.3
6.4
6.5
6.6
Two-
way
trav
eltim
e (s
)
SE
F5. Seismic Line GeoB01-030, Site 1267. Horizons: 1 = Miocene Bolivina Acme, 2 = E/O boundary, 3 =ary. V.E. = vertical exaggeration.
3000 4000 5000 6000
Site 1267
GeoB01-030 (Zone 2)CMP
10 kmV.E. = 44
1
2
4
5
3
NW

T. B
AR
TE
LS E
T AL.
HIG
H-R
ESO
LU
TIO
N S
EISM
IC DA
TA
21
Figure horizon, 4 = PETM. V.E. = verticalexagge
Two-
way
trav
eltim
e (s
)
15000 SE
4.7
4.8
4.9
5.0
5.1
5.2
5.3
5.4
5.5
5.6
5.7
5.8
5.9
F6. Seismic Line GeoB01-030, Site 1266. Horizons: 1 = Miocene Bolivina Acme, 2 = E/O boundary, 3 = Elmoration.
GeoB01-030 (Zone 2)CMP
10 km
Site 1266
V.E. = 35
1
2
3
4
Hiatus
11000 12000 13000 14000NW

T. B
AR
TE
LS E
T AL.
HIG
H-R
ESO
LU
TIO
N S
EISM
IC DA
TA
22
Figure horizon, 4 = PETM. V.E. = verticalexagge
3.3
3.4
3.5
3.6
3.7
3.8
3.9
4.0
4.1
4.2
4.3
4.4
4.5
4.6
4.7
Two-
way
trav
eltim
e (s
)
NE000
F7. Seismic Line GeoB01-048, Site 1265. Horizons: 1 = Miocene Bolivina Acme, 2 = E/O boundary, 3 = Elmo ration.
GeoB01-048 (Zone 3)
Site 1265
CMP
Channel
Expanded Neogene sediments
1
4
3
2
Hiatus
5 kmV.E. = 32
12000300040005000SW

T. BARTELS ET AL.HIGH-RESOLUTION SEISMIC DATA 23
Figure F8. Seismic Line GeoB01-046, Sites 1263 and 1264. Horizons: 1 = Miocene Bolivina Acme, 2 = E/Oboundary, 3 = Elmo horizon, 4 = PETM. V.E. = vertical exaggeration.
CMPGeoB01-046 GI gun
3.3
3.4
3.5
3.6
3.7
3.8
3.9
4.0
4.1
4.2
4.3
Site 1264
Two-
way
trav
eltim
e (s
)
Site 1263
3 kmV.E. = 12
2
3
4
1
1
1.0 1000W E
T. B
AR
TE
LS E
T AL.
HIG
H-R
ESO
LU
TIO
N S
EISM
IC DA
TA
24
Figure tion.
90003.3
3.4
3.5
3.6
3.7
3.8
3.9
4.0
4.1
4.2
4.3
4.4
4.5
1264
Channel
Two-
way
trav
eltim
e (s
)
N
F9. Seismic Line GeoB01-031, Site 1264. Horizon: 1 = Miocene Bolivina Acme. V.E. = vertical exaggera
3000 4000 5000 6000 7000 8000
SiteChannel
Channel
10 km
GeoB01-031 (Zone 3)CMP
V.E. = 53
1
Expanded Neogene sedimentsDebris flow
S

T. B
AR
TE
LS E
T AL.
HIG
H-R
ESO
LU
TIO
N S
EISM
IC DA
TA
25
Figure
Two-
way
trav
eltim
e (s
)
5000 NE
4.9
5.0
5.1
5.2
5.3
5.4
5.5
5.6
5.7
5.8
5.9
6.0
6.1
4.8
F10. Seismic Line GeoB01-044. V.E. = vertical exaggeration.
Channel
V.E. = 355 km
GeoB01-044 (Zone 2)CMP
1000 2000 3000 4000SW

T. BARTELS ET AL.HIGH-RESOLUTION SEISMIC DATA 26
Figure F11. Seismic Line GeoB01-061. V.E. = vertical exaggeration.
1.0 20001000 3000
4.5
4.4
4.6
4.7
4.8
4.9
5.0
5.1
5.2
5.3
5.4
5.5
5.6
CDP
Two-
way
trav
eltim
e (s
)
V.E. = 315 km
GeoB01-061 (Zone 2)
Channel
SE NW

T. BARTELS ET AL.HIGH-RESOLUTION SEISMIC DATA 27
Table T1. Depth of target horizons at each site of Leg 208.
Notes: Depths calculated using velocity models of synthetic seismograms and traveltime ofseismic data. For Sites 1263 and 1265, a velocity model using a linear regression line wasassumed. — = not identified on seismogram.
Depth (mbsf)
Site 1262 Site 1263 Site 1264 Site 1265 Site 1266 Site 1267
Miocene Bolivina Acme 53 44 159 88 115 111E/O boundary 78 100 — 192 207 128Elmo horizon 115 265 — 241 270 179PETM 139 335 — 315 306 231K/T boundary 195 — — — — 298