5th international exchange and innovation conference on
TRANSCRIPT

Proceedings of International Forum for Green Asia 2019 5th International Exchange and Innovation Conference on Engineering & Sciences (IEICES 2019)
GA05 / P17
An Exergy Analysis of R410a as a ‘Drop-In’ Refrigerant for a Mechanical Vapor Compression Chiller
Colombatantirige Uthpala Amoda Perera1*, Nobuo Takata1, Takahiko Miyazaki1,2, Yukihiro Higashi2, Kyaw Thu1 1 Interdisciplinary Graduate School of Engineering Sciences (IGSES), Kyushu University, Japan
2 International Institute for Carbon Neutral Energy Research (WPI-I2CNER), Kyushu University, Japan Email: [email protected]
Abstract: The Heating, Ventilation, Air-Conditioning and Refrigeration (HVAC&R) industry, is contributing to the Global Warming crisis. This crisis prompted a global initiative such as the Kigali Amendment, of which one key target is to reduce the use and eventually phase out Hydrofluorocarbons (HFCs), with high Global Warming Potentials (GWPs). This target has prompted the exploration of low GWP refrigerants to replace these HFCs. Some research hence focuses on using low GWP refrigerants and their mixtures as ‘drop-in’ replacements in existing systems, allowing easier integration and a more cost effective solution. Hence, a baseline analysis is carried out on a Mechanical Vapor Compression Chiller, according to AHRI Standards 551/591. R410a is chosen as the 'drop-in' refrigerant due to its abundance in the global market and its expected phase out due to its high GWP. 1st law analysis and an exergetic approach is chosen to provide further insight into the irreversibilities.
Keywords: Mechanical Vapor Compression Chiller; R410a; Exergy; Low GWP; HFC; Drop-In Refrigerant
1. INTRODUCTION The frequency of climatic events affecting humans across all parts of the world have been on the rise[1]. These events are said to be caused by the increased influence humans have on the climate which is evident through various phenomena such as the Global Warming Crisis[2]. This particular issue is caused by the increased release of greenhouse gases into out atmosphere which eventually cause an excessive greenhouse effect, leading to heightened global temperatures[3]. Though the beginnings of this crisis is possible attributed to the industrial revolution, in the present day various industries collectively contribute to this issue. One of which is the Heating, Ventilation, Air Conditioning and Refrigeration (HVAC&R) industry[4]. The HVAC&R industry contributes to this Global Warming crisis through both indirect emissions of Carbon dioxide during power consumption and the direct emission of greenhouse gases, which are used as refrigerants. These have collectively resulted in around a 20% contribution to the global emissions of greenhouse gases, which gives the HVAC&R industry a vital role to play in solving these issues[5]. Since the HVAC&R industry has a global influence, an international effort to move the industry towards a sustainable path has been promoted through countless national policies and international treaties such as the Kyoto Protocol[6], Montreal Protocol[7], Kigali Amendment[8], Paris Accord[9] and Japan and EU Fluorinated Gas (F-Gas) policies[10], [11]. In order to achieve many of the targets proposed under these administrative procedures, the Research and Development (R&D) sections of the industry have had to take the lead. This is especially true of the research work carried out at various research institutions which provide the fundamental pathways for the industry to progress. Many of these works have been focused on contributing to environmental issues caused by the industry and include work which focuses on replacing high Global Warming Potential (GWP) refrigerants with
alternative low GWP ones such as the work by Jakobs et. al. which utilized non-azeotropic mixtures and their specific temperature glides in order to provide better heat transfer characteristics[12], or the work focused on the reemergence of natural refrigerants such as Carbon dioxide[13] by Lorentzen et. al. and even the use of water, ammonia and air[14] as proposed by Riffat et. al. Another method which has been used is termed as ‘drop-in’ replacements which allows the integration of more suitable refrigerants in to pre-existing systems to replace high GWP refrigerants. This ‘drop-in’ replacement method offers a more cost effective way of tackling the need to replace refrigerants with high GWPs in existing systems and is hence highly sought off by both the consumers and producers. Research pertaining to this area has already been initiated and is being carried out of various t various types of systems ranging from domestic refrigerators[15] in the case of Rangel-Hernandez et. al and even on chillers as presented by Fukuda et. al., who focused on using ternary mixtures to replace R410a[16]. However, the latter work did not focus on a particular international standard when testing the chiller performance which creates a gap in research for fair and uniform comparison with alternative refrigerants and different chillers. In order to fill this gap, the present work was proposed where the performance of a water cooled chiller operating under AHRI standards 551/591 (SI)[17] was evaluated. The refrigerant which was chosen for these experiments was R410a due to several reasons such as its high GWP of 2088, the potential phase out of use under the Kigali Amendment as well as Japan’s F-Gas policies as well as the extensive use within the current global market ranging from Japan[10], [18] to USA[19] and to the EU[20]. The following work will present this ‘drop-in’ experiments as well as the analysis of data with respect to both the first law and second law of thermodynamics. This allows the investigation of the irreversibilities or exergy destruction occurring within
- 9 -

the chiller. It is hoped that this analysis can be used as a baseline for comparison with alternative refrigerants which are to be tested using the same setup as ‘drop-in’ low GWP refrigerants. 2. METHOD This section will highlight the experiment procedure as well as provide a brief outline of the AHRI standard 551/591 (SI). 2.1 Experimental Setup
Fig. 1 shows the experimental setup, which includes the refrigerant circuit shown in pink, the chilled water circuit shown in green and the cooling water circuit shown in red. The chiller itself consists of four main components. The compressor, evaporator, condenser and expansion valve. A charging point is located just after the expansion valve in order to charge different amounts of refrigerant, whilst a sampling port is located in between the condenser and expansion valve, for sampling refrigerant mixtures to test their concentrations. For the experimental purposes the cooling load and heating load are provided using two constant temperature baths, which allow the control of both the temperature of water flowing to the heat exchangers as well as the flow rates. There are Temperature (T) and Pressure (P) sensors located in both the refrigerant and water circuits as shown in Fig. 1. Together with the different mass or volume flow meters, the required energy and exergy calculations can be made using the measured data. For the refrigeration circuit, the key points of measurement are shown utilizing a Pressure-Enthalpy (p-h) diagram (See Fig. 2) 2.2 Experimental Procedure For the experimental procedure, it is required to measure the afore mentioned properties at steady state
conditions for varied cooling loads between 1.0 – 1.6 kW at various charge amounts between 0.67 – 0.80 kg. The experiments are started at the lowest charge amounts, where the range of cooling capacities are tested, after which a small amount of refrigerant is added to the circuit and the process repeated. In order to charge the refrigerant, the expansion valve must be fully closed, and the refrigerant is charged into the pre-evaporator and evaporator section. With the use of the load available from the constant temperature baths, the refrigerant can now be vaporized, which allows the operation of the compressor. Care must be taken to ensure that only vaporized refrigerant enters the compressor, otherwise any liquid present could damage the compressor unit. The cooling capacities are also achieved using the variable speed of the compressor which allows the operation from full load conditions to part load conditions. LabView software is used for the collection of data which is then processed using Mathematica. Extended uncertainties are also calculated based on Type A uncertainties which deal with statistical analysis of the raw data and Type B uncertainties which included instrument and measurement uncertainties. 2.3 AHRI Standard 551/591 (SI)
Table 1. A summary of the AHRI standard for water cooled chiller experiments
Operating
Category
Evaporator Conditions Tower (Water Conditions)
All C
ooling
Entering Tem
p. °C
Leaving Tem
p. °C
Flow Rate
Ls -1kW-1
Entering Tem
p. °C
Leaving Tem
p. °C
Flow Rate
Ls -1kW-1
12.00 7.00 0.04781 30.00 35.00 Note
2 1: Rated water flow is determined by the water temperatures at the rated capacity. Then normalized flow rate shown, per unit evaporator capacity, is for reference only at Standard Rating Conditions. 2: Rated water flow is determined by the water temperatures at the rated capacity and rated efficiency. A summary of the AHRI standard 551/591[17] is provided in Table 1, which dictate the required conditions for the chilled and cooling water temperatures at full load conditions. 3. DATA ANALYSIS The following assumptions are included for the analysis and discussion section:
• Steady state conditions are achieved • The Black-box model is incorporated for each
subsystem (where only the input and output for each such subsystem is considered)
• The overall circuits remain as closed systems, but each subsystem or component is considered as an open system with mass flow and heat exchange
• Kinetic and potential energies are neglected
Fig. 1. Schematic of Vapor Compression Chiller System
Fig. 2. Pressure – Enthalpy Diagram for the Chiller Cycle
- 10 -

As an initial step to evaluate the nature of the data an Energy Balance is carried out according to Eq. 1.
(1)
The EB values for all scenarios fell below 0.038,
which highlights both the stability of the results and the accuracy of the measurements. As the initial parameter for determining the performance of the chiller, the Coefficient of Performance (COP) is determined. The COP is based on recommended equation provided by the AHRI standard which is shown in Eq. 2, which involves the chilled water parameters for calculating the cooling effect at the evaporator QEvap, whilst the direct power measurements are used to measure the power consumption by the compressor WComp.
(2)
The errors for the COP all fall between the range of ± 0.057-0.060 which indicates percentage errors ranging in between 0.99 - 1.09 %.
Based on Fig. 3 there are two key observations which can be made. Firstly, the COP shows a peak like behavior at 1.4 kW of cooling. Secondly, the highest COP is observed for the charge amount of 0.70 kg. The initial observation of COP peaking, helps determine the optimum capacity of this particular system which occurs at around 88% of the full load. Interestingly this peak at 1.4 kW of cooling is observed irrespective of the amount of charge, which reiterates that the chiller has an optimum capacity of 1.4 kW. Moving onto the second observation, 0.70 kg shows the highest performance which occurs at 1.4 kW, whilst it also maintain the highest COP values together with several other charge amounts at lower cooling loads, whilst it exhibits the best COP at full load conditions of 1.6 kW. These factors help determine that the optimum charge amount of R410a for this system is 0.70 kg. Now that the optimum cooling capacity of the chiller and the optimum charge amount of R410a has been determined, further analysis is presented for each of these specific conditions. Firstly; the constant charge amount of 0.70
kg, and its COP behavior with varied cooling amounts will be explored. This will be followed with the constant cooling capacity of 1.4 kW and the COP behavior with respect to changing refrigerant charge amounts. At 0.70 kg, when the cooling capacity is increased from 1.0 – 1.4 kW, an increase in COP is observed. The reasons for this behavior would be the effects of both the cooling capacity as well as the compressor power input as it is visible through Eq. 2. However, both the cooling effect as well as compressor power input rise in this case, mainly due to an increase in refrigerant and water mass flow rates, which are required to achieve large cooling loads. However, the required power input to the compressor to achieve a unit cooling load is small enough to produce a net positive effect on the COP, which would suggest that the heat exchangers are continuously performing well. This is possible mainly due to the availability of free heat transfer area, which will be occupied with the increased amount of refrigerant available at larger cooling loads, which hence allow a better heat transfer process. However, the amount of area available is limited, which signifies the drop in COP which is illustrated in Fig. 3 when progressing above the optimum cooling capacity of 1.4 kW to the larger capacity of 1.6 kW. Moving on to the scenario in which the optimum cooling capacity is maintained, Fig. 4 represents the changes in COP with different R410a charge amounts.
The optimum charge amount of 0.70 kg shows the best COP whilst at any charge amount above or below this, a drop in COP is seen. This is possible due to overcharging and undercharging phenomena. In the case of overcharging, the presence of any additional refrigerant is met with limited heat exchanger heat transfer area, which inhibits the heat exchange process and causes subcooled liquid buildup at the end of the condenser and even slight increases in pressure lift and hence larger power inputs to the compressor. The opposite, where the system is undercharged, there is a lack of refrigerant to produce the required cooling and heat rejection effect, which also causes the drop in COP as the compressor requires more power input to move refrigerant through to the condenser. With the COP analyzed, it is possible to move on to the second law analysis where the exergy destruction ĖD is calculated. The exergy destruction is defined with respect to the dead state conditions of T0 = 298.15 K and P0 = 101.35 kPa and represents the potential of work which has been lost according to Eq. 3 and Eq. 4.
Cond
CondCompEvap
QQWQ
EB-+
=
Compin
EvapCHPCHCH
Comp
Evap
PTcV
WQ
COP,
, D==
r
Fig. 1. The COP versus Cooling Capacity for all Charge Amounts
Fig. 2. The COP for all charge amounts at constant 1.4 kW of cooling
- 11 -

(3)
(4)
The total exergy destruction ĖD, is presented in Fig. 5 for 0.67, 0.70 and 0.80 kg, which are lowest, optimum and largest charge amounts.
Using Fig. 5, it was possible to notice that the total exergy destroyed increased with larger cooling capacities. This is attributed to the increasing mass flow rates which are required for handling the increased heat transfer duty at the evaporator and condenser. The larger mass flow rates will also cause larger irreversibilities occurring within each component due increased friction losses and possible eddy current generations. These losses combined together, with the increasing power input to the compressor which directly results in exergy destroyed, an increasing ĖD trend with larger cooling capacities is justifiable. Similar to the analysis of the COP, both the optimum charge amount and optimum cooling capacity are isolated and analyzed.
Fig. 6 shows the component ĖD at the optimum charge amount of 0.70 kg, for the 4 cooling capacities between 1.0 – 1.6 kW. It is noticed that the compressor creates the largest exergy destruction, which is then followed by the 2 condenser and evaporator. The expansion valve seems to exhibit the smallest contribution in almost all scenarios. The possible reasons for the compressor being the major contributor is due to the increasing power consumption created via the larger pressure lift required for cycle operation, whilst the two heat exchangers would be affected by the increased mass flow rates which again contribute to the larger losses within these components, and since the condenser is required to handle a larger heat load in comparison to the evaporator, it is also expected to contribute more towards the ĖD. The expansion process which is considered to be isenthalpic, would only result in ĖD due to entropy changes when moving from the subcooled region at the end of the condenser to the 2-phase region at the evaporator inlet. Since there is a slight increase in condenser pressure with cooling loads,
the phase change occurring at higher cooling loads, would result in larger entropy changes causing an increase in the ĖD as well.
Looking at the optimum capacity of 1.4 kW with varied charge amounts of smallest, optimum and largest, Fig. 7 presents the ĖD.
Fig. 7 shows the component ĖD for 0.67, 0.70 and 0.80 kg R410a charge amounts at 1.4 kW of cooling capacity. In this scenario, the trends are slightly different from the previous case. The compressor shows an increasing ĖD similar to the section above, which could be a result of liquid refrigerant accumulation at the exit of the condenser, causing a hindrance in the heat transfer process. This results in the slight increase in condenser pressure as well. Following suit, it would be expected for the compressor ĖD to increase as well due a positive trend in electrical power consumption. However, this is not visibly clear possibly due to an influence in the lower mass flow rates through the compressor system which create an unclear pattern in the ĖD of the compressor. The evaporator on the other hand shows a decreasing contribution towards the ĖD at
å åå=
-+÷øö
çèæ ++÷
øö
çèæ -=
n
j ofoo
ifii
CVCVjD emem
dtdV
pWQTT
E1
001 !!!
)()( 000 ssThhe jjfj ---=
Fig. 3. The Total Exergy Destruction for 0.67, 0.70 and 0.80 kg of Refrigerant Charge at 1.0 – 1.6 kW of Cooling
Fig. 4. The Component Exergy Destruction for 0.70 kg for Cooling Capacities of (a) 1.0; (b) 1.2; (c) 1.4; (d) 1.6 kW
Fig. 5. The Component Exergy Destruction at 1.4 kW for the Charge Amounts of (a) 0.67; (b) 0.70; (c) 0.80 kg
- 12 -
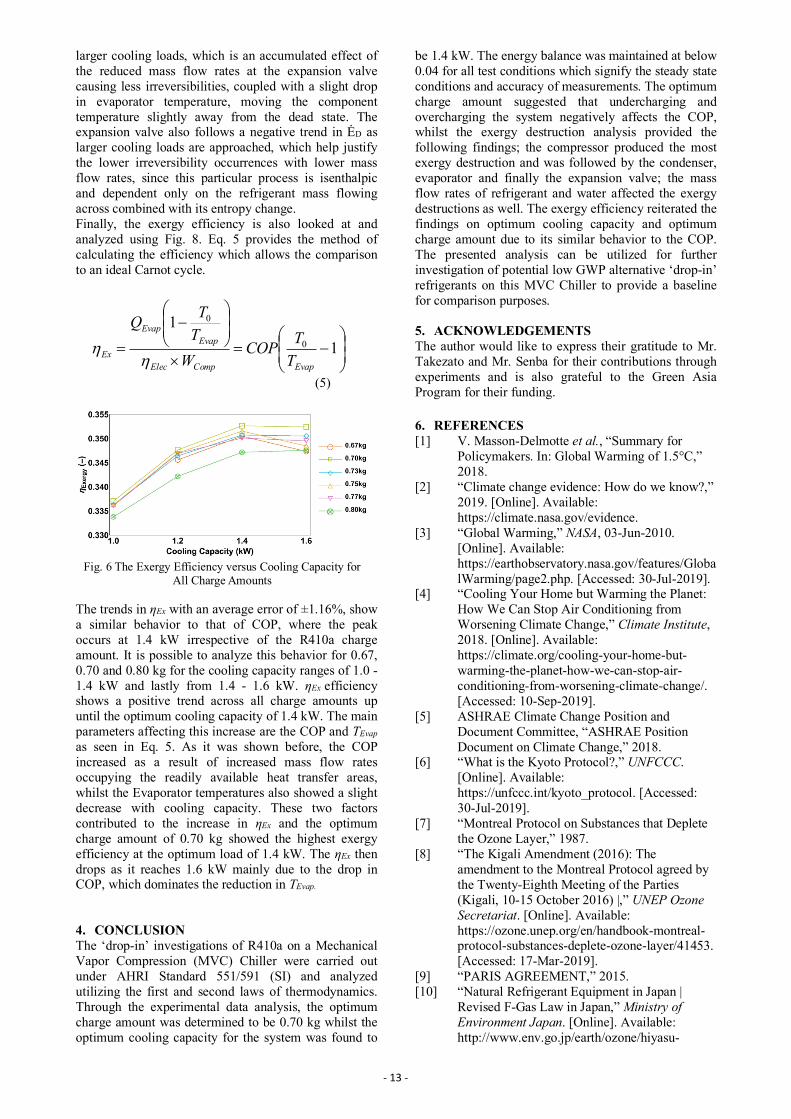
larger cooling loads, which is an accumulated effect of the reduced mass flow rates at the expansion valve causing less irreversibilities, coupled with a slight drop in evaporator temperature, moving the component temperature slightly away from the dead state. The expansion valve also follows a negative trend in ĖD as larger cooling loads are approached, which help justify the lower irreversibility occurrences with lower mass flow rates, since this particular process is isenthalpic and dependent only on the refrigerant mass flowing across combined with its entropy change. Finally, the exergy efficiency is also looked at and analyzed using Fig. 8. Eq. 5 provides the method of calculating the efficiency which allows the comparison to an ideal Carnot cycle.
(5)
The trends in ηEx with an average error of ±1.16%, show a similar behavior to that of COP, where the peak occurs at 1.4 kW irrespective of the R410a charge amount. It is possible to analyze this behavior for 0.67, 0.70 and 0.80 kg for the cooling capacity ranges of 1.0 - 1.4 kW and lastly from 1.4 - 1.6 kW. ηEx efficiency shows a positive trend across all charge amounts up until the optimum cooling capacity of 1.4 kW. The main parameters affecting this increase are the COP and TEvap as seen in Eq. 5. As it was shown before, the COP increased as a result of increased mass flow rates occupying the readily available heat transfer areas, whilst the Evaporator temperatures also showed a slight decrease with cooling capacity. These two factors contributed to the increase in ηEx and the optimum charge amount of 0.70 kg showed the highest exergy efficiency at the optimum load of 1.4 kW. The ηEx then drops as it reaches 1.6 kW mainly due to the drop in COP, which dominates the reduction in TEvap.
4. CONCLUSION The ‘drop-in’ investigations of R410a on a Mechanical Vapor Compression (MVC) Chiller were carried out under AHRI Standard 551/591 (SI) and analyzed utilizing the first and second laws of thermodynamics. Through the experimental data analysis, the optimum charge amount was determined to be 0.70 kg whilst the optimum cooling capacity for the system was found to
be 1.4 kW. The energy balance was maintained at below 0.04 for all test conditions which signify the steady state conditions and accuracy of measurements. The optimum charge amount suggested that undercharging and overcharging the system negatively affects the COP, whilst the exergy destruction analysis provided the following findings; the compressor produced the most exergy destruction and was followed by the condenser, evaporator and finally the expansion valve; the mass flow rates of refrigerant and water affected the exergy destructions as well. The exergy efficiency reiterated the findings on optimum cooling capacity and optimum charge amount due to its similar behavior to the COP. The presented analysis can be utilized for further investigation of potential low GWP alternative ‘drop-in’ refrigerants on this MVC Chiller to provide a baseline for comparison purposes. 5. ACKNOWLEDGEMENTS The author would like to express their gratitude to Mr. Takezato and Mr. Senba for their contributions through experiments and is also grateful to the Green Asia Program for their funding.
6. REFERENCES [1] V. Masson-Delmotte et al., “Summary for
Policymakers. In: Global Warming of 1.5°C,” 2018.
[2] “Climate change evidence: How do we know?,” 2019. [Online]. Available: https://climate.nasa.gov/evidence.
[3] “Global Warming,” NASA, 03-Jun-2010. [Online]. Available: https://earthobservatory.nasa.gov/features/GlobalWarming/page2.php. [Accessed: 30-Jul-2019].
[4] “Cooling Your Home but Warming the Planet: How We Can Stop Air Conditioning from Worsening Climate Change,” Climate Institute, 2018. [Online]. Available: https://climate.org/cooling-your-home-but-warming-the-planet-how-we-can-stop-air-conditioning-from-worsening-climate-change/. [Accessed: 10-Sep-2019].
[5] ASHRAE Climate Change Position and Document Committee, “ASHRAE Position Document on Climate Change,” 2018.
[6] “What is the Kyoto Protocol?,” UNFCCC. [Online]. Available: https://unfccc.int/kyoto_protocol. [Accessed: 30-Jul-2019].
[7] “Montreal Protocol on Substances that Deplete the Ozone Layer,” 1987.
[8] “The Kigali Amendment (2016): The amendment to the Montreal Protocol agreed by the Twenty-Eighth Meeting of the Parties (Kigali, 10-15 October 2016) |,” UNEP Ozone Secretariat. [Online]. Available: https://ozone.unep.org/en/handbook-montreal-protocol-substances-deplete-ozone-layer/41453. [Accessed: 17-Mar-2019].
[9] “PARIS AGREEMENT,” 2015. [10] “Natural Refrigerant Equipment in Japan |
Revised F-Gas Law in Japan,” Ministry of Environment Japan. [Online]. Available: http://www.env.go.jp/earth/ozone/hiyasu-
÷÷ø
öççè
æ-=
´
÷÷ø
öççè
æ-
= 11
0
0
EvapCompElec
EvapEvap
Ex TTCOP
WTTQ
hh
Fig. 6 The Exergy Efficiency versus Cooling Capacity for All Charge Amounts
- 13 -

waza/eng/revised_f-gas_law_in_japan.html. [Accessed: 30-Jul-2019].
[11] “EU legislation to control F-gases,” European Commission. [Online]. Available: https://ec.europa.eu/clima/policies/f-gas/legislation_en. [Accessed: 16-Mar-2019].
[12] R. Jakobs and H. Kruse, “The use of non-azeotropic refrigerant mixtures in heat pumps for energy saving,” Int. J. Refrig., vol. 2, no. 1, pp. 29–32, Jan. 1979.
[13] G. Lorentzen and J. Pettersen, “A new, efficient and environmentally benign system for car air-conditioning,” Int. J. Refrig., vol. 16, no. 1, pp. 4–12, Jan. 1993.
[14] S. B. Riffat, C. F. Afonso, A. C. Oliveira, and D. A. Reay, “Natural refrigerants for refrigeration and air-conditioning systems,” Appl. Therm. Eng., vol. 17, no. 1, pp. 33–42, Jan. 1997.
[15] V. H. Rangel-Hernández, J. M. Belman-Flores, D. A. Rodríguez-Valderrama, D. Pardo-Cely, A. P. Rodríguez-Muñoz, and J. J. Ramírez-Minguela, “Exergoeconomic performance comparison of R1234yf as a drop-in replacement for R134a in a domestic refrigerator,” Int. J. Refrig., vol. 100, pp. 113–123, Apr. 2019.
[16] S. Fukuda, “Experimental Assessment on Performance of a Heat Pump Cycle Using R32 / R1234yf and R744 /,” 2016.
[17] Standard for Performance Rating Of Water-Chilling and Heat Pump Water-Heating Packages Using the Vapor Compression Cycle, vol. SI-2015. 2016, p. 74.
[18] H. Kasahara, “Current status of Japan ’s legislation on F-gases and RACHP using Low-GWP Refrigerants,” 2018.
[19] “Residential Air Conditioning and the Phaseout of HCFC-22: What You Need to Know.”
[20] “EU F-gas Regulation: Ready for the future HVAC-R Market,” 2012.
- 14 -