5s qc (qcc) ss
TRANSCRIPT

1
© 2008, Teian Consulting International Pte Ltd
Asian Productivity OrganizationNational Iranian Productivity Center (NIPC)
Kelvin Chan Keng ChuenAPO Chief Resource Person
Director and Principal ConsultantTeian Consulting International Pte Ltd
Presentation Prepared for APO 08-RP-22-GE-DON-C,The Islamic Republic of Iran, 4 Aug 2008
In-country Training Program forProductivity and Quality Practitioners
(2 - 14 Aug 2008, Tehran, The Islamic Republic of Iran)
Quality Circles (QCs)
2
© 2008, Teian Consulting International Pte Ltd
Organising for Employee Involvement
Employee Involvement
5S QC (QCC)
SS
In-Country Training Program for P & Q Practitioners 2 to 14 August 2008, Tehran, Islamic Republic of Iran Quality Circles
Asian Productivity Organization 1 of 34

3
© 2008, Teian Consulting International Pte Ltd
Quality Circles (QC)
• Permanent group of 4 to 10 employees
• Functional in nature and members arefrom the same department
• Solve work-related problems
• Apply simple problem-solving tools
• Problems can be either assigned oridentified by the team themselves
4
© 2008, Teian Consulting International Pte Ltd
Quality Improvement Teams
• Ad-hoc team set up to solve specificproblem
• Cross-functional in nature and membersare drawn form different departments
• Higher echelon staff such as engineers,executives or middle management
• Members are appointed by the QCPC
• Problems are identified by the QCPC
In-Country Training Program for P & Q Practitioners 2 to 14 August 2008, Tehran, Islamic Republic of Iran Quality Circles
Asian Productivity Organization 2 of 34

5
© 2008, Teian Consulting International Pte Ltd
Types of Quality Teams
• Moves to anothertheme
• Disbanded5. Upon Completionof Project
• PDCA• 7 QC Tools
• PDCA• 7 QC Tools
4. Approach
• Same department• Selected according toexpertise
• Higher echelon
3. Members
• Selected by members• Simple
• Assigned by mgt• More difficult
2. Theme
• Department-oriented• Project-oriented1. Formation
QCQITType of Teams
6
© 2008, Teian Consulting International Pte Ltd
Benefits of QCs
To Company• Synergy• Committed workforce• Reduction in cost• Better communication
To Employees• Self-fulfillment • Improved skills• Use of creative mind• Improve inter-personal relationships
In-Country Training Program for P & Q Practitioners 2 to 14 August 2008, Tehran, Islamic Republic of Iran Quality Circles
Asian Productivity Organization 3 of 34

7
© 2008, Teian Consulting International Pte Ltd
Topic Outside the Scope of QC
• Wages & salaries• Welfare benefits• Disciplinary policies• Employment policies• Termination policies• Grievances• Personalities of management and union
8
© 2008, Teian Consulting International Pte Ltd
Topic Discussed By QC
• Quality • Delivery time• Housekeeping• Cost• Service time• Safety• Other topics in-line with
the company's quality policy
In-Country Training Program for P & Q Practitioners 2 to 14 August 2008, Tehran, Islamic Republic of Iran Quality Circles
Asian Productivity Organization 4 of 34

9
© 2008, Teian Consulting International Pte Ltd
Example of QC Organisation Structure
Leader LeaderLeader
Members MembersMembers
QC PromotionCommittee
QCSecretariat
Facilitator
Leader
FacilitatorFacilitator
Members
QC QC QC QC
10
© 2008, Teian Consulting International Pte Ltd
Role of Management• Encourage and motivate QC
• Provide meeting place, resources, materials,equipment and supplies
• Ensure necessary training is provided
• Attend to requests and recommendations
• Implement approved QCs’ recommendations
• Help QC in theme and problem selection
• Encourage participation by all staff and activelypublicise team activities and accomplishments
• Recognise the importance of QC presentation
• Be accountable and responsible for the QCactivities within own department
In-Country Training Program for P & Q Practitioners 2 to 14 August 2008, Tehran, Islamic Republic of Iran Quality Circles
Asian Productivity Organization 5 of 34
11
© 2008, Teian Consulting International Pte Ltd
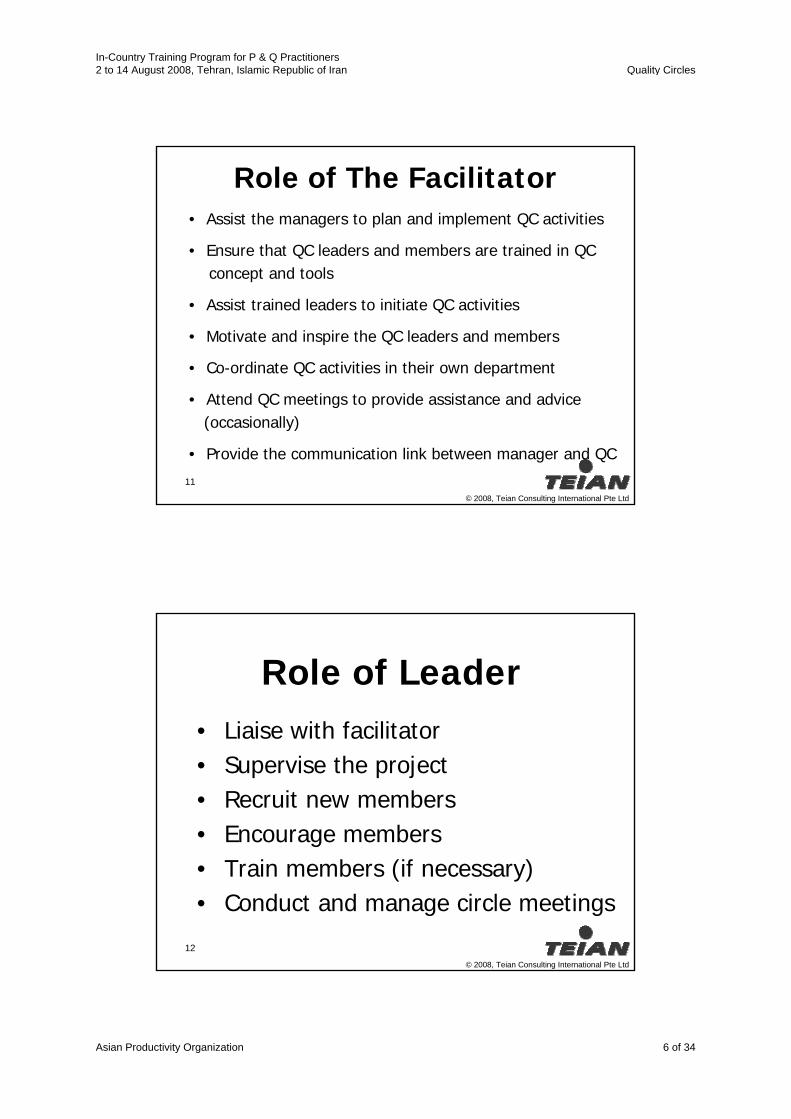
Role of The Facilitator• Assist the managers to plan and implement QC activities
• Ensure that QC leaders and members are trained in QCconcept and tools
• Assist trained leaders to initiate QC activities
• Motivate and inspire the QC leaders and members
• Co-ordinate QC activities in their own department
• Attend QC meetings to provide assistance and advice(occasionally)
• Provide the communication link between manager and QC
12
© 2008, Teian Consulting International Pte Ltd
Role of Leader• Liaise with facilitator• Supervise the project• Recruit new members• Encourage members• Train members (if necessary)• Conduct and manage circle meetings
In-Country Training Program for P & Q Practitioners 2 to 14 August 2008, Tehran, Islamic Republic of Iran Quality Circles
Asian Productivity Organization 6 of 34

13
© 2008, Teian Consulting International Pte Ltd
Role of Members
• Attend training• Attend meetings• Carry out assignments• Participate actively in meetings• Maintain good relationship• Undertake specially assigned roles
14
© 2008, Teian Consulting International Pte Ltd
How to Get a QC Started
1. Form the circle
2. Attend training
3.Nominate a leader
4.Name the circle
5.Register the circle
In-Country Training Program for P & Q Practitioners 2 to 14 August 2008, Tehran, Islamic Republic of Iran Quality Circles
Asian Productivity Organization 7 of 34

15
© 2008, Teian Consulting International Pte Ltd
Monitoring Progress of QCFormation of QC
Registration of QC with Secretariat
Identify problem & set target
Proceed through problem solving cycle (PDCA)
Prepare QC Activity Plan
Registration of Theme
Prepare notes of meetings & seek approvalfor recommendations/ standardisation
Compile reports on the results
Evaluation Management Presentation
Proceed tonext theme
16
© 2008, Teian Consulting International Pte Ltd
In-Country Training Program for P & Q Practitioners 2 to 14 August 2008, Tehran, Islamic Republic of Iran Quality Circles
Asian Productivity Organization 8 of 34

17
© 2008, Teian Consulting International Pte Ltd
18
© 2008, Teian Consulting International Pte Ltd
In-Country Training Program for P & Q Practitioners 2 to 14 August 2008, Tehran, Islamic Republic of Iran Quality Circles
Asian Productivity Organization 9 of 34

19
© 2008, Teian Consulting International Pte Ltd
20
© 2008, Teian Consulting International Pte Ltd
In-Country Training Program for P & Q Practitioners 2 to 14 August 2008, Tehran, Islamic Republic of Iran Quality Circles
Asian Productivity Organization 10 of 34

21
© 2008, Teian Consulting International Pte Ltd
Common Reasons for Failures in Companies
• No training.• No follow-ups on project.• “Lip Service” from mgt.• Poor middle management support (ownership)• No objectives for programme.• No reward/recognition.• Too much expectation from mgt.• Changes in management.• No union involvement.• Poor monitoring/evaluation system.• Poor in-house promotion.• No budget & yearly plan.
22
© 2008, Teian Consulting International Pte Ltd
Key Factors For Success
Approach (PDCA)
Mechanism(QC Org.)
Tools(7 QC Tools)
In-Country Training Program for P & Q Practitioners 2 to 14 August 2008, Tehran, Islamic Republic of Iran Quality Circles
Asian Productivity Organization 11 of 34

23
© 2008, Teian Consulting International Pte Ltd
A Problem Solving Model is…
A standard Set ofSteps which canbe applied to theimprovement ofany Process
Problem
Solution
Step 1
Step 2Step 3
Step 4
24
© 2008, Teian Consulting International Pte Ltd
Continuous Improvement Through PDCA
ContinuousImprovement
Standardization
In-Country Training Program for P & Q Practitioners 2 to 14 August 2008, Tehran, Islamic Republic of Iran Quality Circles
Asian Productivity Organization 12 of 34

25
© 2008, Teian Consulting International Pte Ltd
The 12 Steps of PDCA
Step 1 : Select topic
Step 2 : Plan timetable
Step 3 : Establish present situationStep 4 : Set target
Step 5 : Identify causes
Step 6 : Check causesStep 7 : Propose solution
Step 8 : Try solution
Step 9 : Check solutionStep 10 : Obtain management approval
Step 11 : Implement solution (standardization)
Step 12 : Review
Plan
Check
Do
Action
26
© 2008, Teian Consulting International Pte Ltd
Step 1 : Select Topic
To identify a specific area for improvement:
1. Identify problems2. Select one problem3. Define the project theme
In-Country Training Program for P & Q Practitioners 2 to 14 August 2008, Tehran, Islamic Republic of Iran Quality Circles
Asian Productivity Organization 13 of 34
27
© 2008, Teian Consulting International Pte Ltd
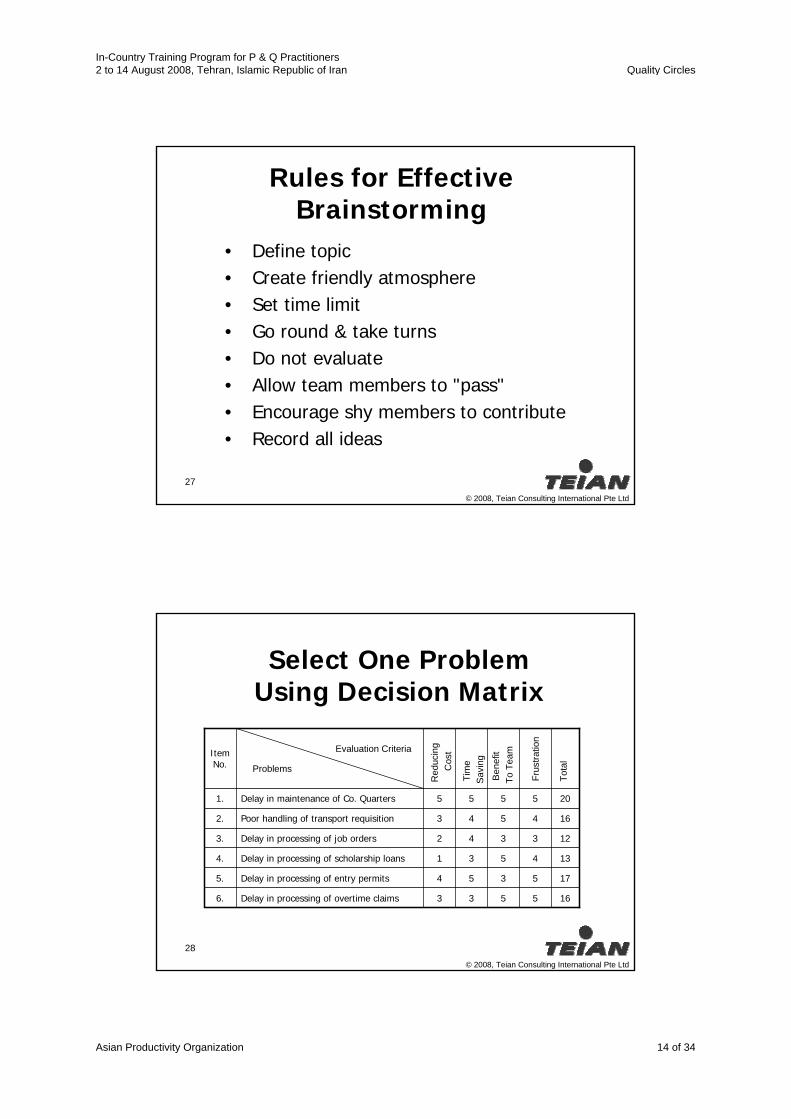
Rules for Effective Brainstorming
• Define topic• Create friendly atmosphere• Set time limit• Go round & take turns• Do not evaluate• Allow team members to "pass"• Encourage shy members to contribute• Record all ideas
28
© 2008, Teian Consulting International Pte Ltd
Select One Problem Using Decision Matrix
134531Delay in processing of scholarship loans4.
175354Delay in processing of entry permits5.
165533Delay in processing of overtime claims6.
123342Delay in processing of job orders3.
164543Poor handling of transport requisition2.
205555Delay in maintenance of Co. Quarters1.
Item No.
Fru
stra
tion
Tot
al
Ben
efit
To
Tea
m
Tim
e S
avin
g
Red
ucin
g C
ostEvaluation Criteria
Problems
In-Country Training Program for P & Q Practitioners 2 to 14 August 2008, Tehran, Islamic Republic of Iran Quality Circles
Asian Productivity Organization 14 of 34

29
© 2008, Teian Consulting International Pte Ltd
Select One Problem Using Pareto Diagram
No.
of C
usto
mer
Com
plai
nts
200
100
50
0
20%
150
40.%
0%
250
Car
par
king
spa
ce
Ligh
ting
& v
entil
atio
n
Spor
ts e
quip
men
t
Hou
seke
epin
g -c
lub
Publ
icity
of n
otic
es
Oth
ers
Cum
ulat
ive
Perc
enta
ge
Inco
min
g ca
lls
Publ
ic p
hone
Boo
king
pro
cedu
re
80%
100%
60%
251
30
© 2008, Teian Consulting International Pte Ltd
Define The Project Theme
• Rephrase the selected problem as an improvement theme or project theme
In-Country Training Program for P & Q Practitioners 2 to 14 August 2008, Tehran, Islamic Republic of Iran Quality Circles
Asian Productivity Organization 15 of 34
31
© 2008, Teian Consulting International Pte Ltd
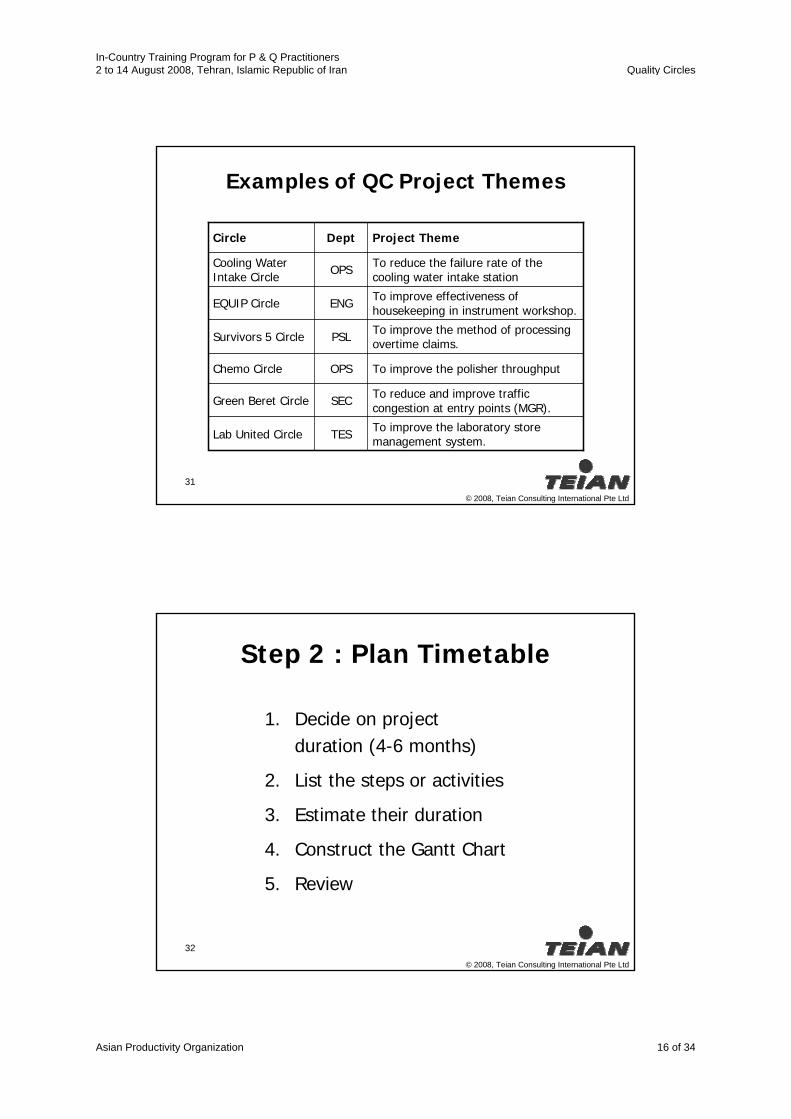
Examples of QC Project Themes
To improve the laboratory store management system.TESLab United Circle
To reduce and improve traffic congestion at entry points (MGR).SECGreen Beret Circle
To improve the polisher throughputOPSChemo Circle
To improve the method of processing overtime claims.PSLSurvivors 5 Circle
To improve effectiveness of housekeeping in instrument workshop.ENGEQUIP Circle
To reduce the failure rate of the cooling water intake stationOPSCooling Water
Intake Circle
Project ThemeDeptCircle
32
© 2008, Teian Consulting International Pte Ltd
Step 2 : Plan Timetable
1. Decide on project duration (4-6 months)
2. List the steps or activities
3. Estimate their duration
4. Construct the Gantt Chart
5. Review
In-Country Training Program for P & Q Practitioners 2 to 14 August 2008, Tehran, Islamic Republic of Iran Quality Circles
Asian Productivity Organization 16 of 34

33
© 2008, Teian Consulting International Pte Ltd
Example of a Time Table
34
© 2008, Teian Consulting International Pte Ltd
Step 3 : Establish Present Situation
• To check if the proposed area really needs improvement
In-Country Training Program for P & Q Practitioners 2 to 14 August 2008, Tehran, Islamic Republic of Iran Quality Circles
Asian Productivity Organization 17 of 34

35
© 2008, Teian Consulting International Pte Ltd
Step For Establishing Present Situation
36
© 2008, Teian Consulting International Pte Ltd
Identifying Requirements Using Flow Charts
Are there any requirements that is not met?
Are there any complaints received from
other departments?
Are there non-conformance detected?
Are we delivery on time to our customers?
In-Country Training Program for P & Q Practitioners 2 to 14 August 2008, Tehran, Islamic Republic of Iran Quality Circles
Asian Productivity Organization 18 of 34

37
© 2008, Teian Consulting International Pte Ltd
Step 4 : Set Target
• To determine a measurableand achievable goal for theproject
38
© 2008, Teian Consulting International Pte Ltd
Step 5 : Identify Causes
• To avoid jumping to solutions which may notsolve the problem
In-Country Training Program for P & Q Practitioners 2 to 14 August 2008, Tehran, Islamic Republic of Iran Quality Circles
Asian Productivity Organization 19 of 34

39
© 2008, Teian Consulting International Pte Ltd
4M1E
Low equipmentefficiency
Outdatedequipment
Lack maintenanceof equipment
Material inventoryinadequate
Delays in arrival of raw material
Processnot rational
Ineffectiveprocess
Improper housekeeping
Material Man Staff efficiency
is low
Lack appropriate
Skills
Lack Training & awareness
Prod
uctiv
ityha
s de
crea
sed
Method Machine
Environment
Too muchorder
Fishbone Diagram
40
© 2008, Teian Consulting International Pte Ltd
Step 6 : Check Causes
• To find out the maincause(s) of the problem
In-Country Training Program for P & Q Practitioners 2 to 14 August 2008, Tehran, Islamic Republic of Iran Quality Circles
Asian Productivity Organization 20 of 34

41
© 2008, Teian Consulting International Pte Ltd
Step 7 : Propose Solution
• Propose solution which will prevent recurrence
• Make a corrective action plan
42
© 2008, Teian Consulting International Pte Ltd
Which of these is corrective action and which is not?
• Screening• Testing• Better process• Training• Sorting• Checking• New materials• New procedure
Yes No
In-Country Training Program for P & Q Practitioners 2 to 14 August 2008, Tehran, Islamic Republic of Iran Quality Circles
Asian Productivity Organization 21 of 34
43
© 2008, Teian Consulting International Pte Ltd
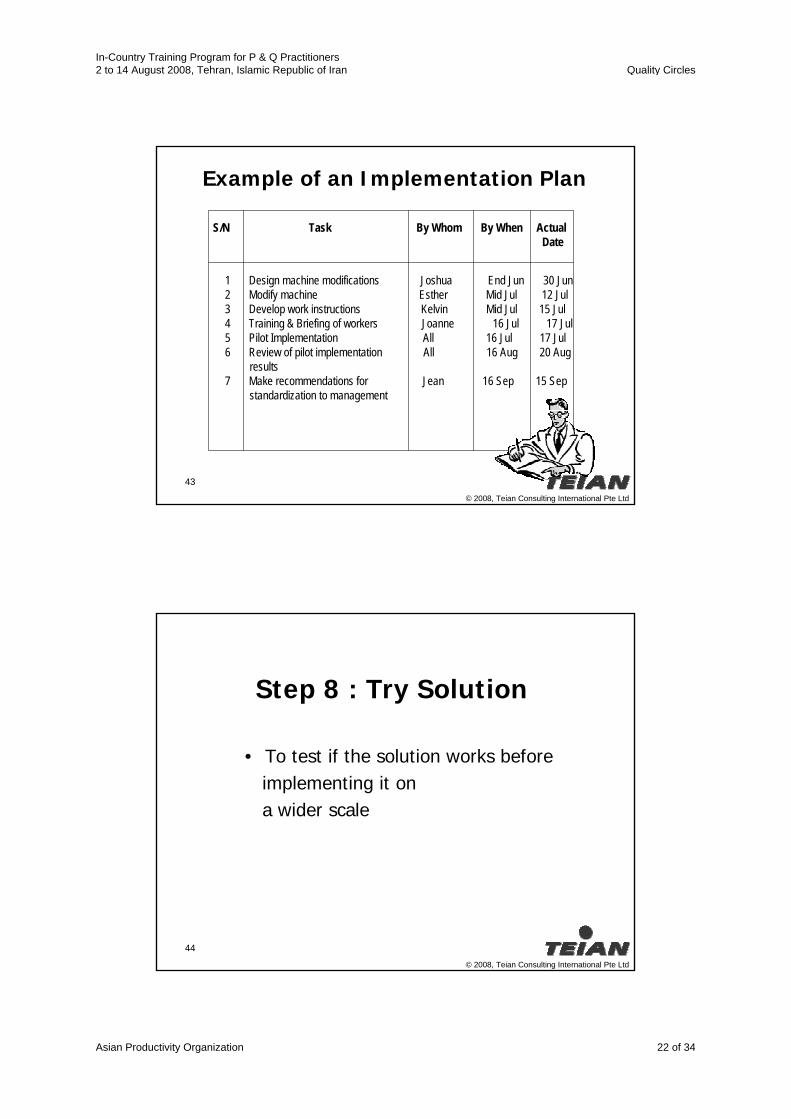
Example of an Implementation Plan
S/N Task By Whom By When ActualDate
1 Design machine modifications Joshua End Jun 30 Jun2 Modify machine Esther Mid Jul 12 Jul3 Develop work instructions Kelvin Mid Jul 15 Jul4 Training & Briefing of workers Joanne 16 Jul 17 Jul5 Pilot Implementation All 16 Jul 17 Jul6 Review of pilot implementation All 16 Aug 20 Aug
results7 Make recommendations for Jean 16 Sep 15 Sep
standardization to management
44
© 2008, Teian Consulting International Pte Ltd
Step 8 : Try Solution
• To test if the solution works beforeimplementing it on a wider scale
In-Country Training Program for P & Q Practitioners 2 to 14 August 2008, Tehran, Islamic Republic of Iran Quality Circles
Asian Productivity Organization 22 of 34

45
© 2008, Teian Consulting International Pte Ltd
Step 9 : Check Solution
• To check on the effectiveness of the proposed solution(s)
• Collect data and examine the results to see how effective is the solution
• See if the target is reached
46
© 2008, Teian Consulting International Pte Ltd
Step 10 : Obtain Management Approval
• To get the green light to implement the solution(s)
In-Country Training Program for P & Q Practitioners 2 to 14 August 2008, Tehran, Islamic Republic of Iran Quality Circles
Asian Productivity Organization 23 of 34

47
© 2008, Teian Consulting International Pte Ltd
Step 11 : Implement
Solution
• To put into effect the solution on a more permanent and company-wide level
48
© 2008, Teian Consulting International Pte Ltd
Step 12 : Review
• To check on the effectivenessof implementation
In-Country Training Program for P & Q Practitioners 2 to 14 August 2008, Tehran, Islamic Republic of Iran Quality Circles
Asian Productivity Organization 24 of 34

49
© 2008, Teian Consulting International Pte Ltd
The 7 QC Tools
1. Checksheet2. Graph3. Pareto diagram4. Cause-and-effect diagram5. Histogram6. Stratification7. Scatter diagram
50
© 2008, Teian Consulting International Pte Ltd
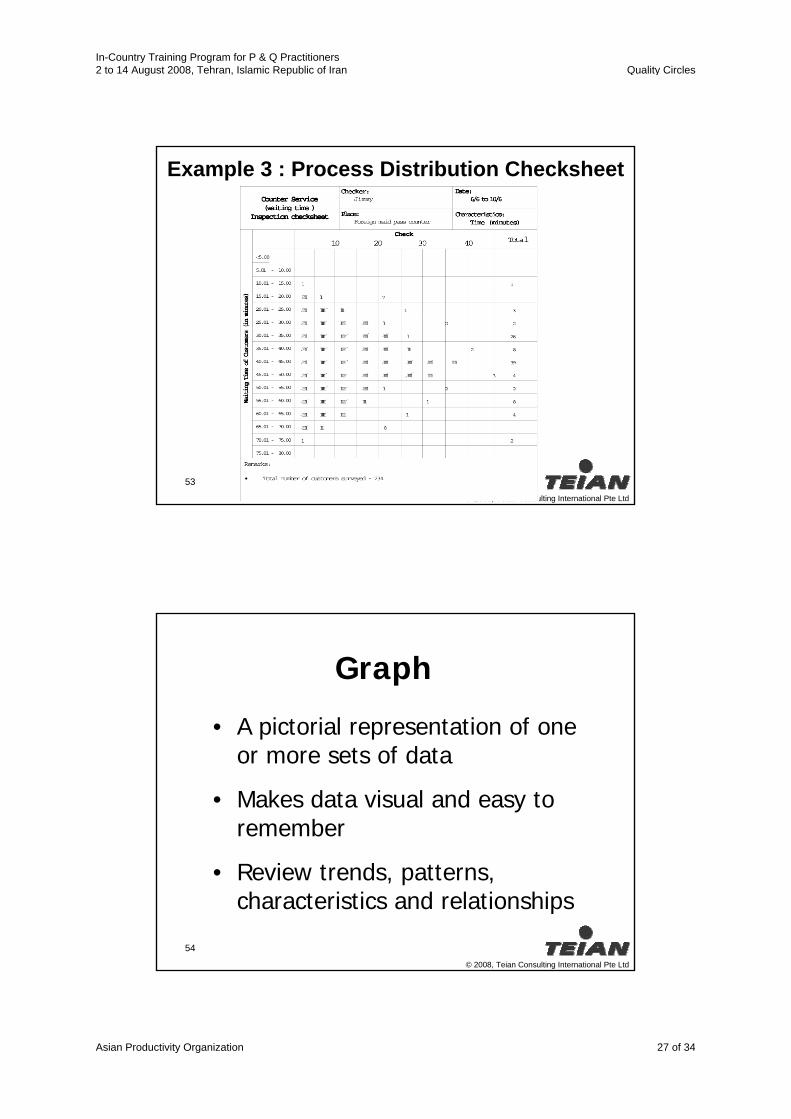
Checksheet
• A form or table prepared in advance to collect the required data in a simple manner
• Defective item checksheet
• Defect position checksheet
• Process distribution checksheet
In-Country Training Program for P & Q Practitioners 2 to 14 August 2008, Tehran, Islamic Republic of Iran Quality Circles
Asian Productivity Organization 25 of 34

51
© 2008, Teian Consulting International Pte Ltd
Example 1 : Defective item Checksheet
52
© 2008, Teian Consulting International Pte Ltd
Example 2 : Defects Position Checksheet
In-Country Training Program for P & Q Practitioners 2 to 14 August 2008, Tehran, Islamic Republic of Iran Quality Circles
Asian Productivity Organization 26 of 34
53
© 2008, Teian Consulting International Pte Ltd
Example 3 : Process Distribution Checksheet
54
© 2008, Teian Consulting International Pte Ltd
Graph
• A pictorial representation of one or more sets of data
• Makes data visual and easy to remember
• Review trends, patterns, characteristics and relationships
In-Country Training Program for P & Q Practitioners 2 to 14 August 2008, Tehran, Islamic Republic of Iran Quality Circles
Asian Productivity Organization 27 of 34

55
© 2008, Teian Consulting International Pte Ltd
Types & Uses of Graph
1. Line graph ~ Trend
2. Bar graph ~ Examination
3. Pie chart ~ Composition
4. Band graph ~ Trend & Composition
25
Month
No of Complaints
0
5
10
15
20
30
35
1 2 3 4 5 6Month
No of Complaints
0
5
10
15
20
25
30
35
1 2 3 4 5 6
Percentage Complaint
0% 20% 40% 60% 80% 100%
1
2
3
4
5%
20%
15%
45%
15%
55
SINGAPORE
56
© 2008, Teian Consulting International Pte Ltd
Types & Uses of Graph
5. Radar chart ~ Comparison
6. Control Chart ~ Control
7. Gantt chart ~ Planning
13
8
9
10
11
12
14
15
16
17
18
1 2 3 4 5 6 7 8
5
1
2
3
4
5
6
0
10
15
20
25
In-Country Training Program for P & Q Practitioners 2 to 14 August 2008, Tehran, Islamic Republic of Iran Quality Circles
Asian Productivity Organization 28 of 34

57
© 2008, Teian Consulting International Pte Ltd
Uses of Cause & Effect Diagram
• Thorough analysis of causes of a problem
• Gather ideas of team members
• See actual situation
• A good training tool
Trunk
Medium br anch
Small br anch
Tiny branch
Effects(result)
Big branch
Causes (factors)
58
© 2008, Teian Consulting International Pte Ltd
Example : Drafting Office
DifficultyIn locatinga drawing
Man
Method Machine
Unclear writingon drawings
File content notclearly labeled User too
dependent onlibrarian
Shortage ofskilled
manpower
Drawingsnot dated
Computers
Limitedspace
Improperindexing
Not clearly labeled
Library usersare not adequately
informedDrawings
categorised undertoo many index
MaterialEnvironment
Smelly blueprint machine
Too high
Filing cabinets
No taggingmachine to create standard labels
Cabinets arescattered
Drawingcategorised undertoo many groups
Process : Document searchingCreator : Esther
Date : 10 Jun 93
In-Country Training Program for P & Q Practitioners 2 to 14 August 2008, Tehran, Islamic Republic of Iran Quality Circles
Asian Productivity Organization 29 of 34

59
© 2008, Teian Consulting International Pte Ltd
Uses of Pareto Diagram
• To identify the vital few from the trivial many
• To select improvement themes
• To identify critical causes
• To show results of improvement
60
© 2008, Teian Consulting International Pte Ltd
Pareto DiagramPareto Diagram of Customer Complaints
on Hotel Rooms
0
20
40
60
80
100
120
140
160
180
200
Ligh
ts n
ot w
orki
ng
Low
wat
er p
ress
ure
Poo
r TV
rece
ptio
n
Dam
aged
furn
iture
Roo
m n
oisy
Oth
ers
Occ
urre
nce
0%
20%
40%
60%
80%
100%
Perc
enta
ge O
ccur
renc
e
Pareto Table
In-Country Training Program for P & Q Practitioners 2 to 14 August 2008, Tehran, Islamic Republic of Iran Quality Circles
Asian Productivity Organization 30 of 34

61
© 2008, Teian Consulting International Pte Ltd
Effectiveness of Improvement
62
© 2008, Teian Consulting International Pte Ltd
Histogram
• A graph that displays the distribution of data
• Constructed from data collected in a frequency table
• To see central tendency and dispersion characteristics
• To spot irregularities
• To compare sample results with desired
• To identify influencing factors
In-Country Training Program for P & Q Practitioners 2 to 14 August 2008, Tehran, Islamic Republic of Iran Quality Circles
Asian Productivity Organization 31 of 34
63
© 2008, Teian Consulting International Pte Ltd
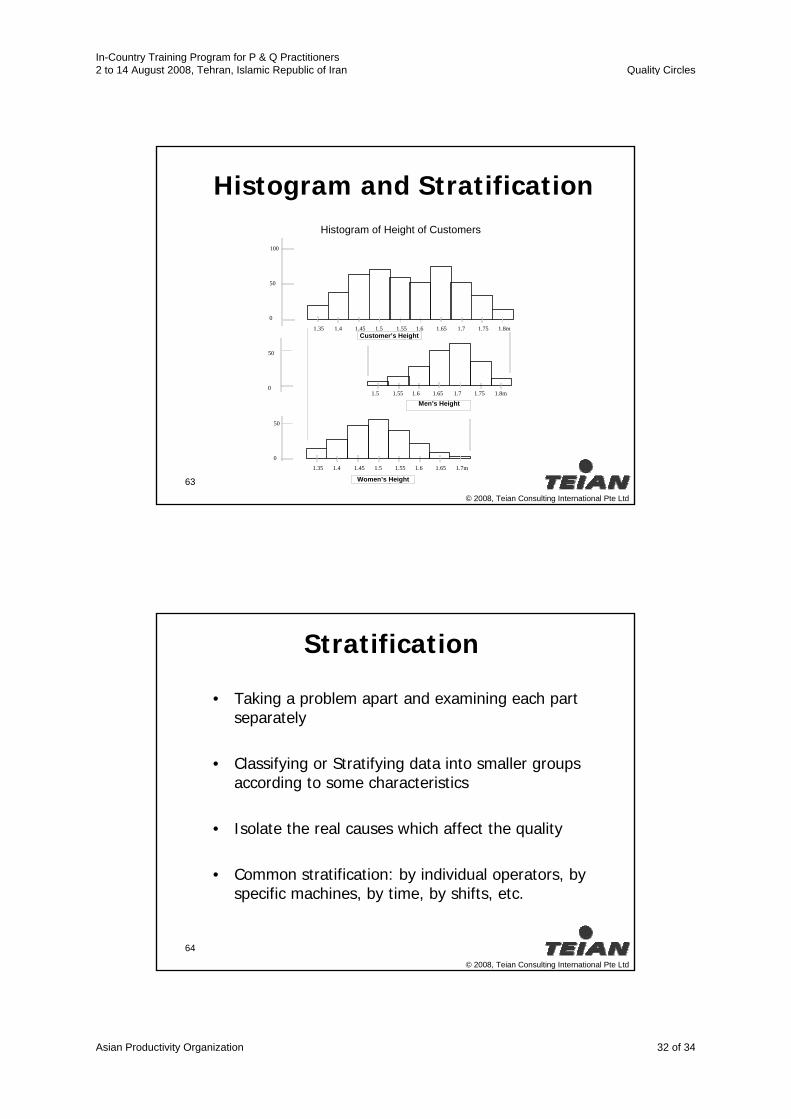
Histogram and StratificationHistogram of Height of Customers
100
50
0
1.35 1.4 1.45 1.5 1.55 1.6 1.65 1.7 1.75 1.8m
1.35 1.4 1.45 1.5 1.55 1.6 1.65 1.7m
50
0
1.5 1.55 1.6 1.65 1.7 1.75 1.8m
50
0
Men's height
Women's height
Customer's heightCustomer’s Height
Men’s Height
Women’s Height
64
© 2008, Teian Consulting International Pte Ltd
Stratification
• Taking a problem apart and examining each part separately
• Classifying or Stratifying data into smaller groups according to some characteristics
• Isolate the real causes which affect the quality
• Common stratification: by individual operators, by specific machines, by time, by shifts, etc.
In-Country Training Program for P & Q Practitioners 2 to 14 August 2008, Tehran, Islamic Republic of Iran Quality Circles
Asian Productivity Organization 32 of 34

65
© 2008, Teian Consulting International Pte Ltd
Stratification When Applied on A Scatter Diagram
After Stratification
• ••
•
•••
••
•• •• •• ••
•
•
•••
Before Stratification
Height Height
Wei
ght
Wei
ght
• ••
•
•••
••
•• •• •• ••
•
•
•••Chinese
XX
X
X
X
X
X
X X
XX
Americans
66
© 2008, Teian Consulting International Pte Ltd
Scatter Diagram• A diagram that shows the relationship
of one set of data with another
• ••
•
•••
••
•• •• •• ••
•
•
•••
Scatter diagram of man’s weight versus height
Height
Wei
ght
In-Country Training Program for P & Q Practitioners 2 to 14 August 2008, Tehran, Islamic Republic of Iran Quality Circles
Asian Productivity Organization 33 of 34

67
© 2008, Teian Consulting International Pte Ltd
Uses of a Scatter Diagram
• Shows the relationship of one setof data with another
• To determine the main factors in acause-and-effect relationship
• To determine the optimal range ofvariables
• To compare results
68
© 2008, Teian Consulting International Pte Ltd
Scatter Diagram
x
• •••
•••
••
•• •• •• •••
•
•••
• ••
•
•••
••
•• •• •• ••
•
•
•••
••••••
••
••
••• •
•
•
•
•
•
• ••
•
•
••
•••
••
•• •• ••
•
•
•
••
••
••••
•••
•
•
•
••
• ••
••
••
••
•
• •••
•••
••
•• •• •• •••
•
•••
C
B
A
D
E
Fy
y y y
yy
x x
x x x
Negative correlation Negative correlation may be present
Positive correlation Positive correlation may be present
No correlation
Data application which brings out positive correlation
a
b
In-Country Training Program for P & Q Practitioners 2 to 14 August 2008, Tehran, Islamic Republic of Iran Quality Circles
Asian Productivity Organization 34 of 34