59655048-kpis-sbs-br-9
DESCRIPTION
59655048-KPIs-SBS-BR-9.pdfTRANSCRIPT
Siemens
Information System PM: SBS Key Performance Indicators (optional issue) A50016-G5100-A042-1-7618 Date : 15.11.2006 Release : BR9.0
Information PM: SBS Key Performance Indicators System
2 A50016-G5100-A042-1-7618
Contents Siemens ................................................................................................................................1 Information ...........................................................................................................................1 System ..................................................................................................................................1 PM: SBS Key Performance Indicators ................................................................................1 A50016-G5100-A042-1-7618.................................................................................................1 Contents ...............................................................................................................................2
1 INTRODUCTION............................................................................................................................................. 5 1.1 Purpose.............................................................................................................................................. 5 1.2 Reference Documents ........................................................................................................................ 5 1.3 Issue History ...................................................................................................................................... 5 1.4 Definition of Terms............................................................................................................................ 7
2 TOP LEVEL KPI.......................................................................................................................................... 10 3 IMMEDIATE ASSIGNMENT ANALYSIS.......................................................................................................... 12
3.1 Number of Immediate Assignment Attempts .................................................................................... 14 3.2 Number of Immediate Assignment Losses ....................................................................................... 14 3.3 Number of Immediate Assignments by BSC procedure ................................................................... 15 3.4 Number of AGCH Losses................................................................................................................. 16 3.5 Number of Immediate Assignment Commands sent to MS via AGCH............................................. 16 3.6 Number of Immediate Assignments without MS Seizure.................................................................. 17 3.7 Number of successful Immediate Assignments ................................................................................ 17 3.8 Immediate Assignment Loss Rate .................................................................................................... 18 3.9 AGCH Loss Rate CS ........................................................................................................................ 18 3.10 Immediate Assignment without MS Seizure Rate............................................................................. 19 3.11 Immediate Assignment Success Rate ............................................................................................... 19
4 SSS PROCEDURES ANALYSIS ..................................................................................................................... 20 Fig. 2 Message flow: SSS Procedures during Call Setup (MOC)..........................................20 Fig. 3 Traffic flow: SSS Procedures during Call Setup..........................................................21
4.1 Number of successful Immediate Assignments related to Call Setups ............................................. 22 4.2 Number of Dropped SDCCH Connections related to Call Setups................................................... 23 4.3 Number of SSS Procedure Failures related to Call Setups ............................................................. 23 4.4 SDCCH Drop Rate related to Call Setups....................................................................................... 24 4.5 SSS Procedures Failure Rate related to Call Setups ....................................................................... 24 4.6 SSS Procedures Success Rate related to Call Setups....................................................................... 25
5 ASSIGNMENT ANALYSIS ............................................................................................................................. 26 Fig. 4 Message flow: Assignment Procedure (normal case) .................................................26 Fig. 5 Traffic flow: Assignment Procedure ............................................................................27
5.1 Number of Assignment Attempts ...................................................................................................... 28 5.2 Number of Assignment Failures ...................................................................................................... 29 5.3 Number of successful Assignments .................................................................................................. 30 5.4 Assignment Failure Rate ................................................................................................................. 31 5.5 Assignment Success Rate ................................................................................................................. 32 5.6 Assignment success rate when radio resources available ............................................................... 32 5.7 Mean Number of Repeated Assignment Requests ............................................................................ 32 5.8 Repeated Assignment Request Rate ................................................................................................. 33 5.9 Assignment Success Rate for receiver supporting ARP technology................................................. 33
6 CALL SETUP ANALYSIS .............................................................................................................................. 34 6.1 Number of Call Setup Attempts........................................................................................................ 35 6.2 Number of Successful Call Setups ................................................................................................... 35 6.3 Call Setup Success Rate................................................................................................................... 36 6.4 Number of Call Setup Failures ........................................................................................................ 36 6.5 Call Setup Failure Rate ................................................................................................................... 38
7 TCH DROP RELATED PERFORMANCE INDICATORS ..................................................................................... 39 7.1 Number of Dropped TCH Connections ........................................................................................... 39 7.2 TCH Drop Distribution ................................................................................................................... 40 7.3 TCH Drop Rate................................................................................................................................ 43 7.4 Call Drop Rate ................................................................................................................................ 44
Information PM: SBS Key Performance Indicators System
3 A50016-G5100-A042-1-7618
7.5 Mean Time between TCH Drop....................................................................................................... 46 7.6 TCH Drops per Erlanghour............................................................................................................. 46 7.7 Rate of normal call releases of calls with bad radio quality ........................................................... 46 7.8 Rate of TCH Drops and normal call releases of calls with bad radio quality................................. 47
8 SDCCH DROP RELATED PERFORMANCE INDICATORS................................................................................ 49 8.1 Number of dropped SDCCH Connections ....................................................................................... 49 8.2 SDCCH Drop Rate .......................................................................................................................... 49 8.3 Mean Time between SDCCH Drop.................................................................................................. 50 8.4 SDCCH Drops per Erlanghour ....................................................................................................... 50
9 TCH LOAD RELATED PERFORMANCE INDICATORS..................................................................................... 51 9.1 TCH Load for Circuit Switched Traffic ........................................................................................... 51
Fig. 6 Overview Load related performance indicators...........................................................51 9.2 Combined time slot utilization for CS and PO Traffic..................................................................... 60
10 DCCH RELATED PERFORMANCE INDICATORS ...................................................................................... 62 Fig. 7 Overview Dedicated Control Channels .......................................................................62
10.1 SDCCH Load related Performance Indicators................................................................................ 62 Fig. 8 Overview Load related performance indicators...........................................................62
10.2 FACCH related Performance Indicators......................................................................................... 67 11 CCCH LOAD RELATED PERFORMANCE INDICATORS ............................................................................ 68
Fig. 9 Overview Common Control Channels.........................................................................68 11.1 PCH load of downlink CCCH channels .......................................................................................... 70 11.2 AGCH load of downlink CCCH channels........................................................................................ 70 11.3 CCCH load downlink....................................................................................................................... 71 11.4 CCCH load uplink ........................................................................................................................... 71 11.5 PCH Loss Rate ................................................................................................................................ 72 11.6 AGCH Loss Rate.............................................................................................................................. 72 11.7 Invalid RACH Rate .......................................................................................................................... 73
12 PCCH LOAD RELATED PERFORMANCE INDICATORS............................................................................. 74 Fig. 11 Overview Packet Common Control Channels...........................................................74 Fig. 12 Structure for an exemplary packet common control channel combination ................75
12.1 PPCH load of downlink PCCCH channels...................................................................................... 76 12.2 PAGCH load of downlink PCCCH channels................................................................................... 76 12.3 PCCCH load downlink .................................................................................................................... 77 12.4 PCCCH load uplink......................................................................................................................... 77 12.5 PPCH Loss Rate .............................................................................................................................. 78 12.6 PAGCH Loss Rate ........................................................................................................................... 78 12.7 Invalid PRACH Rate........................................................................................................................ 79
13 SERVICE RELATED PERFORMANCE INDICATORS ................................................................................... 80 13.1 Total number of Service Requests.................................................................................................... 80 13.2 Service Request Distribution Rate ................................................................................................... 80 13.3 Rate of Service Requests served in the highest layer ....................................................................... 81
14 FEATURE RELATED PERFORMANCE INDICATORS .................................................................................. 82 14.1 Abis Pool Traffic Utilization............................................................................................................ 82 14.2 I-FRAME Discard Rate on Abis-Interface BSC side ....................................................................... 83 14.3 I-FRAME Discard Rate on Abis-Interface BTSE side ..................................................................... 84
15 HANDOVER RELATED PERFORMANCE INDICATORS............................................................................... 85 15.1 General Handover performance...................................................................................................... 85 15.2 Intra Cell Handovers ....................................................................................................................... 86 15.3 Inter Cell Intra BSC Handovers ...................................................................................................... 92 15.4 Inter Cell Inter BSC Handovers .................................................................................................... 102 15.5 Inter System Handover between GSM and UMTS......................................................................... 108 15.6 Other Handover Performance Indicators ...................................................................................... 113
16 POWER AND QUALITY MEASUREMENTS ............................................................................................. 119 16.1 Interference Band Rate on idle TCH ............................................................................................. 119 16.2 Quality Link for N% FER .............................................................................................................. 119 16.3 Mean FER UpLink......................................................................................................................... 120 16.4 Power and Quality limits for N% Percentile on busy TCH ........................................................... 121 16.5 Distribution of power control levels on busy TCH ........................................................................ 122 16.6 Mean Level and Quality on busy TCH........................................................................................... 123 16.7 TA Distribution.............................................................................................................................. 124 16.8 RXQUAL Distribution ................................................................................................................... 124
Information PM: SBS Key Performance Indicators System
4 A50016-G5100-A042-1-7618
16.9 RXLEV Distribution....................................................................................................................... 125 16.10 FER Distribution ........................................................................................................................... 125 16.11 Mean FER UpLink per RXQUAL .................................................................................................. 126 16.12 Mean RXLEV per RXQUAL Band ................................................................................................. 127 16.13 Mean RXLEV per TA Band............................................................................................................ 128 16.14 High RXLEV with Low RXQUAL Rate .......................................................................................... 129 16.15 TCH Traffic Type Distribution ...................................................................................................... 130 16.16 SDCCH Traffic Type Distribution ................................................................................................. 131 16.17 Adaptive Multirate Distribution .................................................................................................... 132 16.18 Adaptive Multirate True Frame Erasure Rate............................................................................... 133 16.19 Effective Frequency Load .............................................................................................................. 134 16.20 AMR Frame Erasure Rate for ARP-type Receiver ........................................................................ 135
17 AVAILABILITY RELATED PERFORMANCE INDICATORS ........................................................................ 136 17.1 Transceiver Availability ................................................................................................................ 136 17.2 TCH Distribution Rate................................................................................................................... 136 17.3 TCH Availability............................................................................................................................ 137 17.4 SDCCH Availability ...................................................................................................................... 138 17.5 Soft Blocking Rate ......................................................................................................................... 138
18 GPRS RELATED PERFORMANCE INDICATORS..................................................................................... 140 18.1 User oriented KPIs ........................................................................................................................ 140 18.2 Network planning (dimensioning) ................................................................................................. 157 18.3 Network optimization..................................................................................................................... 170 18.4 Cell Reselection ............................................................................................................................. 174
19 MISCELLANEOUS PERFORMANCE INDICATORS ................................................................................... 178 19.1 BSC1 Processor load..................................................................................................................... 178 19.2 Basic eBSC Processor load ........................................................................................................... 178 19.3 HighEnd eBSC Processor load...................................................................................................... 179 19.4 BTSE Processorload...................................................................................................................... 181 19.5 PCU Occupancy Rate .................................................................................................................... 181 19.6 Paging Response / Location Update Ratio per Cell ...................................................................... 182 19.7 BSC <-> MSC/SMLC CCS7 Load................................................................................................. 183 19.8 Frame Relay Link Utilization ........................................................................................................ 183 19.9 ARP-type Receiver Penetration ..................................................................................................... 184
20 BSS RELATED KPIS AT SIEMENS MSC ............................................................................................... 184 21 APPENDIX ........................................................................................................................................... 186
21.1 List of BSS Performance Measurements........................................................................................ 186
Information PM: SBS Key Performance Indicators System
5 A50016-G5100-A042-1-7618
1 Introduction
1.1 Purpose
The purpose of this document is the definitions of SBS Key Performance Indicators, which can be used in a uniform way. It is possible to compare Key Performance Indicators of different networks or to give statements about Quality, Performance, Capacity and more.
This document will describe the most important Key Performance Indicators relevant for GSM Mobile Networks. All listed formulas are valid for one elementary object and for one elementary measurement period. Evaluation of multiple objects and for multiple measurement periods can be done as described in chapter 1.4..
This KPI document does not provide planning rules for network dimensioning. It only provides input data used for planning tools.
1.2 Reference Documents
Further information about Performance Measurements can be found in the following documents:
• PM:SBS Counters, A30808-X3247-M40-#
• PM:SBS Message Flow, A30808-X3247-M41-#
• Training Documentation 1736 : BSS Performance Measurement
• 3GPP TS52.402 Telecommunication management; Performance Management (PM); Performance measurements - GSM
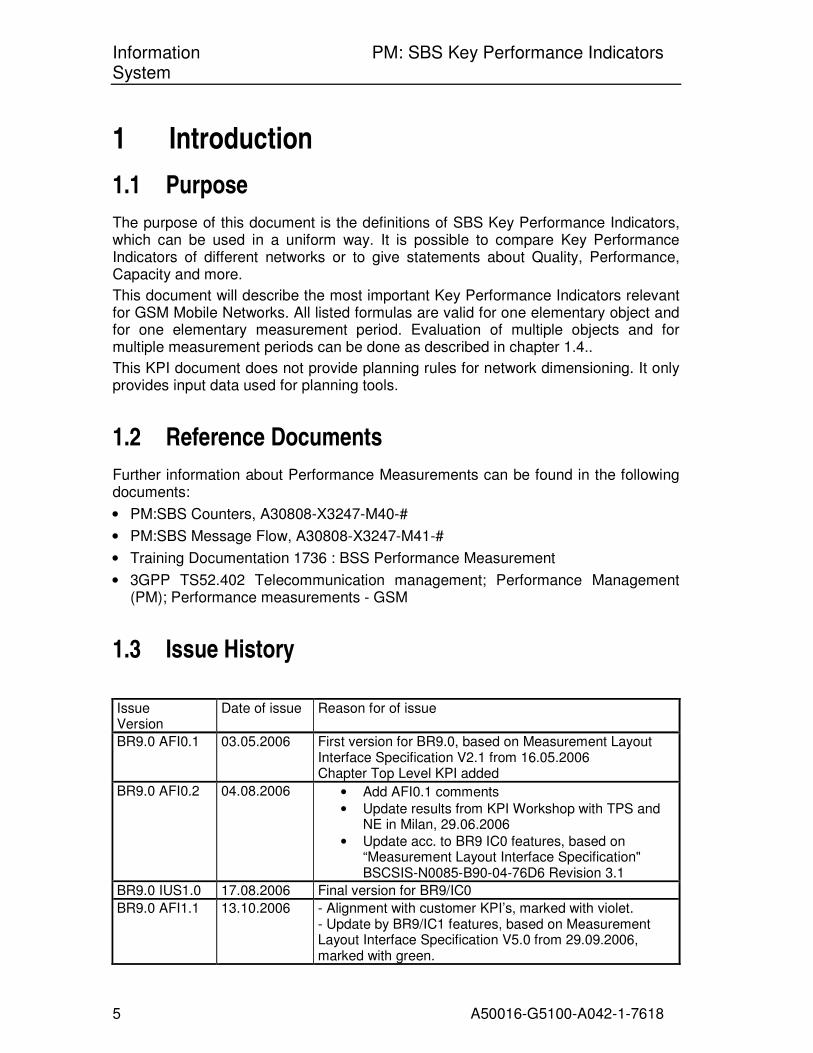
1.3 Issue History
Issue Version
Date of issue Reason for of issue
BR9.0 AFI0.1 03.05.2006 First version for BR9.0, based on Measurement Layout Interface Specification V2.1 from 16.05.2006 Chapter Top Level KPI added
BR9.0 AFI0.2 04.08.2006 • Add AFI0.1 comments
• Update results from KPI Workshop with TPS and NE in Milan, 29.06.2006
• Update acc. to BR9 IC0 features, based on “Measurement Layout Interface Specification" BSCSIS-N0085-B90-04-76D6 Revision 3.1
BR9.0 IUS1.0 17.08.2006 Final version for BR9/IC0
BR9.0 AFI1.1 13.10.2006 - Alignment with customer KPI’s, marked with violet. - Update by BR9/IC1 features, based on Measurement Layout Interface Specification V5.0 from 29.09.2006, marked with green.

Information PM: SBS Key Performance Indicators System
6 A50016-G5100-A042-1-7618
BR9.0 IUS 2.0 15.11.2006 • Add AFI1.1 comments
• Remove customer defined KPI’s

Information PM: SBS Key Performance Indicators System
7 A50016-G5100-A042-1-7618
1.4 Definition of Terms
Long name This is the full name of the described key performance indicator (KPI).
Short name This is an abbreviation of the described key performance indicator.
Description The description will give you a short explanation of the described key performance indicator. Formula The formula will deliver the exact calculation of the described key performance indicator. The formula is related to one elementary object and to one elementary period. Multiple objects and multiple elementary periods can be added as described under ‘Evaluation of multiple objects for multiple elementary periods‘.
Used parameter Here you can find either the SBS short identification of the used SBS performance measurement counters or the short name of the used key performance indicators. The related long names of SBS performance measurement counters you can find in the appendix under ‘List of Performance Measurements‘. The SBS short identification is a combination of measurement type and sub-counter. A measurement type can have several sub-counters. Therefore the used sub-counters are listed in brackets with following meaning:
• [1] sub-counter 1 has to be taken.
• [1,2,4] sub-counters 1, 2 and 4 have to be added.
• [1..4] sub-counters 1, 2, 3 and 4 have to be added.
• [1..4, 7..10] sub-counters 1, 2, 3, 4, 7, 8, 9 and 10 have to be added.
• [all] all sub-counters have to be added.
It is also possible that key performance indicators can have sub-indicators. In this case they are also listed in brackets.

Information PM: SBS Key Performance Indicators System
8 A50016-G5100-A042-1-7618
Elementary object This is the smallest measurement object, which can be used for a KPI (e.g. BSC, Cell, TRX).
Unit
• The unit is related to a key performance indicator e.g. seconds, percent or none.
• The unit “kbit” expresses 1000 bit. Same for “kbit/s”
Remark Here you will find additional important information for the key performance indicator.
Aggregation The aggregation field will show you how to evaluate the KPI for multiple objects and for multiple elementary periods. There are:
• Daily aggregation: for every KPI we can calculate:
- MAX/min value: the KPI value for the granularity period of one day is recorded. These values are processed to find the peak value, maximum (MAX) or the minimum value (min);
- MAX/min Time provides the starting time of the granularity period of the peak value (MAX and min);
- Mean/Sum daily value represents the mean/sum of the counter value, used in KPI’s formula, collected for the granularity period; it is the aggregation standard1 .
- SPBH (Sample at Peak Busy Hour2) is the value of the KPI at reference BH and is calculated only in the busy hour;
- SPBH Time provides the starting time of the hour of SPBH;
• Several days aggregation:
- MAX/MIN value: all the KPI values recorded for each granularity period for each day are processed to find the highest value (MAX) or the minimum value (min);
- MAX/MIN Time provides the starting time and date of the granularity period of the MAX/min value;
- TCMAX/TCMIN (Time Coherent MAX/min): for a number of days, counter values for each granularity period for each day are recorded. The values for the same granularity period for each day are averaged, determining the average day. The counter value in the granularity period in this average day give the highest value (TCMAX) or the lower value (TCmin) is taken;
- TCMAX/TCMIN Time provides the starting time related to TCMAX/TCmin value;
- Mean/Sum value: all the counter values, used in KPI’s formula, recorded for granularity periods for each day are processed to find the mean/sum value, it is the aggregation standard (refer to note 1);
- ASPBH (Average Sample at Peak Busy Hour): each day the sample at peak busy hour is recorded and then these values are averaged;
Information PM: SBS Key Performance Indicators System
9 A50016-G5100-A042-1-7618
- SPBH is the value of the KPI at reference BH and is calculated only in the busy hour on the number of considered days;
- SPBH Time and Date provides the starting time of the hour and the date of SPBH;
- TCSPBH (Time Coherent Sample at Peak Busy Hour): on average day it can be defined the busy hour, and in this peak busy hour the sample is recorded;
- TCSPBH Time (Time Coherent Sample at Peak Busy Hour Time): provides the starting time of the hour of TCSPBH;
- Mean daily represents the average over a number of days of the mean daily value;
- MAX_SPBH: each day the sample at peak busy is recorded and then the max of these values is considered.
For example it can be required to calculate the Handover Success Rate with SPBH aggregation Function referring to BSC Processor Load measurement:
- KPI(Aggregation Function[Reference variable])
- InterCellHOSuccRate(SPBH[BSCPRCLD[2]])
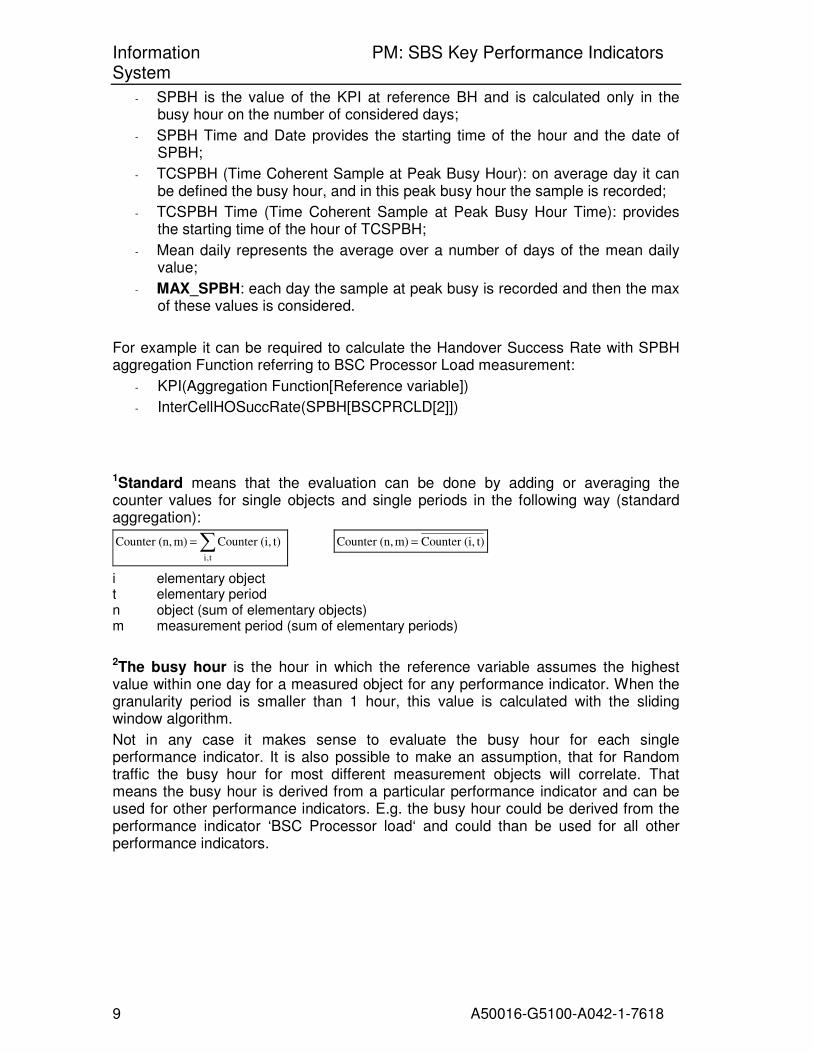
1Standard means that the evaluation can be done by adding or averaging the counter values for single objects and single periods in the following way (standard aggregation):
∑=
t,i
t)(i,Counter m)(n,Counter t)(i,Counter m)(n,Counter =
i elementary object t elementary period n object (sum of elementary objects) m measurement period (sum of elementary periods)
2The busy hour is the hour in which the reference variable assumes the highest value within one day for a measured object for any performance indicator. When the granularity period is smaller than 1 hour, this value is calculated with the sliding window algorithm.
Not in any case it makes sense to evaluate the busy hour for each single performance indicator. It is also possible to make an assumption, that for Random traffic the busy hour for most different measurement objects will correlate. That means the busy hour is derived from a particular performance indicator and can be used for other performance indicators. E.g. the busy hour could be derived from the performance indicator ‘BSC Processor load‘ and could than be used for all other performance indicators.
Information PM: SBS Key Performance Indicators System
10 A50016-G5100-A042-1-7618
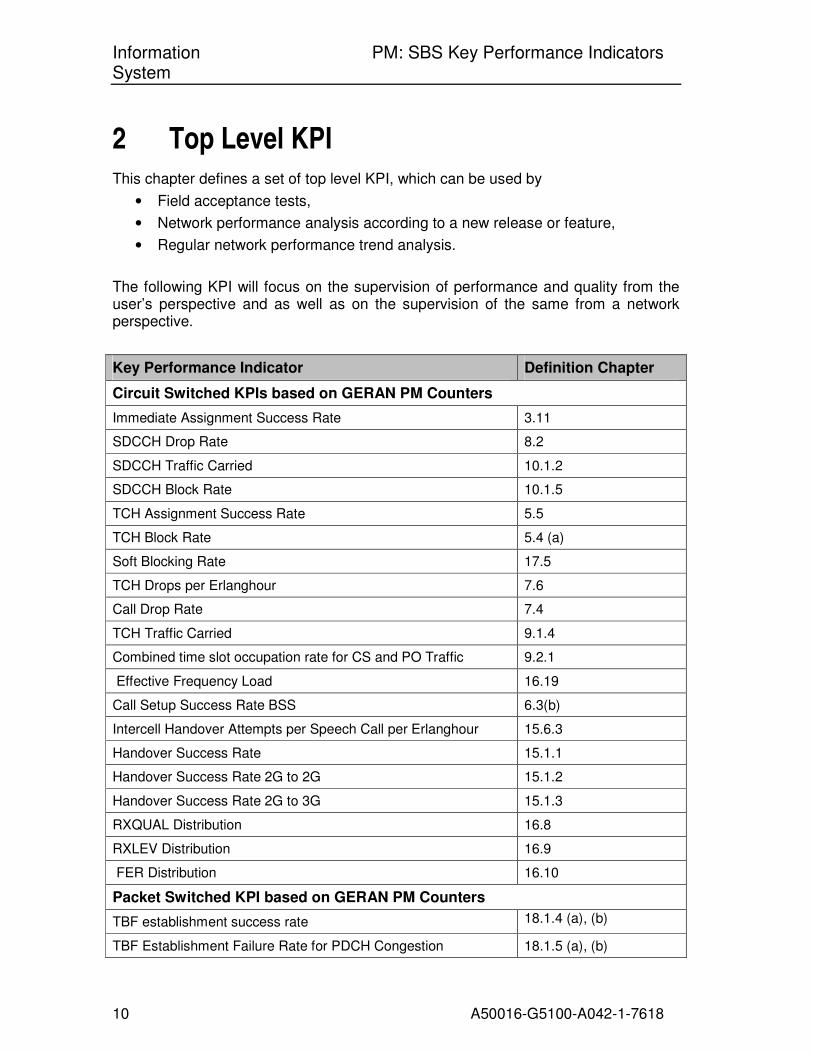
2 Top Level KPI This chapter defines a set of top level KPI, which can be used by
• Field acceptance tests,
• Network performance analysis according to a new release or feature,
• Regular network performance trend analysis.
The following KPI will focus on the supervision of performance and quality from the user’s perspective and as well as on the supervision of the same from a network perspective.
Key Performance Indicator Definition Chapter
Circuit Switched KPIs based on GERAN PM Counters
Immediate Assignment Success Rate 3.11
SDCCH Drop Rate 8.2
SDCCH Traffic Carried 10.1.2
SDCCH Block Rate 10.1.5
TCH Assignment Success Rate 5.5
TCH Block Rate 5.4 (a)
Soft Blocking Rate 17.5
TCH Drops per Erlanghour 7.6
Call Drop Rate 7.4
TCH Traffic Carried 9.1.4
Combined time slot occupation rate for CS and PO Traffic 9.2.1
Effective Frequency Load 16.19
Call Setup Success Rate BSS 6.3(b)
Intercell Handover Attempts per Speech Call per Erlanghour 15.6.3
Handover Success Rate 15.1.1
Handover Success Rate 2G to 2G 15.1.2
Handover Success Rate 2G to 3G 15.1.3
RXQUAL Distribution 16.8
RXLEV Distribution 16.9
FER Distribution 16.10
Packet Switched KPI based on GERAN PM Counters
TBF establishment success rate 18.1.4 (a), (b)
TBF Establishment Failure Rate for PDCH Congestion 18.1.5 (a), (b)

Information PM: SBS Key Performance Indicators System
11 A50016-G5100-A042-1-7618
Key Performance Indicator Definition Chapter
TBF Drop frequency 18.1.11 (a), (b)
Total number of dropped TBFs 18.1.8 (a), (b)
Weighted LLC User Data Throughput 18.1.25
Percent Timeslot Resources Achieved 18.2.15
Mean number of TBFs multiplexed on same PDCH 18.2.11
Mean PDCH Bit Rate GPRS/EDGE 18.2.14
Network controlled Intra BSC cell reselection success rate 18.4.4
User Throughput on radio interface per cell 18.2.2
Frame Relay Link Utilization 19.8
Other KPI based on GERAN PM Counters
Abis Pool Traffic Utilization 14.1(l)
BSC1 Processor load / TDPC 19.1 (b)
BSC1 Processor load / PCU 19.1 (c)
PCU Occupancy Rate 19.5
Information PM: SBS Key Performance Indicators System
12 A50016-G5100-A042-1-7618
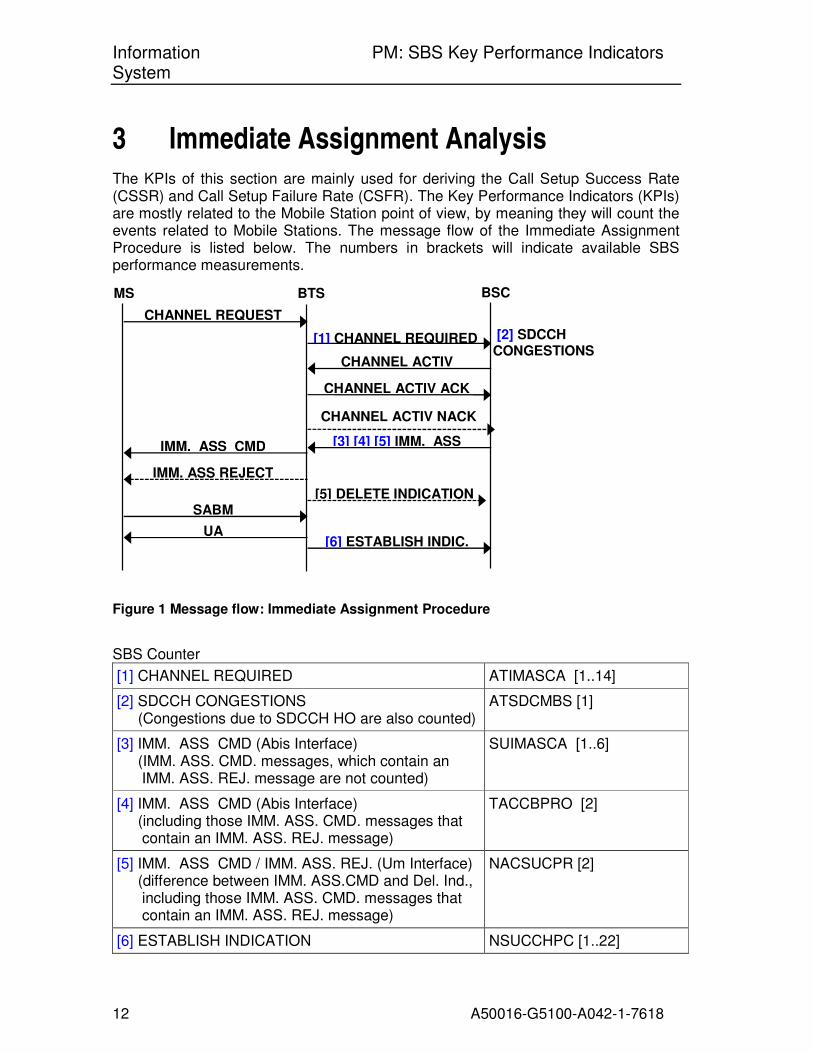
3 Immediate Assignment Analysis The KPIs of this section are mainly used for deriving the Call Setup Success Rate (CSSR) and Call Setup Failure Rate (CSFR). The Key Performance Indicators (KPIs) are mostly related to the Mobile Station point of view, by meaning they will count the events related to Mobile Stations. The message flow of the Immediate Assignment Procedure is listed below. The numbers in brackets will indicate available SBS performance measurements.
Figure 1 Message flow: Immediate Assignment Procedure
SBS Counter
[1] CHANNEL REQUIRED ATIMASCA [1..14]
[2] SDCCH CONGESTIONS (Congestions due to SDCCH HO are also counted)
ATSDCMBS [1]
[3] IMM. ASS CMD (Abis Interface) (IMM. ASS. CMD. messages, which contain an IMM. ASS. REJ. message are not counted)
SUIMASCA [1..6]
[4] IMM. ASS CMD (Abis Interface) (including those IMM. ASS. CMD. messages that contain an IMM. ASS. REJ. message)
TACCBPRO [2]
[5] IMM. ASS CMD / IMM. ASS. REJ. (Um Interface) (difference between IMM. ASS.CMD and Del. Ind., including those IMM. ASS. CMD. messages that contain an IMM. ASS. REJ. message)
NACSUCPR [2]
[6] ESTABLISH INDICATION NSUCCHPC [1..22]
BTS BSC MS
CHANNEL REQUEST
[1] CHANNEL REQUIRED
CHANNEL ACTIV
CHANNEL ACTIV ACK
CHANNEL ACTIV NACK
[3] [4] [5] IMM. ASS
[5] DELETE INDICATION
IMM. ASS CMD
IMM. ASS REJECT
SABM
[6] ESTABLISH INDIC. UA
[2] SDCCH CONGESTIONS
Information PM: SBS Key Performance Indicators System
13 A50016-G5100-A042-1-7618
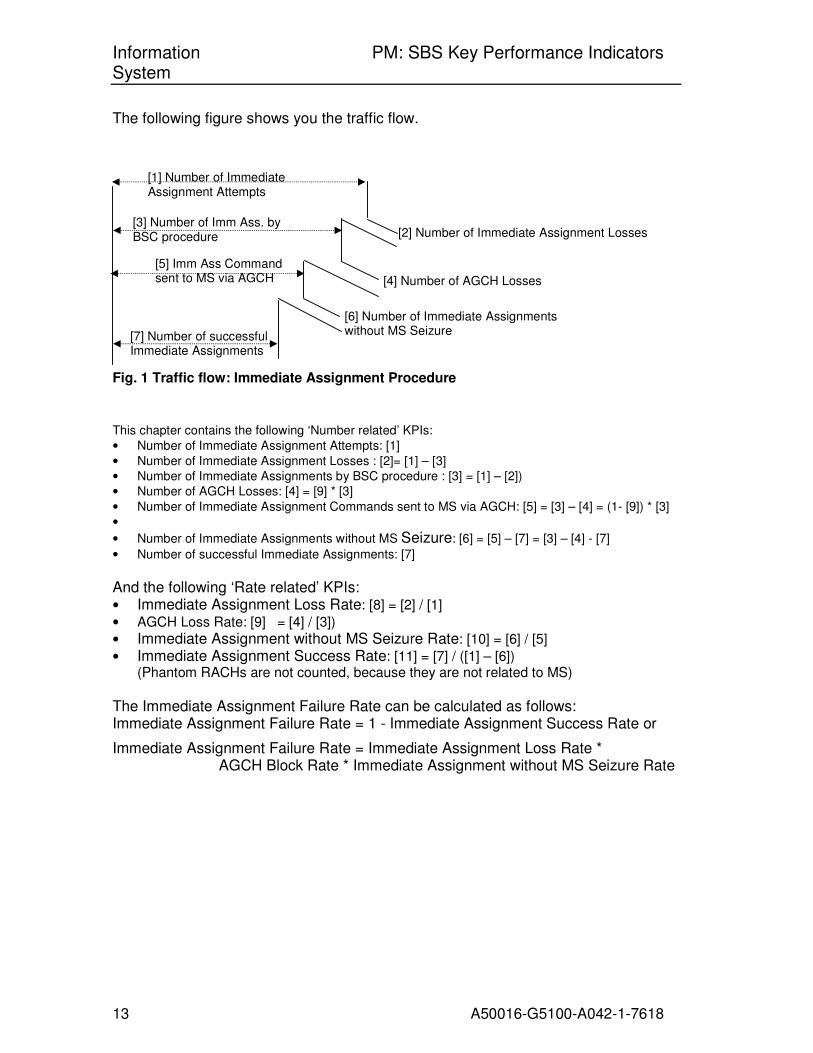
The following figure shows you the traffic flow.
Fig. 1 Traffic flow: Immediate Assignment Procedure
This chapter contains the following ‘Number related’ KPIs:
• Number of Immediate Assignment Attempts: [1]
• Number of Immediate Assignment Losses : [2]= [1] – [3]
• Number of Immediate Assignments by BSC procedure : [3] = [1] – [2])
• Number of AGCH Losses: [4] = [9] * [3]
• Number of Immediate Assignment Commands sent to MS via AGCH: [5] = [3] – [4] = (1- [9]) * [3]
•
• Number of Immediate Assignments without MS Seizure: [6] = [5] – [7] = [3] – [4] - [7]
• Number of successful Immediate Assignments: [7]
And the following ‘Rate related’ KPIs: • Immediate Assignment Loss Rate: [8] = [2] / [1]
• AGCH Loss Rate: [9] = [4] / [3])
• Immediate Assignment without MS Seizure Rate: [10] = [6] / [5]
• Immediate Assignment Success Rate: [11] = [7] / ([1] – [6]) (Phantom RACHs are not counted, because they are not related to MS)
The Immediate Assignment Failure Rate can be calculated as follows: Immediate Assignment Failure Rate = 1 - Immediate Assignment Success Rate or
Immediate Assignment Failure Rate = Immediate Assignment Loss Rate * AGCH Block Rate * Immediate Assignment without MS Seizure Rate
[2] Number of Immediate Assignment Losses
[4] Number of AGCH Losses
[6] Number of Immediate Assignments without MS Seizure [7] Number of successful
Immediate Assignments
[1] Number of Immediate Assignment Attempts
[3] Number of Imm Ass. by BSC procedure
[5] Imm Ass Command sent to MS via AGCH

Information PM: SBS Key Performance Indicators System
14 A50016-G5100-A042-1-7618
3.1 Number of Immediate Assignment Attempts
Long name: (a) Number of Immediate Assignment Attempts
Short name: (a) ImmAssAtt
Description: These indicators will give you the number of started Immediate Assignment procedures from MS point of view by counting the number of Channel Required messages.
Formula: (a) ..14]ATIMASCA[1ImmAssAtt =
Used param.: ATIMASCA[1..14]
Elem. Object: Cell
Unit: None
Remarks: Phantom RACHs are channel required messages not foreseen for the observed cell. The Immediate Assignment procedure to allocate an SDCCH/TCH is then started, but will not be successful, because no MS will reply with a SABM message and therefore a BTS Timer will expire. These unforeseen messages will also be counted.
In BR 7.0 a note was added in counter ATIMASCA. This fact does not affect the meaning or definition of the KPI.
3.2 Number of Immediate Assignment Losses
Long name: (a) Number of Immediate Assignment Losses
Short name: (a) ImmAssLoss
Description: These indicators will give you the number of SDCCH/TCH request, which were rejected, because no SDCCH/TCH was available or because of BTS channel activation failures.
Formula: (a) rocImmAssBSCp - ImmAssAtt ImmAssLoss =
Used param.: ImmAssAtt (3.1(a)) , ImmAssBSCproc (3.3(a))
Elem. Object: Cell
Unit: None
Remarks: Phantom RACHs are channel required messages not foreseen for the observed cell. The Immediate Assignment procedure to allocate an SDCCH/TCH is then started, but will not be successful, because no MS will reply with a SABM message and therefore a BTS Timer will expire. These unforeseen messages will also be counted.
In BR 7.0 a note was added in counters ATIMASCA(1,9) and SUIMASCA8(1,10). This fact does not affect the meaning or definition of the KPI.

Information PM: SBS Key Performance Indicators System
15 A50016-G5100-A042-1-7618
3.3 Number of Immediate Assignments by BSC procedure
Long name: (a) Number of Immediate Assignments by BSC internal procedure
Short name: (a) ImmAssBSCproc
Description: These indicators will give you the number of successful Immediate Assignments of a channel by BSC internal procedure
I. e. the indicator counts the cases when the Immediate Assignment Attempts (RACH) can be satisfied by an according idle channel.
Formula: (a) ..6]SUIMASCA[1 rocImmAssBSCp =
Used param.: SUIMASCA[1..6]
Elem. Object: Cell
Unit: None
Remarks: Phantom RACHs are channel required messages not foreseen for the observed cell. The Immediate Assignment procedure to allocate an SDCCH/TCH is then started, but will not be successful, because no MS will reply with a SABM message and therefore a BTS Timer will expire. These unforeseen messages will also be counted.

Information PM: SBS Key Performance Indicators System
16 A50016-G5100-A042-1-7618
3.4 Number of AGCH Losses
Long name: (a) Number of AGCH losses
Short name: (a) AGCHLoss
Description: These indicators will give you the number AGCH losses by meaning of not transmitted Immediate Assignment Command messages over the AGCH on the Air Interface. Reason for AGCH failures are mainly AGCH overload. This formula is related to MS point of view, by meaning each MS related immediate assignment procedure should be stepped once.
Therefore events, where no SDCCH/TCH was available or BTS channel activation failured are counted in the formula ‘Number of Immediate Assignment Losses’. => Only Delete Indication messages related to Immediate Assignment Command messages not containing an Immediate Assignment reject messages will rightly be counted.
Formula: (a) rocImmAssBSCp * ateCSAGCHBlockR AGCHLoss =
Used param.: AGCHLossRateCS (3.9(a)), ImmAssBSCproc (3.3(a))
Elem. Object: Cell
Unit: None
Remarks: Phantom RACHs are channel required messages not foreseen for the observed cell. The Immediate Assignment procedure to allocate an SDCCH/TCH is then started, but will not be successful, because no MS will reply with a SABM message and therefore a BTS Timer will expire. These unforeseen messages will also be counted.
3.5 Number of Immediate Assignment Commands sent to MS via AGCH
Long name: (a) Number of Immediate Assignments Commands sent to MS via AGCH
Short name: (a) ImmAssCmdAGCH
Description: The KPI provides the number of Immediate Assignments Commands sent to MS via AGCH
Formula: (a) rocImmAssBSCp * teCS)AGCHLossRa1(GCHImmAssCmdA −=
Used param.: ImmAssBSCproc (3.3(a)), AGCHLossRateCS (3.9(a))
Elem. Object: Cell
Unit: None
Remarks: Phantom RACHs are channel required messages not foreseen for the observed cell. The Immediate Assignment procedure to allocate an SDCCH/TCH is then started, but will not be successful, because no MS will reply with a SABM message and therefore a BTS Timer will expire. These unforeseen messages will also be counted.
Information PM: SBS Key Performance Indicators System
17 A50016-G5100-A042-1-7618
3.6 Number of Immediate Assignments without MS Seizure
Long name: (a) Number of Immediate Assignments without MS Seizure
Short name: (a) ImmAssNoSeiz
Description: These indicators will give you the number of immediate assignments without seizure by MS. The main reasons for this behavior are Phantom RACHs, messages not foreseen for the observed cell. Other reasons are not received SABM messages due to air interface problems. This formula will count the difference between Immediate Assignment Command messages sent to the MS and the number of Establishment Indication messages.=> not answered Immediate Assignment Commands.
Formula: (a) ImmAssSucc - AGCHLoss - rocImmAssBSCp izImmAssNoSe =
Used param.: ImmAssBSCproc (3.3(a)), AGCHLoss (3.4(a)), ImmAssSucc (3.7(a))
Elem. Object: Cell
Unit: None
Remarks: The formula will mainly detect Phantom RACHs. Phantom RACHs are channel required messages not foreseen for the observed cell. The Immediate Assignment procedure to allocate an SDCCH/TCH is started, but will not be successful, because no MS will reply with a SABM message. A BTS Timer will expire. In case of RACH repetitions (abnormal amount of time => Expiry of timer NSLOTST), it can happen that subsequent Immediate Assignment Commands will not receive a positive reply from the MS. Nevertheless from MS point of view the call setup was successful.
3.7 Number of successful Immediate Assignments
Long name: (a) Number of successful Immediate Assignments
Short name: (a) ImmAssSucc
Description: These indicators will give you the number of successful Immediate Assignments from MS point of view. An Immediate Assignment procedure is successful if the BTS returns an establishment indication message on Abis.
Formula: (a) 22] .. 17 14, .. 9 6, .. NSUCCHPC[1 ssSuccImmA =
Used param.: NSUCCHPC[1 .. 6, 9 .. 14, 17 .. 22]
Elem. Object: Cell
Unit: None
Remarks: SMS related counters in NSUCCHPC have not to be considered in the KPI formula, because they are also included in other sub-counters of measurement NSUCCHPC.
Information PM: SBS Key Performance Indicators System
18 A50016-G5100-A042-1-7618
3.8 Immediate Assignment Loss Rate
Long name: (a) Immediate Assignment Loss Rate
Short name: (a) ImmAssLossRate
Description: These indicators will give you the SDCCH/TCH Loss Rate, which were rejected, because no SDCCH/TCH was available or because of BTS channel activation failures.
Formula: (a)
mAssAttIm
mAssLossIm RateImmAssLoss =
Used param.: ImmAssAtt (3.1(a)), ImmAssLoss (3.2(a))
Elem. Object: Cell
Unit: None
Remarks: Phantom RACHs are channel required messages not foreseen for the observed cell. The Immediate Assignment procedure to allocate an SDCCH/TCH is then started, but will not be successful, because no MS will reply with a SABM message and therefore a BTS Timer will expire. These unforeseen messages will also be counted (in ImmAssAtt).
3.9 AGCH Loss Rate CS
Long name: (a) AGCH Loss Rate CS
Short name: (a) AGCHLossRateCS
Description: These indicators will give you the AGCH Block Rate by meaning of not transmitted Immediate Assignment Command messages over the AGCH on the Air Interface. Reason for AGCH failures are mainly AGCH overload. This formula is related to MS point of view, by meaning each MS related immediate assignment procedure should be stepped once.
Therefore events, where no SDCCH/TCH was available or BTS channel activation failures are counted in the formula ‘Number of Immediate Assignment Losses’. => Only Delete Indication messages related to Immediate Assignment Command messages not containing an Immediate Assignment reject messages will rightly be considered.
Formula: (a)
]TACCBPRO[2
]NACSUCPR[2 - ]TACCBPRO[2 teCSAGCHLossRa =
Used param.: TACCBPRO [2], NACSUCPR [2]
Elem. Object: Cell
Unit: None
Remarks: Phantom RACHs are channel required messages not foreseen for the observed cell. The Immediate Assignment procedure to allocate an SDCCH/TCH is then started, but will not be successful, because no MS will reply with a SABM message and therefore a BTS Timer will expire. These unforeseen messages will also be counted.
Information PM: SBS Key Performance Indicators System
19 A50016-G5100-A042-1-7618
3.10 Immediate Assignment without MS Seizure Rate
Long name: (a) Immediate Assignment without MS Seizure Rate
Short name: (a) ImmAssNoSeizRate
Description: These indicators will give you the immediate assignment without MS seizure rate. The main reasons for this behaviour are Phantom RACHs, messages not foreseen for the observed cell. Other reasons are not received SABM messages due to air interface problems. This formula will count number of not answered Immediate Assignment Command messages related to the Immediate Assignment Command messages sent to the MS.
Formula: (a)
GCHImmAssCmdA
izImmAssNoSe izRateImmAssNoSe =
Used param.: ImmAssNoSeiz (3.6(a)), ImmAssCmdAGCH (3.5(a))
Elem. Object: Cell
Unit: None
Remarks: The formula will mainly detect Phantom RACHs. Phantom RACHs are channel required messages not foreseen for the observed cell. The Immediate Assignment procedure to allocate an SDCCH/TCH is started, but will not be successful, because no MS will reply with a SABM message. A BTS Timer will expire.
3.11 Immediate Assignment Success Rate
Long name: (a) Immediate Assignment Success Rate
Short name: (a) ImmAssSuccRate
Description: These indicators will give you the immediate assignment success rate from MS point of view. An Immediate Assignment procedure is successful if the BTS returns an establishment indication message.
Formula: (a)
mAssNoSeizImmAssAttIm
ImmAssSucc RateImmAssSucc
−=
Used param.: ImmAssAtt (3.1(a)), ImmAssSucc (3.7(a)), ImmAssNoSeiz (3.6(a))
Elem. Object: Cell
Unit: None
Remarks: Phantom RACHs are not included in this formula, because they are not related to MS of the observed cell.
Um-Interface problems may lead to decoding errors of the Mobile’s L2 SABM-frame and therefore are not considered here.
Information PM: SBS Key Performance Indicators System
20 A50016-G5100-A042-1-7618
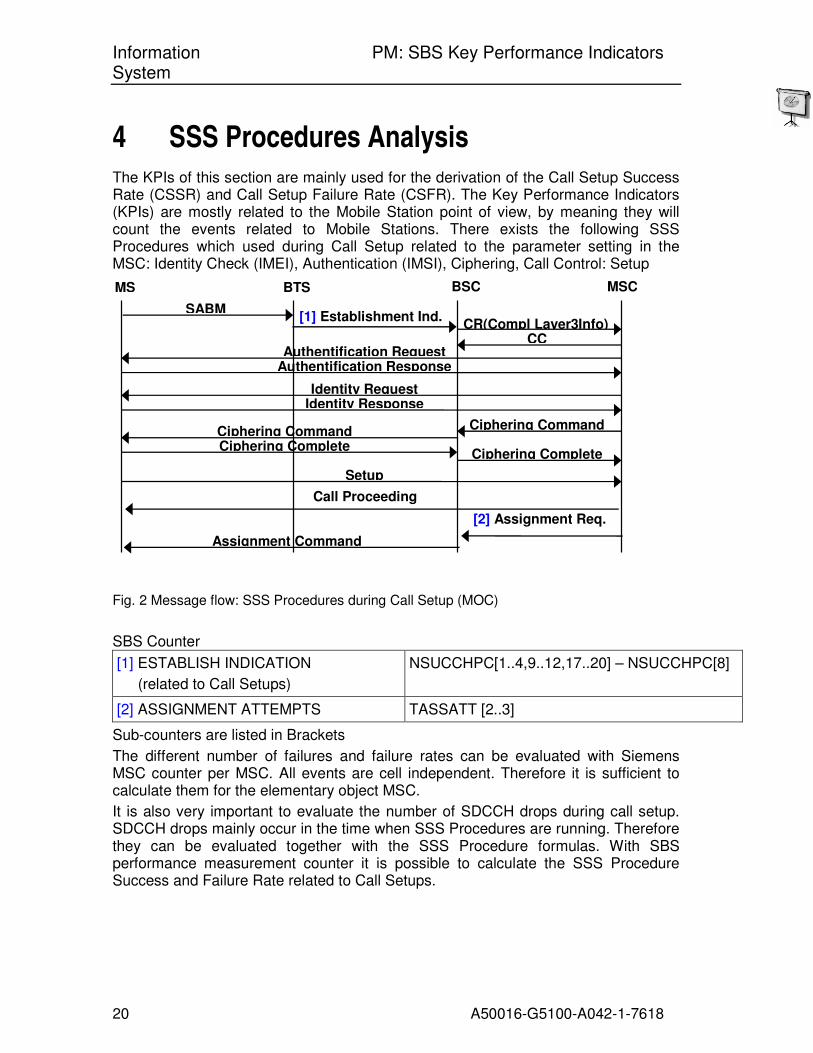
4 SSS Procedures Analysis The KPIs of this section are mainly used for the derivation of the Call Setup Success Rate (CSSR) and Call Setup Failure Rate (CSFR). The Key Performance Indicators (KPIs) are mostly related to the Mobile Station point of view, by meaning they will count the events related to Mobile Stations. There exists the following SSS Procedures which used during Call Setup related to the parameter setting in the MSC: Identity Check (IMEI), Authentication (IMSI), Ciphering, Call Control: Setup
Fig. 2 Message flow: SSS Procedures during Call Setup (MOC)
SBS Counter
[1] ESTABLISH INDICATION
(related to Call Setups)
NSUCCHPC[1..4,9..12,17..20] – NSUCCHPC[8]
[2] ASSIGNMENT ATTEMPTS TASSATT [2..3]
Sub-counters are listed in Brackets
The different number of failures and failure rates can be evaluated with Siemens MSC counter per MSC. All events are cell independent. Therefore it is sufficient to calculate them for the elementary object MSC.
It is also very important to evaluate the number of SDCCH drops during call setup. SDCCH drops mainly occur in the time when SSS Procedures are running. Therefore they can be evaluated together with the SSS Procedure formulas. With SBS performance measurement counter it is possible to calculate the SSS Procedure Success and Failure Rate related to Call Setups.
BTS BSC MS
SABM [1] Establishment Ind.
CC Authentification Request
Authentification Response
Ciphering Complete
Ciphering Command
MSC
CR(Compl Layer3Info)
Identity Request Identity Response
Ciphering Command Ciphering Complete
Setup
[2] Assignment Req.
Assignment Command
Call Proceeding
Information PM: SBS Key Performance Indicators System
21 A50016-G5100-A042-1-7618
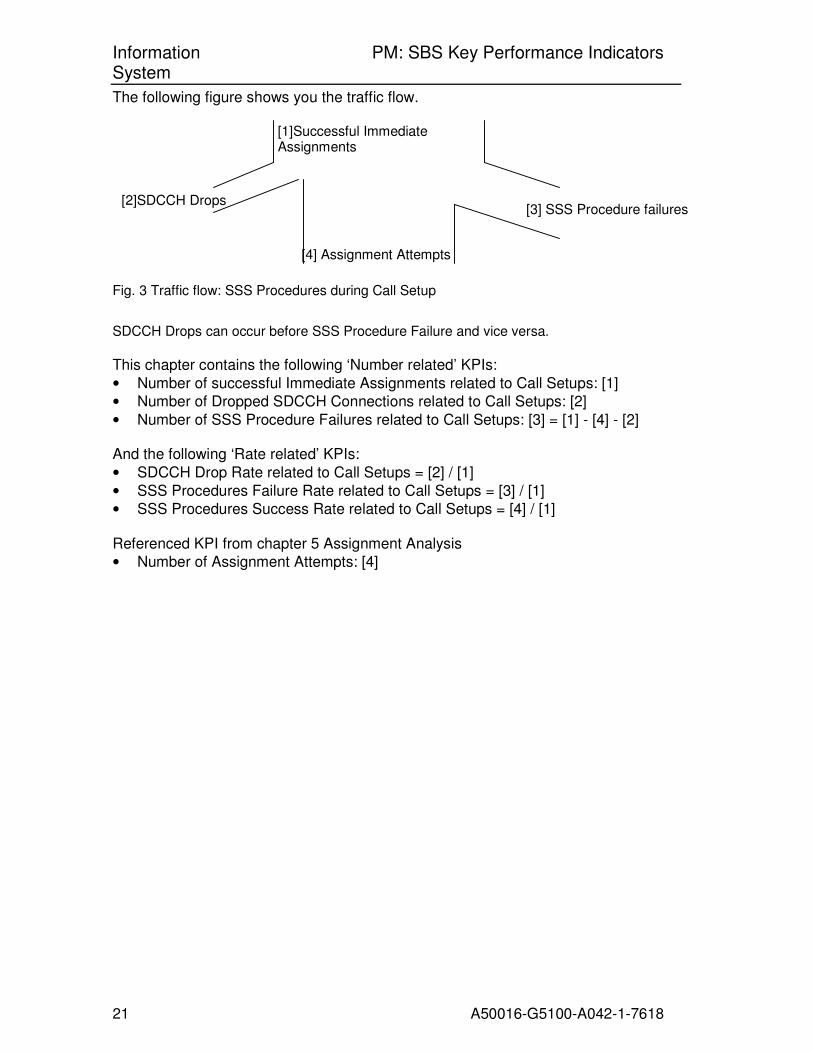
The following figure shows you the traffic flow.
Fig. 3 Traffic flow: SSS Procedures during Call Setup
SDCCH Drops can occur before SSS Procedure Failure and vice versa.
This chapter contains the following ‘Number related’ KPIs:
• Number of successful Immediate Assignments related to Call Setups: [1]
• Number of Dropped SDCCH Connections related to Call Setups: [2]
• Number of SSS Procedure Failures related to Call Setups: [3] = [1] - [4] - [2] And the following ‘Rate related’ KPIs:
• SDCCH Drop Rate related to Call Setups = [2] / [1]
• SSS Procedures Failure Rate related to Call Setups = [3] / [1]
• SSS Procedures Success Rate related to Call Setups = [4] / [1] Referenced KPI from chapter 5 Assignment Analysis
• Number of Assignment Attempts: [4]
[2]SDCCH Drops [3] SSS Procedure failures
[4] Assignment Attempts
[1]Successful Immediate Assignments
Information PM: SBS Key Performance Indicators System
22 A50016-G5100-A042-1-7618
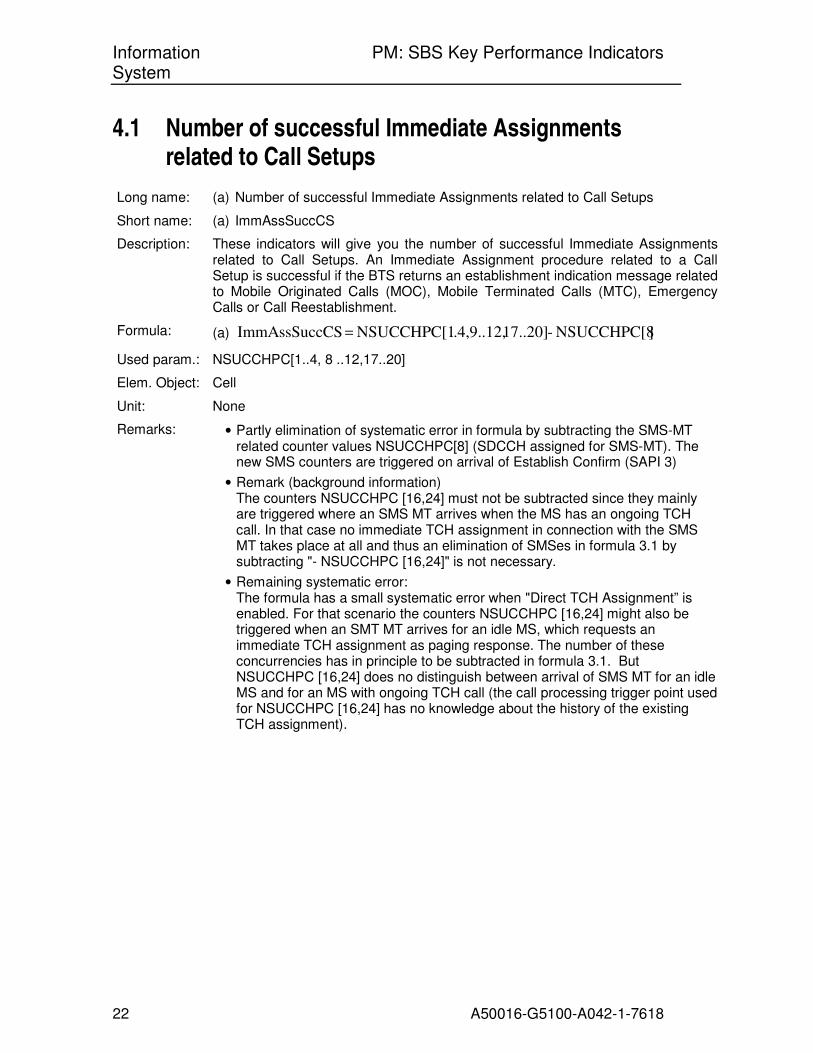
4.1 Number of successful Immediate Assignments related to Call Setups
Long name: (a) Number of successful Immediate Assignments related to Call Setups
Short name: (a) ImmAssSuccCS
Description: These indicators will give you the number of successful Immediate Assignments related to Call Setups. An Immediate Assignment procedure related to a Call Setup is successful if the BTS returns an establishment indication message related to Mobile Originated Calls (MOC), Mobile Terminated Calls (MTC), Emergency Calls or Call Reestablishment.
Formula: (a) ]NSUCCHPC[8 - 17..20]..4,9..12,NSUCCHPC[1 ssSuccCSImmA =
Used param.: NSUCCHPC[1..4, 8 ..12,17..20]
Elem. Object: Cell
Unit: None
Remarks: • Partly elimination of systematic error in formula by subtracting the SMS-MT related counter values NSUCCHPC[8] (SDCCH assigned for SMS-MT). The new SMS counters are triggered on arrival of Establish Confirm (SAPI 3)
• Remark (background information) The counters NSUCCHPC [16,24] must not be subtracted since they mainly are triggered where an SMS MT arrives when the MS has an ongoing TCH call. In that case no immediate TCH assignment in connection with the SMS MT takes place at all and thus an elimination of SMSes in formula 3.1 by subtracting "- NSUCCHPC [16,24]" is not necessary.
• Remaining systematic error: The formula has a small systematic error when "Direct TCH Assignment” is enabled. For that scenario the counters NSUCCHPC [16,24] might also be triggered when an SMT MT arrives for an idle MS, which requests an immediate TCH assignment as paging response. The number of these concurrencies has in principle to be subtracted in formula 3.1. But NSUCCHPC [16,24] does no distinguish between arrival of SMS MT for an idle MS and for an MS with ongoing TCH call (the call processing trigger point used for NSUCCHPC [16,24] has no knowledge about the history of the existing TCH assignment).

Information PM: SBS Key Performance Indicators System
23 A50016-G5100-A042-1-7618
4.2 Number of Dropped SDCCH Connections related to Call Setups
Long name: (a) Number of Dropped SDCCH Connections related to Call Setups
Short name: (a) SDCCHDropCS
Description: This indicator will give you the number of dropped SDCCH connections related to Call Setups. SDCCH drops mainly occur during running SSS Procedures. This formula is related to the assumption that the number of dropped SDCCH connections is random distributed to all kind of assignment causes (MOC, MTC, Locupd, …). Therefore this formula contains a factor for the ratio of MOC and MTC to all kind of assignment causes to get the relation to Call Setups.
Formula:
(a) ImmAssSucc
CSImmAssSucc * SDCCHDrop SSDCCHDropC =
Used param.: SDCCHDrop(8.1(a)), ImmAssSucc (3.7(a)), ImmAssSuccCS (4.1(a))
Elem. Object: Cell
Unit: None
Remarks:
4.3 Number of SSS Procedure Failures related to Call Setups
Long name: (a) Number of SSS Procedure Failures related to Call Setups
Short name: (a) SSSProcFailCS
Description: This indicator will give you the number of SSS Procedure failures related to Call Setups.
Formula: (a) SSDCCHDropC -AssAtt - CSImmAssSucc lCSSSSProcFai =
Used param.: ImmAssSuccCS (4.1(a), AssAtt (5.1(a)), SDCCHDropCS (4.2(a))
Elem. Object: Cell
Unit: None
Remarks: Please note that Authentication-, Identity-, Ciphering- and MSC failures are counted in this formula although they are not related to the BSS. User Release before assignment of a TCH is also included in this formula. Assignments of SDCCH are not considered.
Information PM: SBS Key Performance Indicators System
24 A50016-G5100-A042-1-7618
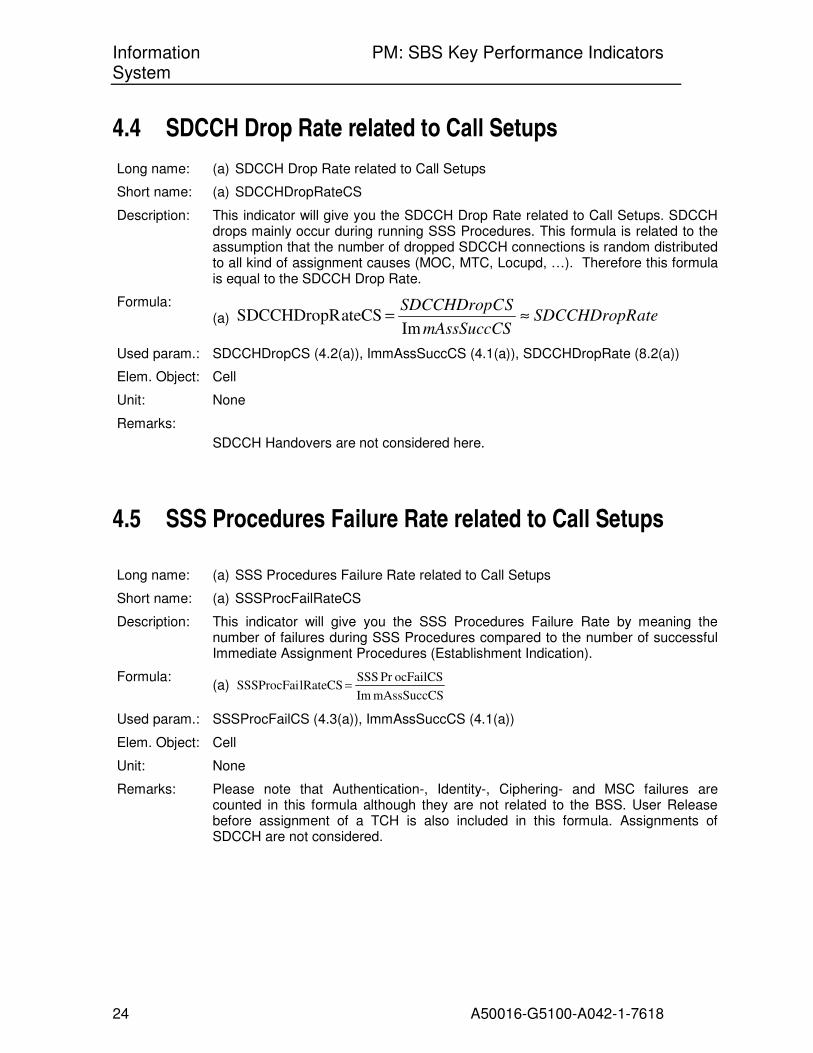
4.4 SDCCH Drop Rate related to Call Setups
Long name: (a) SDCCH Drop Rate related to Call Setups
Short name: (a) SDCCHDropRateCS
Description: This indicator will give you the SDCCH Drop Rate related to Call Setups. SDCCH drops mainly occur during running SSS Procedures. This formula is related to the assumption that the number of dropped SDCCH connections is random distributed to all kind of assignment causes (MOC, MTC, Locupd, …). Therefore this formula is equal to the SDCCH Drop Rate.
Formula: (a) ateSDCCHDropR
mAssSuccCS
SSDCCHDropC≈=
Im ateCSSDCCHDropR
Used param.: SDCCHDropCS (4.2(a)), ImmAssSuccCS (4.1(a)), SDCCHDropRate (8.2(a))
Elem. Object: Cell
Unit: None
Remarks:
SDCCH Handovers are not considered here.
4.5 SSS Procedures Failure Rate related to Call Setups
Long name: (a) SSS Procedures Failure Rate related to Call Setups
Short name: (a) SSSProcFailRateCS
Description: This indicator will give you the SSS Procedures Failure Rate by meaning the number of failures during SSS Procedures compared to the number of successful Immediate Assignment Procedures (Establishment Indication).
Formula: (a)
mAssSuccCSIm
ocFailCSPrSSS lRateCSSSSProcFai =
Used param.: SSSProcFailCS (4.3(a)), ImmAssSuccCS (4.1(a))
Elem. Object: Cell
Unit: None
Remarks: Please note that Authentication-, Identity-, Ciphering- and MSC failures are counted in this formula although they are not related to the BSS. User Release before assignment of a TCH is also included in this formula. Assignments of SDCCH are not considered.

Information PM: SBS Key Performance Indicators System
25 A50016-G5100-A042-1-7618
4.6 SSS Procedures Success Rate related to Call Setups
Long name: (a) SSS Procedures Success Rate related to Call Setups
(b) Total SSS Procedures Success Rate related to Call Setups
Short name: (a) SSSProcSuccRateCS
(b) SSSProcSuccRateCStotal
Description: The first Indicator will give you the SSS Procedures Success Rate related to Call Setups by meaning the rate for successful allocated Timeslots from MSC point of view (Assignment Request Message) minus the SDCCH Drop Rate related to Call Setups. This indicator is related to the Radio Network and is therefore recommended to find out Radio Network failures.
The second indicator will give you the SSS Procedures Success Rate related to Call Setups by meaning the number of started Assignment Procedures (Assignment Requests) compared to the number of successful Immediate Assignment Procedures (Establishment Indications) related to Call Setups. Authentication-, Identity-, Ciphering- and MSC failures are among others counted within this indicator although they are not related to the BSS.
Formula: (a) ateCSSDCCHDropR - 1 cRateCSSSSProcSuc =
(b) CSImmAssSucc
AssAtt alcRateCStotSSSProcSuc = or
CSocFailRatePrSSSateCSSDCCHDropR1 alcRateCStotSSSProcSuc −−=
Used param.: ImmAssSuccCS (4.1(a)), AssAtt (5.1(a)), SDCCHDropRateCS (4.4(a)), SSSProcFailRateCS (4.5(a))
Elem. Object: Cell
Unit: None
Remarks: SSSProcSuccRateCStotal:
Please note that Authentication-, Identity-, Ciphering- and MSC failures will lead to a worse Success Rate although they are not related to the BSS. User Release before assignment of a TCH is also included in the second formula. Assignments of SDCCH are not considered.

Information PM: SBS Key Performance Indicators System
26 A50016-G5100-A042-1-7618
5 Assignment Analysis The KPIs of this section are mainly used for the derivation of the Call Setup Success Rate (CSSR) and Call Setup Failure Rate (CSFR). The Key Performance Indicators (KPIs) are mostly related to the Mobile Station point of view, by meaning they will count the events related to Mobile Stations. The message flow of the Assignment Procedure is listed below (normal case). The numbers in brackets will indicate available SBS performance measurements.
Fig. 4 Message flow: Assignment Procedure (normal case)
BSS Counter:
[1] ASSIGMENT ATTEMPS TASSATT [2..3]
[2] INCOMING REDIRECTED TASSSUCC [4..5]
[3] OUTGOING REDIRECTED CALLS SINTHINT [7] + SUINBHDO [11*n+7]; n = 0 ...31 (n= number of GSM ADJ-ids) +
7] m*0SUOISHDO[1 + ; m = 0 ...63
(m= number of UMTS ADJ-ids)
[4] ASSIGMENT COMPLETE (normal Assignm.) TASSSUCC [2..3]
[5] ASSIGMENT FAILURE TASSFAIL [6,7,8,10,11,12,13,15]
[6] Queuing Failure NMSGDISQ [1,2]
MS BTS BSC MSC
ASSIGNMENT REQUEST
CHAN ACTIV
ASSIGNMENT COMMAND
CHAN ACTIV ACK
SABM
CHANNEL ACTIV NEG ACK
ASSIGNMENT COMMAND
ASSIGNMENT FAILURE
ASSIGNMENT COMPLETE
[5] TASSFAIL
UA
ASSIGNMENT COMPLETE
ESTABLISH INDICATION(TNTCHCL)
ASSIGNMENT COMPLETE
[1] TASSATT
[4] TASSSUCC
PHYS CONTEXT REQ
PHYS CONTEXT CONF
(MTCHBUTI)

Information PM: SBS Key Performance Indicators System
27 A50016-G5100-A042-1-7618
The following figure shows you the traffic flow.
Fig. 5 Traffic flow: Assignment Procedure
The observed cell is the cell where the call establishment has been started (immediate assignment procedure). By aid of the feature Directed Retry a TCH may be assigned in a cell different from the observed cell. Also in that case the “success” is counted for the observed cell.
The Assignment procedure is used to allocate a TCH. Because of new feature the Assignment Success Rate is not easy to evaluate. The Directed Retries have also to be considered. The concept how to evaluate Directed Retries for the Assignment Success Rate is comparable with the Handover Success Rate, where only outgoing Handover will be considered. Therefore all Directed Retries for an observed cell have to be counted, which where started in the observed cell and were successful in any target cell with neighbor cell measurements.
Under this assumption the Assignment Success Rate can be evaluated as follows:
Assignment Success Rate = (Assignment Complete [4] + Successful outgoing redirected Calls [3]) / Assignment Attempts [1]
This chapter contains the following ‘Number related’ KPIs:
• Number of Assignment Attempts: [1], see chapter 5.1.
• Number of Assignment Failures: [5] ,see chapters 5.2(a), (b), (c)
• Number of successful Assignments = [3]+[4], see chapter 5.3
• Number of Queuing Failures: [6], see chapter 5.2(d) This chapter contains the following ‘Rate related’ KPIs:
• Assignment Failure Rate, see chapter 5.4
• Assignment Success Rate, see chapter 5.5
• Assignment success rate when radio resources available, see chapter 5.6(a)
Single Cell / Observed Cell
[1] Assignment Attempts
[4] Assignment Complete [3] Successful Outgoing
redirected Calls
[2] Successful inc. redirected Calls
[5] Assignment Failure
[6] Queuing Failure
[3]+[4] Assignment success
Information PM: SBS Key Performance Indicators System
28 A50016-G5100-A042-1-7618
5.1 Number of Assignment Attempts
Long name: (a) Number of Assignment Attempts
Short name: (a) AssAtt
Description: These indicators will give you the number of Assignment procedures started by the MSC.
Formula: (a) 3]TASSATT[2, AssAtt =
Used param.: TASSATT[2,3]
Elem. Object: Cell
Unit: None
Remarks: Only TCH assignments are considered. Assignments of SDCCHs are not considered.
Only the assignment procedure triggered by the MSC is considered but not the Immediate Assignment procedure.
Incoming handovers are also not considered.
Information PM: SBS Key Performance Indicators System
29 A50016-G5100-A042-1-7618
5.2 Number of Assignment Failures
Long name: (a) Number of TCH Losses
(b) Number of Assignment Failures by Message
(c) Number of Assignment Failures due to other Reason
(d) Number of Queuing Failures
(e) Total Number of Assignment Failures
Short name: (a) TCHLoss
(b) AssFailbyMess
(c) AssFailOther
(d) QueFail
(e) AssFail
Description: These indicators will give you the number of failed Assignments of a TCH.
Formula: (a) ,13]TASSFAIL[8 TCHLoss =
(b) 2,15],7,10,11,1TASSFAIL[6 essAssFailbyM =
(c) QueFail-essAssFailbyM -TCHLoss - AssSucc -AssAtt er AssFailOth =
(d) ,2]NMSGDISQ[1 QueFail =
(e) 2]NRCLRREQ[210..13,15] ..8,TASSFAIL[6 AssFail +=
Used param.: TASSFAIL [6,7,8,10,11,12,13,15], AssAtt (5.1(a)) , AssSucc (5.3(a)), NMSGDSIQ[1,2], NRCLRREQ[22]
Elem. Object: Cell
Unit: None
Remarks: • Directed Retries are not considered, because they are not related to assignment failures
• Assignments of SDCCH are not considered.
• Sub-counters TASSFAIL[10] and TASSFAIL[15] ('All other causes') used in formula (b) includes the A-interface and equipment related causes (see GSM 08.08).
• Queuing failures are completely covered in formula (e). Measurement NMSDISQ[1,2] must not be added. But measurement NRCLRREQ[22] is included in case a queued subscriber is pre-empted before expiry of timer T11.
• Formula (c) AssFailOther contains all other causes related to internal and transmission failures.
Information PM: SBS Key Performance Indicators System
30 A50016-G5100-A042-1-7618
5.3 Number of successful Assignments
Long name: (a) Number of successful Assignments
Short name: (a) AssSucc
Description: These indicators will give you the number of successful completed Assignment procedures. Successful completed Assignment procedures are incremented even with successful outgoing directed retry, because it represents an assignment of TCH for the originating cell.
Formula:
(a) ∑∑
==
+++++
=
63
0m
31
0n
7] m*0SUOISHDO[1 7]n *0SUINBHDO[1 ]SINTHINT[7
,3]TASSSUCC[2 AssSucc
with n for the number of GSM neighbourcell relation (n=0..31)
with m for the number of UMTS neighbourcell relation (m=0..63)
Used param.: TASSSUCC[2,3], SINTHINT[7], 7] m*0SUOISHDO[1 7],n*0SUINBHDO[1 ++
Elem. Object: Cell
Unit: None
Remarks: • Assignments of SDCCH are not considered.
• Intersystem Directed Retry to UMTS are considered
Information PM: SBS Key Performance Indicators System
31 A50016-G5100-A042-1-7618
5.4 Assignment Failure Rate
Long name: (a) TCH Blocking Rate
(b) Assignment Failure Rate by Message
(c) Assignment Failure Rate due to other Reason
(d) Queuing Failure Rate
(e) Assignment Failure Rate
Short name: (a) TCHBlockRate
(b) AssFailbyMessRate
(c) AssFailOtherRate
(d) QueFailRate
(e) AssFailRate
Description: These indicators will give you the Assignment Failure Rates. The Assignment procedure is unsuccessful if the BSC returns a Assignment Failure message to the MSC or if the directed retry in the target cell was not successful.
Formula: (a)
AssAtt
TCHLoss teTCHBlockRa =
(b) AssAtt
essAssFailbyM essRateAssFailbyM =
(c) AssAtt
erAssFailOth erRateAssFailOth =
(d) AssAtt
QueFail eQueFailRat =
(e) AssAtt
AssFail eAssFailRat =
Used param.: AssAtt(5.1(a)), TCHLoss (5.2(a)), AssFailbyMess (5.2(b)), AssFailOther (5.2(c)), QueFail (5.2(d)), AssFail (5.2(d)),
Elem. Object: Cell
Unit: None
Remarks: • Directed Retries are not considered, because they ares not related to assignment failures.
• Assignments of SDCCH are not considered
Information PM: SBS Key Performance Indicators System
32 A50016-G5100-A042-1-7618
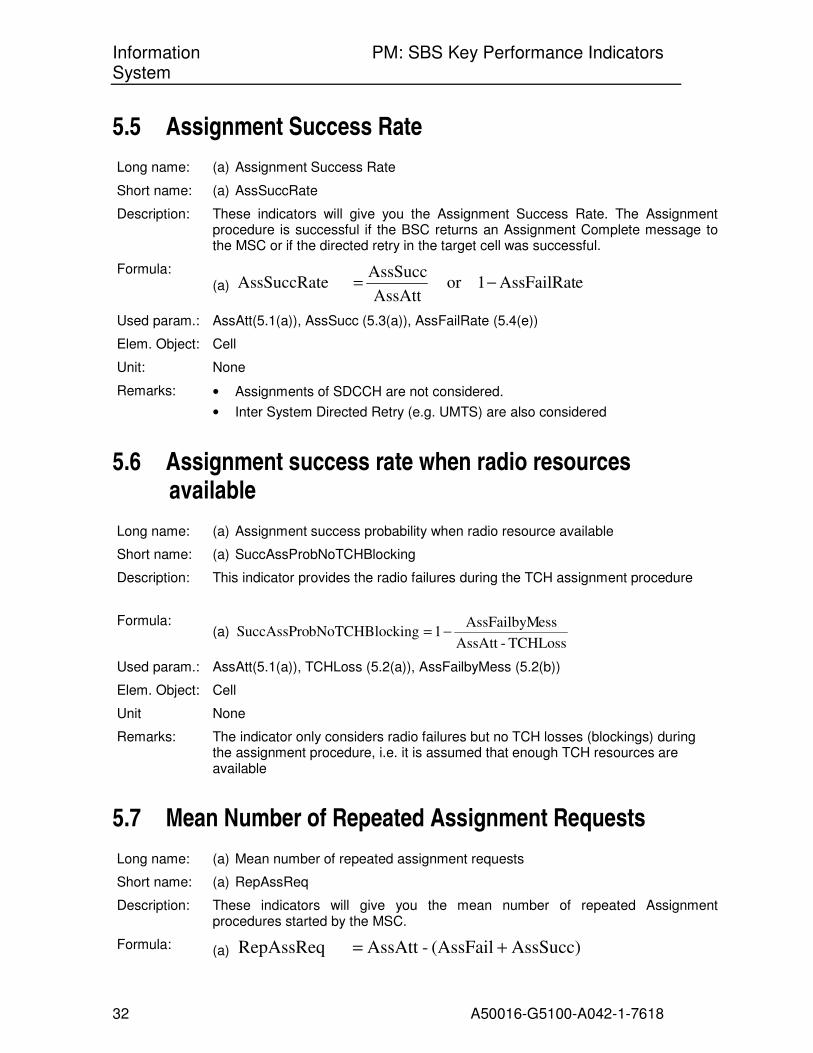
5.5 Assignment Success Rate
Long name: (a) Assignment Success Rate
Short name: (a) AssSuccRate
Description: These indicators will give you the Assignment Success Rate. The Assignment procedure is successful if the BSC returns an Assignment Complete message to the MSC or if the directed retry in the target cell was successful.
Formula: (a) eAssFailRat1or
AssAtt
AssSucc eAssSuccRat −=
Used param.: AssAtt(5.1(a)), AssSucc (5.3(a)), AssFailRate (5.4(e))
Elem. Object: Cell
Unit: None
Remarks: • Assignments of SDCCH are not considered.
• Inter System Directed Retry (e.g. UMTS) are also considered
5.6 Assignment success rate when radio resources available
Long name: (a) Assignment success probability when radio resource available
Short name: (a) SuccAssProbNoTCHBlocking
Description: This indicator provides the radio failures during the TCH assignment procedure
Formula: (a)
TCHLoss-AssAtt
essAssFailbyM1kingbNoTCHBlocSuccAssPro −=
Used param.: AssAtt(5.1(a)), TCHLoss (5.2(a)), AssFailbyMess (5.2(b))
Elem. Object: Cell
Unit None
Remarks: The indicator only considers radio failures but no TCH losses (blockings) during the assignment procedure, i.e. it is assumed that enough TCH resources are available
5.7 Mean Number of Repeated Assignment Requests
Long name: (a) Mean number of repeated assignment requests
Short name: (a) RepAssReq
Description: These indicators will give you the mean number of repeated Assignment procedures started by the MSC.
Formula: (a) AssSucc) (AssFail -AssAtt RepAssReq +=

Information PM: SBS Key Performance Indicators System
33 A50016-G5100-A042-1-7618
Used param.: AssAtt(5.1(a)), AssSucc (5.3(a)), AssFail (5.2(e)),
Elem. Object: Cell
Unit: None
Remarks: Only TCH assignments are considered. Assignments of SDCCHs are not considered.
Only the assignment procedure triggered by the MSC is considered but not the Immediate Assignment procedure.
Incoming handovers are also not considered.
5.8 Repeated Assignment Request Rate
Long name: (a) Repeated Assignment Request Rate
Short name: (a) RepAssReqRate
Description: These indicators will give you the repeated Assignment Request Rate.
Formula: (a)
AssSucc AssFail
AssAtt ateRepAssReqR
+=
Used param.: AssAtt(5.1(a)), AssSucc (5.3(a)), AssFail (5.2(d))
Elem. Object: Cell
Unit: None
Remarks: None
5.9 Assignment Success Rate for receiver supporting ARP technology
Long name: (a) Assignment Success Rate for ARP receiver
Short name: (a) AssSuccRateARP
Description: This indicator will provide the Assignment Success Rate for receiver supporting the Advanced Receiver Performance (ARP) technology. The Assignment procedure is successful if the BSC returns an Assignment Complete message to the MSC.
Formula: (a)
[1,2] SUCTCHARP
NASSARP[1]eARPAssSuccRat =
Used param.: NASSARP[1], SUCTCHARP[1,2]
Elem. Object: Cell
Unit: None
Remarks: • Assignments of SDCCH are not considered.
• Due to a lack of ARP specific counters for HO scenarios, output from this formula cannot be compared with output from the overall Assignment Success Rate formula AssSucc (5.5(a)
• ARP-type receivers will be a synonym for Single Antenna Interference Cancellation (SAIC) – type receivers.

Information PM: SBS Key Performance Indicators System
34 A50016-G5100-A042-1-7618
6 Call Setup Analysis The KPIs of the previous sections are mainly used for the derivation of the Call Setup Success Rate (CSSR) and Call Setup Failure Rate (CSFR). The Call Setup Success Rate and Call Setup Failure Rate are related to the Mobile Station point of view, by meaning they will count the events related to Mobile Stations.
Overview Call Setup Analysis
CS
(6.3) CSSR
Call Setup Success Rate BSS
(6.5) CSFR
Call Setup Failure Rate
Call Setup Failure Rate due to Immediate Assignment Losses
Call Setup Failure Rate due to AGCH
Call Setup Failure Rate due to Immediate Assignment without MS Seizure
Call Setup Failure Rate due to SDCCH Drops
Call Setup Failure Rate due to SSS Procedure Failure
Call Setup Failure Rate due to TCH Loss
Call Setup Failure Rate due to Assignment Failures by Message
Call Setup Failure Rate due to Assignment Failures with other Reasons
Call Setup Failure Rate due to Queuing Failures
Comparable Overview can also be done for the ‘Number Related KPIs’
This chapter contains the following ‘Number related’ KPIs:
• Number of Call Setup Attempts
• Number of Successful Call Setups
• Number of Call Setup Failures And the following ‘Rate related’ KPIs:
• Call Setup Success Rate
• Call Setup Failure Rate
Information PM: SBS Key Performance Indicators System
35 A50016-G5100-A042-1-7618
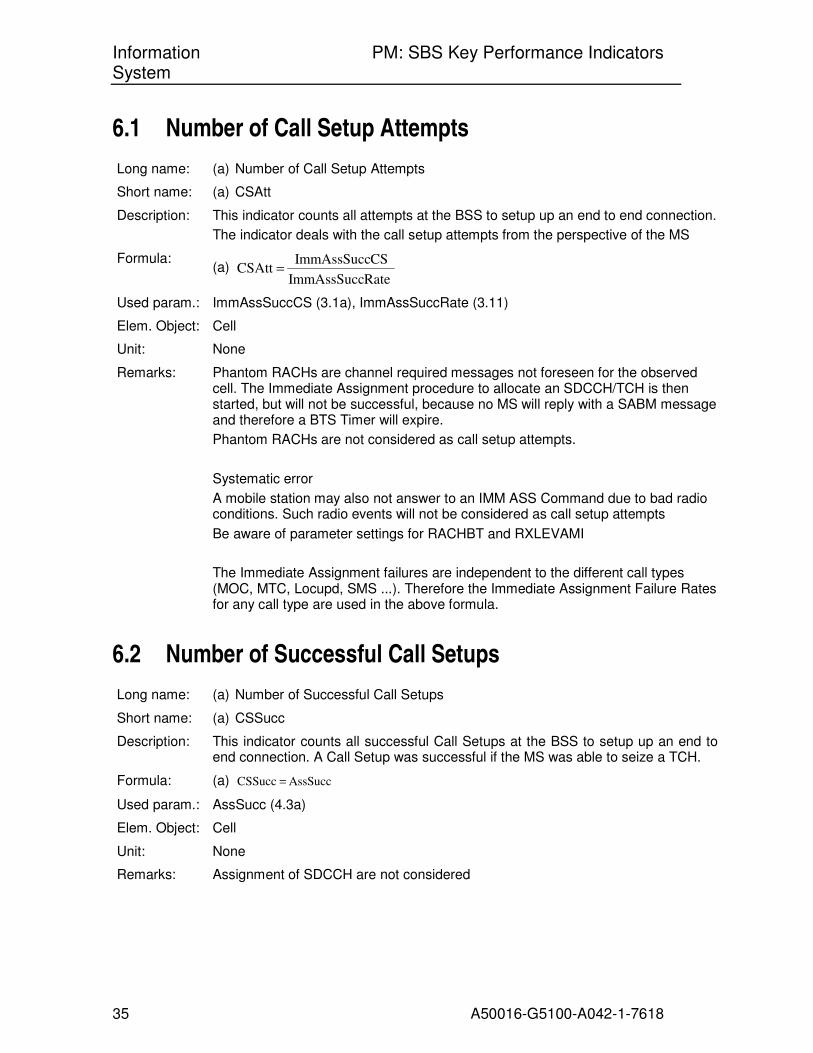
6.1 Number of Call Setup Attempts
Long name: (a) Number of Call Setup Attempts
Short name: (a) CSAtt
Description: This indicator counts all attempts at the BSS to setup up an end to end connection.
The indicator deals with the call setup attempts from the perspective of the MS
Formula: (a)
RateImmAssSucc
CSImmAssSucc CSAtt =
Used param.: ImmAssSuccCS (3.1a), ImmAssSuccRate (3.11)
Elem. Object: Cell
Unit: None
Remarks: Phantom RACHs are channel required messages not foreseen for the observed cell. The Immediate Assignment procedure to allocate an SDCCH/TCH is then started, but will not be successful, because no MS will reply with a SABM message and therefore a BTS Timer will expire.
Phantom RACHs are not considered as call setup attempts.
Systematic error
A mobile station may also not answer to an IMM ASS Command due to bad radio conditions. Such radio events will not be considered as call setup attempts
Be aware of parameter settings for RACHBT and RXLEVAMI
The Immediate Assignment failures are independent to the different call types (MOC, MTC, Locupd, SMS ...). Therefore the Immediate Assignment Failure Rates for any call type are used in the above formula.
6.2 Number of Successful Call Setups
Long name: (a) Number of Successful Call Setups
Short name: (a) CSSucc
Description: This indicator counts all successful Call Setups at the BSS to setup up an end to end connection. A Call Setup was successful if the MS was able to seize a TCH.
Formula: (a) AssSucc CSSucc =
Used param.: AssSucc (4.3a)
Elem. Object: Cell
Unit: None
Remarks: Assignment of SDCCH are not considered

Information PM: SBS Key Performance Indicators System
36 A50016-G5100-A042-1-7618
6.3 Call Setup Success Rate
Long name: (a) Call Setup Success Rate
(b) Call Setup Success Rate BSS
Short name: (a) CSSuccRate
(b) CSSuccRateBSS
Description: This indicator will give you the BSS observed Call Setup Success Rate to setup up an end to end connection. Two indicators are available, one that takes into account all Call Setup rejections (BSS immediate assignment, SSS security and TCH assignment), one that only takes into account BSS related Call Setup rejections (BSS immediate assignment and TCH assignment).
Formula: (a) eAssSuccRat * alcRateCStotSSSProcSuc * RateImmAssSucc CSSuccRate =
(b) eAssSuccRat * ateCS)SDCCHDropR - 1 (* RateImmAssSucc BSSCSSuccRate =
Used param.: ImmAssSuccRate (3.11(a)), SSSProcSuccRateCStotal (4.6(b)), AssSuccRate (5.5(a)), SDCCHDropRateCS (4.4(a))
Elem. Object: Cell
Unit: None
Remarks: BR7: correction CSSuccRateBSS: factor (1-SDCCHDropRateCS) included in formula
BR7: KPI CSSuccRateSSS cancelled (just another name for KPI SSSProcSuccRateCStotal (4.6(b))
Systematic errors can occur as described in the used KPIs.
6.4 Number of Call Setup Failures
Long name: (a) Number of Call Setup Failures
(b) Number of Call Setup Failures due to Immediate Assignment Losses
(c) Number of Call Setup Failures due to AGCH Blocking
(d) Number of Call Setup Failures due to Immediate Assignment without MS Seizure
(e) Number of Call Setup Failures due to SDCCH Drops
(f) Number of Call Setup Failures due to SSS Procedure Failure
(g) Number of Call Setup Failures due to TCH Loss
(h) Number of Call Setup Failures due to Assignment Failures by Message
(i) Number of Call Setup Failures due to Assignment Failures with other Reasons
(j) Number of Call Setup Failures due to Queuing Failures
Short name: (a) CSFail
(b) CSFailImmAssLoss
(c) CSFailAGCHLoss
(d) CSFailImmAssNoSeiz
Information PM: SBS Key Performance Indicators System
37 A50016-G5100-A042-1-7618
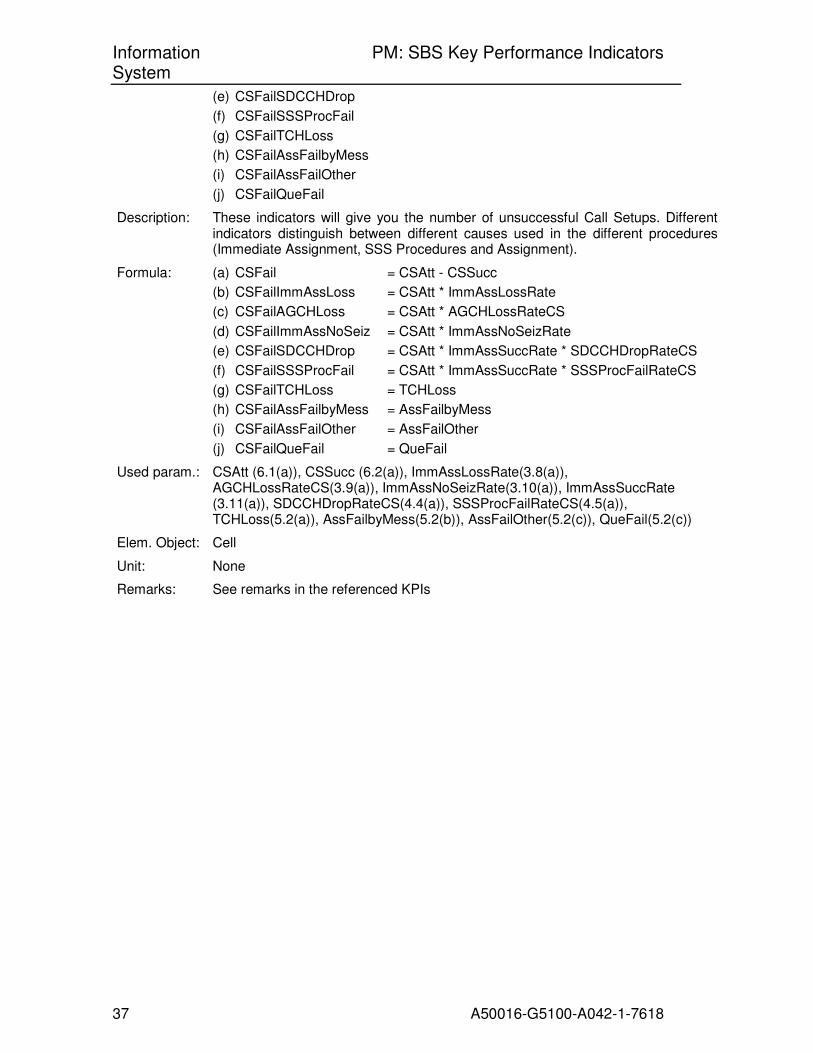
(e) CSFailSDCCHDrop
(f) CSFailSSSProcFail
(g) CSFailTCHLoss
(h) CSFailAssFailbyMess
(i) CSFailAssFailOther
(j) CSFailQueFail
Description: These indicators will give you the number of unsuccessful Call Setups. Different indicators distinguish between different causes used in the different procedures (Immediate Assignment, SSS Procedures and Assignment).
Formula: (a) CSFail = CSAtt - CSSucc
(b) CSFailImmAssLoss = CSAtt * ImmAssLossRate
(c) CSFailAGCHLoss = CSAtt * AGCHLossRateCS
(d) CSFailImmAssNoSeiz = CSAtt * ImmAssNoSeizRate
(e) CSFailSDCCHDrop = CSAtt * ImmAssSuccRate * SDCCHDropRateCS
(f) CSFailSSSProcFail = CSAtt * ImmAssSuccRate * SSSProcFailRateCS
(g) CSFailTCHLoss = TCHLoss
(h) CSFailAssFailbyMess = AssFailbyMess
(i) CSFailAssFailOther = AssFailOther
(j) CSFailQueFail = QueFail
Used param.: CSAtt (6.1(a)), CSSucc (6.2(a)), ImmAssLossRate(3.8(a)), AGCHLossRateCS(3.9(a)), ImmAssNoSeizRate(3.10(a)), ImmAssSuccRate (3.11(a)), SDCCHDropRateCS(4.4(a)), SSSProcFailRateCS(4.5(a)), TCHLoss(5.2(a)), AssFailbyMess(5.2(b)), AssFailOther(5.2(c)), QueFail(5.2(c))
Elem. Object: Cell
Unit: None
Remarks: See remarks in the referenced KPIs

Information PM: SBS Key Performance Indicators System
38 A50016-G5100-A042-1-7618
6.5 Call Setup Failure Rate
Long name: (a) Call Setup Failure Rate
(b) Call Setup Failure Rate due to Immediate Assignment Losses
(c) Call Setup Failure Rate due to AGCH Blocking
(d) Call Setup Failure Rate due to Immediate Assignment without MS Seizure
(e) Call Setup Failure Rate due to SDCCH Drops
(f) Call Setup Failure Rate due to SSS Procedure Failure
(g) Call Setup Failure Rate due to TCH Loss
(h) Call Setup Failure Rate due to Assignment Failures by Message
(i) Call Setup Failure Rate due to Assignment Failures with other Reasons
(j) Call Setup Failure Rate due to Queuing Failures
Short name: (a) CSFailRate
(b) CSFailRateImmAssLoss
(c) CSFailRateAGCHLoss
(d) CSFailRateImmAssNoSeiz
(e) CSFailRateSDCCHDrops
(f) CSFailRateSSSProcFail
(g) CSFailRateTCHLoss
(h) CSFailRateAssFailbyMess
(i) CSFailRateAssFailOther
(j) CSFailRateQueFail
Description: These indicators will give you the Call Setup Failure Rate. Different indicators distinguish between different causes used in the different procedures (Immediate Assignment, SSS Procedures and Assignment).
Formula: (a) CSFailRate = 1 – CSSuccRate
(b) CSFailRateImmAssLoss = ImmAssLossRate
(c) CSFailRateAGCHLoss = AGCHLossRateCS
(d) CSFailRateImmAssNoSeiz = ImmAssNoSeizRate
(e) CSFailRateSDCCHDrops = SDCCHDropRateCS
(f) CSFailRateSSSProcFail = SSSProcFailRateCS
(g) CSFailRateTCHLoss = TCHBlockRate
(h) CSFailRateAssFailbyMess = AssFailbyMessRate
(i) CSFailRateAssFailOther = AssFailOtherRate
(j) CSFailRateQueFail = QueFailRate
Used param.: CSSuccRate (6.3(a)), ImmAssLossRate(3.8(a)), AGCHLossRateCS(3.9(a)), ImmAssNoSeizRate(3.10(a)), SDCCHDropRateCS(4.4(a)), SSSProcFailRateCS(4.5(a)), TCHBlockRate(5.4(a)), AssFailbyMessRate(5.4(b)), AssFailOtherRate(5.4(c)), QueFailRate(5.4(d))
Elem. Object: Cell
Unit: None
Remarks: See remarks in the referenced KPIs
Information PM: SBS Key Performance Indicators System
39 A50016-G5100-A042-1-7618
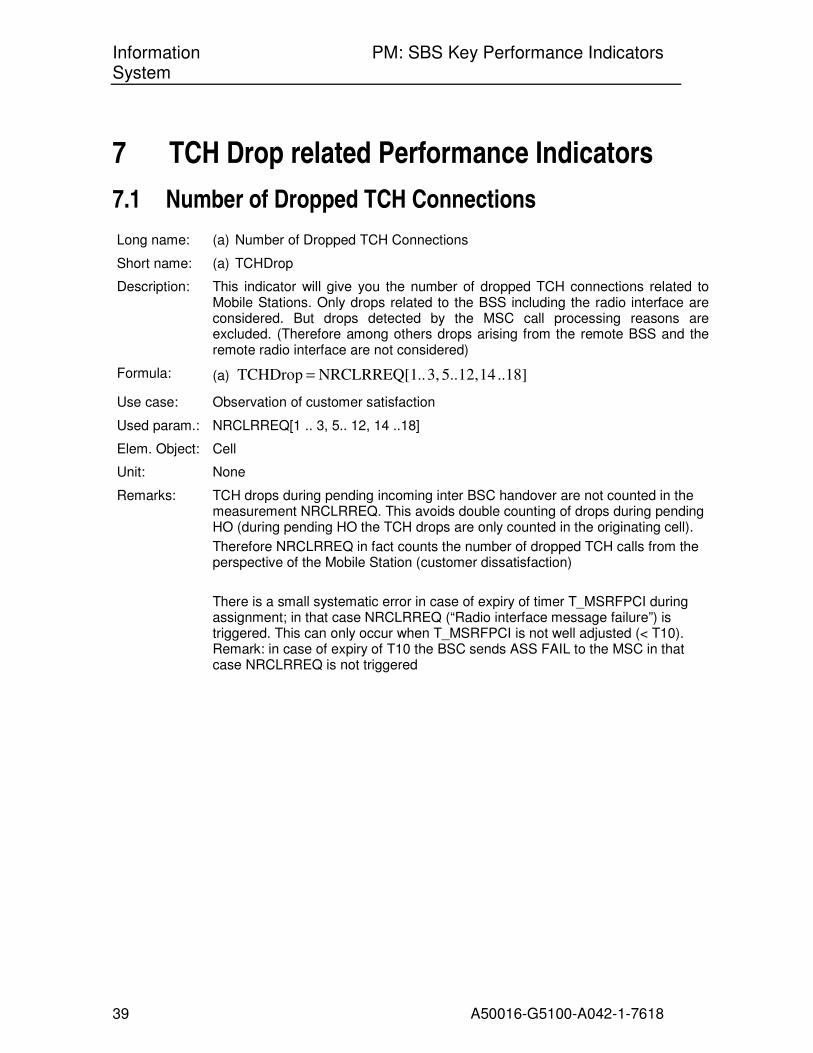
7 TCH Drop related Performance Indicators
7.1 Number of Dropped TCH Connections
Long name: (a) Number of Dropped TCH Connections
Short name: (a) TCHDrop
Description: This indicator will give you the number of dropped TCH connections related to Mobile Stations. Only drops related to the BSS including the radio interface are considered. But drops detected by the MSC call processing reasons are excluded. (Therefore among others drops arising from the remote BSS and the remote radio interface are not considered)
Formula: (a) ..18] 14 12, 5.. 3, .. NRCLRREQ[1 TCHDrop =
Use case: Observation of customer satisfaction
Used param.: NRCLRREQ[1 .. 3, 5.. 12, 14 ..18]
Elem. Object: Cell
Unit: None
Remarks: TCH drops during pending incoming inter BSC handover are not counted in the measurement NRCLRREQ. This avoids double counting of drops during pending HO (during pending HO the TCH drops are only counted in the originating cell).
Therefore NRCLRREQ in fact counts the number of dropped TCH calls from the perspective of the Mobile Station (customer dissatisfaction)
There is a small systematic error in case of expiry of timer T_MSRFPCI during assignment; in that case NRCLRREQ (“Radio interface message failure”) is triggered. This can only occur when T_MSRFPCI is not well adjusted (< T10). Remark: in case of expiry of T10 the BSC sends ASS FAIL to the MSC in that case NRCLRREQ is not triggered

Information PM: SBS Key Performance Indicators System
40 A50016-G5100-A042-1-7618
7.2 TCH Drop Distribution
Long name: (a) TCH drop distribution due to expiry of timer T200
(b) TCH drop distribution due to unsolicited DM response
(c) TCH drop distribution due to sequence error
(d) TCH drop distribution due to expiry of timer T_MSRFPCI
(e) TCH drop distribution due to distance limit exceeded
(f) TCH drop distribution due to handover access failures
(g) TCH drop distribution due to radio link failures
(h) TCH drop distribution due to remote transcoder failures
(i) TCH drop distribution due to other connection failures
(j) TCH drop distribution due to intra cell handovers
(k) TCH drop distribution due to inter cell intra bsc handovers
(l) TCH drop distribution due to inter bsc handovers
(m) TCH drop distribution due to equipment failure
(n) TCH drop distribution due to protocol error
(o) TCH drop distribution due to distance error
(p) TCH drop distribution due to preemption
(q) TCH drop distribution due to O&M intervention
(r) TCH drop distribution due to other reasons
Short name: (a) TCHDropDist.T200
(b) TCHDropDist.UnsolDMRes
(c) TCHDropDist.SeqErr
(d) TCHDropDist.TMSRFPCI
(e) TCHDropDist.Distance
(f) TCHDropDist.HOAccess
(g) TCHDropDist.RadLinkFail
(h) TCHDropDist.RemTranscFail
(i) TCHDropDist.ConnOther
(j) TCHDropDist.IntraCellHO
(k) TCHDropDist.InterCellHO
(l) TCHDropDist.InterBSCHO
(m) TCHDropDist.EquipFail
(n) TCHDropDist.ProtErr
(o) TCHDropDist.DistErr
(p) TCHDropDist.Preempt
(q) TCHDropDist.OAM
(r) TCHDropDist.Other
Description: This indicator will give you the TCH Drop Distribution showing the particular TCH drops related to the total number of drops related to TCH connections.
Use case: Detection of network problems: e.g. insufficient coverage
For network optimization normally additional KPIs would be considered, e.g. KPIs for the supervision of transmission power, interference and HO)
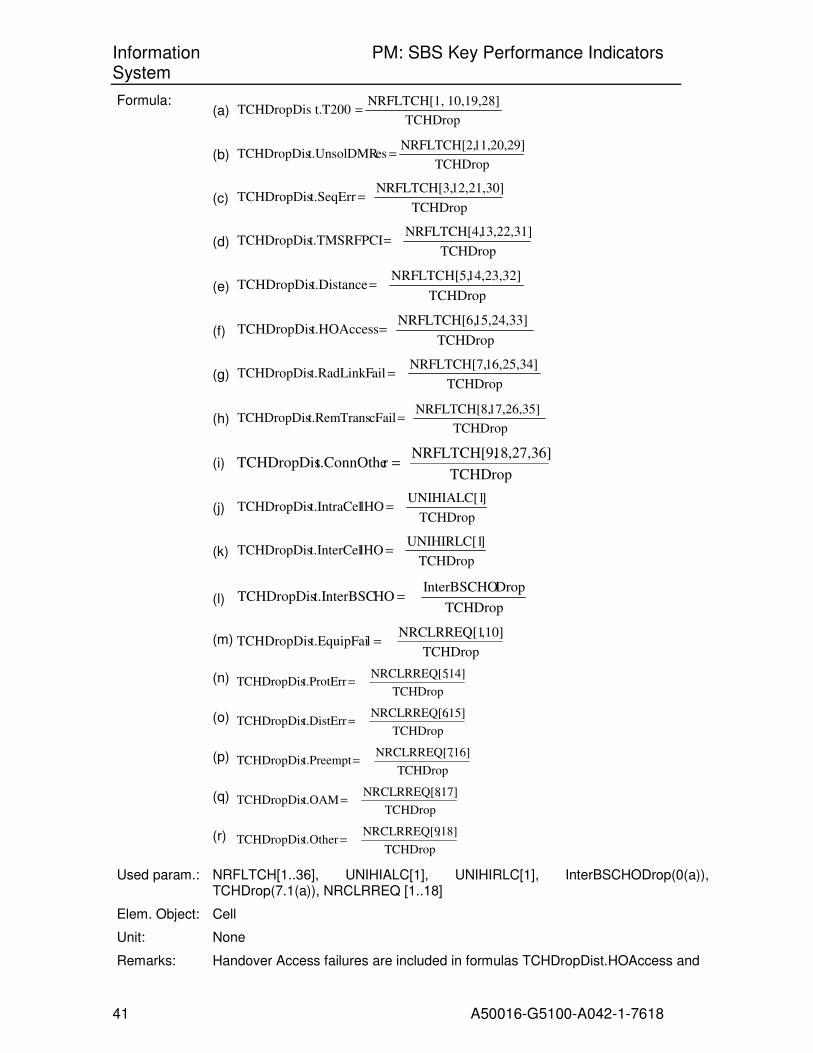
Information PM: SBS Key Performance Indicators System
41 A50016-G5100-A042-1-7618
Formula: (a)
TCHDrop
10,19,28]NRFLTCH[1, t.T200TCHDropDis =
(b) TCHDrop
11,20,29]NRFLTCH[2, est.UnsolDMRTCHDropDis =
(c) TCHDrop
12,21,30]NRFLTCH[3, t.SeqErrTCHDropDis =
(d) TCHDrop
13,22,31]NRFLTCH[4, t.TMSRFPCITCHDropDis =
(e) TCHDrop
14,23,32]NRFLTCH[5, t.DistanceTCHDropDis =
(f) TCHDrop
15,24,33]NRFLTCH[6, t.HOAccessTCHDropDis =
(g) TCHDrop
16,25,34]NRFLTCH[7, ailt.RadLinkFTCHDropDis =
(h) TCHDrop
17,26,35]NRFLTCH[8, cFailt.RemTransTCHDropDis =
(i) TCHDrop
18,27,36]NRFLTCH[9, rt.ConnOtheTCHDropDis =
(j) TCHDrop
]UNIHIALC[1 lHOt.IntraCelTCHDropDis =
(k) TCHDrop
]UNIHIRLC[1 lHOt.InterCelTCHDropDis =
(l) TCHDrop
DropInterBSCHO HOt.InterBSCTCHDropDis =
(m) TCHDrop
,10]NRCLRREQ[1 lt.EquipFaiTCHDropDis =
(n) TCHDrop
,14]NRCLRREQ[5 t.ProtErrTCHDropDis =
(o) TCHDrop
,15]NRCLRREQ[6 t.DistErrTCHDropDis =
(p) TCHDrop
,16]NRCLRREQ[7 t.PreemptTCHDropDis =
(q) TCHDrop
,17]NRCLRREQ[8 t.OAMTCHDropDis =
(r) TCHDrop
,18]NRCLRREQ[9 t.OtherTCHDropDis =
Used param.: NRFLTCH[1..36], UNIHIALC[1], UNIHIRLC[1], InterBSCHODrop(0(a)), TCHDrop(7.1(a)), NRCLRREQ [1..18]
Elem. Object: Cell
Unit: None
Remarks: Handover Access failures are included in formulas TCHDropDist.HOAccess and
Information PM: SBS Key Performance Indicators System
42 A50016-G5100-A042-1-7618
TCHDropDist.InterBSCHO.
TCH drops during pending incoming inter BSC handover are not counted in formulas TCHDropDist.HOAccess. This avoids double counting of drops during pending HO (during pending HO the TCH drops are only counted in the originating cell).
Therefore NRCLRREQ in fact counts the number of dropped TCH calls from the perspective of the Mobile Station (customer dissatisfaction)
If the feature SDCCH Handover is activated, then this will lead to a systematic error.
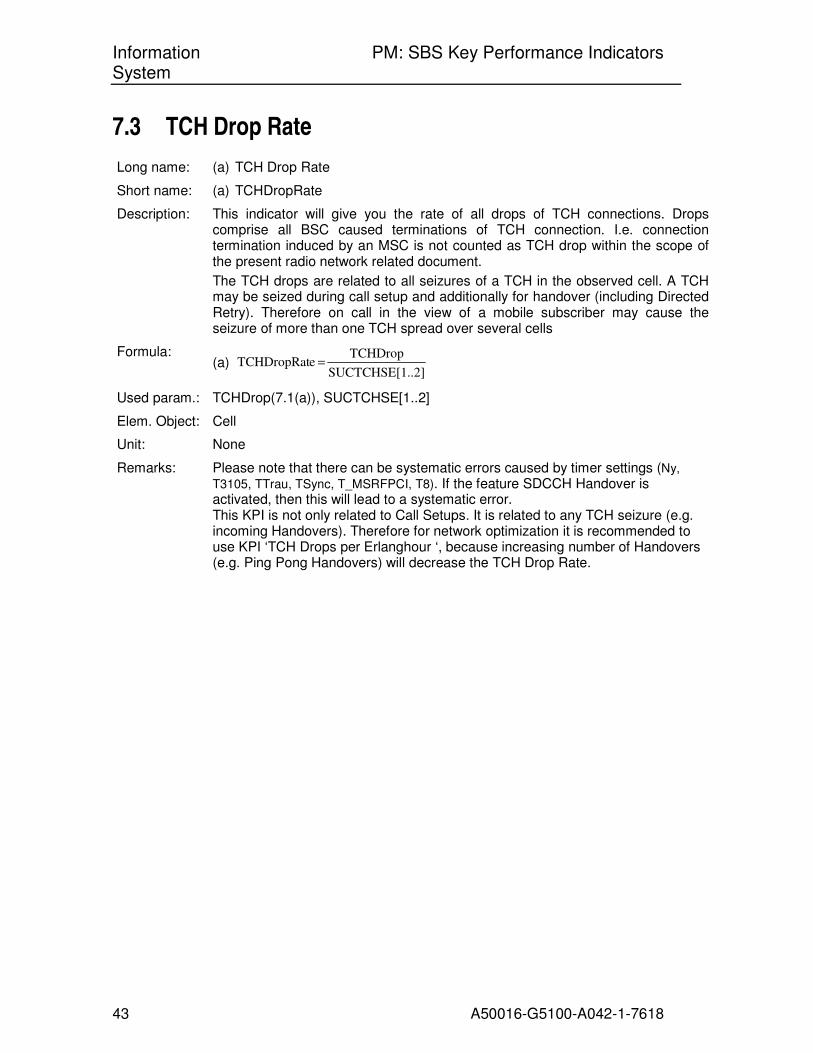
Information PM: SBS Key Performance Indicators System
43 A50016-G5100-A042-1-7618
7.3 TCH Drop Rate
Long name: (a) TCH Drop Rate
Short name: (a) TCHDropRate
Description: This indicator will give you the rate of all drops of TCH connections. Drops comprise all BSC caused terminations of TCH connection. I.e. connection termination induced by an MSC is not counted as TCH drop within the scope of the present radio network related document.
The TCH drops are related to all seizures of a TCH in the observed cell. A TCH may be seized during call setup and additionally for handover (including Directed Retry). Therefore on call in the view of a mobile subscriber may cause the seizure of more than one TCH spread over several cells
Formula: (a)
..2]SUCTCHSE[1
TCHDrop eTCHDropRat =
Used param.: TCHDrop(7.1(a)), SUCTCHSE[1..2]
Elem. Object: Cell
Unit: None
Remarks: Please note that there can be systematic errors caused by timer settings (Ny,
T3105, TTrau, TSync, T_MSRFPCI, T8). If the feature SDCCH Handover is activated, then this will lead to a systematic error. This KPI is not only related to Call Setups. It is related to any TCH seizure (e.g. incoming Handovers). Therefore for network optimization it is recommended to use KPI ‘TCH Drops per Erlanghour ‘, because increasing number of Handovers (e.g. Ping Pong Handovers) will decrease the TCH Drop Rate.

Information PM: SBS Key Performance Indicators System
44 A50016-G5100-A042-1-7618
7.4 Call Drop Rate
Long name: (a) Number of terminated calls
(b) Call Drop Rate
Short name: (a) NumTermCalls
(b) CallDropRate
Description: This indicator provides the number of terminated calls and the call drop rate from the view of the MS (customer satisfaction).
Preconditions:
1. A call is established when the MS has seized the TCH
• Ass Failure in connection with a following Clear Command is not considered as call, since the MS has not yet seized a TCH. (e.g. AssFail: No radio resource available, MSC controlled Directed Retry)
• Queuing timer expiry is not considered
• Expiry of timer T_MSRFPCI is not considered
2. Call termination (and especially call drop) is counted for that cell, where the TCH was seized by the MS at the time of the call termination (especially call drop)
• Call termination (and especially call drop) during pending HO is counted for the old cell
3. Only call drops initiated by the BSS are considered
• Drops comprise all BSC caused terminations of calls. I.e. call termination induced by an MSC is not counted as call drop within the scope of the present radio network related document
• Release of TCH in connection with HO reversion to old cell is not considered (e.g.: Inter BSC HO -> HO access failure -> Clear Command). Reason: no TCH drop from the MS perspective.
•
Formula: (a) ..13] 8,11 .. TASSFAIL[6 - ,13]NRCLRREQ[4 -12] .. 10 8, .. 4 2, .. NRCLRCMD[1 lsNumTermCal =
(b) lsNumTermCal
TCHDrop teCallDropRa =
Used param.: TCHDrop(7.1(a)), NRCLRCMD[1 .. 2, 4 .. 8, 10..12], TASSFAIL[6.. 8,11 .. 13], NRCLRREQ[4,13], NumTermCalls(6.4(a))
Elem. Object: Cell
Unit: None
Remarks: Remark for understanding the formula on the number of terminated calls:
Clear Commands may also be received by the MSC at call state when the MS has not yet seized the TCH during TCH assignment, i.e. when no call is yet established. Therefore the following cases are not considered as established calls:
• No TCH available after Queuing: In that case the BSC sends Clear Request (“Radio resource not available”) which triggers

Information PM: SBS Key Performance Indicators System
45 A50016-G5100-A042-1-7618
NRCLRREQ[4,13]; this also lead to triggering of NRCLRCMD[1,7] (“BSS initiated”)
• Unsuccessful TCH Assignment Procedure with Loss of ASSIGNMENT COMMAND (T10 Expiry): In that case the BSC sends Assignment Failure to the MSC and triggers TASSFAIL[6,11]; this also leads to triggering of NRCLRCMD[2,8] (“Call Control”)
• Unsuccessful Directed Retry, Intra-BSC, with Reversion to SDCCH (T3124 Expiry): In that case the BSC sends Assignment Failure to the MSC and triggers TASSFAIL[7,12]; this also leads to triggering of NRCLRCMD[2,8] (“Call Control”)
• No TCH available (no queuing): In that case the BSC sends Assignment Failure to the MSC and triggers TASSFAIL[8,13]; this also leads to triggering of NRCLRCMD[2,8] (“Call Control”)
Systematic failures in the formulas:
• Inter BSC handover with reversion to old cell: In that case the MSC receives HO_Failure from the old BSC and sends Clear Command (“equipment failure”) the target BSC which triggers NRCLRCMD[4] for the target cell -> this effect slightly improve the CallDropRate by pretending that more call have existed than in reality.
• Inter BSC directed retry with no successful TCH seizure: In that case the BSC send assignment Failure and triggers Tassfail[9,14]; this lead also to a Clear Command (“Call Control”) which triggers NRCLRCMD[2] -> this effect slightly improve the CallDropRate by pretending that more call have existed than in reality.
• Expiry of timer T_MSRFPCI during assignment: In that case NRCLRREQ is triggered. This can only occur when T_MSRFPCI is not well adjusted (< T10) -> this effect slightly deteriorates the call drop rate (numerator and denominator are increased)
• There can be systematic errors caused by timer settings (Ny1, T3105,
TTrau, TSync, T_MSRFPCI, T8). If the feature SDCCH Handover is activated, then this will lead to a systematic error. -> this effect slightly deteriorates the call drop rate (numerator and denominator are increased)
Recommendation:
Drop per Erlang/hour is recommended to be used for quality assessment of radio network performance. Reason: the call drop rate is depending on the average call duration. The call drop rate is proportional to the call duration.

Information PM: SBS Key Performance Indicators System
46 A50016-G5100-A042-1-7618
7.5 Mean Time between TCH Drop
Long name: (a) Mean Time between TCH Drop
Short name: (a) MTBTCHDrop
Description: This indicator will give you mean time between TCH Drop, by meaning the time in seconds until the occurrence of the loss of a TCH connection.
Formula: (a)
TCHDrop
60s *y Granularit* rDRTCHTrafCar MTBTCHDrop =
Used param.: TCHDrop(7.1(a)), TCHTrafCarrDR(9.1.4(c)), Granularity in minutes
Elem. Object: Cell
Unit: Seconds
Remarks: SDCCH Handovers are not considered and can therefore lead to systematic errors.
7.6 TCH Drops per Erlanghour
Long name: (a) TCH Drops per Erlanghour
Short name: (a) TCHDropErlh
Description: This indicator will give you TCH Drops per Erlanghour, by meaning the number of losses of TCH connections related to one Erlanghour.
Formula: (a)
yGranularit
60*
rDRTCHTrafCar
TCHDrop hTCHDropErl =
Used param.: TCHDrop(7.1(a)), TCHTrafCarrDR(9.1.4(c)), Granularity in minutes
Elem. Object: Cell
Unit: None
Remarks: SDCCH Handovers are not considered and can therefore lead to systematic errors.
7.7 Rate of normal call releases of calls with bad radio quality
Long name: (a) Rate of normal call releases of calls with bad radio quality
(b) Rate of normal call releases of calls with bad radio quality, non AMR
(c) Rate of normal call releases of calls with bad radio quality, AMR
(d) Rate of normal call releases of calls with bad radio quality, non AMR, MS orig.
(e) Rate of normal call releases of calls with bad radio quality, AMR, MS orig.
(f) Rate of normal call releases of calls with bad radio quality, non AMR, Network orig.
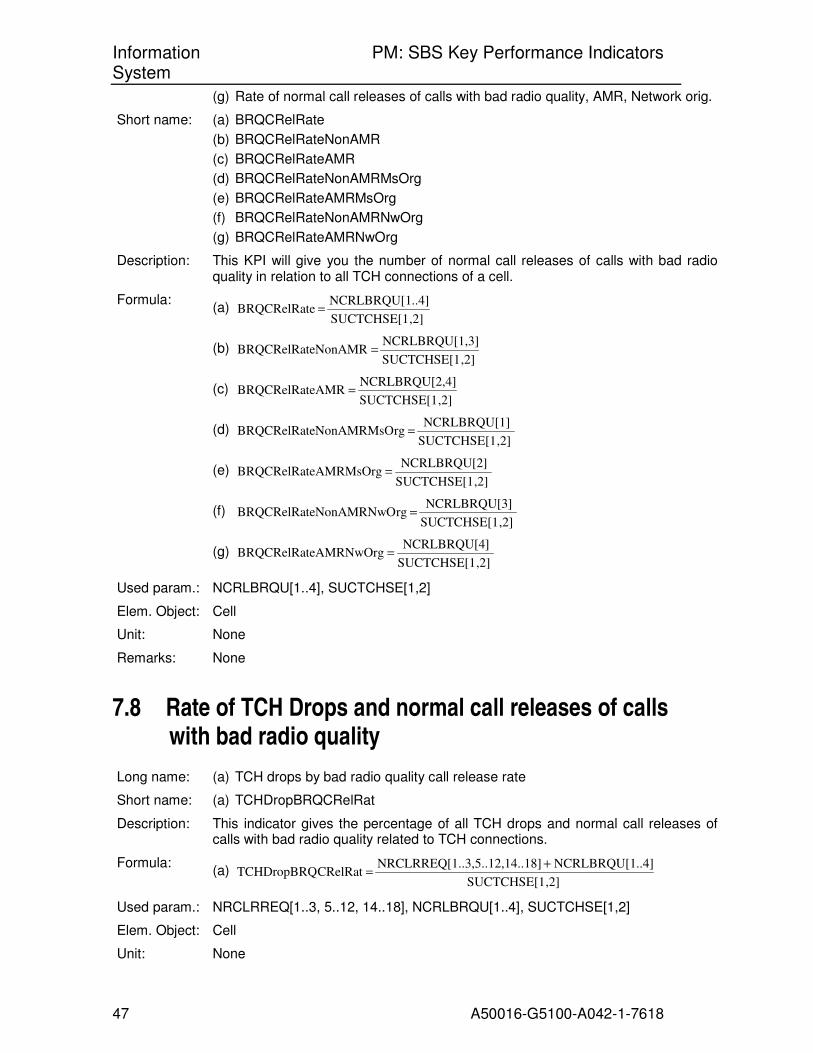
Information PM: SBS Key Performance Indicators System
47 A50016-G5100-A042-1-7618
(g) Rate of normal call releases of calls with bad radio quality, AMR, Network orig.
Short name: (a) BRQCRelRate
(b) BRQCRelRateNonAMR
(c) BRQCRelRateAMR
(d) BRQCRelRateNonAMRMsOrg
(e) BRQCRelRateAMRMsOrg
(f) BRQCRelRateNonAMRNwOrg
(g) BRQCRelRateAMRNwOrg
Description: This KPI will give you the number of normal call releases of calls with bad radio quality in relation to all TCH connections of a cell.
Formula: (a)
,2]SUCTCHSE[1
..4]NCRLBRQU[1 eBRQCRelRat =
(b) ,2]SUCTCHSE[1
,3]NCRLBRQU[1 eNonAMRBRQCRelRat =
(c) ,2]SUCTCHSE[1
,4]NCRLBRQU[2 eAMRBRQCRelRat =
(d) ,2]SUCTCHSE[1
]NCRLBRQU[1 rgeNonAMRMsOBRQCRelRat =
(e) ,2]SUCTCHSE[1
]NCRLBRQU[2 eAMRMsOrgBRQCRelRat =
(f) ,2]SUCTCHSE[1
]NCRLBRQU[3 rgeNonAMRNwOBRQCRelRat =
(g) ,2]SUCTCHSE[1
]NCRLBRQU[4 eAMRNwOrgBRQCRelRat =
Used param.: NCRLBRQU[1..4], SUCTCHSE[1,2]
Elem. Object: Cell
Unit: None
Remarks: None
7.8 Rate of TCH Drops and normal call releases of calls with bad radio quality
Long name: (a) TCH drops by bad radio quality call release rate
Short name: (a) TCHDropBRQCRelRat
Description: This indicator gives the percentage of all TCH drops and normal call releases of calls with bad radio quality related to TCH connections.
Formula: (a)
,2]SUCTCHSE[1
..4]NCRLBRQU[1 14..18]..3,5..12,NRCLRREQ[1 CRelRat TCHDropBRQ
+=
Used param.: NRCLRREQ[1..3, 5..12, 14..18], NCRLBRQU[1..4], SUCTCHSE[1,2]
Elem. Object: Cell
Unit: None
Information PM: SBS Key Performance Indicators System
48 A50016-G5100-A042-1-7618
Remarks: If the feature SDCCH Handover is activated, then this will lead to a systematic error. This KPI is not only related to Call Setups. It is related to any TCH seizure (e.g. incoming Handovers).
Information PM: SBS Key Performance Indicators System
49 A50016-G5100-A042-1-7618
8 SDCCH Drop related Performance Indicators
8.1 Number of dropped SDCCH Connections
Long name: (a) Number of dropped SDCCH Connections
Short name: (a) SDCCHDrop
Description: This indicator will give you the number of dropped SDCCH Connections, which can occur for any call type (MOC, MTC, Locupd, SMS, ...).
Formula: (a) ,6,11]TASSFAIL[1 26] .. 23 21, .. 9NRCLRREQ[1 SDCCHDrop +=
Used param.: NRCLRREQ[19 .. 21, 23 .. 26], ,6,11]TASSFAIL[1
Elem. Object: Cell
Unit: None
Remarks: This KPI is based on NRCLRREQ counters, because drops caused by the BSC must be considered.
8.2 SDCCH Drop Rate
Long name: (a) SDCCH Drop Rate
(b) SDCCH Drop Rate per SDCCH connection
Short name: (a) SDCCHDropRate
(b) SDCCHDropConnRate
Description: This indicator will give you the rate of all losses of connections during a SDCCH Connection.
Formula: (a)
..6]NSUCCHPC[1
SDCCHDrop ateSDCCHDropR =
(b) 8]3,14,16..1NRCLRCMD[1
SDCCHDrop onnRateSDCCHDropC =
Used param.: SDCCHDrop(8.1(a)), NSUCCHPC[1..6], NRCLRCMD[13,14,16..18]
Elem. Object: Cell
Unit: None
Remarks: MSC controlled SDCCH Handover drops are also counted (Expiry of Timer T8). BSC controlled SDCCH Handover drops are not counted and will lead to small systematic errors.
Information PM: SBS Key Performance Indicators System
50 A50016-G5100-A042-1-7618
8.3 Mean Time between SDCCH Drop
Long name: (a) Mean Time between SDCCH Drop
Short name: (a) MTBSDCCHDrop
Description: This indicator will give you mean time between SDCCH Drop, by meaning the time in seconds until the occurrence of the loss of a SDCCH connection.
Formula:
(a) SDCCHDrop
60s *y Granularit*arr SDCCHTrafC opMTBSDCCHDr =
Used param.: SDCCHDrop(8.1(a)), SDCCHTrafCarr(10.1.2(a)) , Granularity in minutes
Elem. Object: Cell
Unit: Seconds
Remarks: SDCCH Handovers Drops are not considered.
8.4 SDCCH Drops per Erlanghour
Long name: (a) SDCCH Drops per Erlanghour
Short name: (a) SDCCHDropErlh
Description: This indicator will give you SDCCH Drops per Erlanghour, by meaning the number of losses of SDCCH connections related to one Erlang.
Formula: (a)
yGranularit
60*
arrSDCCHTrafC
SDCCHDrop rlhSDCCHDropE =
Used param.: SDCCHDrop(8.1(a)), SDCCHTrafCarr(10.1.2(a)), Granularity in minutes
Elem. Object: Cell
Unit: None
Remarks: SDCCH Handovers Drops are not considered.

Information PM: SBS Key Performance Indicators System
51 A50016-G5100-A042-1-7618
9 TCH Load related Performance Indicators
9.1 TCH Load for Circuit Switched Traffic
The following figure will give you an overview about the load related performance indicators used in the traffic theory.
Fig. 6 Overview Load related performance indicators
For the estimation of the Load of GSM Telecom Systems the Erlang B formula for non queuing Telefon Systems and the Erlang C formula for Queuing Telefon Systems can be used. Further information about the traffic theory can be found in the ‘Siemens Tabellenbuch Fernsprechtheorie ISBN 3-8009-1343-7’.
9.1.1 TCH Traffic Distribution Rate
Long name: (a) TCH Full Rate Traffic
(b) TCH Half Rate Traffic
Short name: (a) FRT
(b) HRT
Description: This indicator will give you the Rate of Full Rate and Half Rate traffic on TCH compared to the total traffic.
Formula: (a)
[1..4] MEBUSTCH
3] [1, MEBUSTCH FRT =
(b) [1..4] MEBUSTCH
4] [2, MEBUSTCH HRT =
Used param.: MEBUSTCH[1..4]
Elem. Object: Cell
Unit: None
Remarks: This KPI can be used by network planning to calculate the number of needed TRX.
Traffic Offered A [Erl] Call Attempts CA
Number of channels N
Traffic Carried Y [Erl]Calls Carried CC
Traffic Lost R [Erl] Calls Rejected CR Loss B [%]

Information PM: SBS Key Performance Indicators System
52 A50016-G5100-A042-1-7618
9.1.2 TCH Loss Rate
Long name: (a) TCH seizure blocked Rate Full Rate
(b) TCH seizure blocked Rate Half Rate
(c) TCH seizure blocked Rate Dual Rate
(d) TCH seizure blocked Rate Waiting System Full Rate
(e) TCH seizure blocked Rate Waiting System Half Rate
(f) TCH seizure blocked Rate Waiting System Dual Rate
(g) TCH seizure blocked Rate
Short name: (a) TCHSeizBlckRateFR
(b) TCHSeizBlckRateHR
(c) TCHSeizBlckRateDR
(d) TCHSeizBlckRateWSFR
(e) TCHSeizBlckRateWSHR
(f) TCHSeizBlckRateWSDR
(g) TCHSeizBlckRate
Description: This indicator will give you the TCH seizure blocked rate by meaning the rate where new TCH Seizure Attempts could not be handled by the observed cell, because all traffic channels were occupied / blocked.
TCH seizure attempts for HO and Directed Retry are included in the formulas.
Therefore from the perspective of a mobile subscriber, the call setup might become successful by assigning a TCH in another cell through (e.g. by applying the feature Directed Retry) even when a TCH blocking is counted. I.e. the KPIs consider the TCH access on cell level but not on connection level.
Performance Indicators for waiting systems are also provided and will consider only the TCH Seizure attempts discarded from the TCH queue.
Formula: (a)
[1] ATTCHSEI
5]3, [1, ATCHSMBS kRateFRTCHSeizBlc =
ATCHSMBS[5] is only used by Concentric or Extended cells.
(b) [2] ATTCHSEI
6]4, [2, ATCHSMBS kRateHRTCHSeizBlc =
ATCHSMBS[6] is only used by Concentric or Extended cells.
(c) [1,2] ATTCHSEI
[all] ATCHSMBS kRateDRTCHSeizBlc =
(d) [1] ATTCHSEI
3] [1, NMSGDISQ kRateWSFRTCHSeizBlc =
(e) [2] ATTCHSEI
[2,4] NMSGDISQ kRateWSHRTCHSeizBlc =
(f) [1..2] ATTCHSEI
[1..4] NMSGDISQ kRateWSDRTCHSeizBlc =
(g) [1..2] ATTCHSEI
[1..4] NMSGDISQ ll]ATCHSMBS[a kRateTCHSeizBlc
+=
Information PM: SBS Key Performance Indicators System
53 A50016-G5100-A042-1-7618
Used param.: ATCHSMBS[1..6], ATTCHSEI[1..2], NMSGDISQ[1..4]
Elem. Object: Cell
Unit: Subscriber redial behaviour influences the blocking rate.
Further the HO periodicity timer influences the TCH blocking rate
Remarks: For Dual Rate Channels (formula c) the Full Rate and Half Rate channels must be weighted with the TCH Traffic distribution Rate.
Please note, after expiry of Timer THORQST an intercell or intracell handover will be re-attempted and counter ATCHSMBS can be pegged again, if no resource is still available.
In BR 7.0 the measurement ATCHSMBS was modified to count also in case of Abis pool congestion (extension of Trigger events-list). This fact does not affect the meaning or definition of the KPI.
9.1.3 TCH Traffic Offered
Long name: (a) TCH Traffic Offered Full Rate
(b) TCH Traffic Offered Half Rate
(c) TCH Traffic Offered Dual Rate
Short name: (a) TCHTrafOffFR
(b) TCHTrafOffHR
(c) TCHTrafOffDR
Description: This indicator will give you the theoretical amount of traffic in Erlang which was offered to a cell.
The indicators comprise the traffic explicitly induced by mobile subscribers and also additional virtual traffic emerged from radio network internal features like Directed retry and Handover. In the course of the performance of these two features a traffic demand my be offered successively to more than one possible target cell.
Use case: Radio network capacity planning:
The indicators may be used for radio network capacity planning. But they should not be used isolated since they pretend a higher demand of TCH resources as needed in reality for mobile subscriber satisfaction. The indicators should rather be used in connection with subscriber satisfaction oriented indicators (e.g. refer to chapter 6.5 (g): Call Setup Failure Rate due to TCH Loss)
Formula: (a)
kRateFRTCHSeizBlc- 1
3] [1, MEBUSTCH FRTCHTrafOff =
(b) kRateHRTCHSeizBlc- 1
4] [2, MEBUSTCH HRTCHTrafOff =
(c) HRTCHTrafOffFRTCHTrafOff DRTCHTrafOff +=
Used param.: MEBUSTCH[1..4] ,TCHSeizBlckRateFR(9.1.2(a)),TCHSeizBlckRateHR(9.1.2(b))
Elem. Object: Cell
Unit: Erlang
Remarks: None

Information PM: SBS Key Performance Indicators System
54 A50016-G5100-A042-1-7618
9.1.4 TCH Traffic Carried
Long name: (a) TCH Traffic Carried Full Rate
(b) TCH Traffic Carried Half Rate
(c) TCH Traffic Carried Dual Rate
Short name: (a) TCHTrafCarrFR
(b) TCHTrafCarrHR
(c) TCHTrafCarrDR
Description: This indicator will give you the amount of carried traffic in Erlang on TCH.
Formula: (a) 3] [1, MEBUSTCH rFRTCHTrafCar =
(b) 4] [2, MEBUSTCH rHRTCHTrafCar =
(c) rHRTCHTrafCarrFRTCHTrafCar rDRTCHTrafCar +=
Used param.: MEBUSTCH[1..4]
Elem. Object: Cell
Unit: Erlang
Remarks: None
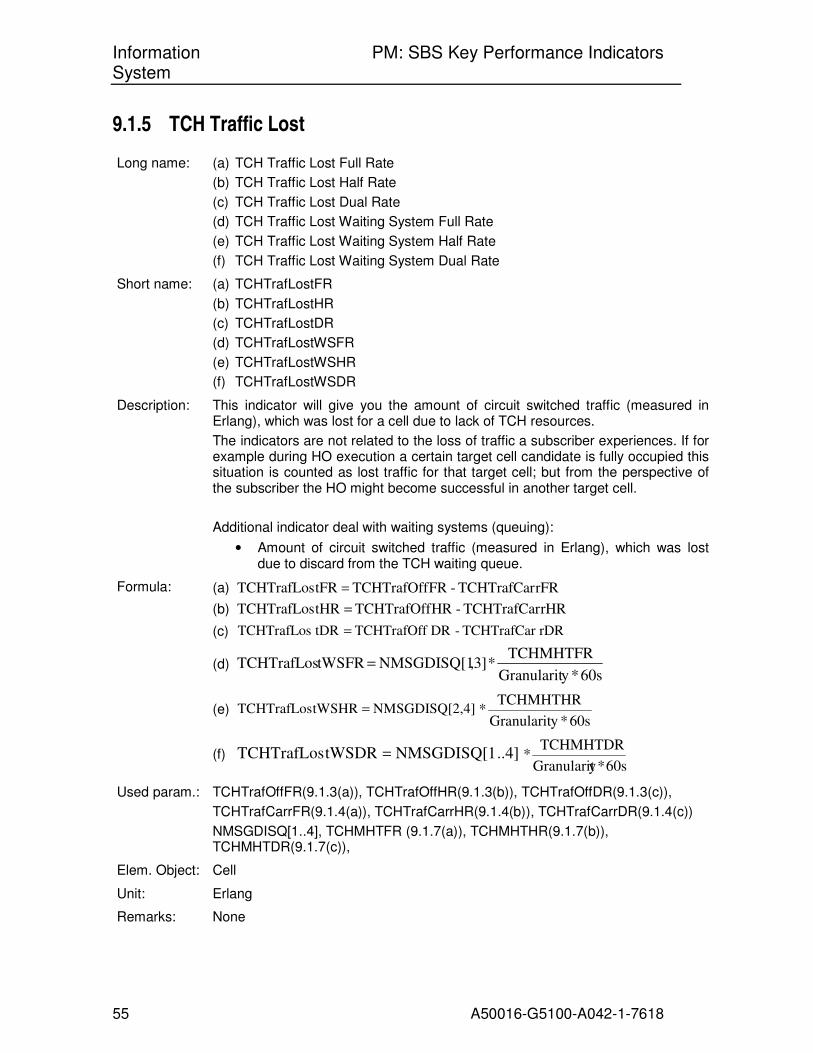
Information PM: SBS Key Performance Indicators System
55 A50016-G5100-A042-1-7618
9.1.5 TCH Traffic Lost
Long name: (a) TCH Traffic Lost Full Rate
(b) TCH Traffic Lost Half Rate
(c) TCH Traffic Lost Dual Rate
(d) TCH Traffic Lost Waiting System Full Rate
(e) TCH Traffic Lost Waiting System Half Rate
(f) TCH Traffic Lost Waiting System Dual Rate
Short name: (a) TCHTrafLostFR
(b) TCHTrafLostHR
(c) TCHTrafLostDR
(d) TCHTrafLostWSFR
(e) TCHTrafLostWSHR
(f) TCHTrafLostWSDR
Description: This indicator will give you the amount of circuit switched traffic (measured in Erlang), which was lost for a cell due to lack of TCH resources.
The indicators are not related to the loss of traffic a subscriber experiences. If for example during HO execution a certain target cell candidate is fully occupied this situation is counted as lost traffic for that target cell; but from the perspective of the subscriber the HO might become successful in another target cell.
Additional indicator deal with waiting systems (queuing):
• Amount of circuit switched traffic (measured in Erlang), which was lost due to discard from the TCH waiting queue.
Formula: (a) rFRTCHTrafCar - FRTCHTrafOff tFRTCHTrafLos =
(b) rHRTCHTrafCar - HRTCHTrafOff tHRTCHTrafLos =
(c) rDRTCHTrafCar - DRTCHTrafOff tDRTCHTrafLos =
(d) 60s *y Granularit
TCHMHTFR* 3],NMSGDISQ[1 tWSFRTCHTrafLos =
(e) ,4]NMSGDISQ[2 tWSHRTCHTrafLos =60s *y Granularit
TCHMHTHR*
(f) ..4]NMSGDISQ[1 tWSDRTCHTrafLos =60s *y Granularit
TCHMHTDR*
Used param.: TCHTrafOffFR(9.1.3(a)), TCHTrafOffHR(9.1.3(b)), TCHTrafOffDR(9.1.3(c)),
TCHTrafCarrFR(9.1.4(a)), TCHTrafCarrHR(9.1.4(b)), TCHTrafCarrDR(9.1.4(c))
NMSGDISQ[1..4], TCHMHTFR (9.1.7(a)), TCHMHTHR(9.1.7(b)), TCHMHTDR(9.1.7(c)),
Elem. Object: Cell
Unit: Erlang
Remarks: None
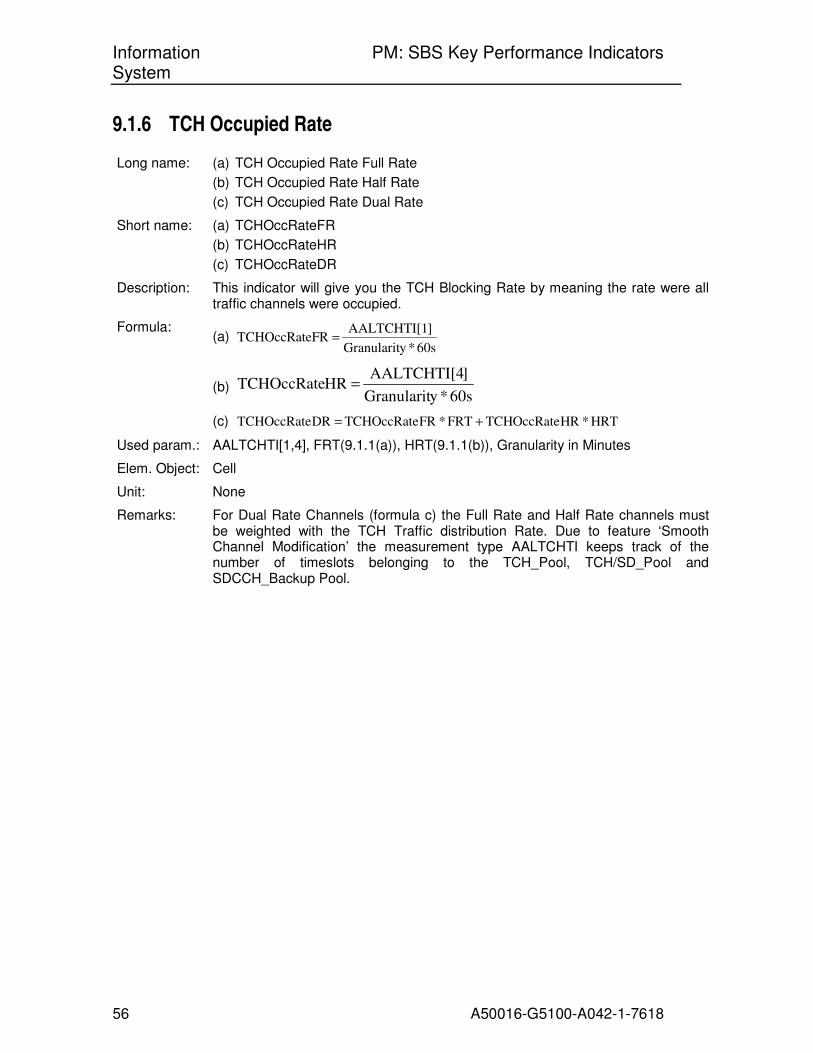
Information PM: SBS Key Performance Indicators System
56 A50016-G5100-A042-1-7618
9.1.6 TCH Occupied Rate
Long name: (a) TCH Occupied Rate Full Rate
(b) TCH Occupied Rate Half Rate
(c) TCH Occupied Rate Dual Rate
Short name: (a) TCHOccRateFR
(b) TCHOccRateHR
(c) TCHOccRateDR
Description: This indicator will give you the TCH Blocking Rate by meaning the rate were all traffic channels were occupied.
Formula: (a)
60s *y Granularit
]AALTCHTI[1 FRTCHOccRate =
(b) 60s *y Granularit
]AALTCHTI[4 HRTCHOccRate =
(c) HRT* HRTCHOccRateFRT * FRTCHOccRate DRTCHOccRate +=
Used param.: AALTCHTI[1,4], FRT(9.1.1(a)), HRT(9.1.1(b)), Granularity in Minutes
Elem. Object: Cell
Unit: None
Remarks: For Dual Rate Channels (formula c) the Full Rate and Half Rate channels must be weighted with the TCH Traffic distribution Rate. Due to feature ‘Smooth Channel Modification’ the measurement type AALTCHTI keeps track of the number of timeslots belonging to the TCH_Pool, TCH/SD_Pool and SDCCH_Backup Pool.
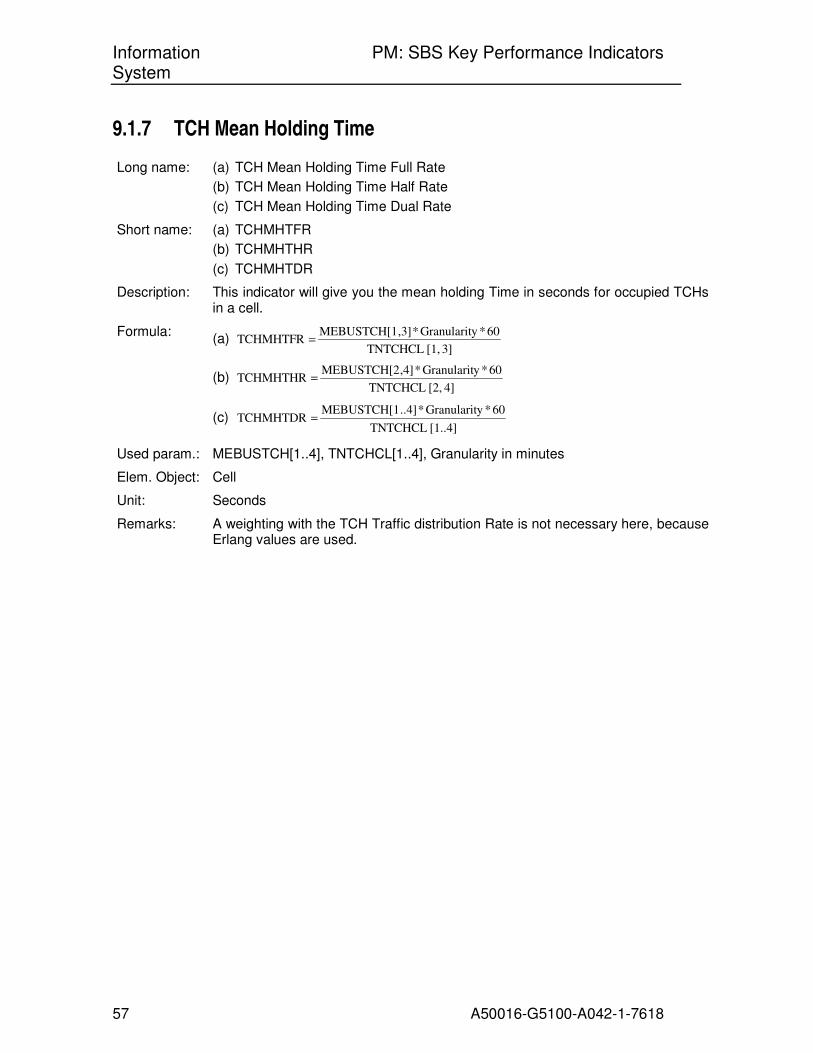
Information PM: SBS Key Performance Indicators System
57 A50016-G5100-A042-1-7618
9.1.7 TCH Mean Holding Time
Long name: (a) TCH Mean Holding Time Full Rate
(b) TCH Mean Holding Time Half Rate
(c) TCH Mean Holding Time Dual Rate
Short name: (a) TCHMHTFR
(b) TCHMHTHR
(c) TCHMHTDR
Description: This indicator will give you the mean holding Time in seconds for occupied TCHs in a cell.
Formula: (a)
3] [1, TNTCHCL
60 *y Granularit * ,3]MEBUSTCH[1 TCHMHTFR =
(b) 4] [2, TNTCHCL
60 *y Granularit * ,4]MEBUSTCH[2 TCHMHTHR =
(c) [1..4] TNTCHCL
60 *y Granularit * ..4]MEBUSTCH[1 TCHMHTDR =
Used param.: MEBUSTCH[1..4], TNTCHCL[1..4], Granularity in minutes
Elem. Object: Cell
Unit: Seconds
Remarks: A weighting with the TCH Traffic distribution Rate is not necessary here, because Erlang values are used.
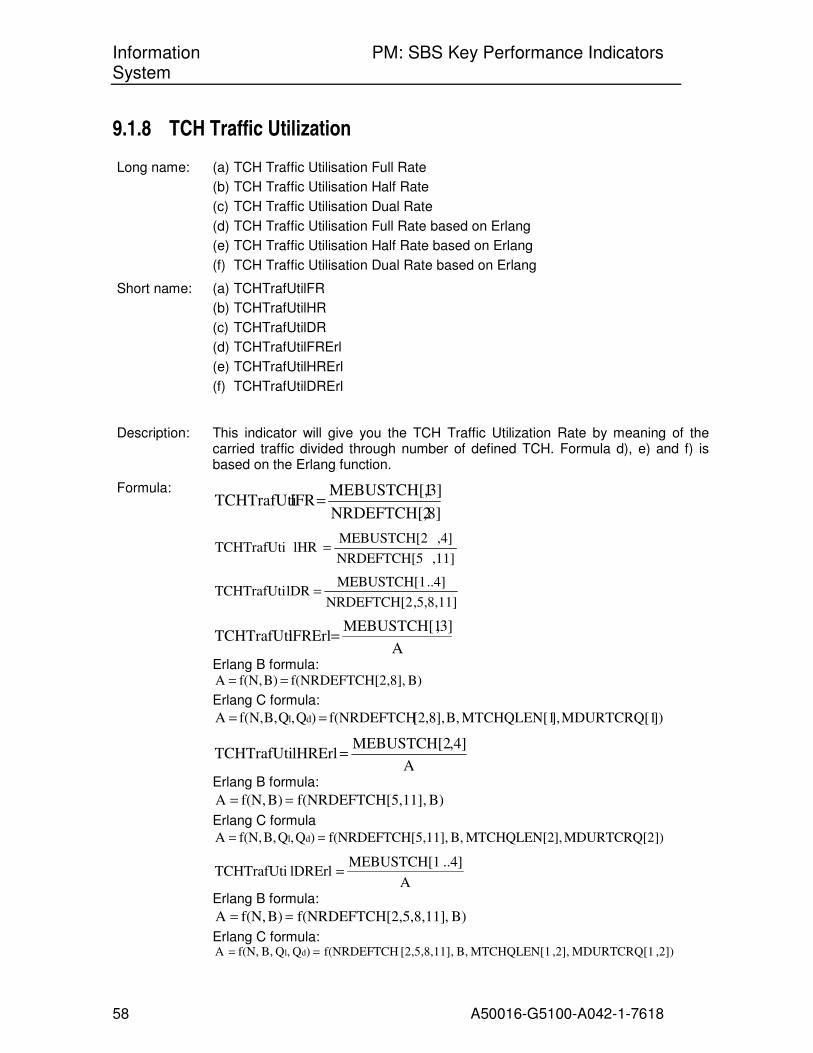
Information PM: SBS Key Performance Indicators System
58 A50016-G5100-A042-1-7618
9.1.8 TCH Traffic Utilization
Long name: (a) TCH Traffic Utilisation Full Rate
(b) TCH Traffic Utilisation Half Rate
(c) TCH Traffic Utilisation Dual Rate
(d) TCH Traffic Utilisation Full Rate based on Erlang
(e) TCH Traffic Utilisation Half Rate based on Erlang
(f) TCH Traffic Utilisation Dual Rate based on Erlang
Short name: (a) TCHTrafUtilFR
(b) TCHTrafUtilHR
(c) TCHTrafUtilDR
(d) TCHTrafUtilFRErl
(e) TCHTrafUtilHRErl
(f) TCHTrafUtilDRErl
Description: This indicator will give you the TCH Traffic Utilization Rate by meaning of the carried traffic divided through number of defined TCH. Formula d), e) and f) is based on the Erlang function.
Formula:
,8]NRDEFTCH[2
,3]MEBUSTCH[1 lFRTCHTrafUti =
,11]NRDEFTCH[5
,4]MEBUSTCH[2 lHRTCHTrafUti =
,5,8,11]NRDEFTCH[2
..4]MEBUSTCH[1 lDRTCHTrafUti =
A
,3]MEBUSTCH[1 lFRErlTCHTrafUti =
Erlang B formula: B) [2,8],f(NRDEFTCH B)f(N, A ==
Erlang C formula:
])MDURTCRQ[1],MTCHQLEN[1 B, [2,8],f(NRDEFTCH )Q,QB,f(N, A dl ==
A
,4]MEBUSTCH[2 lHRErlTCHTrafUti =
Erlang B formula:
B) [5,11],f(NRDEFTCH B)f(N, A ==
Erlang C formula
])MDURTCRQ[2],MTCHQLEN[2 B, [5,11],f(NRDEFTCH )Q,QB,f(N, A dl ==
A
..4]MEBUSTCH[1 lDRErlTCHTrafUti =
Erlang B formula:
B) ,[2,5,8,11]f(NRDEFTCH B)f(N, A ==
Erlang C formula: ,2])MDURTCRQ[1,2],MTCHQLEN[1 B, ,[2,5,8,11]f(NRDEFTCH )Q,QB,f(N, A dl ==
Information PM: SBS Key Performance Indicators System
59 A50016-G5100-A042-1-7618
with A = Offered Load in Erlang B = Blocking Probability (Planning Parameter)
Used param.: MEBUSTCH[1..4], NRDEFTCH [2,5,8,11], MTCHQLEN[1,2], MDURTCRQ[1,2]
Elem. Object: Cell
Unit: None
Remarks: If Queuing is activated, Erlang C instead of Erlang B formula has to be taken. A weighting with the TCH Traffic distribution Rate is not necessary here, because Erlang values are used.

Information PM: SBS Key Performance Indicators System
60 A50016-G5100-A042-1-7618
9.2 Combined time slot utilization for CS and PO Traffic
9.2.1 Combined time slot occupation rate for CS and PO Traffic
Long name: (a) Mean overall time slot occupation rate for CS and PO Traffic
Short name: (a) MeaOcTsC
Description: This KPI provided the mean occupation rate of those timeslots of a cell, which can be assigned to users.
All timeslots are considered independent if they are dedicated to CS or PO Traffic or if they can be used for both types of traffic.
Only those timeslots are considered, which bear logical channels, which are under control of radio resource management (TCH, SDCCH, PDTCH); i.e. the timeslot consumption for common control channels and broadcast control channels is not considered.
Formula: (a) MeaOcTsC =
]/8NDESDCCH[3 ]NDFTCHSD[1 2/,12]NRDEFTCH[6,9]NRDEFTCH[3 ]NDEFPDCH[3
[1]/8 MBUSYSDC [2,4]/2 MEBUSTCH[1,3] MEBUSTCH [6]} NALLPDCH[3], CHmax{NALLPD
++++
+++
Used param.: NDEFPDCH[3]: number of defined PDCH,
NALLPDCH [3,6]: mean number of occupied PDCH UL and DL
(active TBF)
NRDEFTCH[3,6,9,12]: mean number of defined TCH
[3,9] full rate, [6,12] half rate (1/2 time slot)
NDESDCCH[3]: mean number of defined SDCCHs (1/8 time slots)
NDFTCHSD[1]: mean number of defined TCH/SD
MEBUSTCH [1 .. 4]: Mean Number of busy TCHs
[1,3] full rate, [2,4] half rate (1/2 time slot)
MBUSYSDC [1]: Mean Number of busy SDCCHs (1/8 time slots)
Elem. Object: Cell
Unit: None
Remarks: NALLPDCH: Mean number of active TBF PDCH
Term NALLPDCH[3,6] leads to a systematic error, since the same PDCH can carry a DL and an UL TBF at the same time.
NDEFPDCH: Number of defined PDCH
NDEFPDCH include also the packet channels used as PBCCH and PCCCH; traffic is counted in NALLPDCH too.
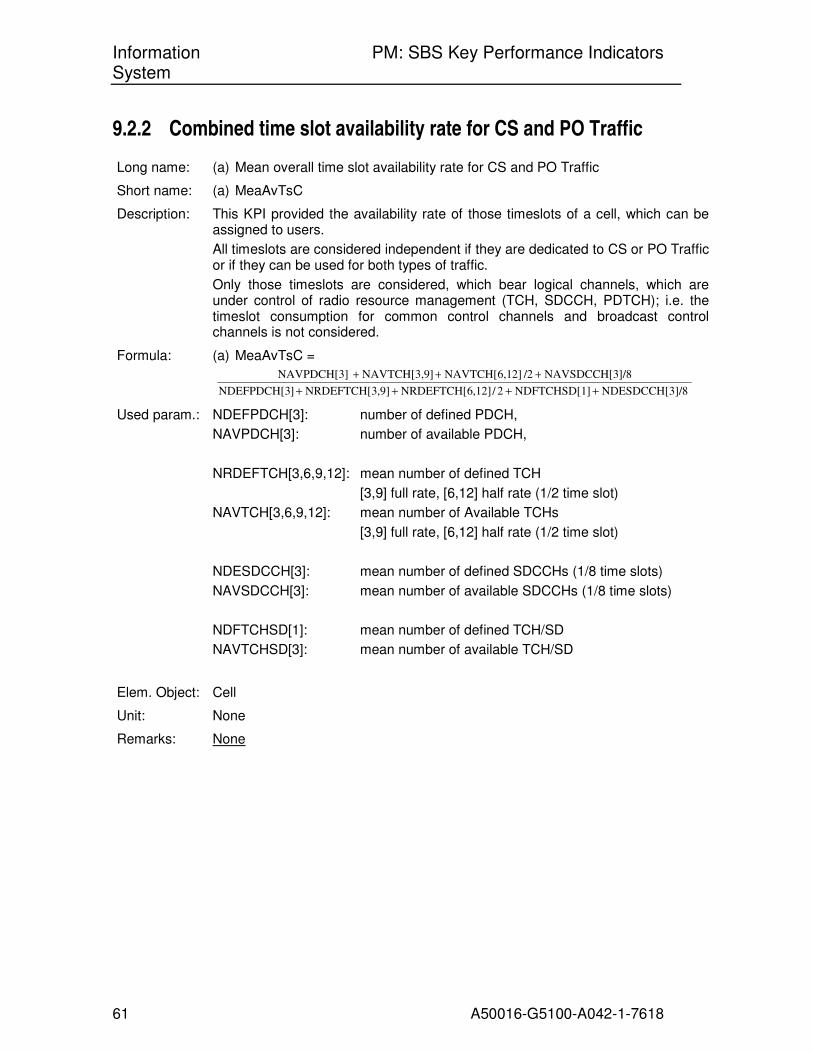
Information PM: SBS Key Performance Indicators System
61 A50016-G5100-A042-1-7618
9.2.2 Combined time slot availability rate for CS and PO Traffic
Long name: (a) Mean overall time slot availability rate for CS and PO Traffic
Short name: (a) MeaAvTsC
Description: This KPI provided the availability rate of those timeslots of a cell, which can be assigned to users.
All timeslots are considered independent if they are dedicated to CS or PO Traffic or if they can be used for both types of traffic.
Only those timeslots are considered, which bear logical channels, which are under control of radio resource management (TCH, SDCCH, PDTCH); i.e. the timeslot consumption for common control channels and broadcast control channels is not considered.
Formula: (a) MeaAvTsC =
]/8NDESDCCH[3 ]NDFTCHSD[1 2/,12]NRDEFTCH[6,9]NRDEFTCH[3 ]NDEFPDCH[3
]/8NAVSDCCH[3 /22]NAVTCH[6,1]NAVTCH[3,9 NAVPDCH[3]
++++
+++
Used param.: NDEFPDCH[3]: number of defined PDCH,
NAVPDCH[3]: number of available PDCH,
NRDEFTCH[3,6,9,12]: mean number of defined TCH
[3,9] full rate, [6,12] half rate (1/2 time slot)
NAVTCH[3,6,9,12]: mean number of Available TCHs
[3,9] full rate, [6,12] half rate (1/2 time slot)
NDESDCCH[3]: mean number of defined SDCCHs (1/8 time slots)
NAVSDCCH[3]: mean number of available SDCCHs (1/8 time slots)
NDFTCHSD[1]: mean number of defined TCH/SD
NAVTCHSD[3]: mean number of available TCH/SD
Elem. Object: Cell
Unit: None
Remarks: None
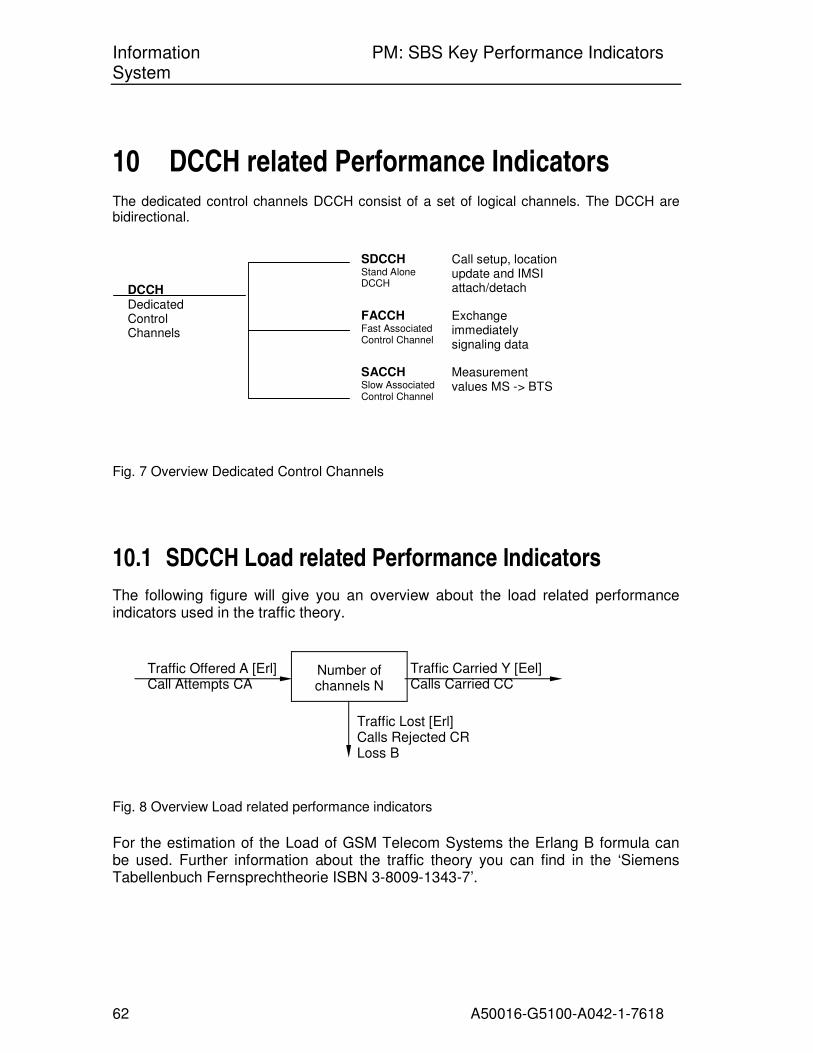
Information PM: SBS Key Performance Indicators System
62 A50016-G5100-A042-1-7618
10 DCCH related Performance Indicators The dedicated control channels DCCH consist of a set of logical channels. The DCCH are bidirectional.
DCCH Dedicated Control Channels
SDCCH Stand Alone DCCH
SACCH Slow Associated Control Channel
FACCH Fast Associated Control Channel
Call setup, location update and IMSI attach/detach
Measurement values MS -> BTS
Exchange immediately signaling data
Fig. 7 Overview Dedicated Control Channels
10.1 SDCCH Load related Performance Indicators
The following figure will give you an overview about the load related performance indicators used in the traffic theory.
Fig. 8 Overview Load related performance indicators
For the estimation of the Load of GSM Telecom Systems the Erlang B formula can be used. Further information about the traffic theory you can find in the ‘Siemens Tabellenbuch Fernsprechtheorie ISBN 3-8009-1343-7’.
Number of channels N
Traffic Offered A [Erl] Call Attempts CA
Traffic Carried Y [Eel] Calls Carried CC
Traffic Lost [Erl] Calls Rejected CR Loss B
Information PM: SBS Key Performance Indicators System
63 A50016-G5100-A042-1-7618
10.1.1 SDCCH Traffic Offered
Long name: (a) SDCCH Traffic Offered
Short name: (a) SDCCH TrafOff
Description: This indicator will give you the amount of traffic in Erlang on SDCCH the MS subscribers wanted to have due to the traffic theorie.
Formula: (a)
RateSDCCHBlock- 1
[1] MBUSYSDC ffSDCCHTrafO =
Used param.: MBUSYSDC[1], SDCCHBlockRate (10.1.5(a))
Elem. Object: Cell
Unit: Erlang
Remarks: None
10.1.2 SDCCH Traffic Carried
Long name: (a) SDCCH Traffic Carried
Short name: (a) SDCCH TrafCarr
Description: This indicator will give you the amount of carried traffic in Erlang on SDCCH.
Formula: (a) [1] MBUSYSDC arr SDCCHTrafC =
Used param.: MBUSYSDC[1]
Elem. Object: Cell
Unit: Erlang
Remarks: None
10.1.3 SDCCH Traffic Lost
Long name: (a) SDCCH Traffic Lost
Short name: (a) SDCCHTrafLost
Description: This indicator will give you the amount of traffic in Erlang on SDCCH which were lost (e.g. Blockings).
Formula: (a) arrSDCCHTrafC - ffSDCCHTrafO ost SDCCHTrafL =
Used param.: SDCCHTrafOff(10.1.1(a)), SDCCHTrafCarr(10.1.2(a))
Elem. Object: Cell
Unit: Erlang
Remarks: None

Information PM: SBS Key Performance Indicators System
64 A50016-G5100-A042-1-7618
10.1.4 SDCCH Occupied Rate
Long name: (a) SDCCH Occupied Rate
Short name: (a) SDCCHOccRate
Description: This indicator will give you the SDCCH Blocking Rate by meaning the rate where all SDCCH were occupied.
Formula: (a)
60s *y Granularit
[1] ASDCALTI teSDCCHOccRa =
Used param.: ASDCALTI[1], Granularity in minutes
Elem. Object: Cell
Unit: None
Remarks: Due to feature ‘Smooth Channel Modification’ the measurement type ASDCALTI keeps track of the number of timeslots belonging to the SDCCH_Pool and SDCCH_Backup_Pool and TCH/SD_Pool.
10.1.5 SDCCH Block Rate
Long name: (a) SDCCH Block Rate
Short name: (a) SDCCHBlockRate
Description: This indicator will give you the SDCCH Traffic Loss Rate by meaning the rate where new SDCCH Seizure Attempts could not be handled, because all SDCCH were occupied / blocked.
Formula: (a)
[1] NATTSDPE
[1] ATSDCMBS RateSDCCHBlock =
Used param.: ATSDCMBS[1], NATTSDPE[1]
Elem. Object: Cell
Unit: None
Remarks: None
10.1.6 SDCCH Mean Holding Time
Long name: (a) SDCCH Mean Holding Time
Short name: (a) SDCCHMHT
Description: This indicator will give you the mean holding Time in seconds for occupied SDCCH in a cell.
Formula: (a)
..6]NSUCCHPC[1
60s *y Granularit * [1] MBUSYSDC SDCCHMHT =
Used param.: MBUSYSDC[1], NSUCCHPC[1..6], Granularity in minutes
Information PM: SBS Key Performance Indicators System
65 A50016-G5100-A042-1-7618
Elem. Object: Cell
Unit: Seconds
Remarks: None
Information PM: SBS Key Performance Indicators System
66 A50016-G5100-A042-1-7618
10.1.7 SDCCH Traffic Utilisation
Long name: SDCCH Traffic Utilisation
SDCCH Traffic Utilisation based on Erlang formula
Short name: SDCCHTrafUtil
SDCCHTrafUtilErl
Description: This indicator will give you the SDCCH Traffic Utilisation by meaning of the carried traffic divided through the number of available SDCCH. Formula b) is based on the Erlang B function.
Formula: (a)
]NDESDCCH[2
]MBUSYSDC[1 tilSDCCHTrafU =
(b) A
]MBUSYSDC[1 tilErlSDCCHTrafU =
Erlang B formula:
B) [2],f(NDESDCCHB)f(N, A ==
with A = Offered Load in Erlang B = Blocking Probability (Planning Parameter)
Used param.: MBUSYSDC[1], NDESDCCH[2]
Elem. Object: Cell
Unit: None
Remarks: None
Information PM: SBS Key Performance Indicators System
67 A50016-G5100-A042-1-7618
10.2 FACCH related Performance Indicators
10.2.1 FACCH Repetition Rate
Long name: (a) FACCH Repetition Rate
Short name: (a) FACCHRR
Description: This indicator will give you the rate of transmitted I(ASSHOCMD) and UI(PHYS_INFO) frames versus the number of transmitted FACCH-blocks used to send over the radio interface the I(ASSHOCMD) and UI(PHYS_INFO) frames.
Formula: (a)
5]FACCHSUP[k
[k] FACCHSUP 1 FACCHRR(k)
+−=
with k 1,…,5 defines the used codec types: TCH/AFS, TCH/AHS, TCH/EFS, TCH/FS, TCH/HS.
Used param.: FACCHSUP[all]
Elem. Object: Cell
Unit: %
Remarks: None

Information PM: SBS Key Performance Indicators System
68 A50016-G5100-A042-1-7618
11 CCCH Load related Performance Indicators The common control channels CCCH consist of a set of logical channels, which are used for common control signaling to start a connection setup:
CCCH Common Control Channels
RACH Random Access Channel
NCH Notification Channel
PCH Paging Channel
AGCH Access Grant Channel
UL
DL
MS requests a dedicated channel from network
paging of MSs in a voice group call area
paging of a MS in a location area (MTC)
answer to RACH, dedicated signaling channel allocation
Fig. 9 Overview Common Control Channels The SBS supports several channel combinations resulting in different capacities for the CCCHs. Although a certain channel combination can serve the expected RACH traffic load, another channel combination may be necessary. The RACH is only the uplink part of the CCCH. The downlink parts (AGCH, PCH) may need a higher capacity. Therefore, the configuration of CCCH is determined by the capacity needed for the downlink channels. The RACH configuration is not critical. The PCH and the AGCH share the same TDMA frame mapping (modulo 51) when combined onto a basic physical radio channel. PCH channels may be used as AGCH channels but not vice versa. However, to ensure a mobile a satisfactory access to the system, there is a control parameter (NBLKACGR) to define a fixed number of AGCH blocks in the 51 multiframe (a block consists of 4 consecutive TDMA frames). This number reduces the number of available paging blocks. In all cells where the advanced speech call item (ASCI) service is enabled, a notification channel (NCH) is defined. A parameter (NOCHBLKN) indicates the number of CCCH blocks to be used for the NCH channel. This logical channel is mapped onto contiguous blocks reserved for AGCHs, i.e. if this NCH is used, it takes capacity from the blocks reserved for AGCH channels. For the number of available CCCH frames, the following is defined: If for example a radio timeslot is configured as MBCCHC (main BCCH combined), then the allocated channel combination looks like this:
� FCCH + SCH + BCCH + CCCH + 4 (SDCCH + SACCH) MBCCHC
The timeslot will then run in the 51-Multiframe organization:

Information PM: SBS Key Performance Indicators System
69 A50016-G5100-A042-1-7618
S11
S1
F10
F0
BCCH 2 3 4 5
CCCH 6 7 8 9
CCCH12 13 14 15
CCCH16 17 18 19
S21
S31
F30
F20
SDCCH022 23 24 25
SDCCH126 27 28 29
SDCCH232 33 34 35
SDCCH336 37 38 39
S41
I50
F40
SACCH042 43 44 45
SACCH146 47 48 49
1.
1.
S11
S1
F10
F0
BCCH 2 3 4 5
CCCH 6 7 8 9
CCCH12 13 14 15
CCCH16 17 18 19
S21
S31
F30
F20
SDCCH022 23 24 25
SDCCH126 27 28 29
SDCCH232 33 34 35
SDCCH336 37 38 39
S41
I50
F40
SACCH242 43 44 45
SACCH346 47 48 492.
‘uplink’ R = RACH + SDCCH / 4
‘downlink’ BCCH + CCCH + 4 SDCCH / 4, F = FCCH, S = SCH
R5
R4
SDCCH30 1 2 3
SACCH26 7 8 9
SACCH310 11 1213
R15
R14
R17
R16
R19
R18
R21
R20
R23
R22
R25
R24
R27
R26
R29
R28
R31
R30
R33
R32
R36
R35
R34
SDCCH037 38 39 40
SDCCH141 42 43 44
R46
R45
SDCCH247 48 49 50
2.R5
R4
SDCCH30 1 2 3
SACCH06 7 8 9
SACCH110 11 1213
R15
R14
R17
R16
R19
R18
R21
R20
R23
R22
R25
R24
R27
R26
R29
R28
R31
R30
R33
R32
R36
R35
R34
SDCCH037 38 39 40
SDCCH141 42 43 44
R46
R45
SDCCH247 48 49 50
Fig. 10 Structure for an exemplary common control channel combination
In the downlink direction, for this example, there are 12 frames available for CCCH, which can be used as PCH, NCH, AGCH frames. But with the parameter NBLKACGR (number of blocks reserved for AGCH) some blocks can be inhibited for paging. A CCCH block consists of 4 consecutive TDMA frames (see above figure). In the uplink direction, for this example, there are 27 frames available for CCCH, which can be used as RACH frames. Note: The NCH channel is not considered, since Notification messages are used only by a very limited number of customers. Additionally, the portion of NCH channels is fixed by configuration and does not depend on any traffic load situations. Therefore, for dimensioning of the required downlink capacity of CCCH channels, only the load of the AGCH and PCH is important. If NCH channels are configured but not used (accessed), this capacity is available for AGCH channels.
Information PM: SBS Key Performance Indicators System
70 A50016-G5100-A042-1-7618
11.1 PCH load of downlink CCCH channels
Long name: PCH load of downlink CCCH channels
Short name: CCCHLDPCH
Description: This indicator will give you the PCH load of downlink CCCH channels, by meaning the number of accessed PCH frames over the air interface in relation to the number of defined CCCH frames downlink.
Formula:
downlink frames CCCH defined all ofNumber
downlink frames PCH accessed ofNumber CCCHLDPCH =
]NDEFCCCH[2
NTDMPCH[5]CCCHLDPCH =
Used param.: NTDMPCH[5], NDEFCCCH[2]
Elem. Object: Cell
Unit: None
Remarks: None
11.2 AGCH load of downlink CCCH channels
Long name: AGCH load of downlink CCCH channels
Short name: CCCHLDAGCH
Description: This indicator will give you the AGCH load of downlink CCCH channels, by meaning the number of accessed AGCH frames over the air interface in relation to the number of defined CCCH frames downlink.
Formula:
downlink frames CCCH defined all ofNumber
downlink frames AGCH accessed ofNumber CCCHLDAGCH=
]NDEFCCCH[2
,2]NTDMAGCH[1CCCHLDAGCH=
Used param.: NTDMAGCH[1,2], NDEFCCCH[2]
Elem. Object: Cell
Unit: None
Remarks: None

Information PM: SBS Key Performance Indicators System
71 A50016-G5100-A042-1-7618
11.3 CCCH load downlink
Long name: CCCH load downlink
Short name: CCCHLDDL
Description: This indicator will give you the CCCH load downlink, by meaning the number of accessed frames (PCH, AGCH) over the air interface in relation to the number of defined CCCH frames downlink.
Formula:
downlink frames CCCH defined all ofNumber
downlink frames CCCH accessed ofNumber CCCHLDDL =
]NDEFCCCH[2
,2]NTDMAGCH[1 NTDMPCH[5]CCCHLDDL
+=
Used param.: NTDMPCH[5], NTDMAGCH[1,2], NDEFCCCH[2]
Elem. Object: Cell
Unit: None
Remarks: The NCH channel is not considered, since Notification messages are used only by a very limited number of customers. Additionally, the portion of NCH channels is fixed by configuration and does not depend on any traffic load situations. Therefore, for dimensioning of the required downlink capacity of CCCH channels, only the load of the AGCH and PCH is important. If NCH channels are configured but not used (accessed), this capacity is available for AGCH channels.
11.4 CCCH load uplink
Long name: CCCH load uplink
Short name: CCCHLDUL
Description: This indicator will give you the CCCH load uplink, by meaning the number of received (RACH) over the air interface in relation to the number of defined CCCH frames uplink.
Formula:
uplink frames CCCH defined all ofNumber
uplink frames RACH received ofNumber CCCHLDUL =
]NDEFCCCH[1
,2,3]NINVRACH[1 ]NACSUCPR[3CCCHLDUL
+=
Used param.: NACSUCPR[3], NINVRACH[1,2,3], NDEFCCCH[1]
Elem. Object: Cell
Unit: None
Remarks: None

Information PM: SBS Key Performance Indicators System
72 A50016-G5100-A042-1-7618
11.5 PCH Loss Rate
Long name: PCH Loss Rate
Short name: PCHLossRate
Description: This indicator will give you the PCH Loss Rate by meaning the number of discarded subscriber pagings from the PCH queue related to the total number of subscriber pagings for transmission at the BTS. Each paging queue place in the BTS can be seized by one PAGING REQUEST message, which itself can contain the mobile subscriber identities (IMSI or TMSI) of up to 4 mobile subscribers simultaneously. This means that the PAGING REQUEST message can contain the mobile subscriber identities from up to 4 PAGING commands that were received from the BSC before. Whereas a discarded paging is always represented by one PAGING command message, that includes one TMSI or IMSI, which could not be placed in any BTS paging queue and therefore had to be discarded.
Formula:
]4..1[NTDMPCH
4]NTDMPCH[3,ePCHLossRat =
Used param.: NTDMPCH[1..4]
Elem. Object: Cell
Unit: None
Remarks: None
11.6 AGCH Loss Rate
Long name: AGCH Loss Rate
Short name: AGCHLossRate
Description: This indicator will give you the AGCH Loss Rate by meaning the number of discarded messages from the AGCH queue related to the total number of messages for transmission over the AGCH at the BTS.
Formula: ]4..1[
,4]NTDMAGCH[3teAGCHLossRa
NTDMAGCH=
Used param.: NTDMAGCH[1..4]
Elem. Object: Cell
Unit: None
Remarks: None

Information PM: SBS Key Performance Indicators System
73 A50016-G5100-A042-1-7618
11.7 Invalid RACH Rate
Long name: Invalid RACH Rate
Short name: InvRACHRate
Description: This indicator will give you the invalid RACH Rate by meaning the number of messages received on the RACH, which did not result in a CHANNEL REQUIRED message toward the BSC (e.g. Signal level too week) and therefore did not result in an SDCCH assignment attempt.
Formula:
]3[NACSUCPR]3..1[NINVRACH
..3]NINVRACH[1eInvRACHRat
+=
Used param.: NINVRACH[1..3], NACSUCPR[3]
Elem. Object: Cell
Unit: None
Remarks: It has to be considered that the NINVRACH does not represent the total amount of all RACH signals that are discarded by the BTS!
The Um layer 1 SW subsystem of the BTS continuously observes the signals received on the RACH slots. As even without any real MS RACH access there are always at least some ‘noise’ signals on the RACH, the task of the BTS layer 1 SW subsystem is to evaluate the received signal with respect to specific criteria that classify a signal as 'noisy' or 'not noisy'. These checks are performed prior to the evaluation of the criteria 'excessive distance', 'signal level too weak' and 'CRC checksum error'. Signals classified as 'noisy' are immediately discarded and are not counted by NINVRACH (!).
An increase of the NINVRACH counts and thus an increase of the ‘Invalid RACH Rate’ as calculated by the above formula does not mean a worse performance of the BTS. Instead, variations of the NINVRACH counts and variations of the 'Invalid RACH Rate' between the different sites mainly depend on the radio environment conditions, i.e. increased values of NINVRACH and this KPI are no indication for a poor system performance. Moreover, both figures depend on characteristics of the used TRX HW (old HW usually shows lower counter values, although the performance of the newer HW is better!).
For this reason the above formula cannot be regarded as a ‘System Performance Indicator’ but rather provides, taking into account which TRX HW is used, a rough idea about the radio conditions that influence the RACH performance!
For further details please refer to the NINVRACH counter description in the document 'PM:SBS Counter'.
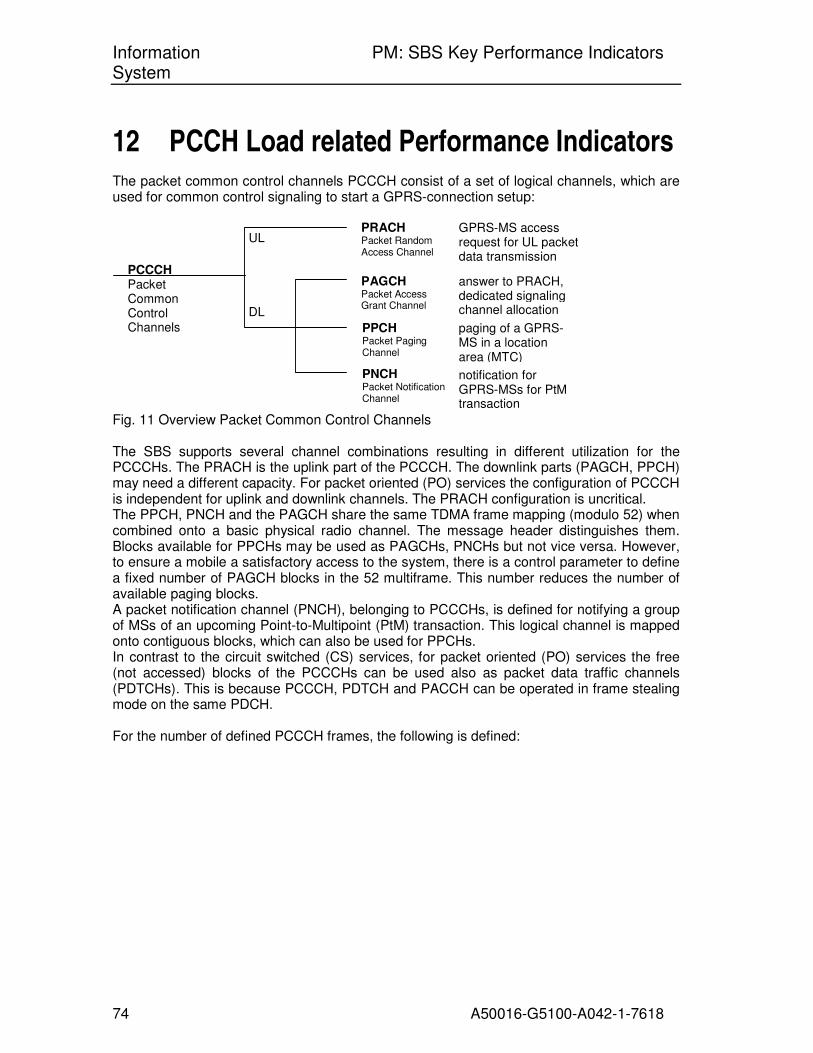
Information PM: SBS Key Performance Indicators System
74 A50016-G5100-A042-1-7618
12 PCCH Load related Performance Indicators The packet common control channels PCCCH consist of a set of logical channels, which are used for common control signaling to start a GPRS-connection setup:
PCCCH Packet Common Control Channels
PRACH Packet Random Access Channel
PNCH Packet Notification Channel
PPCH Packet Paging Channel
PAGCH Packet Access Grant Channel
UL
DL
GPRS-MS access request for UL packet data transmission
notification for GPRS-MSs for PtM transaction
paging of a GPRS-MS in a location area (MTC)
answer to PRACH, dedicated signaling channel allocation
Fig. 11 Overview Packet Common Control Channels The SBS supports several channel combinations resulting in different utilization for the PCCCHs. The PRACH is the uplink part of the PCCCH. The downlink parts (PAGCH, PPCH) may need a different capacity. For packet oriented (PO) services the configuration of PCCCH is independent for uplink and downlink channels. The PRACH configuration is uncritical. The PPCH, PNCH and the PAGCH share the same TDMA frame mapping (modulo 52) when combined onto a basic physical radio channel. The message header distinguishes them. Blocks available for PPCHs may be used as PAGCHs, PNCHs but not vice versa. However, to ensure a mobile a satisfactory access to the system, there is a control parameter to define a fixed number of PAGCH blocks in the 52 multiframe. This number reduces the number of available paging blocks. A packet notification channel (PNCH), belonging to PCCCHs, is defined for notifying a group of MSs of an upcoming Point-to-Multipoint (PtM) transaction. This logical channel is mapped onto contiguous blocks, which can also be used for PPCHs. In contrast to the circuit switched (CS) services, for packet oriented (PO) services the free (not accessed) blocks of the PCCCHs can be used also as packet data traffic channels (PDTCHs). This is because PCCCH, PDTCH and PACCH can be operated in frame stealing mode on the same PDCH. For the number of defined PCCCH frames, the following is defined:

Information PM: SBS Key Performance Indicators System
75 A50016-G5100-A042-1-7618
0 2 4 6 8 10 12 14 16 18 20 22 24 26 28 30 32 34 36 38 40 42 44 46 48 501 3 5 7 9 11 13 15 17 19 21 23 25 27 29 31 33 35 37 39 41 43 45 47 49 51
Block 1Block 0 Block 2 Block 3 Block 4 Block 5 Block 6 Block 7 Block 8 Block 9 Block 10 Block 11T
A
T
A
I I
Timing Advance control frameTA
Search frame for measurementsI
BSPBBLK = 2(PBCCH blocks)
BPAGCHR = 3 (no paging on these blocks)
Available Paging Blocks
PDCH with the 52-Multiframe Structure
Example for a PCCCH Configuration
0 1 2 3 4 5 6 7 8 9 10 11
Fig. 12 Structure for an exemplary packet common control channel combination The number of all defined PCCCH channels is dependent on the channel configuration defined by the parameter GDCH (GPRSDedicatedChannel). It can have the values PCCCH and PBCCH. If PCCCH is selected, then 12 blocks are available for PCCCH (see above figure). A block consists of 4 consecutive TDMA frames. If PBCCH is selected, then additionally the parameter BSPBBLK (number of blocks allocated for PBCCH) is relevant, because it reduces the number of available PCCCH blocks by the number of blocks reserved for PBCCH (see above figure). In downlink direction all defined PCCCH blocks can be used as PAGCH, PPCH, PNCH, PDTCH, PACCH. But with the parameter BPAGCHR (number of blocks reserved for PAGCH, PDTCH, PACCH) some blocks can be inhibited for paging. In uplink direction all defined PCCCH blocks can be used as PRACH, PDTCH, PACCH. But with the parameter BPRACHR (number of blocks reserved for the PRACH channel) the number of blocks being used for PRACH can be restricted.
Note: The following channels are not considered: PNCH, since the Packet Notification message is currently not supported by the call processing SW. PDTCH, PACCH, since these channels are mapped onto PCCCH channels (uplink/downlink) only, if there is spare capacity, i.e. in case of PCCCH channels being not fully loaded with common control channels. Therefore, for dimensioning of the required capacity of PCCCH channels, only the load of the PAGCH and PPCH (downlink) and PRACH (uplink) is important.

Information PM: SBS Key Performance Indicators System
76 A50016-G5100-A042-1-7618
12.1 PPCH load of downlink PCCCH channels
Long name: PPCH load of downlink PCCCH channels
Short name: PCCCHLDPPCH
Description: This indicator will give you the PPCH load of downlink PCCCH channels, by meaning the number of accessed PPCH frames over the air interface in relation to the number of defined PCCCH frames downlink.
Formula:
downlink frames PCCCH defined all ofNumber
downlink frames PPCH accessed ofNumber HPCCCHLDPPC =
]NDEFPCCC[2
,2]NTDMPPCH[1HPCCCHLDPPC =
Used param.: NTDMPPCH[1,2], NDEFPCCC[2]
Elem. Object: Cell
Unit: None
Remarks: None
12.2 PAGCH load of downlink PCCCH channels
Long name: PAGCH load of downlink PCCCH channels
Short name: PCCCHLDPAGCH
Description: This indicator will give you the PAGCH load of downlink PCCCH channels, by meaning the number of accessed PAGCH frames over the air interface in relation to the number of defined PCCCH frames downlink.
Formula:
downlink frames PCCCH defined all ofNumber
downlink frames PAGCH accessed ofNumber CHPCCCHLDPAG =
]NDEFPCCC[2
,2]NTDMPAGC[1CHPCCCHLDPAG =
Used param.: NTDMPAGC[1,2], NDEFPCCC[2]
Elem. Object: Cell
Unit: None
Remarks: None

Information PM: SBS Key Performance Indicators System
77 A50016-G5100-A042-1-7618
12.3 PCCCH load downlink
Long name: PCCCH load downlink
Short name: PCCCHLDDL
Description: This indicator will give you the PCCCH load downlink, by meaning the number of accessed frames (PPCH, PAGCH) over the air interface in relation to the number of defined PCCCH frames downlink.
Formula:
downlink frames PCCCH defined all ofNumber
downlink frames PCCCH accessed ofNumber PCCCHLDDL =
]NDEFPCCC[2
,2]NTDMPAGC[1 ,2]NTDMPPCH[1PCCCHLDDL
+=
Used param.: NTDMPPCH[1,2], NTDMPAGC[1,2], NDEFPCCC[2]
Elem. Object: Cell
Unit: None
Remarks: The following channels are not considered: PNCH, since the Packet Notification message is currently not supported by the call processing SW. PDTCH, PACCH, since these channels are mapped onto PCCCH channels (uplink/downlink) only, if there is spare capacity, i.e. in case of PCCCH channels being not fully loaded with common control channels. � Only the load of the PAGCH and PPCH is important
12.4 PCCCH load uplink
Long name: PCCCH load uplink
Short name: PCCCHLDUL
Description: This indicator will give you the PCCCH load uplink, by meaning the number of received (PRACH) over the air interface in relation to the number of defined PCCCH frames uplink.
Formula:
uplink frames PCCCH defined all ofNumber
uplink frames PRACH received ofNumber PCCCHLDUL =
]NDEFPCCC[1
]NSAPRACH[1PCCCHLDUL =
Used param.: NSAPRACH[1], NDEFPCCC[1]
Elem. Object: Cell
Unit: None
Remarks: The following channels are not considered: PDTCH since these channels are mapped onto PCCCH channels (uplink/downlink) only, if there is spare capacity, i.e. in case of PCCCH channels being not fully loaded with common control channels.
� Only the load of the PRACH is important.
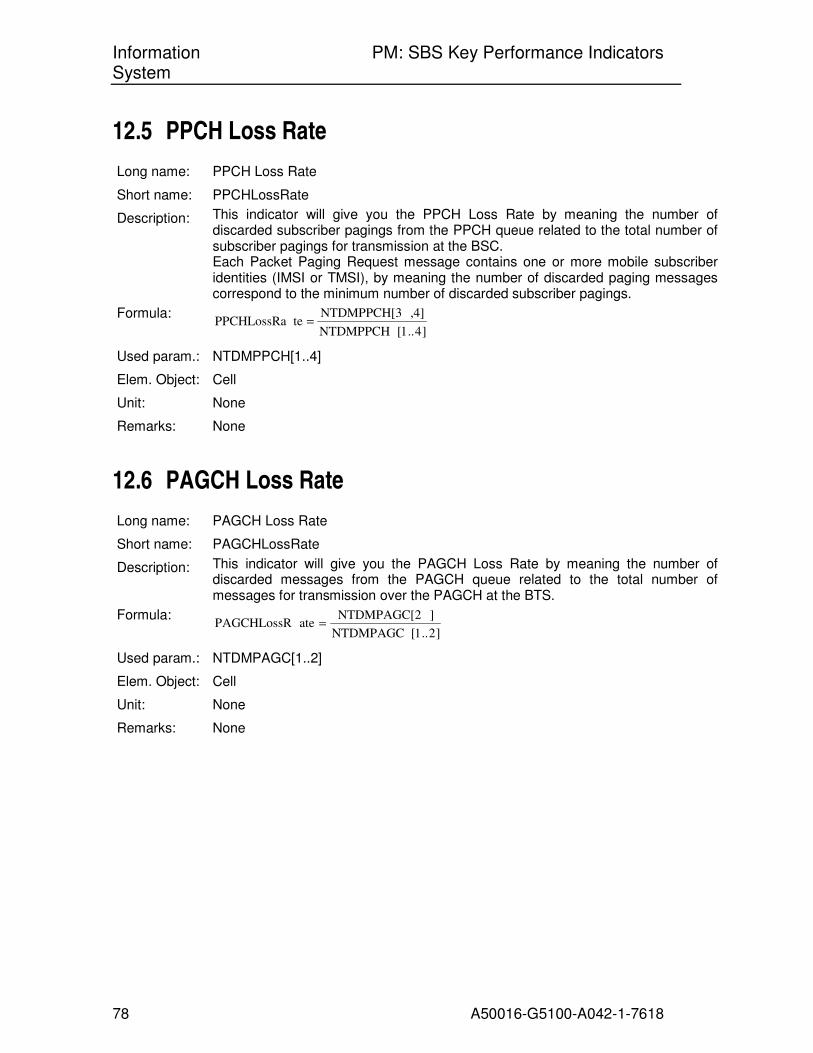
Information PM: SBS Key Performance Indicators System
78 A50016-G5100-A042-1-7618
12.5 PPCH Loss Rate
Long name: PPCH Loss Rate
Short name: PPCHLossRate
Description: This indicator will give you the PPCH Loss Rate by meaning the number of discarded subscriber pagings from the PPCH queue related to the total number of subscriber pagings for transmission at the BSC. Each Packet Paging Request message contains one or more mobile subscriber identities (IMSI or TMSI), by meaning the number of discarded paging messages correspond to the minimum number of discarded subscriber pagings.
Formula:
]4..1[NTDMPPCH
,4]NTDMPPCH[3tePPCHLossRa =
Used param.: NTDMPPCH[1..4]
Elem. Object: Cell
Unit: None
Remarks: None
12.6 PAGCH Loss Rate
Long name: PAGCH Loss Rate
Short name: PAGCHLossRate
Description: This indicator will give you the PAGCH Loss Rate by meaning the number of discarded messages from the PAGCH queue related to the total number of messages for transmission over the PAGCH at the BTS.
Formula:
]2..1[NTDMPAGC
]NTDMPAGC[2atePAGCHLossR =
Used param.: NTDMPAGC[1..2]
Elem. Object: Cell
Unit: None
Remarks: None

Information PM: SBS Key Performance Indicators System
79 A50016-G5100-A042-1-7618
12.7 Invalid PRACH Rate
Long name: Invalid PRACH Rate
Short name: InvPRACHRate
Description: This indicator will give you the invalid PRACH Rate by meaning the number of messages received on the PRACH, which did not result in a Packet CHANNEL REQUIRED message toward the BSC (e.g. Signal level too week) and therefore did not result in an assignment of a TBF.
Formula: (a)
..4]NSAPRACH[1
]4..2[teInvPRACHRa
NSAPRACH=
Used param.: NSAPRACH[1..4]
Elem. Object: Cell
Unit: None
Remarks: It has to be considered that the NSAPRACH does not represent the total amount of all PRACH signals that are discarded by the BTS!
The Um layer 1 SW subsystem of the BTS continuously observes the signals received on the PRACH slots. As even without any real MS PRACH access there are always at least some ‘noise’ signals on the PRACH, the task of the BTS layer 1 SW subsystem is to evaluate the received signal with respect to specific criteria that classify a signal as 'noisy' or 'not noisy'. These checks are performed prior to the evaluation of the criteria 'excessive distance', 'signal level too weak' and 'CRC checksum error'. Signals classified as 'noisy' are immediately discarded and are not counted by NSAPRACH (!).
An increase of the NSAPRACH counts and thus an increase of the ‘Invalid PRACH Rate’ as calculated by the above formula does not mean a worse performance of the BTS. Instead, variations of the NSAPRACH counts and variations of the 'Invalid PRACH Rate' between the different sites mainly depend on the radio environment conditions, i.e. increased values of NSAPRACH and this KPI are no indication for a poor system performance. Moreover, both figures depend on characteristics of the used TRX HW (old HW usually shows lower counter values, although the performance of the newer HW is better!).
For this reason the above formula cannot be regarded as a ‘System Performance Indicator’ but rather provides, taking into account which TRX HW is used, a rough idea about the radio conditions that influence the PRACH performance!
For further details please refer to the NSAPRACH counter description in the document 'PM:SBS Counter'.

Information PM: SBS Key Performance Indicators System
80 A50016-G5100-A042-1-7618
13 Service related Performance Indicators
13.1 Total number of Service Requests
Long name: (a) Total number of service requests
Short name: (a) ServRequests
Description: This indicator provides the total number of Service requests including all service types, triggered by CHANNEL ALLOCATION REQUEST.
Formula: (a) ServRequests = CHALNHLY[19..27]
Used param.: CHALNHLY[19..27]
Elem. Object: BTS
Unit None
Remarks: None
13.2 Service Request Distribution Rate
Long name: (a) SDCA Distribution for Signaling (SDCCH)
(b) SDCA Distribution for CS speech
(c) SDCA Distribution for CS speech AMR FR
(d) SDCA Distribution for CS speech AMR HR
(e) SDCA Distribution for CS data
(f) SDCA Distribution for HSCSD
(g) SDCA Distribution for GPRS
(h) SDCA Distribution for EGPRS
(i) SDCA Distribution for ASCI
Short name: (a) SDCADistSignal
(b) SDCADistCS
(c) SDCADistAMRFR
(d) SDCADistAMRHR
(e) SDCADistCSData
(f) SDCADistHSCSD
(g) SDCADistGPRS
(h) SDCADistEGPRS
(i) SDCADistASCI
Description: This indicator will give you the Service Dependent Channel Allocation Distribution rate, showing the particular service dependent channel allocation requests related to the total number of Channel Allocations Requests.
Formula: (a)
tsServReques
9]CHALNHLY[1gnalSDCADistSi =
(b) tsServReques
0]CHALNHLY[2SDCADistCS=

Information PM: SBS Key Performance Indicators System
81 A50016-G5100-A042-1-7618
(c) tsServReques
1]CHALNHLY[2RFRSDCADistAM =
(d) tsServReques
2]CHALNHLY[2RHRSDCADistAM =
(e) tsServReques
3]CHALNHLY[2DataSDCADistCS =
(f) tsServReques
4]CHALNHLY[2CSDSDCADistHS =
(g) tsServReques
5]CHALNHLY[2RSSDCADistGP =
(h) tsServReques
6]CHALNHLY[2PRSSDCADistEG =
(i) tsServReques
7]CHALNHLY[2CISDCADistAS =
Used param.: CHALNHLY[19..27], ServRequests(13.1(a))
Elem. Object: BTS
Unit None
Remarks: The indicator only considers radio failures but no TCH losses (blockings) during the assignment procedure, i.e. it is assumed that enough TCH resources are available
13.3 Rate of Service Requests served in the highest layer
Long name: (a) Rate of Service Requests served in highest layer
Short name: (a) ServRequestsRate
Description: These indicators will give you the Service Request Success Rate. All Service Channel Requests served in the highest layer are considered.
Formula: (a)
tsServReques
..18]CHALNHLY[11tRateServReques −=
Used param.: CHALNHLY[1..18], ServRequests(13.1(a))
Elem. Object: BTS
Unit None
Remarks: Service requests not supported and not served in the highest layer are subtracted.

Information PM: SBS Key Performance Indicators System
82 A50016-G5100-A042-1-7618
14 Feature related Performance Indicators
14.1 Abis Pool Traffic Utilization
Long name: (a) Mean number of defined Abis subchannels
(b) Mean number of available Abis subchannels
(c) Abis subchannel availability rate
(d) Number of attempted Abis subchannel seizures
(e) Number of successful Abis subchannel seizures
(f) Number of unsuccessful Abis subchannel seizure attempts
(g) Abis Pool Traffic offered
(h) Abis Pool Traffic carried
(i) Abis Pool Traffic lost
(j) Abis Pool Loss Rate
(k) Abis Pool Blocking Probability
(l) Abis Pool Traffic Utilisation
(m) Abis Pool Peak Traffic Utilisation
Short name: (a) AbisPDefCh
(b) AbisPAvailCh
(c) AbisPAvailRate
(d) AbisPAttSeiz
(e) AbisPSuccSeiz
(f) AbisPUnsuccSeiz
(g) AbisPTrOff
(h) AbisPTrCar
(i) AbisPTrLost
(j) AbisPLossRate
(k) AbisPBlockProb
(l) AbisPTrafUtil
(m) AbisPTrafUtilPeak
Description: With the Abis Pool Supervision measurements it is possible to evaluate the most important load, capacity and quality related KPIs for the Abis Interface.
Formula: (a) ]ABISPSUP[1 AbisPDefCh =
(b) ]ABISPSUP[2 Ch AbisPAvail =
(c) ]ABISPSUP[1
]ABISPSUP[2 RateAbisPAvail =
(d) ]ABISPSUP[7 ]ABISPSUP[6 izAbisPAttSe +=
(e) ]ABISPSUP[6 eizAbisPSuccS =
(f) ]ABISPSUP[7 cSeizAbisPUnsuc =
(g) )]ABISPSUP[6
]ABISPSUP[7(1 * ]ABISPSUP[3 AbisPTrOff +=

Information PM: SBS Key Performance Indicators System
83 A50016-G5100-A042-1-7618
(h) ]ABISPSUP[3 AbisPTrCar =
(i) ]ABISPSUP[6
]ABISPSUP[7 * ]ABISPSUP[3 t AbisPTrLos =
(j) ]ABISPSUP[7 ]ABISPSUP[6
]ABISPSUP[7 ateAbisPLossR
+=
(k) Periody Granularit
]ABISPSUP[5 ProbAbisPBlock =
(l) ]ABISPSUP[1
]ABISPSUP[3 tilAbisPTrafU =
(m) ]ABISPSUP[1
]ABISPSUP[4 tilPeak AbisPTrafU =
Used param.: ABISPSUP[1..7]
Elem. Object: Cell
Unit: None
Remarks: None
14.2 I-FRAME Discard Rate on Abis-Interface BSC side
Long name: (a) Loss rate of transmitted I-Frames on BSC side
(b) Loss rate of received I-Frames on BSC side
(c) I-Frame Error Rate on Abis at BSC side
Short name: (a) IFramesDiscRateBSCTransmitted
(b) IFramesDiscRateBSCReceived
(c) IFramesErrorRateBSE
Description: (a,b) This indicator will give you the I-Frame Loss Rate by meaning the number of discarded or badly received I-Frames related to the total number of transmitted I-Frames of the LAPD protocol on the Abis-Interface on BSC side.
(c) This indicator will give you the LAPD I-Frame Error Rate on Abis at BSC, by meaning the difference of the number of transmitted I-Frames at BTSE and the number of correctly received I-Frames at BSC in relation to the total number of transmitted I-Frames at BTSE.
Formula: (a)
,2]IFRMABSC[1
]IFRMABSC[2 ansmittedcRateBSCTrIFramesDis =
(b) ,4]IFRMABSC[3
]IFRMABSC[4 ceivedcRateBSCReIFramesDis =
(c) ]IFRMABIS[1
,4]IFRMABSC[3 - ]IFRMABIS[1 orRateBSCIFramesErr =
Used param.: IFRMABSC [all]
Elem. Object: BSC
Unit None

Information PM: SBS Key Performance Indicators System
84 A50016-G5100-A042-1-7618
Remarks: Only I-Frames with SAPI = 0 (radio signalling link) and SAPI = 62 (O&M connection) are considered.
14.3 I-FRAME Discard Rate on Abis-Interface BTSE side
Long name: (a) Loss rate of transmitted I-Frames on BTSE side
(b) Loss rate of received I-Frames on BTSE side
(c) I-Frame Error Rate on Abis at BTSE
Short name: (a) IFramesDiscRateBTSETransmitted
(b) IFramesDiscRateBTSEReceived
(c) IFramesErrorRateBTSE
Description: (a,b) This indicator will give you the I-Frame Loss Rate by meaning the number of discarded or badly received I-Frames related to the total number of transmitted I-Frames of the LAPD protocol on the Abis-Interface on BTSE side.
(c) This indicator will give you the LAPD I-Frame Error Rate on Abis at BTSE, by meaning the difference of the number of transmitted I-Frames at BSC and the number of correctly received I-Frames at BTSE in relation to the total number of transmitted I-Frames at BSC.
Formula: (a)
,2]IFRMABIS[1
]IFRMABIS[2 ransmittedcRateBTSETIFramesDis =
(b) ,4]IFRMABIS[3
]IFRMABIS[4 eceivedcRateBTSERIFramesDis =
(c) ]IFRMABSC[1
,4]IFRMABIS[3 - ]IFRMABSC[1 orRateBTSEIFramesErr =
Used param.: IFRMABIS [all], IFRMABSC[1]
Elem. Object: BSC
Unit None
Remarks: Only I-Frames with SAPI = 0 (radio signalling link) and SAPI = 62 (O&M connection) are considered.
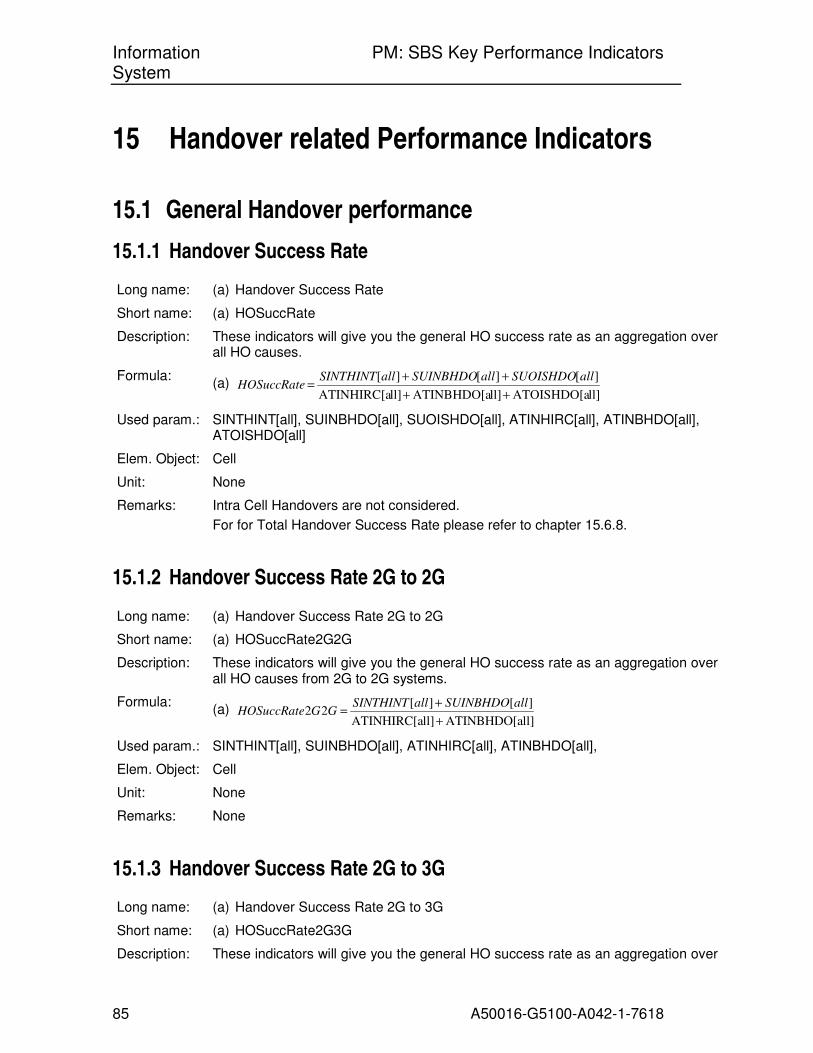
Information PM: SBS Key Performance Indicators System
85 A50016-G5100-A042-1-7618
15 Handover related Performance Indicators
15.1 General Handover performance
15.1.1 Handover Success Rate
Long name: (a) Handover Success Rate
Short name: (a) HOSuccRate
Description: These indicators will give you the general HO success rate as an aggregation over all HO causes.
Formula: (a)
ll]ATOISHDO[all]ATINBHDO[all]ATINHIRC[a
][][][
++
++=
allSUOISHDOallSUINBHDOallSINTHINTHOSuccRate
Used param.: SINTHINT[all], SUINBHDO[all], SUOISHDO[all], ATINHIRC[all], ATINBHDO[all], ATOISHDO[all]
Elem. Object: Cell
Unit: None
Remarks: Intra Cell Handovers are not considered.
For for Total Handover Success Rate please refer to chapter 15.6.8.
15.1.2 Handover Success Rate 2G to 2G
Long name: (a) Handover Success Rate 2G to 2G
Short name: (a) HOSuccRate2G2G
Description: These indicators will give you the general HO success rate as an aggregation over all HO causes from 2G to 2G systems.
Formula: (a)
ll]ATINBHDO[all]ATINHIRC[a
][][22
+
+=
allSUINBHDOallSINTHINTGGHOSuccRate
Used param.: SINTHINT[all], SUINBHDO[all], ATINHIRC[all], ATINBHDO[all],
Elem. Object: Cell
Unit: None
Remarks: None
15.1.3 Handover Success Rate 2G to 3G
Long name: (a) Handover Success Rate 2G to 3G
Short name: (a) HOSuccRate2G3G
Description: These indicators will give you the general HO success rate as an aggregation over
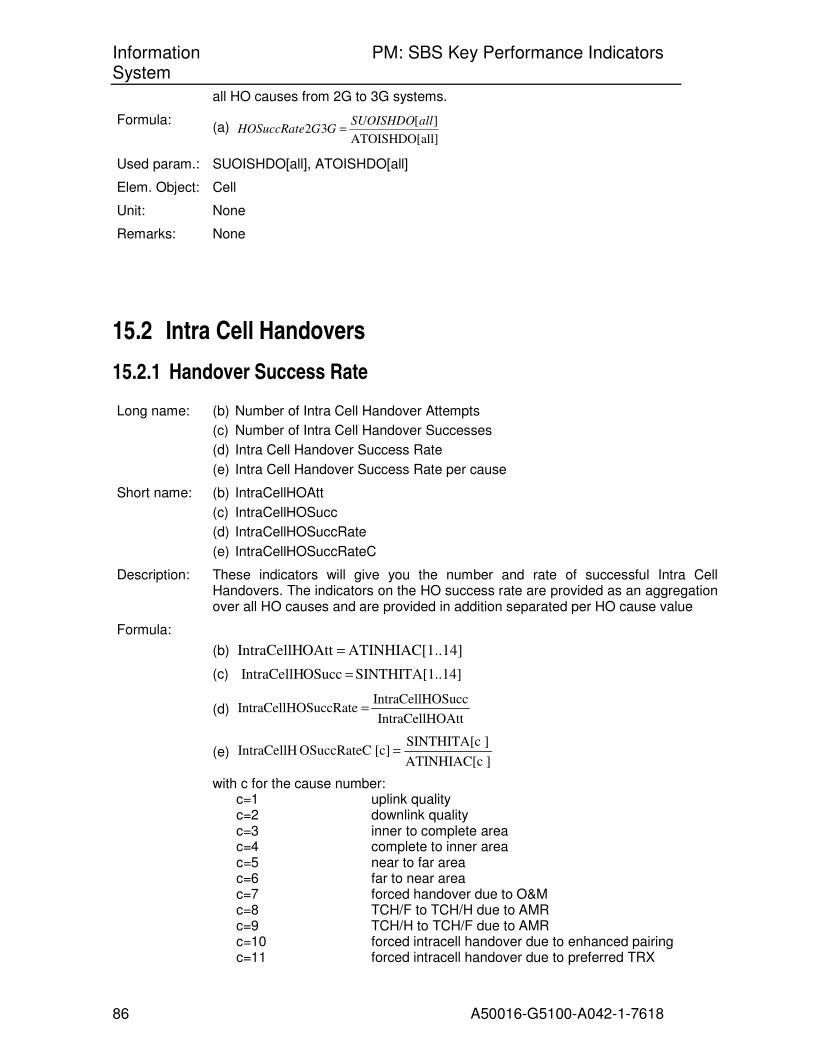
Information PM: SBS Key Performance Indicators System
86 A50016-G5100-A042-1-7618
all HO causes from 2G to 3G systems.
Formula: (a)
ll]ATOISHDO[a
][32
allSUOISHDOGGHOSuccRate =
Used param.: SUOISHDO[all], ATOISHDO[all]
Elem. Object: Cell
Unit: None
Remarks: None
15.2 Intra Cell Handovers
15.2.1 Handover Success Rate
Long name: (b) Number of Intra Cell Handover Attempts
(c) Number of Intra Cell Handover Successes
(d) Intra Cell Handover Success Rate
(e) Intra Cell Handover Success Rate per cause
Short name: (b) IntraCellHOAtt
(c) IntraCellHOSucc
(d) IntraCellHOSuccRate
(e) IntraCellHOSuccRateC
Description: These indicators will give you the number and rate of successful Intra Cell Handovers. The indicators on the HO success rate are provided as an aggregation over all HO causes and are provided in addition separated per HO cause value
Formula:
(b) ..14]ATINHIAC[1 OAtt IntraCellH =
(c) ..14]SINTHITA[1 OSuccIntraCellH =
(d) OAttIntraCellH
OSuccIntraCellH OSuccRateIntraCellH =
(e) ]ATINHIAC[c
]SINTHITA[c [c]OSuccRateCIntraCellH =
with c for the cause number: c=1 uplink quality c=2 downlink quality c=3 inner to complete area c=4 complete to inner area c=5 near to far area c=6 far to near area c=7 forced handover due to O&M c=8 TCH/F to TCH/H due to AMR c=9 TCH/H to TCH/F due to AMR c=10 forced intracell handover due to enhanced pairing c=11 forced intracell handover due to preferred TRX
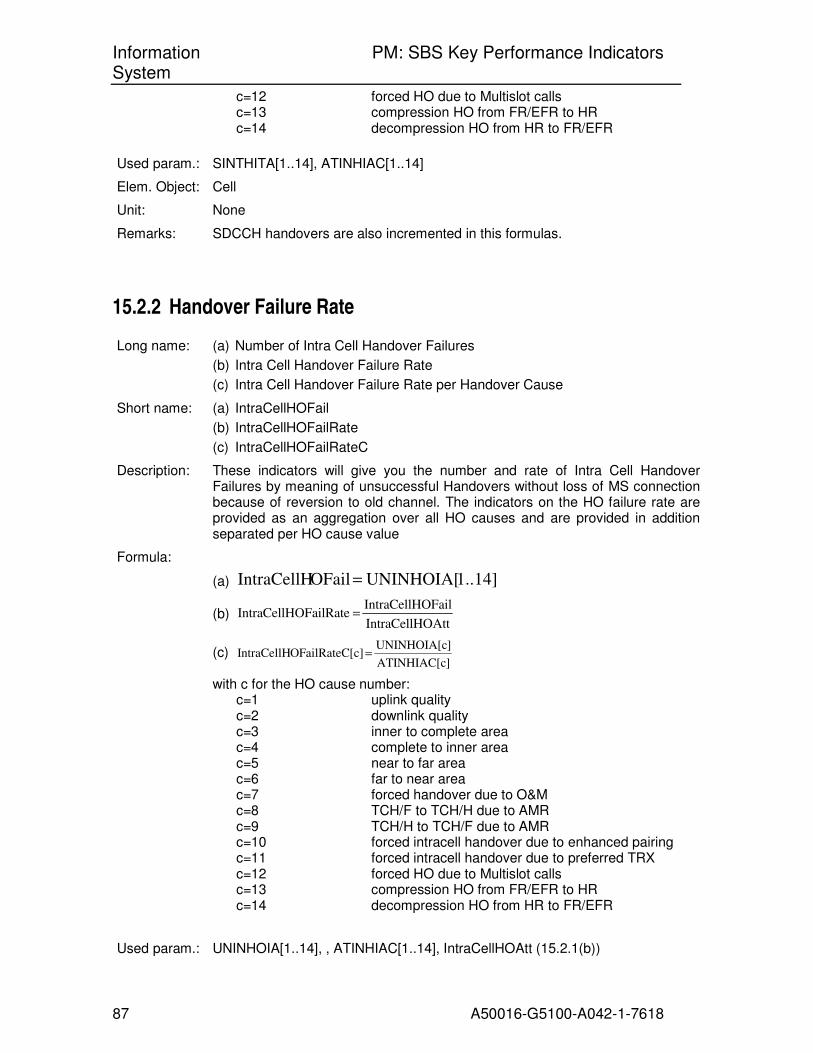
Information PM: SBS Key Performance Indicators System
87 A50016-G5100-A042-1-7618
c=12 forced HO due to Multislot calls c=13 compression HO from FR/EFR to HR c=14 decompression HO from HR to FR/EFR
Used param.: SINTHITA[1..14], ATINHIAC[1..14]
Elem. Object: Cell
Unit: None
Remarks: SDCCH handovers are also incremented in this formulas.
15.2.2 Handover Failure Rate
Long name: (a) Number of Intra Cell Handover Failures
(b) Intra Cell Handover Failure Rate
(c) Intra Cell Handover Failure Rate per Handover Cause
Short name: (a) IntraCellHOFail
(b) IntraCellHOFailRate
(c) IntraCellHOFailRateC
Description: These indicators will give you the number and rate of Intra Cell Handover Failures by meaning of unsuccessful Handovers without loss of MS connection because of reversion to old channel. The indicators on the HO failure rate are provided as an aggregation over all HO causes and are provided in addition separated per HO cause value
Formula:
(a) 1..14] UNINHOIA[ OFailIntraCellH =
(b) OAttIntraCellH
OFailIntraCellH OFailRateIntraCellH =
(c) ]ATINHIAC[c
]UNINHOIA[c [c]OFailRateCIntraCellH =
with c for the HO cause number: c=1 uplink quality c=2 downlink quality c=3 inner to complete area c=4 complete to inner area c=5 near to far area c=6 far to near area c=7 forced handover due to O&M c=8 TCH/F to TCH/H due to AMR c=9 TCH/H to TCH/F due to AMR c=10 forced intracell handover due to enhanced pairing c=11 forced intracell handover due to preferred TRX c=12 forced HO due to Multislot calls c=13 compression HO from FR/EFR to HR c=14 decompression HO from HR to FR/EFR
Used param.: UNINHOIA[1..14], , ATINHIAC[1..14], IntraCellHOAtt (15.2.1(b))

Information PM: SBS Key Performance Indicators System
88 A50016-G5100-A042-1-7618
Elem. Object: Cell
Unit: None
Remarks: SDCCH handovers are also incremented in this formula.
15.2.3 Handover Drop Rate
Long name: (a) Number of Intra Cell Handover Drops
(b) Intra Cell Handover Drop Rate
(c) Intra Cell Handover Drop Rate per Handover Cause
Short name: (a) IntraCellHODrop
(b) IntraCellHODropRate
(c) IntraCellHODropRateC
Description: These indicators will give you the number and rate of Intra Cell Handover Drops by meaning of unsuccessful Handovers with loss of MS connection. The indicators on the HO drop rate are provided as an aggregation over all HO causes and are provided in addition separated per HO cause value
Formula: (a) 1] UNIHIALC[ ODropIntraCellH =
(b) OAttIntraCellH
ODropIntraCellH ODropRateIntraCellH =
(c) ]ATINHIAC[c
]UNINHOIA[c-]SINTHITA[c-]ATINHIAC[c [c]ODropRateCIntraCellH =
with c for the HO cause number: c=1 uplink quality c=2 downlink quality c=3 inner to complete area c=4 complete to inner area c=5 near to far area c=6 far to near area c=7 forced handover due to O&M c=8 TCH/F to TCH/H due to AMR c=9 TCH/H to TCH/F due to AMR c=10 forced intracell handover due to enhanced pairing c=11 forced intracell handover due to preferred TRX c=12 forced HO due to Multislot calls c=13 compression HO from FR/EFR to HR c=14 decompression HO from HR to FR/EFR
Used param.: UNIHIALC[1], ATINHIAC[1..14], SINTHITA[1..14], UNINHOIA[1..14], IntraCellHOAtt (15.2.1(b))
Elem. Object: Cell
Unit: None
Remarks: SDCCH handovers are also incremented in this formulas. User release during Handover will lead to very small systematic errors.
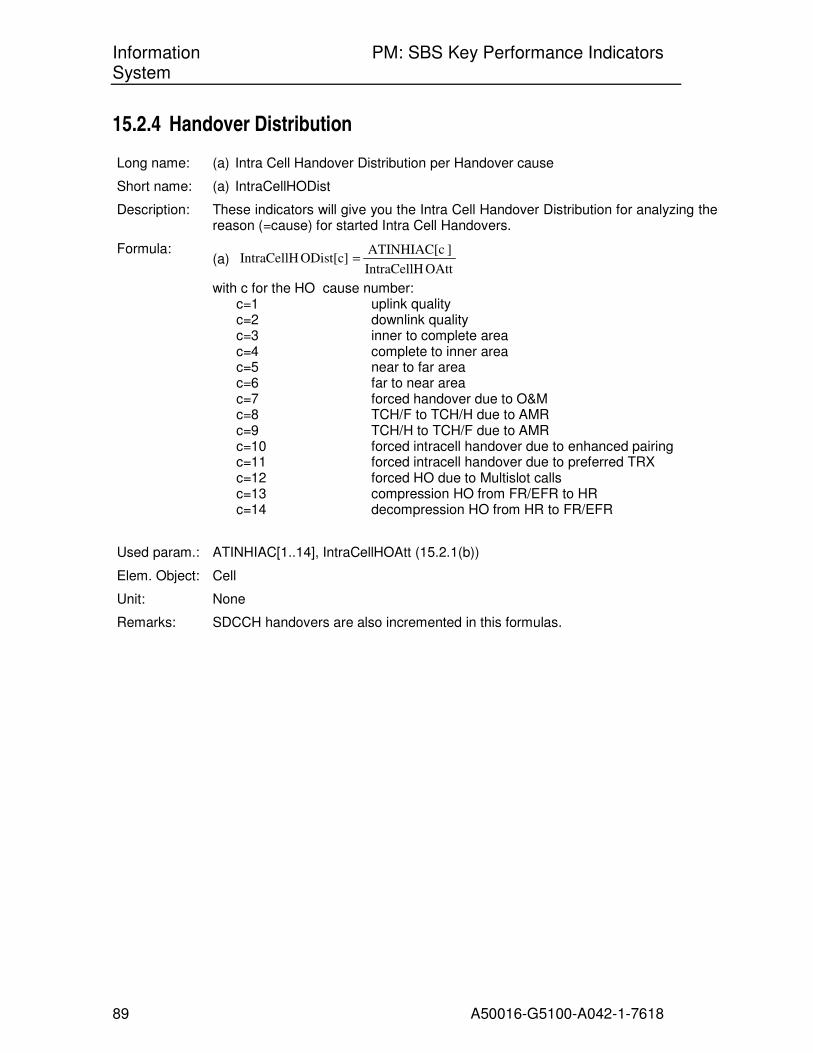
Information PM: SBS Key Performance Indicators System
89 A50016-G5100-A042-1-7618
15.2.4 Handover Distribution
Long name: (a) Intra Cell Handover Distribution per Handover cause
Short name: (a) IntraCellHODist
Description: These indicators will give you the Intra Cell Handover Distribution for analyzing the reason (=cause) for started Intra Cell Handovers.
Formula: (a)
OAttIntraCellH
]ATINHIAC[c ODist[c]IntraCellH =
with c for the HO cause number: c=1 uplink quality c=2 downlink quality c=3 inner to complete area c=4 complete to inner area c=5 near to far area c=6 far to near area c=7 forced handover due to O&M c=8 TCH/F to TCH/H due to AMR c=9 TCH/H to TCH/F due to AMR c=10 forced intracell handover due to enhanced pairing c=11 forced intracell handover due to preferred TRX c=12 forced HO due to Multislot calls c=13 compression HO from FR/EFR to HR c=14 decompression HO from HR to FR/EFR
Used param.: ATINHIAC[1..14], IntraCellHOAtt (15.2.1(b))
Elem. Object: Cell
Unit: None
Remarks: SDCCH handovers are also incremented in this formulas.

Information PM: SBS Key Performance Indicators System
90 A50016-G5100-A042-1-7618
15.2.5 SDCCH Handover Success Rate
Long name: (a) Number of Intra Cell SDCCH Handover Attempts
(b) Number of Intra Cell SDCCH Handover Successes
(c) Intra Cell SDCCH Handover Success Rate
Short name: (a) IntraCellSDHOAtt
(b) IntraCellSDHOSucc
(c) IntraCellSDHOSuccRate
Description: These indicators will give you the rate of successful Intra Cell SDCCH Handovers.
Formula: (a) ]AISHINTR[1 DHOAtt IntraCellS =
(b) ]SISHINTR[1 DHOSuccIntraCellS =
(c) DHOAttIntraCellS
DHOSuccIntraCellS eDHOSuccRatIntraCellS =
Used param.: AISHINTR[1], SISHINTR[1]
Elem. Object: Cell
Unit: None
Remarks: None
15.2.6 SDCCH Handover Failure Rate
Long name: (a) Number of Intra Cell SDCCH Handover Failures
(b) Intra Cell SDCCH Handover Failure Rate
Short name: (a) IntraCellSDHOFail
(b) IntraCellSDHOFailRate
Description: These indicators will give you the number and rate of Intra Cell SDCCH Handover Failures by meaning of unsuccessful SDCCH Handovers without loss of MS connection because of reversion to old cell.
Formula: (a) 1] UISHINTR[ DHOFailIntraCellS =
(b) DHOAttIntraCellS
DHOFailIntraCellS eDHOFailRatIntraCellS =
Used param.: UISHINTR[1], IntraCellSDHOAtt (15.2.5(a))
Elem. Object: Cell
Unit: None
Remarks: None

Information PM: SBS Key Performance Indicators System
91 A50016-G5100-A042-1-7618
15.2.7 SDCCH Handover Drop Rate
Long name: (a) Number of Intra Cell SDCCH Handover Drops
(b) Intra Cell SDCCH Handover Drop Rate
Short name: (a) IntraCellSDHODrop
(b) IntraCellSDHODropRate
Description: These indicators will give you the number and rate of Intra Cell SDCCH Handover Drops by meaning of unsuccessful SDCCH Handovers with loss of MS connection.
Formula: (a) 1] UISHIALC[ DHODropIntraCellS =
(b) DHOAttIntraCellS
DHODropIntraCellS eDHODropRatIntraCellS =
Used param.: UISHIALC[1], IntraCellHOAtt (15.2.5(a))
Elem. Object: Cell
Unit: None
Remarks: None
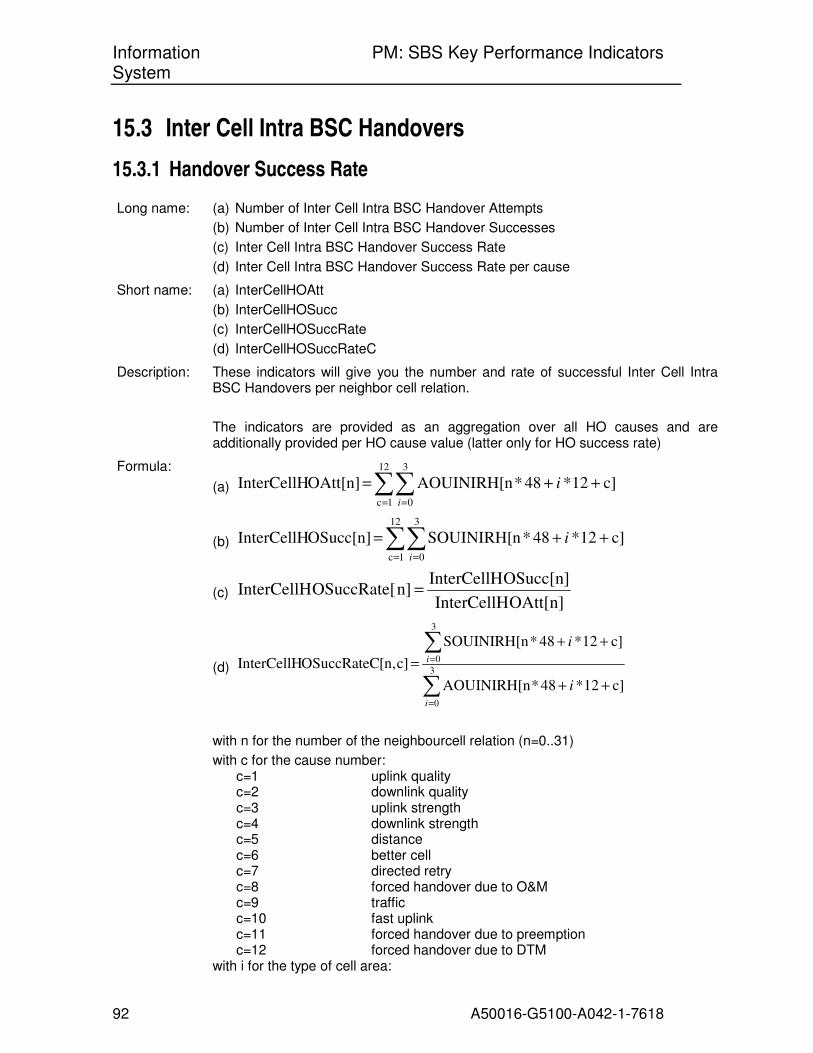
Information PM: SBS Key Performance Indicators System
92 A50016-G5100-A042-1-7618
15.3 Inter Cell Intra BSC Handovers
15.3.1 Handover Success Rate
Long name: (a) Number of Inter Cell Intra BSC Handover Attempts
(b) Number of Inter Cell Intra BSC Handover Successes
(c) Inter Cell Intra BSC Handover Success Rate
(d) Inter Cell Intra BSC Handover Success Rate per cause
Short name: (a) InterCellHOAtt
(b) InterCellHOSucc
(c) InterCellHOSuccRate
(d) InterCellHOSuccRateC
Description: These indicators will give you the number and rate of successful Inter Cell Intra BSC Handovers per neighbor cell relation.
The indicators are provided as an aggregation over all HO causes and are additionally provided per HO cause value (latter only for HO success rate)
Formula:
(a) ∑∑= =
++=12
1c
3
0
c]12*48*AOUINIRH[n OAtt[n]InterCellHi
i
(b) ∑∑= =
++=12
1c
3
0
c]12*48*SOUINIRH[n OSucc[n]InterCellHi
i
(c) OAtt[n]InterCellH
OSucc[n]InterCellH n]OSuccRate[InterCellH =
(d)
∑
∑
=
=
++
++
=3
0
3
0
c]12*48*AOUINIRH[n
c]12*48*SOUINIRH[n
c][n,OSuccRateCInterCellH
i
i
i
i
with n for the number of the neighbourcell relation (n=0..31)
with c for the cause number: c=1 uplink quality c=2 downlink quality c=3 uplink strength c=4 downlink strength c=5 distance c=6 better cell c=7 directed retry c=8 forced handover due to O&M c=9 traffic c=10 fast uplink c=11 forced handover due to preemption c=12 forced handover due to DTM
with i for the type of cell area:
Information PM: SBS Key Performance Indicators System
93 A50016-G5100-A042-1-7618
i = 0 complete-complete area i = 1 complete-inner area i = 2 inner-complete area i = 3 inner-inner area
Used param.: AOUINIRH[all], SOUINIRH[all]
Elem. Object: Neighbourcell
Unit: None
Remarks: SDCCH handovers are also incremented in these formulas.
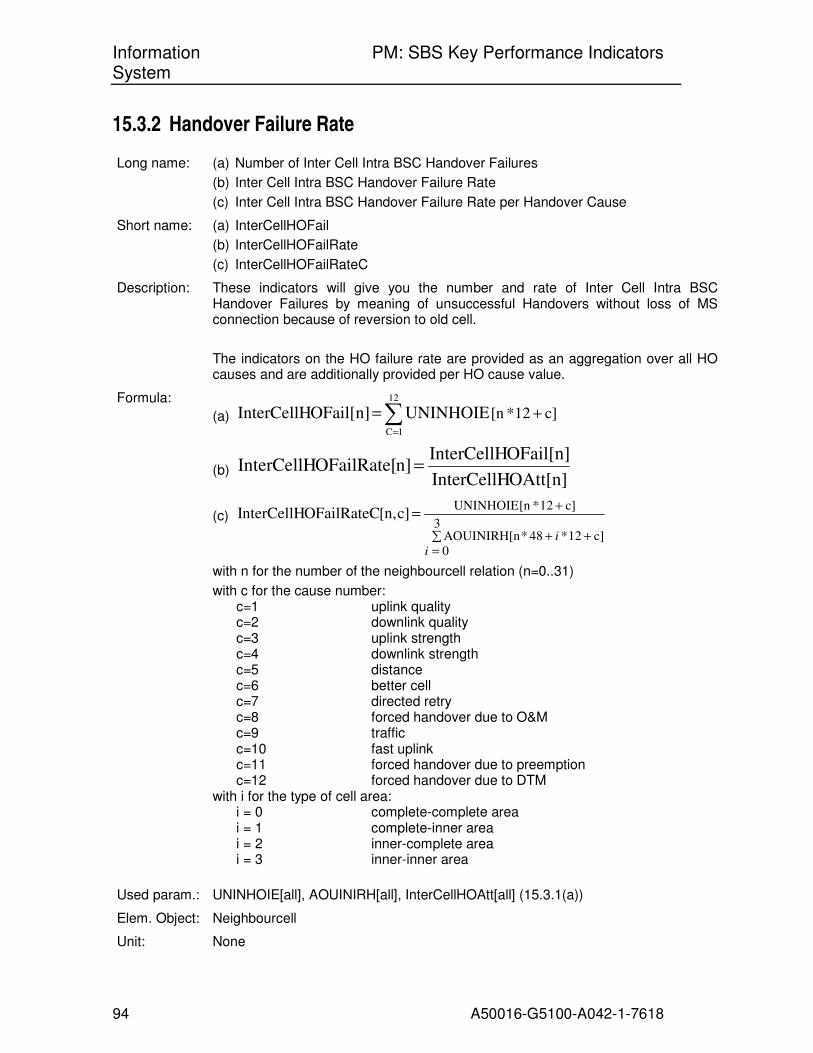
Information PM: SBS Key Performance Indicators System
94 A50016-G5100-A042-1-7618
15.3.2 Handover Failure Rate
Long name: (a) Number of Inter Cell Intra BSC Handover Failures
(b) Inter Cell Intra BSC Handover Failure Rate
(c) Inter Cell Intra BSC Handover Failure Rate per Handover Cause
Short name: (a) InterCellHOFail
(b) InterCellHOFailRate
(c) InterCellHOFailRateC
Description: These indicators will give you the number and rate of Inter Cell Intra BSC Handover Failures by meaning of unsuccessful Handovers without loss of MS connection because of reversion to old cell.
The indicators on the HO failure rate are provided as an aggregation over all HO causes and are additionally provided per HO cause value.
Formula:
(a) ∑=
+=12
1C
c]12*[n UNINHOIE OFail[n]InterCellH
(b) OAtt[n]InterCellH
OFail[n]InterCellH n]OFailRate[InterCellH =
(c)
∑=
++
+=
3
0
c]12*48*AOUINIRH[n
c]12*[n UNINHOIE c][n,OFailRateCInterCellH
i
i
with n for the number of the neighbourcell relation (n=0..31)
with c for the cause number: c=1 uplink quality c=2 downlink quality c=3 uplink strength c=4 downlink strength c=5 distance c=6 better cell c=7 directed retry c=8 forced handover due to O&M c=9 traffic c=10 fast uplink c=11 forced handover due to preemption c=12 forced handover due to DTM
with i for the type of cell area: i = 0 complete-complete area i = 1 complete-inner area i = 2 inner-complete area i = 3 inner-inner area
Used param.: UNINHOIE[all], AOUINIRH[all], InterCellHOAtt[all] (15.3.1(a))
Elem. Object: Neighbourcell
Unit: None
Information PM: SBS Key Performance Indicators System
95 A50016-G5100-A042-1-7618
Remarks: SDCCH handovers are also incremented in these formulas.

Information PM: SBS Key Performance Indicators System
96 A50016-G5100-A042-1-7618
15.3.3 Handover Drop Rate
Long name: (a) Number of Inter Cell Intra BSC Handover Drops
(b) Inter Cell Intra BSC Handover Drop Rate
(c) Inter Cell Intra BSC Handover Drop Rate per cause
Short name: (a) InterCellHODrop
(b) InterCellHODropRate
(c) InterCellHODropRateC
Description: These indicators will give you the number and rate of Inter Cell Handover Drops per neighbour cell by meaning of unsuccessful Handovers with loss of MS connection.
The indicators on the HO drop rate are provided as an aggregation over all HO causes and are provided in addition separated per HO cause value.
Formula: (a) OFail[n]InterCellH-OSucc[n]InterCellH-OAtt[n]InterCellHODrop[n]InterCellH =
(b) OAtt[n]InterCellH
ODrop[n]InterCellHn]ODropRate[InterCellH =
(c)
∑
∑
=
=
++
+++
=
3
0
3
0
c]12*48*AOUINIRH[n
c]12*[n UNINHOIE-c]12*48*nSOUINIRH)[-(AOUINIRH
c][n,ODropRateCInterCellH
i
i
i
i
with n for the number of the neighbourcell relation (n=0..31)
with c for the cause number: c=1 uplink quality c=2 downlink quality c=3 uplink strength c=4 downlink strength c=5 distance c=6 better cell c=7 directed retry c=8 forced handover due to O&M c=9 traffic c=10 fast uplink c=11 forced handover due to preemption c=12 forced handover due to DTM
with i for the type of cell area: i = 0 complete-complete area i = 1 complete-inner area i = 2 inner-complete area i = 3 inner-inner area
Information PM: SBS Key Performance Indicators System
97 A50016-G5100-A042-1-7618
Used param.: AOUINIRH[all], SOUINIRH[all], UNINHOIE[all], InterCellHOAtt[all] (15.3.1(a)), InterCellHOSucc[all] (15.3.1(b)), InterCellHOFail[all] (15.3.2(a))
Elem. Object: Neighbourcell
Unit: None
Remarks: SDCCH handovers are also incremented in these formulas. User release during Handover will lead to systematic errors.

Information PM: SBS Key Performance Indicators System
98 A50016-G5100-A042-1-7618
15.3.4 Handover Distribution
Long name: (a) Inter Cell Intra BSC Handover Distribution
(b) Imperative Inter Cell Handover Rate
Short name: (a) InterCellHODist
(b) ImpInterCellHORate
Description: These indicators will give you the Inter Cell Intra BSC Handover Distribution for analyzing the reason (cause) for started Inter Cell Intra BSC Handovers.
Imperative handovers are not whished but rather reflect possible problems in the network topology.
Formula:
(a) OAtt[n]InterCellH
c]12*48*AOUINIRH[n
c]ODist[n,InterCellH
3
0
∑=
++
= i
i
(b) ImpInterCellHORate =
OAtt[n]InterCellH
)c]12*48*AOUINIRH[n 10]12*48*n(AOUINIRH[
3
0i
5
1
∑ ∑= =
+++++c
ii
with n for the number of the neighbourcell relation (n=0..31)
with c for the cause number: c=1 uplink quality c=2 downlink quality c=3 uplink strength c=4 downlink strength c=5 distance c=6 better cell c=7 directed retry c=8 forced handover due to O&M c=9 traffic c=10 fast uplink c=11 forced handover due to preemption c=12 forced handover due to DTM
with i for the type of cell area: i = 0 complete-complete area i = 1 complete-inner area i = 2 inner-complete area i = 3 inner-inner area
Used param.: AOUINIRH[all], InterCellHOAtt (15.3.1(a))
Elem. Object: Neighbourcell
Unit: None
Remarks: SDCCH handovers are also incremented in these formulas.

Information PM: SBS Key Performance Indicators System
99 A50016-G5100-A042-1-7618
15.3.5 Incoming Handover Success Rate
Long name: Inter Cell Intra BSC Incoming Handover Success Rate
Short name: InterCellIncHOSuccRate
Description: This indicator will give you the rate of successful Inter Cell Intra BSC Incoming Handovers per neighbour cell relation.
Formula:
∑∑
∑∑
= =
= =
++
++
=12
1c
3
0
12
1c
3
0
c]12*48*AININIRH[n
c]12*48*SININIRH[n
te[n]ncHOSuccRaInterCellI
i
i
i
i
with n for the number of the neighbourcell relation (n=0..31)
with c for the cause number: c=1 uplink quality c=2 downlink quality c=3 uplink strength c=4 downlink strength c=5 distance c=6 better cell c=7 directed retry c=8 forced handover due to O&M c=9 traffic c=10 fast uplink c=11 forced handover due to preemption c=12 forced handover due to DTM
with i for the type of cell area: i = 0 complete-complete area i = 1 complete-inner area i = 2 inner-complete area i = 3 inner-inner area
Used param.: SININIRH[all], AININIRH[all]
Elem. Object: Neighbourcell
Unit: None
Remarks: SDCCH handovers are also increment in the counters used for this formula and that fact can lead to systematic errors.
15.3.6 SDCCH Handover Success Rate
Long name: (a) Number of Inter Cell SDCCH Handover Attempts
(b) Number of Inter Cell SDCCH Handover Successes
(c) Inter Cell SDCCH Handover Success Rate
Short name: (a) InterCellSDHOAtt
(b) InterCellSDHOSucc
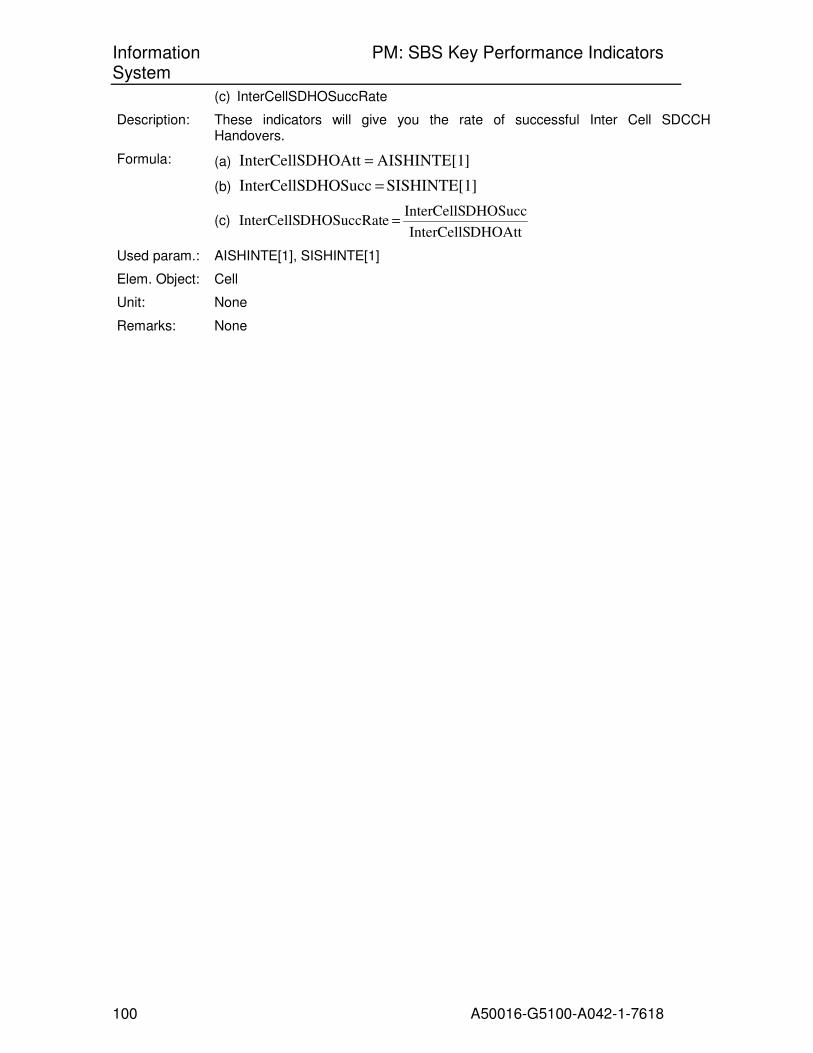
Information PM: SBS Key Performance Indicators System
100 A50016-G5100-A042-1-7618
(c) InterCellSDHOSuccRate
Description: These indicators will give you the rate of successful Inter Cell SDCCH Handovers.
Formula: (a) ]AISHINTE[1 DHOAtt InterCellS =
(b) ]SISHINTE[1 DHOSuccInterCellS =
(c) DHOAttInterCellS
DHOSuccInterCellS eDHOSuccRatInterCellS =
Used param.: AISHINTE[1], SISHINTE[1]
Elem. Object: Cell
Unit: None
Remarks: None

Information PM: SBS Key Performance Indicators System
101 A50016-G5100-A042-1-7618
15.3.7 SDCCH Handover Failure Rate
Long name: Number of Inter Cell SDCCH Handover Failures
Inter Cell SDCCH Handover Failure Rate
Short name: InterCellSDHOFail
InterCellSDHOFailRate
Description: These indicators will give you the number and rate of Inter Cell SDCCH Handover Failures by meaning of unsuccessful SDCCH Handovers without loss of MS connection because of reversion to old cell.
Formula: 1] UISHINTE[ DHOFailInterCellS =
DHOAttInterCellS
DHOFailInterCellS eDHOFailRatInterCellS =
Used param.: UISHINTE[1], InterCellSDHOAtt (15.3.6(a))
Elem. Object: Cell
Unit: None
Remarks: None
15.3.8 SDCCH Handover Drop Rate
Long name: Number of Inter Cell SDCCH Handover Drops
Inter Cell SDCCH Handover Drop Rate
Short name: InterCellSDHODrop
InterCellSDHODropRate
Description: These indicators will give you the number and rate of Inter Cell SDCCH Handover Drops by meaning of unsuccessful SDCCH Handovers with loss of MS connection.
Formula: 1] UISHIRLC[ DHODropInterCellS =
DHOAttInterCellS
DHODropInterCellS eDHODropRatInterCellS =
Used param.: UISHIRLC[1], InterCellSDHOAtt (15.3.6(a))
Elem. Object: Cell
Unit: None
Remarks: None
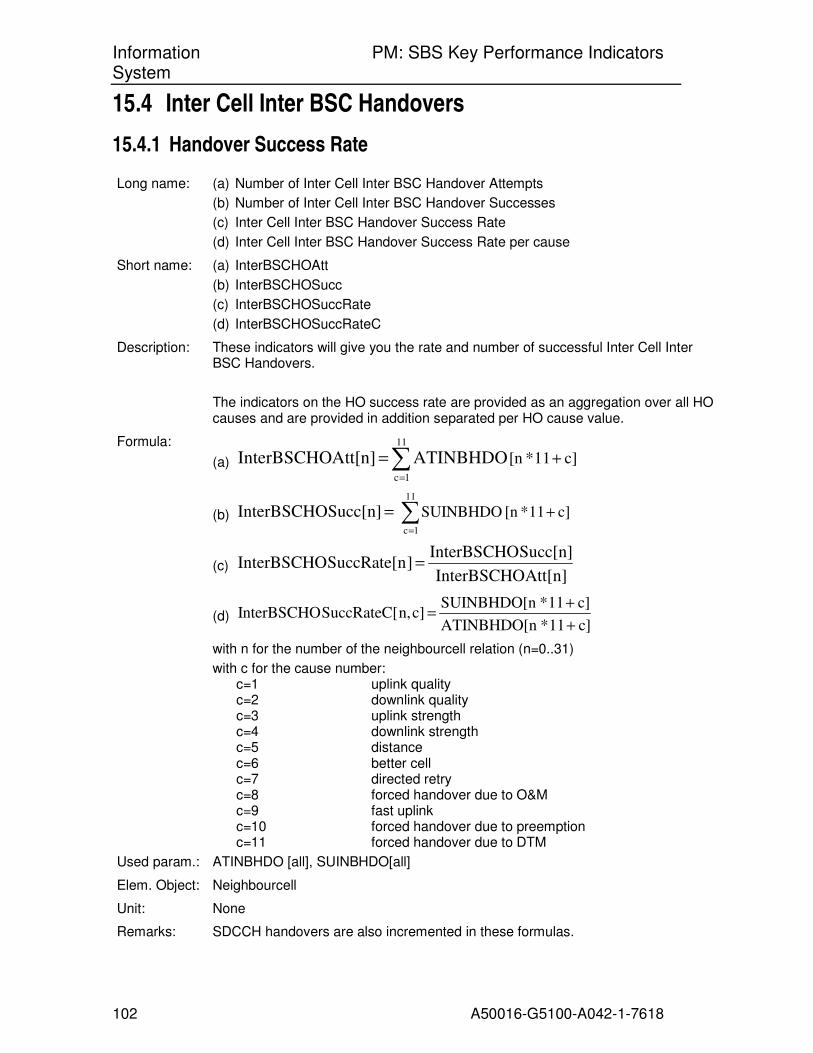
Information PM: SBS Key Performance Indicators System
102 A50016-G5100-A042-1-7618
15.4 Inter Cell Inter BSC Handovers
15.4.1 Handover Success Rate
Long name: (a) Number of Inter Cell Inter BSC Handover Attempts
(b) Number of Inter Cell Inter BSC Handover Successes
(c) Inter Cell Inter BSC Handover Success Rate
(d) Inter Cell Inter BSC Handover Success Rate per cause
Short name: (a) InterBSCHOAtt
(b) InterBSCHOSucc
(c) InterBSCHOSuccRate
(d) InterBSCHOSuccRateC
Description: These indicators will give you the rate and number of successful Inter Cell Inter BSC Handovers.
The indicators on the HO success rate are provided as an aggregation over all HO causes and are provided in addition separated per HO cause value.
Formula:
(a) ∑=
+=11
1c
c]11*[n ATINBHDO Att[n]InterBSCHO
(b) ∑=
+=11
1c
c]11*[n SUINBHDO Succ[n]InterBSCHO
(c) Att[n]InterBSCHO
Succ[n]InterBSCHO ]SuccRate[nInterBSCHO =
(d) c]11*ATINBHDO[n
c]11*SUINBHDO[n c]n,SuccRateC[InterBSCHO
+
+=
with n for the number of the neighbourcell relation (n=0..31)
with c for the cause number: c=1 uplink quality c=2 downlink quality c=3 uplink strength c=4 downlink strength c=5 distance c=6 better cell c=7 directed retry c=8 forced handover due to O&M c=9 fast uplink c=10 forced handover due to preemption c=11 forced handover due to DTM
Used param.: ATINBHDO [all], SUINBHDO[all]
Elem. Object: Neighbourcell
Unit: None
Remarks: SDCCH handovers are also incremented in these formulas.

Information PM: SBS Key Performance Indicators System
103 A50016-G5100-A042-1-7618
15.4.2 Handover Failure Rate
Long name: (a) Number of Inter Cell Inter BSC Handover Failures
(b) Inter Cell Inter BSC Handover Failure Rate
(c) Inter Cell Inter BSC Handover Failure Rate per cause
Short name: (a) InterBSCHOFail
(b) InterBSCHOFailRate
(c) InterBSCHOFailRateC
Description: These indicators will give you the rate and number of Inter Cell Inter BSC Handover. Failures by meaning of unsuccessful Handovers without loss of MS connection because of reversion to old cell.
The indicators on the HO failure rate are provided as an aggregation over all HO causes and are provided in addition separated per HO cause value.
Formula:
(a) ∑=
+=11
1c
c]11*[n NRUNINHD Fail[n]InterBSCHO
(b) Att[n]InterBSCHO
Fail[n]InterBSCHO ]FailRate[nInterBSCHO =
(c) c]11*ATINBHDO[n
] 11*NRUNINHD[n c]n,FailRateC[InterBSCHO
+
+=
c
with n for the number of the neighbourcell relation (n=0..31)
with c for the cause number: c=1 uplink quality c=2 downlink quality c=3 uplink strength c=4 downlink strength c=5 distance c=6 better cell c=7 directed retry c=8 forced handover due to O&M c=9 fast uplink c=10 forced handover due to preemption c=11 forced handover due to DTM
Used param.: NRUNINHD[all], ATINBHDO[all], InterBSCHOAtt[all] (15.4.1(a))
Elem. Object: Neighbourcell
Unit: None
Remarks: SDCCH handovers are also incremented in these formulas.

Information PM: SBS Key Performance Indicators System
104 A50016-G5100-A042-1-7618
15.4.3 Handover Drop Rate
Long name: (a) Number of Inter Cell Inter BSC Handover Drops
(b) Inter Cell Inter BSC Handover Drop Rate
(c) Inter Cell Inter BSC Handover Drop Rate per cause
Short name: (a) InterBSCHODrop
(b) InterBSCHODropRate
(c) InterBSCHODropRateC
Description: These indicators will give you the rate and number of Inter Cell Inter BSC Handover Drops per neighbour cell by meaning of unsuccessful Handovers with loss of MS connection.
The indicators on the HO drop rate are provided as an aggregation over all HO causes and are provided in addition separated per HO cause value.
Formula: (a) Fail[n]InterBSCHO -Succ[n]InterBSCHO -Att[n]InterBSCHO Drop[n]InterBSCHO =
(b) [n]
[n][n]
AttInterBSCHO
DropInterBSCHODropRateInterBSCHO =
(c) c]11*ATINBHDO[n
c]11*nNRUNINHD)[-SUINBHDO - (ATINBHDOc]n,DropRateC[InterBSCHO
+
+=
with n for the number of the neighbourcell relation (n=0..31)
with c for the cause number: c=1 uplink quality c=2 downlink quality c=3 uplink strength c=4 downlink strength c=5 distance c=6 better cell c=7 directed retry c=8 forced handover due to O&M c=9 fast uplink c=10 forced handover due to preemption c=11 forced handover due to DTM
Used param.: ATINBHDO[all], SUINBHDO[all], NRUNINHD[all], InterBSCHOAtt[all] (15.4.1(a)), InterBSCHOSucc[all] (15.4.1(b)), InterBSCHOFail[all] (15.4.2(a))
Elem. Object: Neighbourcell
Unit: None
Remarks: SDCCH handovers are also incremented in these formulas. User release during Handover will lead to very small systematic errors.

Information PM: SBS Key Performance Indicators System
105 A50016-G5100-A042-1-7618
15.4.4 Handover Distribution
Long name: (a) Inter Cell Inter BSC Handover Distribution
(b) Imperative Inter Cell Inter BSC Handover Rate
Short name: (a) InterBSCHODist
(b) ImpInterBSCHORate
Description: These indicators will give you the Inter Cell Inter BSC Handover Distribution for analysing the reason for started Inter Cell Inter BSC Handovers.
Imperative handovers are not whished but reflect possible problems in the network topology.
Formula:
(a) Att[n]InterBSCHO
c]11*ATINBHDO[n c]Dist[n,InterBSCHO
+=
(b) ImpInterBSCHORate =
Att[n]InterBSCHO
9] 11*ATINBHDO[n c]11*ATINBHDO[n
5
1
∑=
+++c
with n for the number of the neighbourcell relation (n=0..31)
with c for the cause number: c=1 uplink quality c=2 downlink quality c=3 uplink strength c=4 downlink strength c=5 distance c=6 better cell c=7 directed retry c=8 forced handover due to O&M c=9 fast uplink c=10 forced handover due to preemption c=11 forced handover due to DTM
Used param.: ATINBHDO[all], InterBSCHOAtt[all] (15.4.1(a)),
Elem. Object: Neighbourcell
Unit: None
Remarks: SDCCH handovers are also incremented in these formulas.

Information PM: SBS Key Performance Indicators System
106 A50016-G5100-A042-1-7618
15.4.5 SDCCH Handover Success Rate
Long name: (a) Number of Inter Cell Inter BSC SDCCH Handover Attempts
(b) Number of Inter Cell Inter BSC SDCCH Handover Successes
(c) Inter Cell Inter BSC SDCCH Handover Success Rate
Short name: (a) InterBSCSDHOAtt
(b) InterBSCSDHOSucc
(c) InterBSCSDHOSuccRate
Description: These indicators will give you the rate of successful Inter Cell Inter BSC SDCCH Handovers.
Formula: (a) ]AOINTESH[1 HOAtt InterBSCSD =
(b) ]SOINTESH[1 HOSuccInterBSCSD =
(c) HOAttInterBSCSD
HOSuccInterBSCSD HOSuccRateInterBSCSD =
Used param.: AOINTESH[1], SOINTESH[1]
Elem. Object: Cell
Unit: None
Remarks: None
15.4.6 SDCCH Handover Failure Rate
Long name: Number of Inter Cell Inter BSC SDCCH Handover Failures
Inter Cell Inter BSC SDCCH Handover Failure Rate
Short name: InterBSCSDHOFail
InterBSCSDHOFailRate
Description: These indicators will give you the number and rate of Inter Cell Inter BSC SDCCH Handover Failures by meaning of unsuccessful SDCCH Handovers without loss of MS connection because of reversion to old cell.
Formula: 1] UOINTESH[ HOFailInterBSCSD =
HOAttInterBSCSD
HOFailInterBSCSD HOFailRateInterBSCSD =
Used param.: UOINTESH[1], InterBSCSDHOAtt (15.4.5(a))
Elem. Object: Cell
Unit: None
Remarks: None

Information PM: SBS Key Performance Indicators System
107 A50016-G5100-A042-1-7618
15.4.7 SDCCH Handover Drop Rate
Long name: Number of Inter Cell Inter BSC SDCCH Handover Drops
Inter Cell Inter BSC SDCCH Handover Drop Rate
Short name: InterBSCSDHODrop
InterBSCSDHODropRate
Description: These indicators will give you the number and rate of Inter Cell Inter BSC SDCCH Handover Drops by meaning of unsuccessful SDCCH Handovers with loss of MS connection.
Formula: ] UMCSHLC[1 ODropInterBSCDH =
HOAttInterBSCSD
HODropInterBSCSD HODropRateInterBSCSD =
Used param.: UMCSHLC[1], InterBSCSDHOAtt (15.4.5(a))
Elem. Object: Cell
Unit: None
Remarks: None
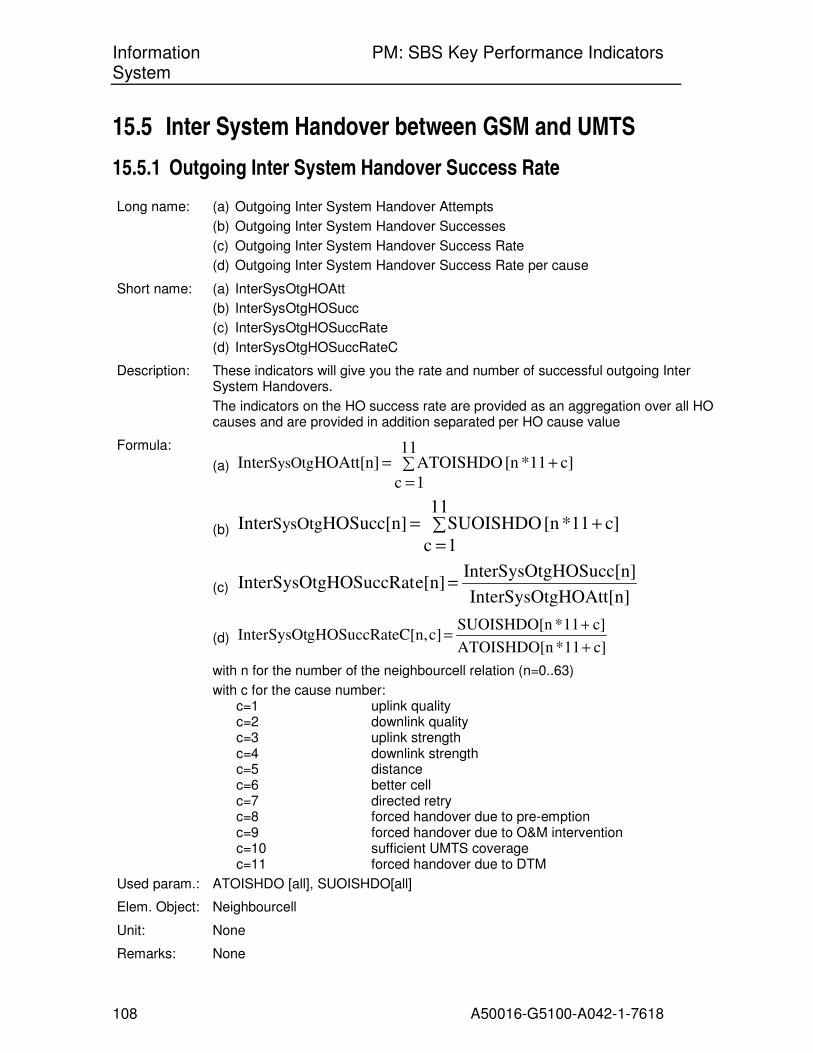
Information PM: SBS Key Performance Indicators System
108 A50016-G5100-A042-1-7618
15.5 Inter System Handover between GSM and UMTS
15.5.1 Outgoing Inter System Handover Success Rate
Long name: (a) Outgoing Inter System Handover Attempts
(b) Outgoing Inter System Handover Successes
(c) Outgoing Inter System Handover Success Rate
(d) Outgoing Inter System Handover Success Rate per cause
Short name: (a) InterSysOtgHOAtt
(b) InterSysOtgHOSucc
(c) InterSysOtgHOSuccRate
(d) InterSysOtgHOSuccRateC
Description: These indicators will give you the rate and number of successful outgoing Inter System Handovers.
The indicators on the HO success rate are provided as an aggregation over all HO causes and are provided in addition separated per HO cause value
Formula:
(a) ∑=
+=11
1c
c] 11*[n ATOISHDO HOAtt[n]InterSysOtg
(b) ∑=
+=11
1c
c] 11*[n SUOISHDO HOSucc[n]InterSysOtg
(c) gHOAtt[n]InterSysOt
gHOSucc[n]InterSysOt e[n]gHOSuccRatInterSysOt =
(d) c]11*ATOISHDO[n
c]11*SUOISHDO[n c]eC[n,gHOSuccRatInterSysOt
+
+=
with n for the number of the neighbourcell relation (n=0..63)
with c for the cause number: c=1 uplink quality c=2 downlink quality c=3 uplink strength c=4 downlink strength c=5 distance c=6 better cell c=7 directed retry c=8 forced handover due to pre-emption c=9 forced handover due to O&M intervention c=10 sufficient UMTS coverage c=11 forced handover due to DTM
Used param.: ATOISHDO [all], SUOISHDO[all]
Elem. Object: Neighbourcell
Unit: None
Remarks: None
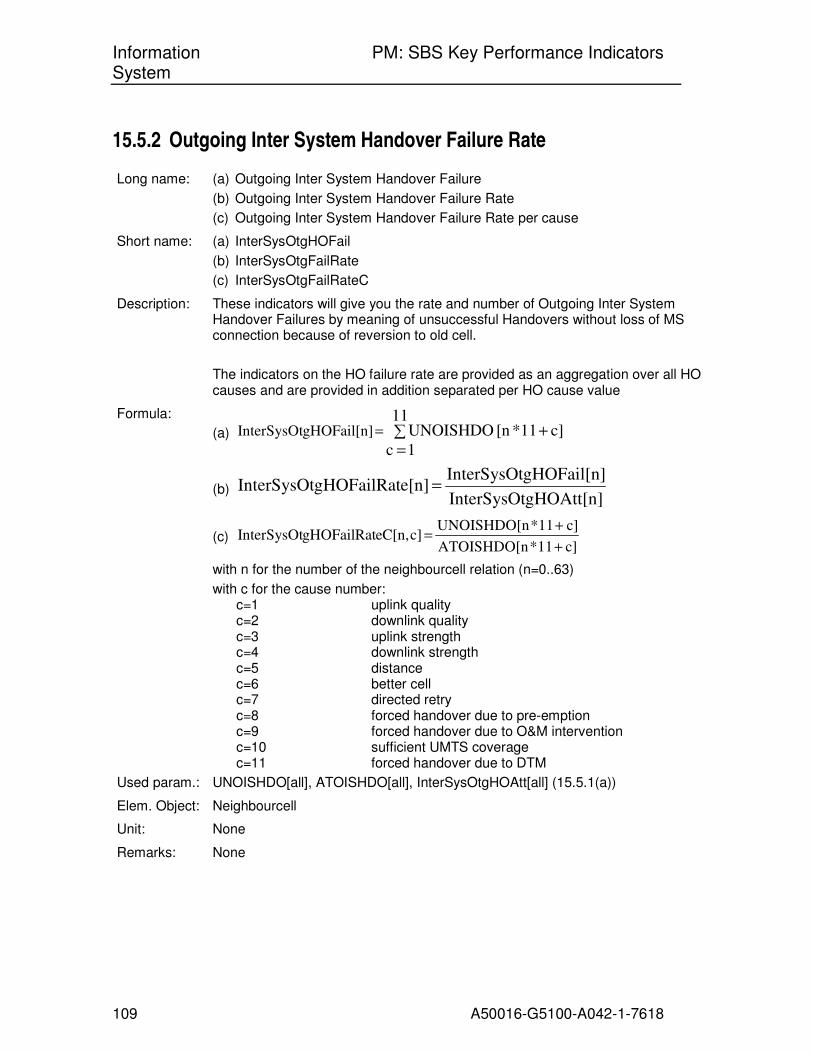
Information PM: SBS Key Performance Indicators System
109 A50016-G5100-A042-1-7618
15.5.2 Outgoing Inter System Handover Failure Rate
Long name: (a) Outgoing Inter System Handover Failure
(b) Outgoing Inter System Handover Failure Rate
(c) Outgoing Inter System Handover Failure Rate per cause
Short name: (a) InterSysOtgHOFail
(b) InterSysOtgFailRate
(c) InterSysOtgFailRateC
Description: These indicators will give you the rate and number of Outgoing Inter System Handover Failures by meaning of unsuccessful Handovers without loss of MS connection because of reversion to old cell.
The indicators on the HO failure rate are provided as an aggregation over all HO causes and are provided in addition separated per HO cause value
Formula:
(a) ∑=
+=11
1c
c] 11*[n UNOISHDO gHOFail[n]InterSysOt
(b) gHOAtt[n]InterSysOt
gHOFail[n]InterSysOt e[n]gHOFailRatInterSysOt =
(c) c]11*ATOISHDO[n
c] 11*UNOISHDO[n c]eC[n,gHOFailRatInterSysOt
+
+=
with n for the number of the neighbourcell relation (n=0..63)
with c for the cause number: c=1 uplink quality c=2 downlink quality c=3 uplink strength c=4 downlink strength c=5 distance c=6 better cell c=7 directed retry c=8 forced handover due to pre-emption c=9 forced handover due to O&M intervention c=10 sufficient UMTS coverage c=11 forced handover due to DTM
Used param.: UNOISHDO[all], ATOISHDO[all], InterSysOtgHOAtt[all] (15.5.1(a))
Elem. Object: Neighbourcell
Unit: None
Remarks: None
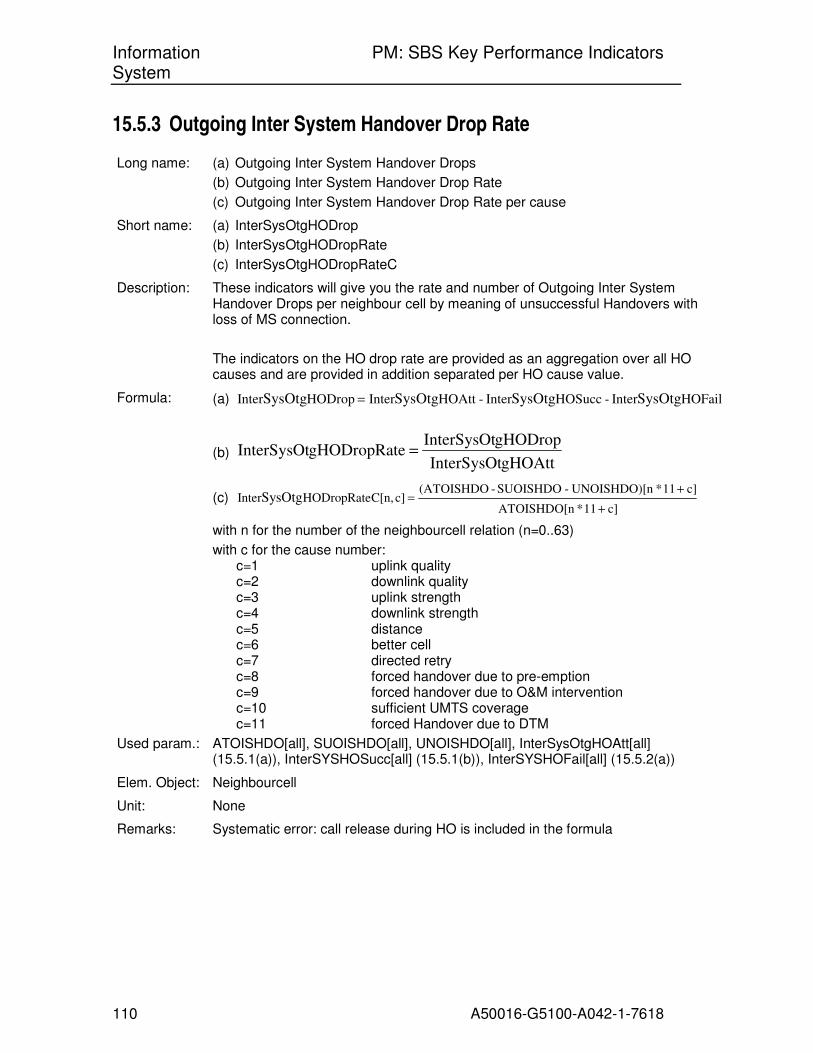
Information PM: SBS Key Performance Indicators System
110 A50016-G5100-A042-1-7618
15.5.3 Outgoing Inter System Handover Drop Rate
Long name: (a) Outgoing Inter System Handover Drops
(b) Outgoing Inter System Handover Drop Rate
(c) Outgoing Inter System Handover Drop Rate per cause
Short name: (a) InterSysOtgHODrop
(b) InterSysOtgHODropRate
(c) InterSysOtgHODropRateC
Description: These indicators will give you the rate and number of Outgoing Inter System Handover Drops per neighbour cell by meaning of unsuccessful Handovers with loss of MS connection.
The indicators on the HO drop rate are provided as an aggregation over all HO causes and are provided in addition separated per HO cause value.
Formula: (a) HOFailInter -HOSuccInter -HOAttInter HODropInter SysOtgSysOtgSysOtgSysOtg =
(b) gHOAttInterSysOt
gHODropInterSysOtegHODropRatInterSysOt =
(c) c]11*ATOISHDO[n
c]11*nUNOISHDO)[-SUOISHDO - (ATOISHDOc]C[n,HODropRateInterSysOtg
+
+=
with n for the number of the neighbourcell relation (n=0..63)
with c for the cause number: c=1 uplink quality c=2 downlink quality c=3 uplink strength c=4 downlink strength c=5 distance c=6 better cell c=7 directed retry c=8 forced handover due to pre-emption c=9 forced handover due to O&M intervention c=10 sufficient UMTS coverage c=11 forced Handover due to DTM
Used param.: ATOISHDO[all], SUOISHDO[all], UNOISHDO[all], InterSysOtgHOAtt[all] (15.5.1(a)), InterSYSHOSucc[all] (15.5.1(b)), InterSYSHOFail[all] (15.5.2(a))
Elem. Object: Neighbourcell
Unit: None
Remarks: Systematic error: call release during HO is included in the formula

Information PM: SBS Key Performance Indicators System
111 A50016-G5100-A042-1-7618
15.5.4 Outgoing Inter System Handover Distribution
Long name: (a) Outgoing Inter Cell Inter System Handover Distribution
(b) Outgoing Imperative Inter Cell Inter System Handover Rate
Short name: (a) InterSysOtgHODist
(b) ImpInterSysOtgHORate
Description: These indicators will give you the Inter Cell Inter System Handover Distribution for analyzing the reason for started Inter Cell Inter System Handovers.
Imperative handovers are not whished but reflect possible problems in the network topology
Formula:
(a) gHOAtt[n]InterSysOt
c]11*ATOISHDO[n c]gHODist[n,InterSysOt
+=
(b) gHOAtt[n]InterSysOt
c]11*ATOISHDO[n
[n]sOtgHORateImpInterSy
5
1
∑=
+
= c
with n for the number of the neighbourcell relation (n=0..63)
with c for the cause number: c=1 uplink quality c=2 downlink quality c=3 uplink strength c=4 downlink strength c=5 distance c=6 better cell c=7 directed retry c=8 forced handover due to pre-emption c=9 forced handover due to O&M intervention c=10 sufficient UMTS coverage c=11 forced handover due to DTM
Used param.: ATOISHDO[all], InterSysOtgHOAtt[all] (15.5.1(a))
Elem. Object: Neighbourcell
Unit: None
Remarks:
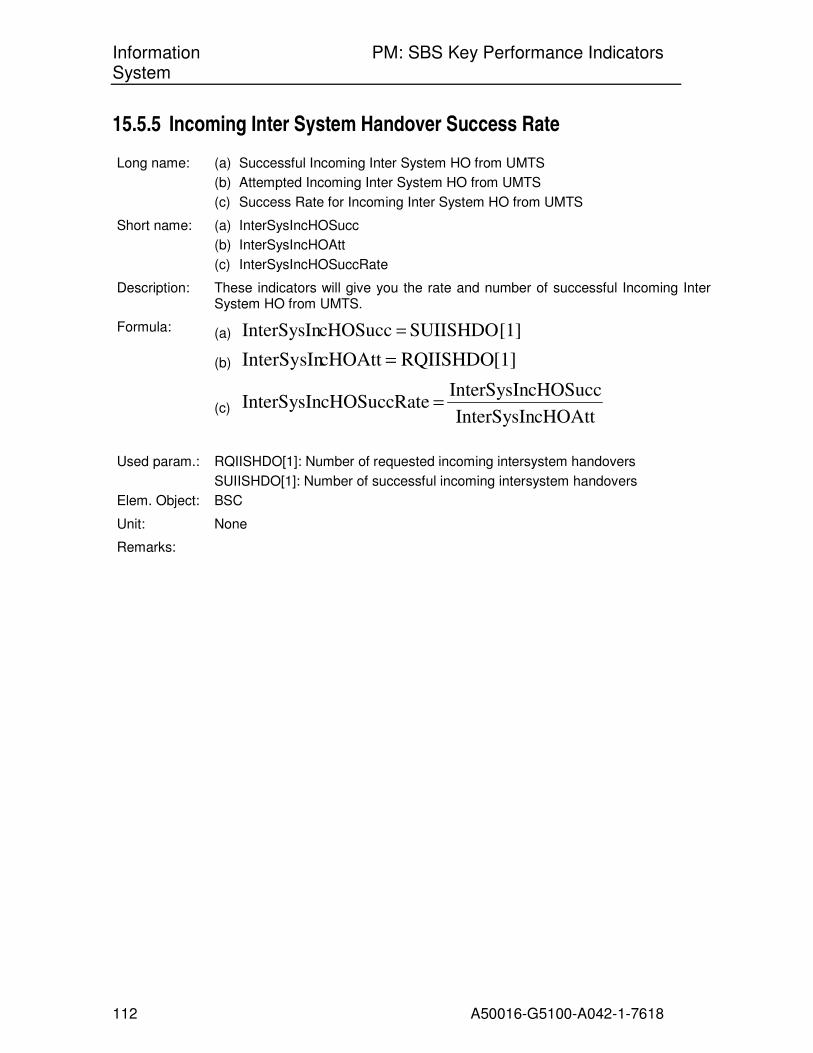
Information PM: SBS Key Performance Indicators System
112 A50016-G5100-A042-1-7618
15.5.5 Incoming Inter System Handover Success Rate
Long name: (a) Successful Incoming Inter System HO from UMTS
(b) Attempted Incoming Inter System HO from UMTS
(c) Success Rate for Incoming Inter System HO from UMTS
Short name: (a) InterSysIncHOSucc
(b) InterSysIncHOAtt
(c) InterSysIncHOSuccRate
Description: These indicators will give you the rate and number of successful Incoming Inter System HO from UMTS.
Formula: (a) [1] SUIISHDO cHOSuccInterSysIn =
(b) [1] RQIISHDOcHOAttInterSysIn =
(c) cHOAttInterSysIn
cHOSuccInterSysIn ecHOSuccRatInterSysIn =
Used param.: RQIISHDO[1]: Number of requested incoming intersystem handovers
SUIISHDO[1]: Number of successful incoming intersystem handovers
Elem. Object: BSC
Unit: None
Remarks:

Information PM: SBS Key Performance Indicators System
113 A50016-G5100-A042-1-7618
15.6 Other Handover Performance Indicators
15.6.1 Handovers per Erlanghour
Long name: (a) Handover per Erlanghour
Short name: (a) HOperErlh
Description: This indicator will give you the ratio between successful Handovers and the traffic in Erlanghour per cell.
Aggregation over all neighbors of the observed cell and all HO causes is performed
Formula: (a) HOperErlh =
[ ] yGranularit
60*
allMEBUSTCH
ll]SUOISHDO[all]SUINBHDO[a ll]SINTHINT[a ll]SINTHITA[a
+++
Used param.: SINTHITA[all], SINTHINT [all], SUINBHDO[all], SUOISHDO[all], MEBUSTCH[all], Granularity in minutes
Elem. Object: Cell
Unit: None
Remarks: • SDCCH handovers are also incremented in these counters used for this formula and that fact can lead to systematic errors.
• Intersystem HO to UMTS are considered
15.6.2 Handovers per Call Rate
Long name: (a) Handovers per Call Rate
Short name: (a) HOperCallRatio
Description: This indicator will give you the ratio between Handovers and successful Call Setups per cell.
Aggregation over all neighbors of the observed cell and all HO causes is performed
Formula: (a) HOperCallRatio =
..5]TASSSUCC[2
ll]SUOISHDO[all]SUINBHDO[a ll]SINTHINT[a ll]SINTHITA[a
+++
Used param.: SINTHITA[all], SINTHINT [all], SUINBHDO[all], SUOISHDO[all], TASSSUCC[2..5],
Elem. Object: Cell
Unit: None
Remarks: • The Handovers per Call Rate is related to the Assignment Procedure. SDCCH handovers are also incremented in these counters used for this formula and that fact can lead to systematic errors.
• Intersystem HO to UMTS are considered
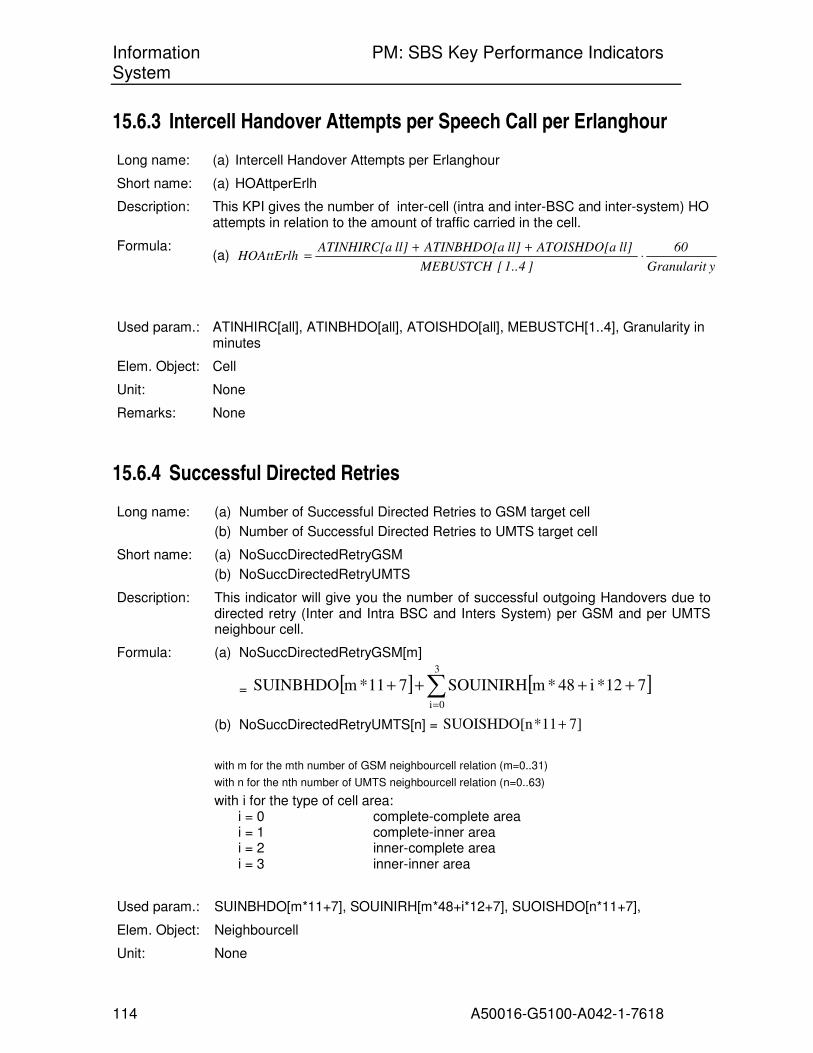
Information PM: SBS Key Performance Indicators System
114 A50016-G5100-A042-1-7618
15.6.3 Intercell Handover Attempts per Speech Call per Erlanghour
Long name: (a) Intercell Handover Attempts per Erlanghour
Short name: (a) HOAttperErlh
Description: This KPI gives the number of inter-cell (intra and inter-BSC and inter-system) HO attempts in relation to the amount of traffic carried in the cell.
Formula: (a)
yGranularit
60
]4..1[MEBUSTCH
ll] ATOISHDO[a ll] ATINBHDO[a ll] ATINHIRC[aHOAttErlh ⋅
++=
Used param.: ATINHIRC[all], ATINBHDO[all], ATOISHDO[all], MEBUSTCH[1..4], Granularity in minutes
Elem. Object: Cell
Unit: None
Remarks: None
15.6.4 Successful Directed Retries
Long name: (a) Number of Successful Directed Retries to GSM target cell
(b) Number of Successful Directed Retries to UMTS target cell
Short name: (a) NoSuccDirectedRetryGSM
(b) NoSuccDirectedRetryUMTS
Description: This indicator will give you the number of successful outgoing Handovers due to directed retry (Inter and Intra BSC and Inters System) per GSM and per UMTS neighbour cell.
Formula: (a) NoSuccDirectedRetryGSM[m]
= [ ] [ ]∑=
++++3
0i
712*i48*mSOUINIRH711*mSUINBHDO
(b) NoSuccDirectedRetryUMTS[n] = 7]11*SUOISHDO[n +
with m for the mth number of GSM neighbourcell relation (m=0..31)
with n for the nth number of UMTS neighbourcell relation (n=0..63)
with i for the type of cell area: i = 0 complete-complete area i = 1 complete-inner area i = 2 inner-complete area i = 3 inner-inner area
Used param.: SUINBHDO[m*11+7], SOUINIRH[m*48+i*12+7], SUOISHDO[n*11+7],
Elem. Object: Neighbourcell
Unit: None

Information PM: SBS Key Performance Indicators System
115 A50016-G5100-A042-1-7618
Remarks: Intersystem HO to UMTS are considered
15.6.5 Imperative Outgoing Handover Rate
Long name: (a) Imperative Outgoing Handover Rate for GSM target cell
(b) Imperative Outgoing Handover Rate for UMTS target cell
Short name: (a) ImpOutgHORateGSM
(b) ImpOutgHORateUMTS
Description: This indicator will give you the rate of handovers due to Imperative reasons (namely UpLink/DownLink Strength and UpLink/DownLink Quality and Distance and Fast Uplink) from the total number of outgoing Handovers (Inter and Intra BSC and inter system HO to UMTS).
The indicator is per GSM resp. per UMTS neighbour cell
Formula: (a)
OAtt[m]InterCellH Att[m]InterBSCHO
][Im][Im ateGSM[m]ImpOutgHOR
+
+=
mpoAttInterCellHmpAttInterBSCHO
with
InterCellHOAttImp[m] =
10]12*48*AOUINIRH[m)c]12*48*AOUINIRH[m( 3
0i
5
1
+++++∑ ∑= =
iic
9]11*ATINBHDO[m)c]11*ATINBHDO[m( AttImp[m]InterBSCHO5
0c
+++= ∑=
(b) ImpOutgHORateUMTS[n]= gHOAtt[n]InterSysOt
c]11*ATOISHDO[n
5
1c
∑=
+
with m for the mth number of GSM neighbourcell relation (m=0..31)
with n for the nth number of UMTS neighbourcell relation (n=0..63)
with c for the cause number: c=1 uplink quality c=2 downlink quality c=3 uplink strength c=4 downlink strength c=5 distance c= 9/10 fast uplink
with i for the type of cell area: i = 0 complete-complete area i = 1 complete-inner area i = 2 inner-complete area i = 3 inner-inner area
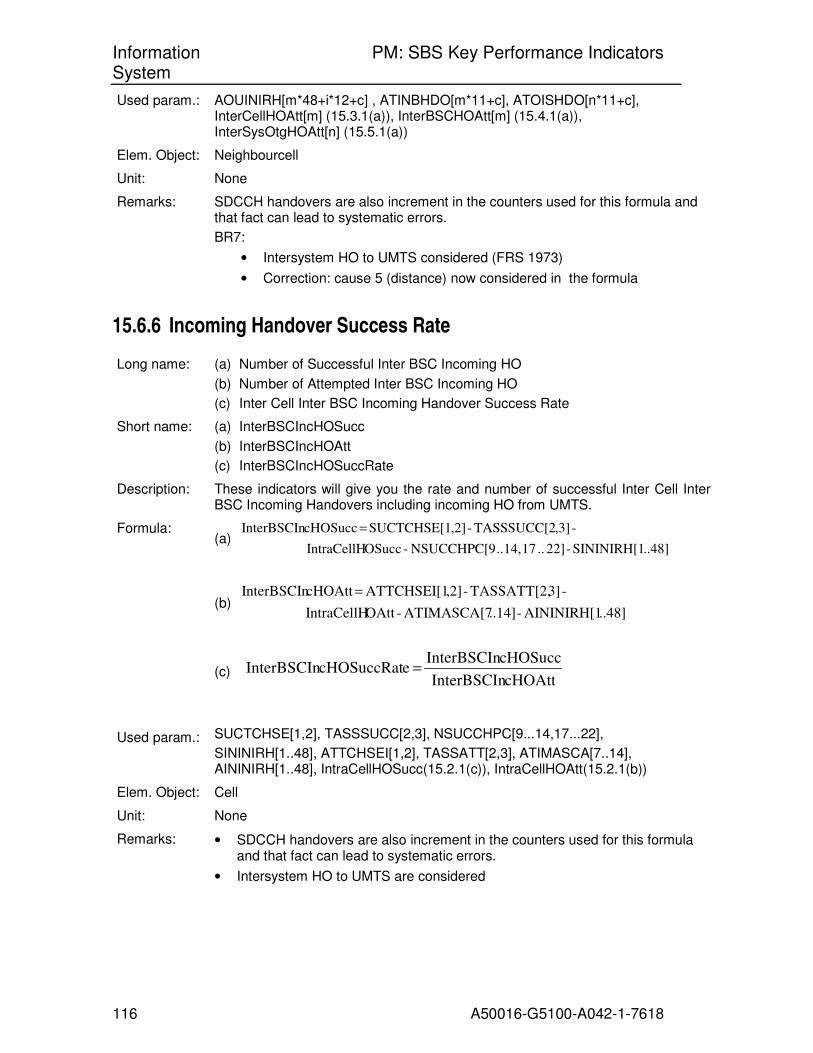
Information PM: SBS Key Performance Indicators System
116 A50016-G5100-A042-1-7618
Used param.: AOUINIRH[m*48+i*12+c] , ATINBHDO[m*11+c], ATOISHDO[n*11+c], InterCellHOAtt[m] (15.3.1(a)), InterBSCHOAtt[m] (15.4.1(a)), InterSysOtgHOAtt[n] (15.5.1(a))
Elem. Object: Neighbourcell
Unit: None
Remarks: SDCCH handovers are also increment in the counters used for this formula and that fact can lead to systematic errors.
BR7:
• Intersystem HO to UMTS considered (FRS 1973)
• Correction: cause 5 (distance) now considered in the formula
15.6.6 Incoming Handover Success Rate
Long name: (a) Number of Successful Inter BSC Incoming HO
(b) Number of Attempted Inter BSC Incoming HO
(c) Inter Cell Inter BSC Incoming Handover Success Rate
Short name: (a) InterBSCIncHOSucc
(b) InterBSCIncHOAtt
(c) InterBSCIncHOSuccRate
Description: These indicators will give you the rate and number of successful Inter Cell Inter BSC Incoming Handovers including incoming HO from UMTS.
Formula: (a)
..48]SININIRH[1 -22] .. 17 14, .. NSUCCHPC[9 -OSuccIntraCellH
-,3]TASSSUCC[2-,2]SUCTCHSE[1 cHOSuccInterBSCIn =
(b) ..48]AININIRH[1-..14]ATIMASCA[7-OAttIntraCellH
- 3]TASSATT[2,-,2]ATTCHSEI[1cHOAttInterBSCIn =
(c) cHOAttInterBSCIn
cHOSuccInterBSCIn ecHOSuccRatInterBSCIn =
Used param.: SUCTCHSE[1,2], TASSSUCC[2,3], NSUCCHPC[9...14,17...22],
SININIRH[1..48], ATTCHSEI[1,2], TASSATT[2,3], ATIMASCA[7..14], AININIRH[1..48], IntraCellHOSucc(15.2.1(c)), IntraCellHOAtt(15.2.1(b))
Elem. Object: Cell
Unit: None
Remarks: • SDCCH handovers are also increment in the counters used for this formula and that fact can lead to systematic errors.
• Intersystem HO to UMTS are considered

Information PM: SBS Key Performance Indicators System
117 A50016-G5100-A042-1-7618
15.6.7 Handover Indication Rejection Rate
Long name: (a) Handover Indication Rejection Rate
Short name: (a) HOIndRejRate
Description: This indicator will give you the Handover Indication Rejection Rate by meaning the number of Handover indications not resulting in a Handover Attempt divided by the number of all Handover indications. Reasons for this can be congestions or coverage problems.
The KPI considers all types of outgoing HO: Inter and Intra BSC and inter system HO to UMTS.
Formula: (a) HOIndRejRate =
∑∑∑===
++++63
0
31
0
31
0
gHOAttInterSysOt]4..1[
]4..1[
nmm
AttInterBSCHOOAttInterCellHOAttIntraCellHNHOINRHA
NHOINRHA
with m for the mth number of GSM neighbourcell relation (m=0..31)
with n for the nth number of UMTS neighbourcell relation (n=0..63)
Used param.: NHOINRHA [1..4], IntraCellHOAtt(15.2.1(b)), InterCellHOAtt[m] (15.3.1(a)), InterBSCHOAtt[m] (15.4.1(a)), InterSysOtgHOAtt[n] (15.5.1(a))
Elem. Object: Cell
Unit: None
Remarks: • Please note: With counter NHOINRHA[1] it is also possible to measure the number of Handover indications not resulting in an Handover Attempt due to empty neighbour cell list. The reason for this is mainly related to coverage problems.
• Intersystem HO to UMTS are considered

Information PM: SBS Key Performance Indicators System
118 A50016-G5100-A042-1-7618
15.6.8 Total Handover Rate’s
Long name: (a) Total Number of Handover Attempts
(b) Total Number of Handover Successes
(c) Total Number of Handover Failures
(d) Total Number of Handover Drops
(e) Total Handover Success Rate
(f) Total Handover Failure Rate
(g) Total Handover Drop Rate
Short name: (a) HOAtt
(b) HOSucc
(c) HOFail
(d) HODrop
(e) TotalHOSuccRate
(f) HOFailRate
(g) HODropRate
Description: These indicators will give you Handover statistics related to (Intra Cell, Inter Cell, Inter BSC and Inter System) Handovers.
Formula: (a) ll]ATOISHDO[a ll]ATINBHDO[a ll]ATINHIRC[a ll]ATINHIAC[a HOAtt +++=
(b) ll]SUOISHDO[a ll]SUINBHDO[a ll]SINTHINT[a ll]SINTHITA[a HOSucc +++=
(c) all] UNOISHDO[ ll]NRUNINHD[a all] UNINHOIE[ all] UNINHOIA[ HOFail +++=
(d)
ll])UNOISHDO[a- ll]SUOISHDO[a - all](ATOISHDO[
) ll]NRUNINHD[a ll]SUINBHDO[a - all](ATINBHDO[
1] UNIHIRLC[ ]UNIHIALC[1 HODrop
+−
++=
(e) HOAtt
HOSucc cRateTotalHOSuc =
(f) HOAtt
HOFail HOFailRate=
(g) HOAtt
HODrop HODropRate=
Used param.: ATINHIAC[all], SINTHITA[all], UNINHOIA[all], UNINHIALC[all],
ATINHIRC[all], SINTHINT[all], UNINHOIE[all], UNIHIRLC[all],
ATINBHDO[all], SUINBHDO[all], NRUNINHD[all],
ATOISHDO[all], SUOISHDO[all], UNOISHDO[all]
Elem. Object: Cell
Unit: None
Remarks: It can happen, that during a running Handover procedures the user will terminate the call and the call will be released before completion of the Handover procedure..
Therefore the number of Handover Successes can be smaller than the difference of HO Attempts – HO Failures – HO Drops. This will lead to a small systematic error for formula (d) and (g).
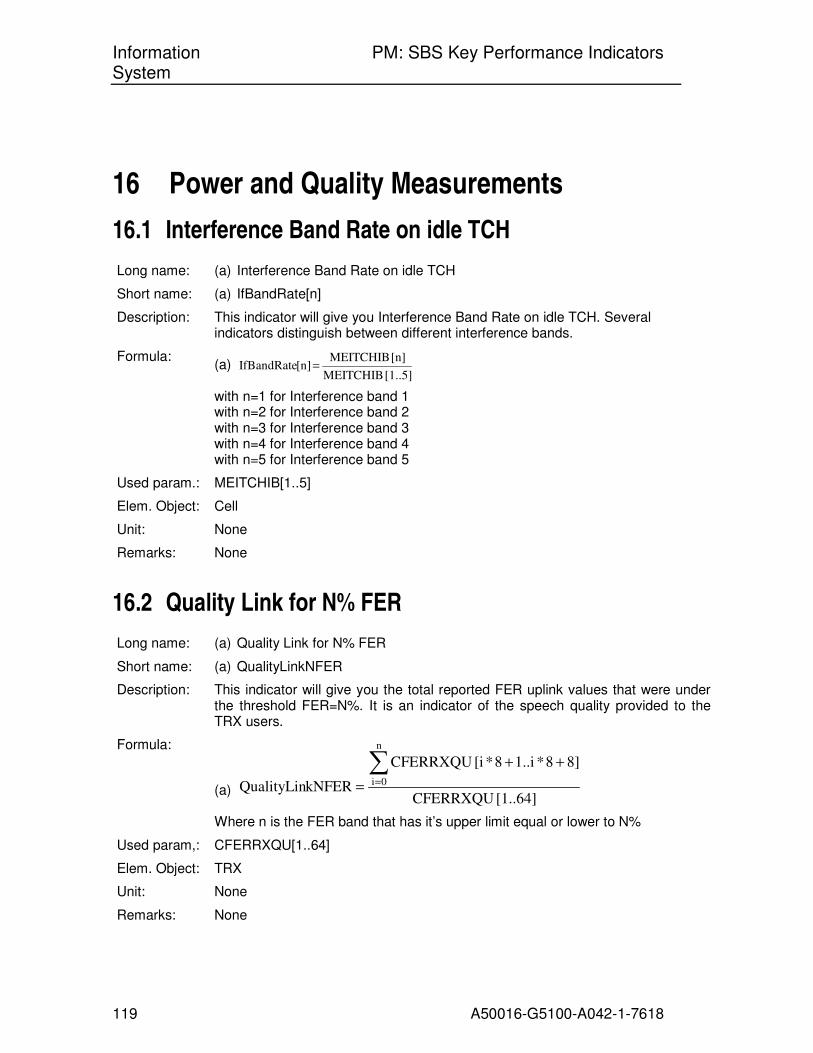
Information PM: SBS Key Performance Indicators System
119 A50016-G5100-A042-1-7618
16 Power and Quality Measurements
16.1 Interference Band Rate on idle TCH
Long name: (a) Interference Band Rate on idle TCH
Short name: (a) IfBandRate[n]
Description: This indicator will give you Interference Band Rate on idle TCH. Several indicators distinguish between different interference bands.
Formula: (a)
[1..5] MEITCHIB
[n] MEITCHIB [n]IfBandRate =
with n=1 for Interference band 1 with n=2 for Interference band 2 with n=3 for Interference band 3 with n=4 for Interference band 4 with n=5 for Interference band 5
Used param.: MEITCHIB[1..5]
Elem. Object: Cell
Unit: None
Remarks: None
16.2 Quality Link for N% FER
Long name: (a) Quality Link for N% FER
Short name: (a) QualityLinkNFER
Description: This indicator will give you the total reported FER uplink values that were under the threshold FER=N%. It is an indicator of the speech quality provided to the TRX users.
Formula:
(a) [1..64] CFERRXQU
8]8*1..i8*[i CFERRXQU
kNFERQualityLin
n
0i
∑=
++
=
Where n is the FER band that has it’s upper limit equal or lower to N%
Used param,: CFERRXQU[1..64]
Elem. Object: TRX
Unit: None
Remarks: None

Information PM: SBS Key Performance Indicators System
120 A50016-G5100-A042-1-7618
16.3 Mean FER UpLink
Long name: (a) Mean FER UpLink
Short name: (a) MeanFERUL
Description: This indicator provides the average FER Band on the Uplink.
Formula:
(a)
( )( )
[1..64] CFERRXQU
8]8*1..i8*[i CFERRXQU*1i
MeanFERUL
7
0i
∑=
+++
=
Used param,: CFERRXQU[1..64]
Elem. Object: TRX
Unit: FER Band
Remarks: None

Information PM: SBS Key Performance Indicators System
121 A50016-G5100-A042-1-7618
16.4 Power and Quality limits for N% Percentile on busy TCH
Long name: (a) RXLEV for N% Percentile Uplink on busy TCH
(b) RXLEV for N% Percentile Downlink on busy TCH
(c) RXQUAL for N% Percentile Uplink on busy TCH
(d) RXQUAL for N% Percentile Downlink on busy TCH
Short name: (a) RxLvNPercentileUL
(b) RxLvNPercentileDL
(c) RxQuNPercentileUL
(d) RxQuNPercentileDL
Description: These indicators will give you the information that N% of the measurements on busy channels registered a received Power Level below a certain Level Band and that N% of the measurements on busy channels registered a received Quality below a certain Quality Band. Two indicators distinguish between uplink and downlink.
Formula:
(a) 100
N
[1..64]PWRUPDW
n
1i[i])(PWRUPDW
such that n n with ntileULRxLvNPerce =
∑==
(b) 100
N
[73..136]PWRUPDW
n
1ii])[72(PWRUPDW
such that n n with ntileDLRxLvNPerce =
∑=
+
=
(c) 100
N
[65..72]PWRUPDW
n
1ii])[64(PWRUPDW
such that n n with ntileULRxQuNPerce =
∑=
+
=
(d) 100
N
[137..144]PWRUPDW
n
1ii])[136(PWRUPDW
such that n n with ntileDLRxQuNPerce =
∑=
+
=
Used param.: PWRUPDW[all]
Elem. Object: Channel
Unit: None
Remarks: None

Information PM: SBS Key Performance Indicators System
122 A50016-G5100-A042-1-7618
16.5 Distribution of power control levels on busy TCH
Long name: (a) Power Control level distribution on busy TCH in UL direction
(b) Power Control level distribution on busy TCH in DL direction
Short name: (a) PWContrDistrUL
(b) PWContrDistrDL
Description: This indicator provides the distribution of the registered power control levels per TCH for UL and DL direction.
Use case: Network optimization:
Evaluation of the Power Control efficiency and detection of planning problems (e.g. unintended intensive usage of the highest power control values for a TCH)
Formula:
(a) [1..64]PWRUPDW
1][nPWRUPDW trUL[n]PWContrDis
+=
(b) 136] .. [73PWRUPDW
73][nPWRUPDW trDL[n]PWContrDis
+=
with n = 0 , .. 63 for the power control level
Used param.: PWRUPDW[all]
Elem. Object: Channel
Unit: None
Remarks: None

Information PM: SBS Key Performance Indicators System
123 A50016-G5100-A042-1-7618
16.6 Mean Level and Quality on busy TCH
Long name: (a) Mean RXLEV Uplink on busy TCH
(b) Mean RXLEV Downlink on busy TCH
(c) Mean RXQUAL Uplink on busy TCH
(d) Mean RXQUAL Downlink on busy TCH
Short name: (a) MeanRxLvUL
(b) MeanRxLvDL
(c) MeanRxQuUL
(d) MeanRxQuDL
Description: These indicators will give you the mean RXLEV and RXQUAL on busy TCH. Two indicators distinguish between uplink and downlink.
Formula:
(a) [1..64]PWRUPDW
[i])PWRUPDW *(i
MeanRxLvUL
64
1i
∑==
(b) [73..136]PWRUPDW
i])[72PWRUPDW *(i
MeanRxLvDL
64
1i
∑=
+
=
(c) [65..72]PWRUPDW
i])[64PWRUPDW *(i
MeanRxQuUL
8
1i
∑=
+
=
(d) [137..144]PWRUPDW
i])[136PWRUPDW *(i
MeanRxQuDL
8
1i
∑=
+
=
Used param: PWRUPDW[all]
Elem. Object: Channel
Unit: None
Remarks: None

Information PM: SBS Key Performance Indicators System
124 A50016-G5100-A042-1-7618
16.7 TA Distribution
Long name: (a) TA Distribution
Short name: (a) TADist[n]
Description: These indicators provide the rate of received samples having timing advance in TA Band equal to ‘n’ .
Formula:
(a) [1..64] CRXLVTAU) (CRXLVTAD
1]n8[i CRXLVTAU)(CRXLVTAD
TADist[n]
7
0i
+
++×+
=
∑=
Where n=0..7
Used param.: CRXLVTAD[1..64], CRXLVTAU[1..64]
Elem. Object: TRX
Unit: None
Remarks: The range of the used measurements (SCANCTRX measurements) can be configured and is therefore relevant for the analysis of the results.
16.8 RXQUAL Distribution
Long name: (a) RXQUAL Distribution DownLink
(b) RXQUAL Distribution UpLink
Short name: (a) RxQuDistDL[n]
(b) RxQuDistUL[n]
Description: These indicators provide the rate of received samples having the received BER in Quality Band equal to ‘n’. Two indicators distinguish between uplink and downlink.
Formula:
(a) [1..64] CRXLVQUD
1]n8[i CRXLVQUD
[n]RxQuDistDL
7
0i
∑=
++×
=
(b) [1..64] CRXLVQUU
1]n8[i CRXLVQUU
[n]RxQuDistUL
7
0i
∑=
++×
=
Where n=0..7
Used param.: CRXLVQUD[1..64], CRXLVQUU[1..64]
Elem. Object: TRX
Unit: None
Remarks: The range of the used measurements (SCANCTRX measurements) can be configured and is therefore relevant for the analysis of the results.

Information PM: SBS Key Performance Indicators System
125 A50016-G5100-A042-1-7618
16.9 RXLEV Distribution
Long name: (a) RXLEV Distribution DownLink
(b) RXLEV Distribution UpLink
Short name: (a) RxLvDistDL[n]
(b) RxLvDistUL[n]
Description: These indicators provide the rate of received samples having the received Level in Level Band equal to ‘n’. Two indicators distinguish between uplink and downlink.
Formula: (a)
[1..64] CRXLVQUD
8]81..n8[n CRXLVQUD[n]RxLvDistDL
+×+×=
(b) [1..64] CRXLVQUU
]88n..18[n CRXLVQUU[n]RxLvDistUL
+×+×=
Where n=0..7
Used param.: CRXLVQUD[1..64], CRXLVQUU[1..64]
Elem. Object: TRX
Unit: None
Remarks: The range of the used measurements (SCANCTRX measurements) can be configured and is therefore relevant for the analysis of the results.
16.10 FER Distribution
Long name: (a) FER Distribution
Short name: (a) FERDist[n]
Description: These indicators provide the rate of received samples having the uplink FER in FER Band equal to ‘n’.
Formula: (a)
[1..64] CFERRXQU
8]8n..18[n CFERRXQUFERDist[n]
+×+×=
Where n=0..7
Used param.: CFERRXQU[1..64]
Elem. Object: TRX
Unit: None
Remarks: The range of the used measurements (SCANCTRX measurements) can be configured and is therefore relevant for the analysis of the results.
This KPI is not applicable to AMR calls since AMR codec mode adaptation keeps FER at low level.
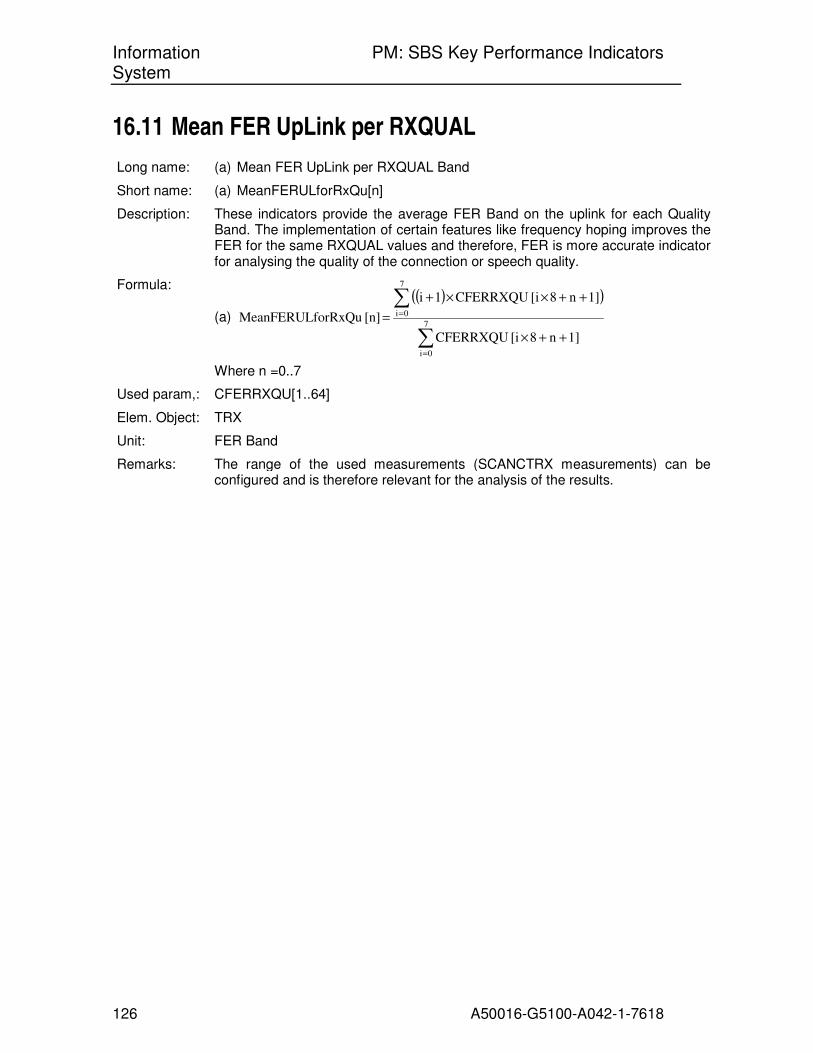
Information PM: SBS Key Performance Indicators System
126 A50016-G5100-A042-1-7618
16.11 Mean FER UpLink per RXQUAL
Long name: (a) Mean FER UpLink per RXQUAL Band
Short name: (a) MeanFERULforRxQu[n]
Description: These indicators provide the average FER Band on the uplink for each Quality Band. The implementation of certain features like frequency hoping improves the FER for the same RXQUAL values and therefore, FER is more accurate indicator for analysing the quality of the connection or speech quality.
Formula:
(a)
( )( )
∑
∑
=
=
++×
++××+
=7
0i
7
0i
1]n8[i CFERRXQU
1]n8[i CFERRXQU1i
[n]orRxQu MeanFERULf
Where n =0..7
Used param,: CFERRXQU[1..64]
Elem. Object: TRX
Unit: FER Band
Remarks: The range of the used measurements (SCANCTRX measurements) can be configured and is therefore relevant for the analysis of the results.
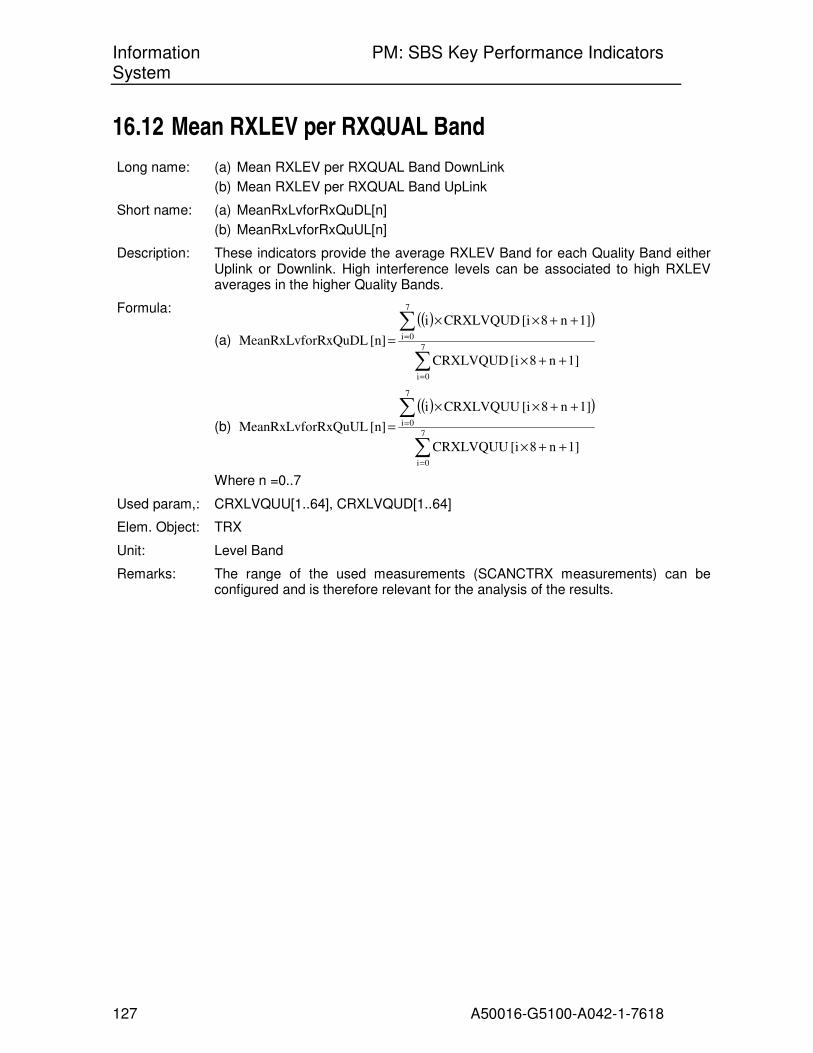
Information PM: SBS Key Performance Indicators System
127 A50016-G5100-A042-1-7618
16.12 Mean RXLEV per RXQUAL Band
Long name: (a) Mean RXLEV per RXQUAL Band DownLink
(b) Mean RXLEV per RXQUAL Band UpLink
Short name: (a) MeanRxLvforRxQuDL[n]
(b) MeanRxLvforRxQuUL[n]
Description: These indicators provide the average RXLEV Band for each Quality Band either Uplink or Downlink. High interference levels can be associated to high RXLEV averages in the higher Quality Bands.
Formula:
(a)
( )( )
∑
∑
=
=
++×
++××
=7
0i
7
0i
1]n8[i CRXLVQUD
1]n8[i CRXLVQUDi
[n] rRxQuDLMeanRxLvfo
(b)
( )( )
∑
∑
=
=
++×
++××
=7
0i
7
0i
1]n8[i CRXLVQUU
1]n8[i CRXLVQUUi
[n] rRxQuULMeanRxLvfo
Where n =0..7
Used param,: CRXLVQUU[1..64], CRXLVQUD[1..64]
Elem. Object: TRX
Unit: Level Band
Remarks: The range of the used measurements (SCANCTRX measurements) can be configured and is therefore relevant for the analysis of the results.
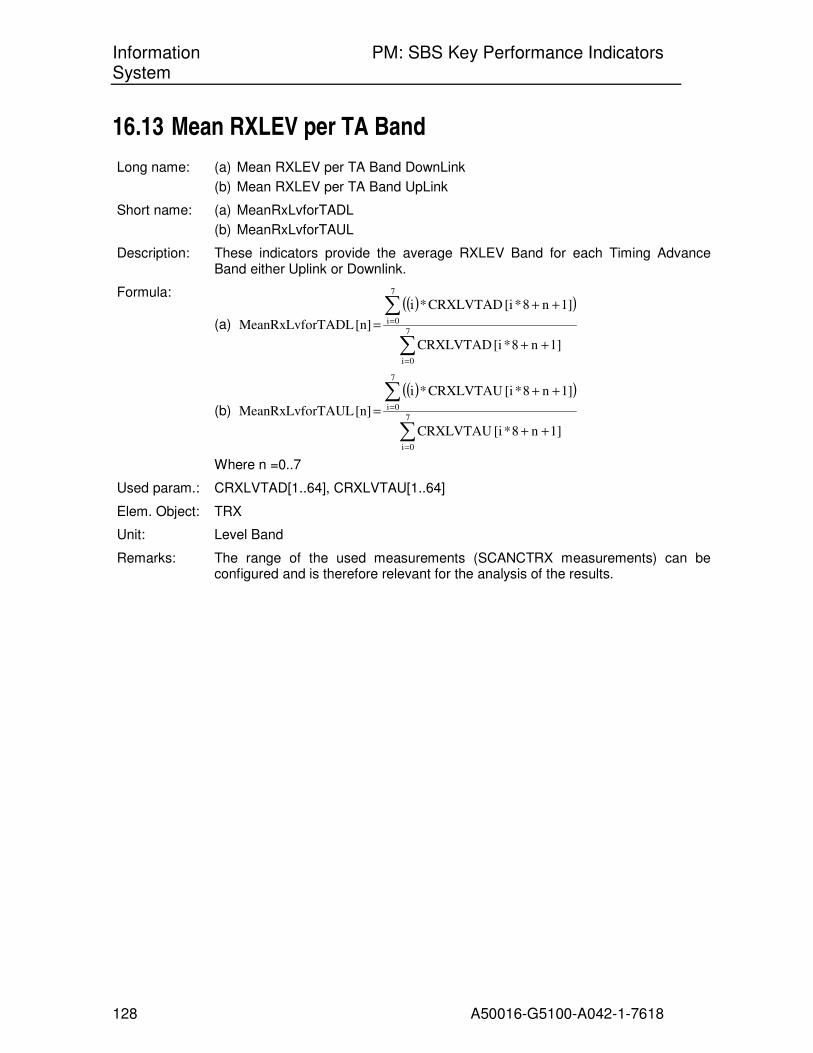
Information PM: SBS Key Performance Indicators System
128 A50016-G5100-A042-1-7618
16.13 Mean RXLEV per TA Band
Long name: (a) Mean RXLEV per TA Band DownLink
(b) Mean RXLEV per TA Band UpLink
Short name: (a) MeanRxLvforTADL
(b) MeanRxLvforTAUL
Description: These indicators provide the average RXLEV Band for each Timing Advance Band either Uplink or Downlink.
Formula:
(a)
( )( )
∑
∑
=
=
++
++
=7
0i
7
0i
1]n8*[i CRXLVTAD
1]n8*[i CRXLVTAD*i
[n] rTADLMeanRxLvfo
(b)
( )( )
∑
∑
=
=
++
++
=7
0i
7
0i
1]n8*[i CRXLVTAU
1]n8*[i CRXLVTAU*i
[n] rTAULMeanRxLvfo
Where n =0..7
Used param.: CRXLVTAD[1..64], CRXLVTAU[1..64]
Elem. Object: TRX
Unit: Level Band
Remarks: The range of the used measurements (SCANCTRX measurements) can be configured and is therefore relevant for the analysis of the results.
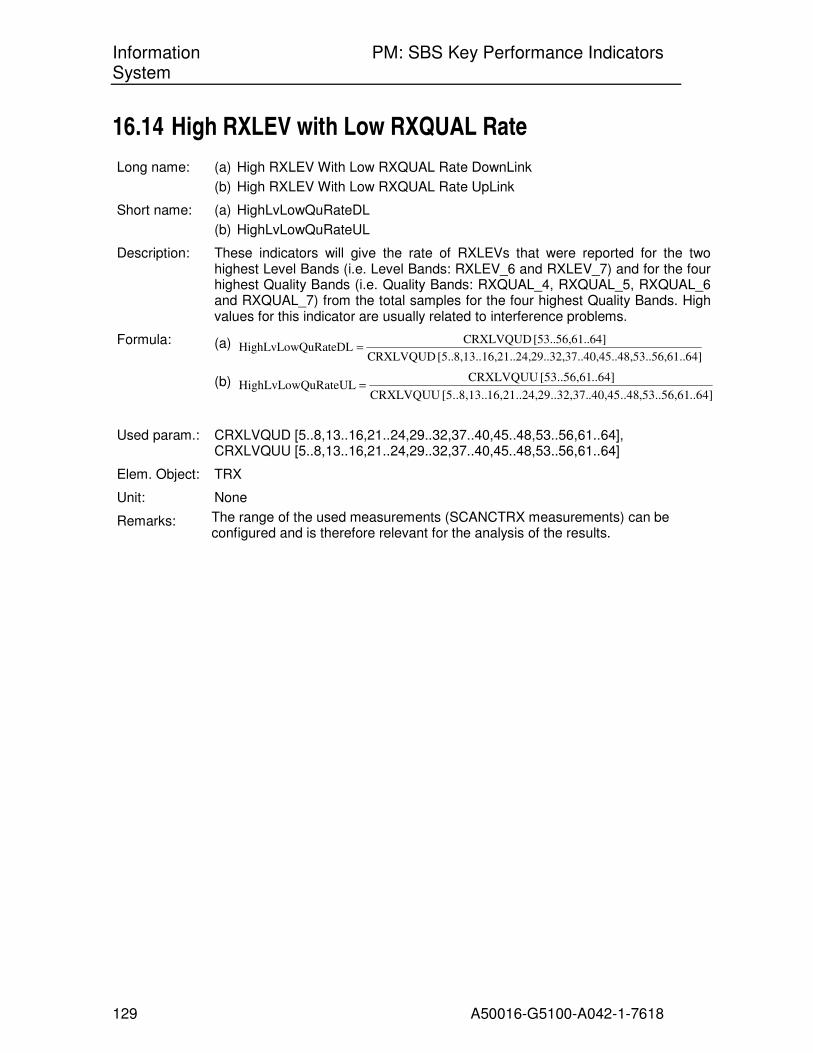
Information PM: SBS Key Performance Indicators System
129 A50016-G5100-A042-1-7618
16.14 High RXLEV with Low RXQUAL Rate
Long name: (a) High RXLEV With Low RXQUAL Rate DownLink
(b) High RXLEV With Low RXQUAL Rate UpLink
Short name: (a) HighLvLowQuRateDL
(b) HighLvLowQuRateUL
Description: These indicators will give the rate of RXLEVs that were reported for the two highest Level Bands (i.e. Level Bands: RXLEV_6 and RXLEV_7) and for the four highest Quality Bands (i.e. Quality Bands: RXQUAL_4, RXQUAL_5, RXQUAL_6 and RXQUAL_7) from the total samples for the four highest Quality Bands. High values for this indicator are usually related to interference problems.
Formula: (a) ..64],53..56,61.40,45..4829..32,37.16,21..24,[5..8,13.. CRXLVQUD
..64][53..56,61 CRXLVQUDuRateDLHighLvLowQ =
(b) ..64],53..56,61.40,45..4829..32,37.16,21..24,[5..8,13.. CRXLVQUU
..64][53..56,61 CRXLVQUUuRateULHighLvLowQ =
Used param.: CRXLVQUD [5..8,13..16,21..24,29..32,37..40,45..48,53..56,61..64], CRXLVQUU [5..8,13..16,21..24,29..32,37..40,45..48,53..56,61..64]
Elem. Object: TRX
Unit: None
Remarks: The range of the used measurements (SCANCTRX measurements) can be configured and is therefore relevant for the analysis of the results.
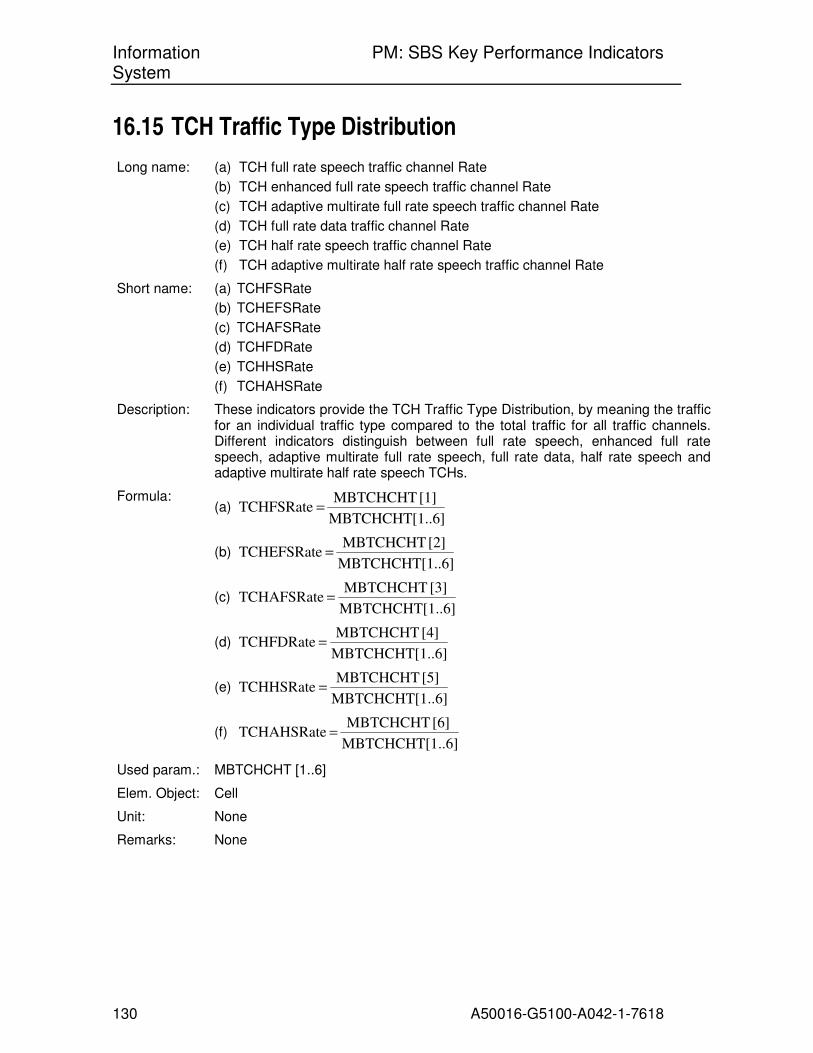
Information PM: SBS Key Performance Indicators System
130 A50016-G5100-A042-1-7618
16.15 TCH Traffic Type Distribution
Long name: (a) TCH full rate speech traffic channel Rate
(b) TCH enhanced full rate speech traffic channel Rate
(c) TCH adaptive multirate full rate speech traffic channel Rate
(d) TCH full rate data traffic channel Rate
(e) TCH half rate speech traffic channel Rate
(f) TCH adaptive multirate half rate speech traffic channel Rate
Short name: (a) TCHFSRate
(b) TCHEFSRate
(c) TCHAFSRate
(d) TCHFDRate
(e) TCHHSRate
(f) TCHAHSRate
Description: These indicators provide the TCH Traffic Type Distribution, by meaning the traffic for an individual traffic type compared to the total traffic for all traffic channels. Different indicators distinguish between full rate speech, enhanced full rate speech, adaptive multirate full rate speech, full rate data, half rate speech and adaptive multirate half rate speech TCHs.
Formula: (a)
..6]MBTCHCHT[1
[1] MBTCHCHT TCHFSRate =
(b) ..6]MBTCHCHT[1
[2] MBTCHCHT TCHEFSRate =
(c) ..6]MBTCHCHT[1
[3] MBTCHCHT TCHAFSRate =
(d) ..6]MBTCHCHT[1
[4] MBTCHCHT TCHFDRate =
(e) ..6]MBTCHCHT[1
[5] MBTCHCHT TCHHSRate =
(f) ..6]MBTCHCHT[1
[6] MBTCHCHT TCHAHSRate =
Used param.: MBTCHCHT [1..6]
Elem. Object: Cell
Unit: None
Remarks: None
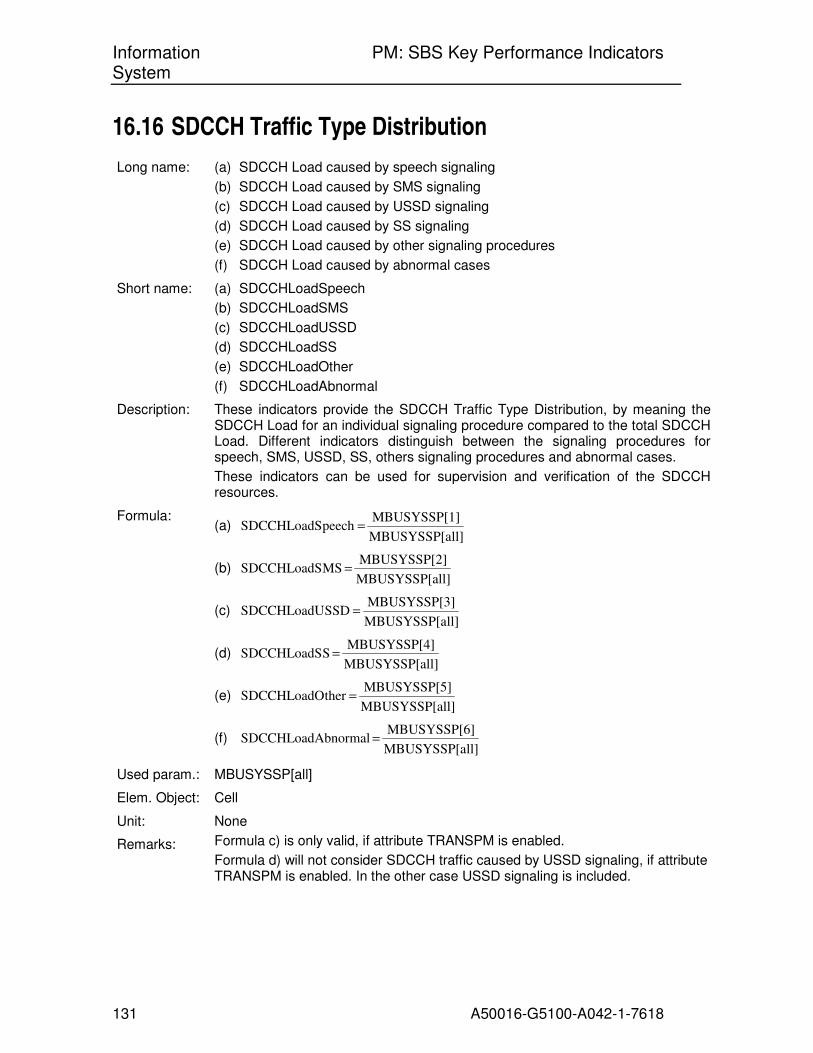
Information PM: SBS Key Performance Indicators System
131 A50016-G5100-A042-1-7618
16.16 SDCCH Traffic Type Distribution
Long name: (a) SDCCH Load caused by speech signaling
(b) SDCCH Load caused by SMS signaling
(c) SDCCH Load caused by USSD signaling
(d) SDCCH Load caused by SS signaling
(e) SDCCH Load caused by other signaling procedures
(f) SDCCH Load caused by abnormal cases
Short name: (a) SDCCHLoadSpeech
(b) SDCCHLoadSMS
(c) SDCCHLoadUSSD
(d) SDCCHLoadSS
(e) SDCCHLoadOther
(f) SDCCHLoadAbnormal
Description: These indicators provide the SDCCH Traffic Type Distribution, by meaning the SDCCH Load for an individual signaling procedure compared to the total SDCCH Load. Different indicators distinguish between the signaling procedures for speech, SMS, USSD, SS, others signaling procedures and abnormal cases.
These indicators can be used for supervision and verification of the SDCCH resources.
Formula: (a)
ll]MBUSYSSP[a
]MBUSYSSP[1 peech SDCCHLoadS =
(b) ll]MBUSYSSP[a
]MBUSYSSP[2 MSSDCCHLoadS =
(c) ll]MBUSYSSP[a
]MBUSYSSP[3 SSDSDCCHLoadU =
(d) ll]MBUSYSSP[a
]MBUSYSSP[4 SSDCCHLoadS =
(e) ll]MBUSYSSP[a
]MBUSYSSP[5 ther SDCCHLoadO =
(f) ll]MBUSYSSP[a
]MBUSYSSP[6 bnormalSDCCHLoadA =
Used param.: MBUSYSSP[all]
Elem. Object: Cell
Unit: None
Remarks: Formula c) is only valid, if attribute TRANSPM is enabled.
Formula d) will not consider SDCCH traffic caused by USSD signaling, if attribute TRANSPM is enabled. In the other case USSD signaling is included.

Information PM: SBS Key Performance Indicators System
132 A50016-G5100-A042-1-7618
16.17 Adaptive Multirate Distribution
Long name: (a) Adaptive Multirate channel type usage
Short name: (a) AMRCHTUsage
Description: These indicators provide the Adaptive Multirate channel type usage and will give you an overview about the quality of the feature Adaptive Multirate (AMR). Separate counters distinguish between the different adaptive multirate channel types (8 for adaptive multirate full rate speech, and 5 for adaptive multirate half rate speech) and between uplink / downlink transmission. These indicators provide how often a specific adaptive multirate channel type was used related to all adaptive multirate channel types for one direction (uplink / downlink).
Formula: (a)
100
]AMRCHDIS[n e[n]AMRCHTUsag =
with n =
1 for TCH/AFS 12.2 uplink (AMR full rate speech, 12.2 kbit/s, uplink)
2 for TCH/AFS 10.2 uplink (AMR full rate speech, 10.2 kbit/s, uplink)
3 for TCH/AFS 7.95 uplink (AMR full rate speech, 7.95 kbit/s, uplink)
4 for TCH/AFS 7.4 uplink (AMR full rate speech, 7.5 kbit/s, uplink)
5 for TCH/AFS 6.7 uplink (AMR full rate speech, 6.7 kbit/s, uplink)
6 for TCH/AFS 5.9 uplink (AMR full rate speech, 5.9 kbit/s, uplink)
7 for TCH/AFS 5.15 uplink (AMR full rate speech, 5.15 kbit/s, uplink)
8 for TCH/AFS 4.75 uplink (AMR full rate speech, 4.75 kbit/s, uplink)
9 for TCH/AHS 7.4 uplink (AMR half rate speech, 7.4 kbit/s, uplink)
10for TCH/AHS 6.7 uplink (AMR half rate speech, 6.7 kbit/s, uplink)
11 for TCH/AHS 5.9 uplink (AMR half rate speech, 5.9 kbit/s, uplink)
12 for TCH/AHS 5.15 uplink (AMR half rate speech, 5.15 kbit/s, uplink)
13 for TCH/AHS 4.75 uplink (AMR half rate speech, 4.75 kbit/s, uplink)
14 for TCH/AFS 12.2 downlink (AMR full rate speech, 12.2 kbit/s, downlink)
15 for TCH/AFS 10.2 downlink (AMR full rate speech, 10.2 kbit/s, downlink)
16 for TCH/AFS 7.95 downlink (AMR full rate speech, 7.95 kbit/s, downlink)
17 for TCH/AFS 7.4 downlink (AMR full rate speech, 7.5 kbit/s, downlink)
18 for TCH/AFS 6.7 downlink (AMR full rate speech, 6.7 kbit/s, downlink)
19 for TCH/AFS 5.9 downlink (AMR full rate speech, 5.9 kbit/s, downlink)
20 for TCH/AFS 5.15 downlink (AMR full rate speech, 5.15 kbit/s, downlink)
21 for TCH/AFS 4.75 downlink (AMR full rate speech, 4.75 kbit/s, downlink)
22 for TCH/AHS 7.4 downlink (AMR half rate speech, 7.4 kbit/s, downlink)
23 for TCH/AHS 6.7 downlink (AMR half rate speech, 6.7 kbit/s, downlink)
24 for TCH/AHS 5.9 downlink (AMR half rate speech, 5.9 kbit/s, downlink)
25 for TCH/AHS 5.15 downlink (AMR half rate speech, 5.15 kbit/s, downlink)
26 for TCH/AHS 4.75 downlink (AMR half rate speech, 4.75 kbit/s, downlink)
Used param.: AMRCHDIS[1..26]
Elem. Object: Cell
Unit: None
Remarks: • AMRCHDIS must be divided by 100 in this formula, because the measured value is in percent and KPI`s shouldn`t be in percent.
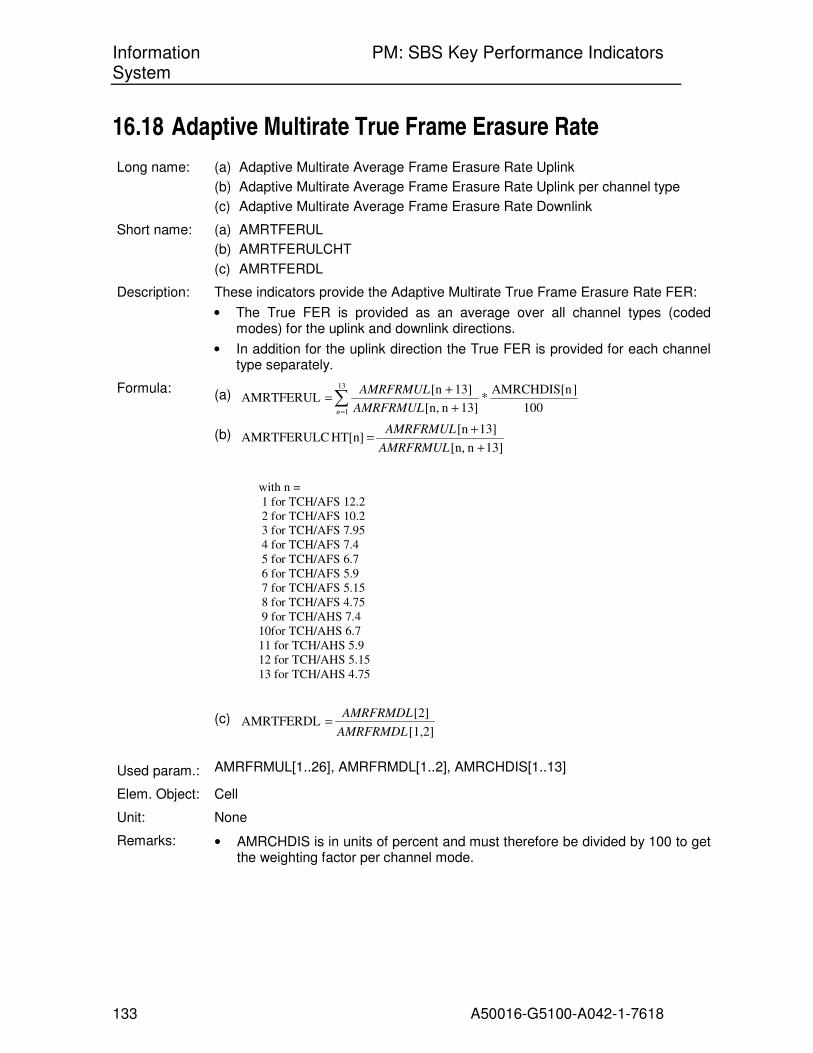
Information PM: SBS Key Performance Indicators System
133 A50016-G5100-A042-1-7618
16.18 Adaptive Multirate True Frame Erasure Rate
Long name: (a) Adaptive Multirate Average Frame Erasure Rate Uplink
(b) Adaptive Multirate Average Frame Erasure Rate Uplink per channel type
(c) Adaptive Multirate Average Frame Erasure Rate Downlink
Short name: (a) AMRTFERUL
(b) AMRTFERULCHT
(c) AMRTFERDL
Description: These indicators provide the Adaptive Multirate True Frame Erasure Rate FER:
• The True FER is provided as an average over all channel types (coded modes) for the uplink and downlink directions.
• In addition for the uplink direction the True FER is provided for each channel type separately.
Formula: (a) ∑
= +
+=
13
1 100
]AMRCHDIS[n*
13]n [n,
13][n AMRTFERUL
n AMRFRMUL
AMRFRMUL
(b) 13]n [n,
13][n HT[n]AMRTFERULC
+
+=
AMRFRMUL
AMRFRMUL
with n =
1 for TCH/AFS 12.2
2 for TCH/AFS 10.2
3 for TCH/AFS 7.95
4 for TCH/AFS 7.4
5 for TCH/AFS 6.7
6 for TCH/AFS 5.9
7 for TCH/AFS 5.15
8 for TCH/AFS 4.75
9 for TCH/AHS 7.4
10for TCH/AHS 6.7
11 for TCH/AHS 5.9
12 for TCH/AHS 5.15
13 for TCH/AHS 4.75
(c) [1,2]
[2] AMRTFERDLAMRFRMDL
AMRFRMDL=
Used param.: AMRFRMUL[1..26], AMRFRMDL[1..2], AMRCHDIS[1..13]
Elem. Object: Cell
Unit: None
Remarks: • AMRCHDIS is in units of percent and must therefore be divided by 100 to get the weighting factor per channel mode.

Information PM: SBS Key Performance Indicators System
134 A50016-G5100-A042-1-7618
16.19 Effective Frequency Load
Long name: (a) Effective Frequency Load representing network view
(b) Effective Frequency Load representing users view
(c) Effective Frequency Load representing network view on cell level
(d) Effective Frequency Load representing users view on cell level
Short name: (a) EFLNetwork
(b) EFLUser
(c) EFLNetworkCell
(d) EFLUserCell
Description: The estimation of Effective Frequency Load is based on measurements of the mean number of busy channels per layer (MEBUTSLY) and the mean number of speech calls in a cell. The mean number of busy channels is measured separately and the following model for counting a channel as busy is underlying: – Each CS FR call counts as “1” busy channel – Each CS HR call counts as “1/2” busy channel – Each PDCH in charge to the PCU counts as 1 busy channel
In case the observed cell is a dual area/dual band standard cell, the measurement distinguishes between timeslots belonging to different areas/band. This measurement determines in intervals of 500 ms the number of channels busy for CS FR, CS HR and for PO. At the end of the granularity period the arithmetic mean value of the samples is calculated for each sub counter.
Formula: (a)
1008
]3623,23[5.0]3613,13[⋅
⋅
++⋅+⋅⋅+++⋅+⋅=
moballoc
nnMEBUTSLYnnMEBUTSLYEFLNetwork
(b)
1008
]3623,23[]3613,13[⋅
⋅
++⋅+⋅+++⋅+⋅=
moballoc
nnMEBUTSLYnnMEBUTSLYEFLUser
(c)
( )100
8
]3623,23[5.0]3613,13[
⋅⋅
++⋅+⋅⋅+++⋅+⋅
=∑
∑
n
n
moballoc
nnMEBUTSLYnnMEBUTSLY
CellEFLNetwork
(d)
( )
8
]3623,23[]3613,13[
⋅⋅
++⋅+⋅+++⋅+⋅
=∑
∑
n
n
moballoc
nnMEBUTSLYnnMEBUTSLY
lEFLUserCel
where: n=0..11 for certain layer moballoc – the mobile allocation (the number of hopping frequencies used to carry traffic from numerator) can be evaluated basing on CM data;
Used param.: MEBUTSLY [all],
Elem. Object: cell
Unit: %
Remarks: MEBUTSLY shall be measured during busy hour.
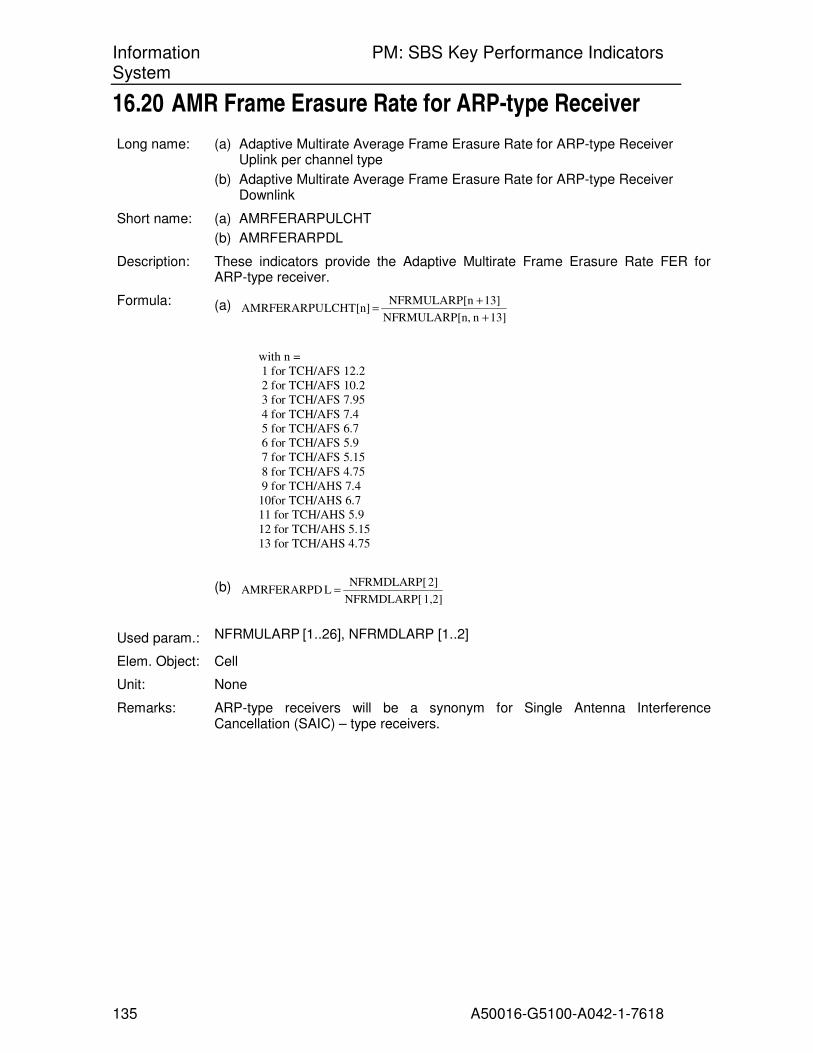
Information PM: SBS Key Performance Indicators System
135 A50016-G5100-A042-1-7618
16.20 AMR Frame Erasure Rate for ARP-type Receiver
Long name: (a) Adaptive Multirate Average Frame Erasure Rate for ARP-type Receiver Uplink per channel type
(b) Adaptive Multirate Average Frame Erasure Rate for ARP-type Receiver Downlink
Short name: (a) AMRFERARPULCHT
(b) AMRFERARPDL
Description: These indicators provide the Adaptive Multirate Frame Erasure Rate FER for ARP-type receiver.
Formula: (a) 13]n n,NFRMULARP[
13]nNFRMULARP[ LCHT[n]AMRFERARPU
+
+=
with n =
1 for TCH/AFS 12.2
2 for TCH/AFS 10.2
3 for TCH/AFS 7.95
4 for TCH/AFS 7.4
5 for TCH/AFS 6.7
6 for TCH/AFS 5.9
7 for TCH/AFS 5.15
8 for TCH/AFS 4.75
9 for TCH/AHS 7.4
10for TCH/AHS 6.7
11 for TCH/AHS 5.9
12 for TCH/AHS 5.15
13 for TCH/AHS 4.75
(b) 1,2]NFRMDLARP[
2]NFRMDLARP[ LAMRFERARPD =
Used param.: NFRMULARP [1..26], NFRMDLARP [1..2]
Elem. Object: Cell
Unit: None
Remarks: ARP-type receivers will be a synonym for Single Antenna Interference Cancellation (SAIC) – type receivers.
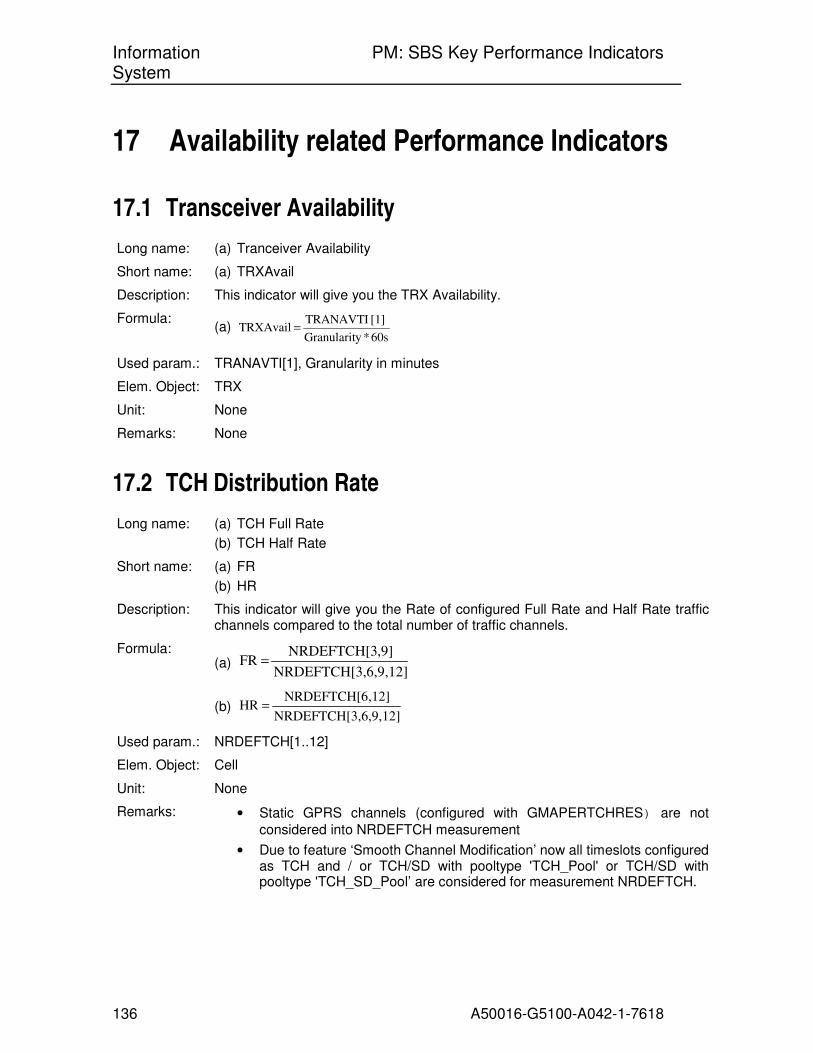
Information PM: SBS Key Performance Indicators System
136 A50016-G5100-A042-1-7618
17 Availability related Performance Indicators
17.1 Transceiver Availability
Long name: (a) Tranceiver Availability
Short name: (a) TRXAvail
Description: This indicator will give you the TRX Availability.
Formula: (a)
60s *y Granularit
[1] TRANAVTI TRXAvail =
Used param.: TRANAVTI[1], Granularity in minutes
Elem. Object: TRX
Unit: None
Remarks: None
17.2 TCH Distribution Rate
Long name: (a) TCH Full Rate
(b) TCH Half Rate
Short name: (a) FR
(b) HR
Description: This indicator will give you the Rate of configured Full Rate and Half Rate traffic channels compared to the total number of traffic channels.
Formula: (a)
,6,9,12]NRDEFTCH[3
,9]NRDEFTCH[3 FR =
(b) ,6,9,12]NRDEFTCH[3
,12]NRDEFTCH[6 HR =
Used param.: NRDEFTCH[1..12]
Elem. Object: Cell
Unit: None
Remarks: • Static GPRS channels (configured with GMAPERTCHRES) are not
considered into NRDEFTCH measurement
• Due to feature ‘Smooth Channel Modification’ now all timeslots configured as TCH and / or TCH/SD with pooltype 'TCH_Pool' or TCH/SD with pooltype 'TCH_SD_Pool’ are considered for measurement NRDEFTCH.

Information PM: SBS Key Performance Indicators System
137 A50016-G5100-A042-1-7618
17.3 TCH Availability
Long name: (a) TCH Availability Full Rate
(b) TCH Availability Half Rate
(c) TCH Availability Dual Rate
Short name: (a) TCHAvailFR
(b) TCHAvailHR
(c) TCHAvailDR
Description: This indicator will give you the TCH Availability (Rate).
Formula: (a)
,9]NRDEFTCH[3
]NAVTCH[3,9 TCHAvailFR =
(b) ,12]NRDEFTCH[6
2]NAVTCH[6,1 TCHAvailHR =
(c) ,12]NRDEFTCH[6*5,0 ,9]NRDEFTCH[3
2]NAVTCH[6,1*5,0]NAVTCH[3,9 TCHAvailDR
+
+=
Used param.: NAVTCH[3,6,9,12], NRDEFTCH[3,6,9,12]
Elem. Object: Cell
Unit: None
Remarks: • Reserved GPRS channels (defined by parameters GMANPRESPRM and GMANPRESCOM in the PTPPKF object) are not considered into NRDEFTCH and NAVTCH measurements.
• Due to feature ‘Smooth Channel Modification’ now all timeslots configured as TCH and or TCH/SD with pooltype 'TCH_Pool' or TCH/SD with pooltype 'TCH_SD_Pool' are considered for measurement NRDEFTCH.
• Due to feature ‘Smooth Channel Modification’ now all available timeslots possible to use as TCH are considered for measurement NAVTCH (Timeslots configured as TCH or TCH/SD with pooltype TCH_Pool'.
• Formula is based on mean values

Information PM: SBS Key Performance Indicators System
138 A50016-G5100-A042-1-7618
17.4 SDCCH Availability
Long name: (a) SDCCH Availability
Short name: (a) SDCCHAvail
Description: This indicator will give you the SDCCH Availability (Rate).
Formula: (a)
]NDESDCCH[3
[3] NAVSDCCH SDCCHAvail =
Used param.: NAVSDCCH[3], NDESDCCH[3]
Elem. Object: Cell
Unit: None
Remarks: Due to feature ‘Smooth Channel Modification’ now all timeslots configured as SDCCH and TCH/SD with pooltype 'SDCCH_Pool' are considered for measurement NDESDCCH.
Due to feature ‘Smooth Channel Modification’ now all available timeslots to be used as SDCCH are considered for measurement NAVSDCCH (Timeslots configured as SDCCH or TCH/SD with pooltype ‘SDCCH_Pool’).
17.5 Soft Blocking Rate
Long name: (a) Soft Blocking Rate
Short name: (a) SoftBlockingRate
Description: The estimation of soft blocking rate is based on measurements of the number of calls admitted (counters ACADMCDMA) and rejected (counters ACREJCDMA) on the DMA layer. The ACADMCDMA counter provides the number of admitted CS speech calls on the DMA layer. It supervises the performance of the admission control (AC) on the DMA layer. Precondition for DMA admission control is an enabled DMA (Dynamic MAIO Allocation). For each DMA layer configured in the cell a separate counter is generated. This measurement is triggered by admitted CS speech calls on the DMA layer. The ACREJCDMA counter provides the number of rejected CS speech calls by AC on the DMA layer due to soft blocking (SBQ=TRUE) and/or due to too high load (EFL_DMA > max.EFL_DMA), i.e. if enableSoftBlocking=TRUE. Precondition for DMA admission control is an enabled DMA (Dynamic MAIO Allocation). The counter is not incremented if the call has been rejected for any other reasons. For each DMA layer configured in the cell a separate counter is generated. This measurement is triggered by rejected CS speech calls by AC on the DMA layer, i.e. enableSoftBlocking=TRUE.
Formula: (a) 100
]2,1[]2,1[
]2,1[⋅
+=
ACREJCDMAACADMCDMA
ACREJCDMAngRateSoftBlocki
Used param.: ACREJCDMA, ACADMCDMA
Elem. Object: Cell
Unit: %

Information PM: SBS Key Performance Indicators System
139 A50016-G5100-A042-1-7618
Remarks: This KPI can be used only in case Dynamic MAIO Allocation and Admission Control are activated.

Information PM: SBS Key Performance Indicators System
140 A50016-G5100-A042-1-7618
18 GPRS Related Performance Indicators
18.1 User oriented KPIs
18.1.1 Number of TBF establishment attempts
Long Name: (a) TBF establishment attempts uplink
(b) TBF establishment attempts downlink
Short Name: (a) TBFEstAttUL
(b) TBFEstAttDL
Description : This indicator provides the number of TBF establishments for uplink and downlink.
Formula: (a) TBFEstAttUL = NUACATCL[1..3]
(b) TBFEstAttDL = NUACATCL[4..6]
Used param.: NUACATCL[all]
Elem. Object: Cell
Unit: None
Remark:
18.1.2 Number of TBF establishment failures
Long Name: (a) TBF establishment failed due to PDCH Congestion uplink
(b) TBF establishment failed due to PDCH Congestion downlink
(c) TBF establishment failed due to no reaction from mobile station uplink
(d) TBF establishment failed due to no reaction from mobile station downlink
Short Name: (a) TBFEstFailConUL
(b) TBFEstFailConDL
(c) TBFEstFailNoReacUL
(d) TBFEstFailNoReacDL
Description : This indicator provides the number of TBF establishment failures per cause. This indicator will measure in uplink and downlink direction.
Formula: (a) TBFEstFailConUL = REJPDASS [7..9],
(b) TBFEstFailConDL = REJPDASS [19..21],
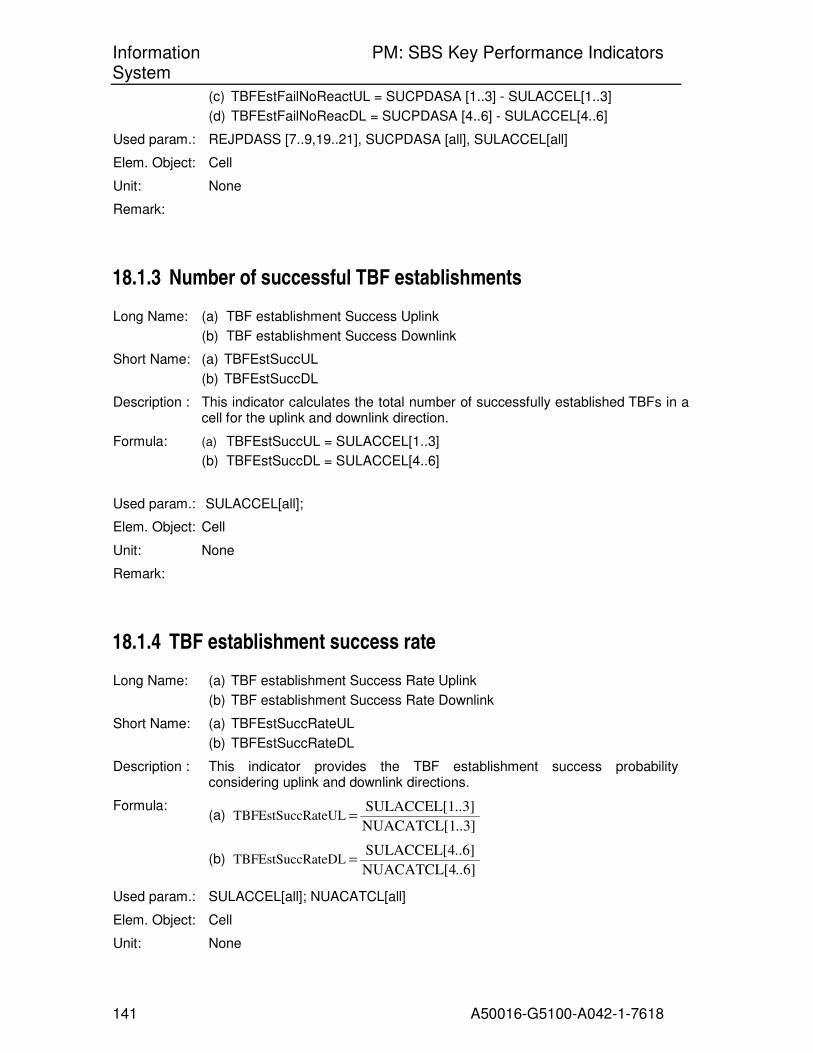
Information PM: SBS Key Performance Indicators System
141 A50016-G5100-A042-1-7618
(c) TBFEstFailNoReactUL = SUCPDASA [1..3] - SULACCEL[1..3]
(d) TBFEstFailNoReacDL = SUCPDASA [4..6] - SULACCEL[4..6]
Used param.: REJPDASS [7..9,19..21], SUCPDASA [all], SULACCEL[all]
Elem. Object: Cell
Unit: None
Remark:
18.1.3 Number of successful TBF establishments
Long Name: (a) TBF establishment Success Uplink
(b) TBF establishment Success Downlink
Short Name: (a) TBFEstSuccUL
(b) TBFEstSuccDL
Description : This indicator calculates the total number of successfully established TBFs in a cell for the uplink and downlink direction.
Formula: (a) TBFEstSuccUL = SULACCEL[1..3]
(b) TBFEstSuccDL = SULACCEL[4..6]
Used param.: SULACCEL[all];
Elem. Object: Cell
Unit: None
Remark:
18.1.4 TBF establishment success rate
Long Name: (a) TBF establishment Success Rate Uplink
(b) TBF establishment Success Rate Downlink
Short Name: (a) TBFEstSuccRateUL
(b) TBFEstSuccRateDL
Description : This indicator provides the TBF establishment success probability considering uplink and downlink directions.
Formula: (a)
..3]NUACATCL[1
..3]SULACCEL[1RateULTBFEstSucc =
(b) ..6]NUACATCL[4
..6]SULACCEL[4RateDLTBFEstSucc =
Used param.: SULACCEL[all]; NUACATCL[all]
Elem. Object: Cell
Unit: None
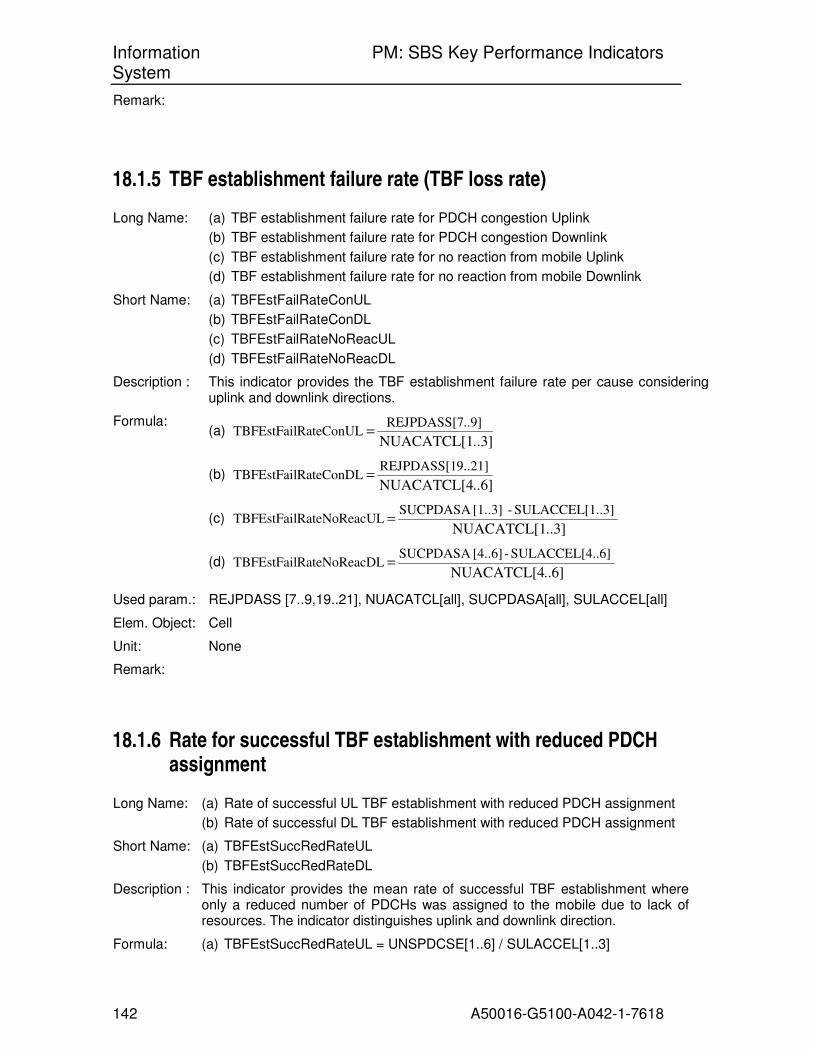
Information PM: SBS Key Performance Indicators System
142 A50016-G5100-A042-1-7618
Remark:
18.1.5 TBF establishment failure rate (TBF loss rate)
Long Name: (a) TBF establishment failure rate for PDCH congestion Uplink
(b) TBF establishment failure rate for PDCH congestion Downlink
(c) TBF establishment failure rate for no reaction from mobile Uplink
(d) TBF establishment failure rate for no reaction from mobile Downlink
Short Name: (a) TBFEstFailRateConUL
(b) TBFEstFailRateConDL
(c) TBFEstFailRateNoReacUL
(d) TBFEstFailRateNoReacDL
Description : This indicator provides the TBF establishment failure rate per cause considering uplink and downlink directions.
Formula: (a)
..3]NUACATCL[1
..9]REJPDASS[7RateConULTBFEstFail =
(b) ..6]NUACATCL[4
9..21]REJPDASS[1RateConDLTBFEstFail =
(c) ..3]NUACATCL[1
..3]SULACCEL[1 - [1..3]SUCPDASA ULRateNoReacTBFEstFail =
(d) ..6]NUACATCL[4
..6]SULACCEL[4 - [4..6]SUCPDASA DLRateNoReacTBFEstFail =
Used param.: REJPDASS [7..9,19..21], NUACATCL[all], SUCPDASA[all], SULACCEL[all]
Elem. Object: Cell
Unit: None
Remark:
18.1.6 Rate for successful TBF establishment with reduced PDCH assignment
Long Name: (a) Rate of successful UL TBF establishment with reduced PDCH assignment
(b) Rate of successful DL TBF establishment with reduced PDCH assignment
Short Name: (a) TBFEstSuccRedRateUL
(b) TBFEstSuccRedRateDL
Description : This indicator provides the mean rate of successful TBF establishment where only a reduced number of PDCHs was assigned to the mobile due to lack of resources. The indicator distinguishes uplink and downlink direction.
Formula: (a) TBFEstSuccRedRateUL = UNSPDCSE[1..6] / SULACCEL[1..3]
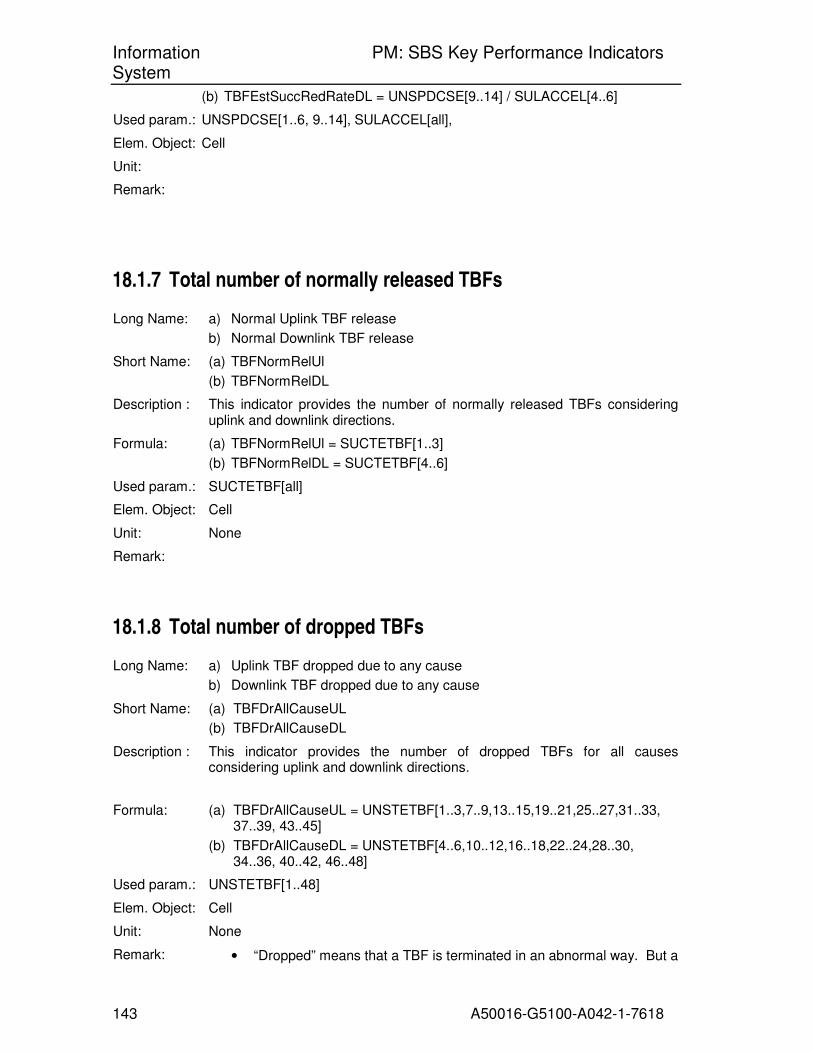
Information PM: SBS Key Performance Indicators System
143 A50016-G5100-A042-1-7618
(b) TBFEstSuccRedRateDL = UNSPDCSE[9..14] / SULACCEL[4..6]
Used param.: UNSPDCSE[1..6, 9..14], SULACCEL[all],
Elem. Object: Cell
Unit:
Remark:
18.1.7 Total number of normally released TBFs
Long Name: a) Normal Uplink TBF release
b) Normal Downlink TBF release
Short Name: (a) TBFNormRelUl
(b) TBFNormRelDL
Description : This indicator provides the number of normally released TBFs considering uplink and downlink directions.
Formula: (a) TBFNormRelUl = SUCTETBF[1..3]
(b) TBFNormRelDL = SUCTETBF[4..6]
Used param.: SUCTETBF[all]
Elem. Object: Cell
Unit: None
Remark:
18.1.8 Total number of dropped TBFs
Long Name: a) Uplink TBF dropped due to any cause
b) Downlink TBF dropped due to any cause
Short Name: (a) TBFDrAllCauseUL
(b) TBFDrAllCauseDL
Description : This indicator provides the number of dropped TBFs for all causes considering uplink and downlink directions.
Formula: (a) TBFDrAllCauseUL = UNSTETBF[1..3,7..9,13..15,19..21,25..27,31..33, 37..39, 43..45]
(b) TBFDrAllCauseDL = UNSTETBF[4..6,10..12,16..18,22..24,28..30, 34..36, 40..42, 46..48]
Used param.: UNSTETBF[1..48]
Elem. Object: Cell
Unit: None
Remark: • “Dropped” means that a TBF is terminated in an abnormal way. But a
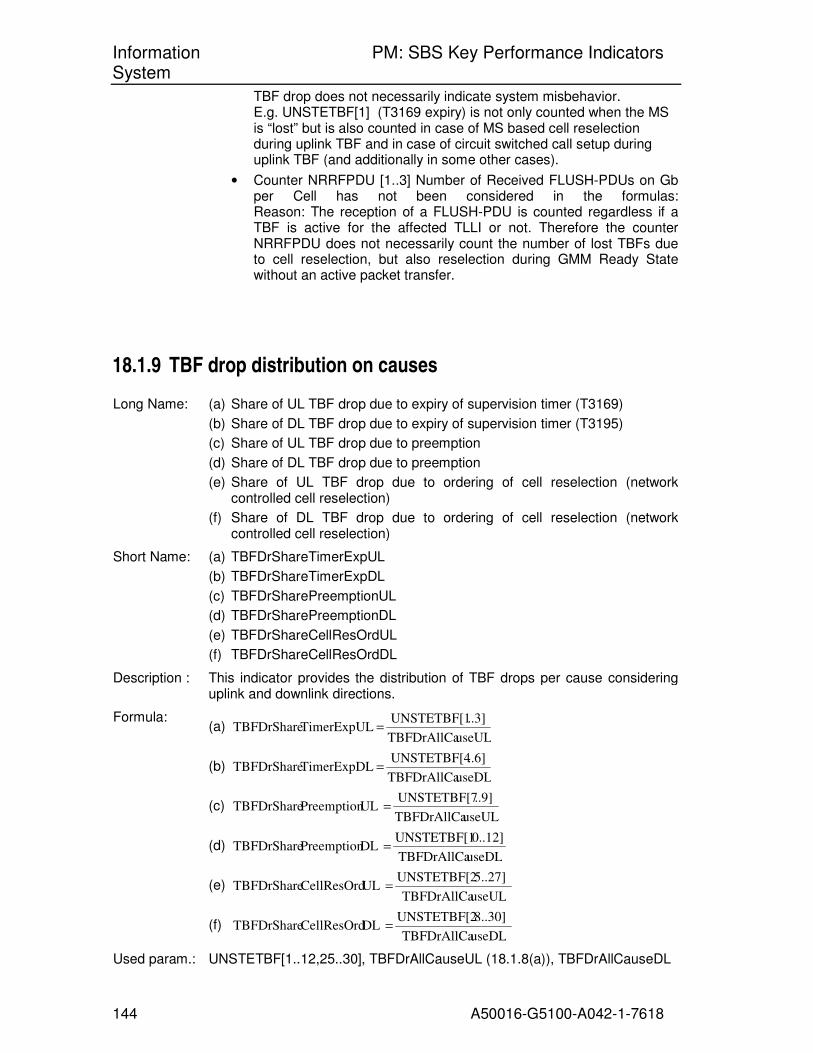
Information PM: SBS Key Performance Indicators System
144 A50016-G5100-A042-1-7618
TBF drop does not necessarily indicate system misbehavior. E.g. UNSTETBF[1] (T3169 expiry) is not only counted when the MS is “lost” but is also counted in case of MS based cell reselection during uplink TBF and in case of circuit switched call setup during uplink TBF (and additionally in some other cases).
• Counter NRRFPDU [1..3] Number of Received FLUSH-PDUs on Gb per Cell has not been considered in the formulas: Reason: The reception of a FLUSH-PDU is counted regardless if a TBF is active for the affected TLLI or not. Therefore the counter NRRFPDU does not necessarily count the number of lost TBFs due to cell reselection, but also reselection during GMM Ready State without an active packet transfer.
18.1.9 TBF drop distribution on causes
Long Name: (a) Share of UL TBF drop due to expiry of supervision timer (T3169)
(b) Share of DL TBF drop due to expiry of supervision timer (T3195)
(c) Share of UL TBF drop due to preemption
(d) Share of DL TBF drop due to preemption
(e) Share of UL TBF drop due to ordering of cell reselection (network controlled cell reselection)
(f) Share of DL TBF drop due to ordering of cell reselection (network controlled cell reselection)
Short Name: (a) TBFDrShareTimerExpUL
(b) TBFDrShareTimerExpDL
(c) TBFDrSharePreemptionUL
(d) TBFDrSharePreemptionDL
(e) TBFDrShareCellResOrdUL
(f) TBFDrShareCellResOrdDL
Description : This indicator provides the distribution of TBF drops per cause considering uplink and downlink directions.
Formula: (a)
useULTBFDrAllCa
..3]UNSTETBF[1 TimerExpULTBFDrShare =
(b) useDLTBFDrAllCa
..6]UNSTETBF[4 TimerExpDLTBFDrShare =
(c) useULTBFDrAllCa
..9]UNSTETBF[7 ULPreemptionTBFDrShare =
(d) useDLTBFDrAllCa
0..12]UNSTETBF[1 DLPreemptionTBFDrShare =
(e) useULTBFDrAllCa
5..27]UNSTETBF[2 ULCellResOrdTBFDrShare =
(f) useDLTBFDrAllCa
8..30]UNSTETBF[2 DLCellResOrdTBFDrShare =
Used param.: UNSTETBF[1..12,25..30], TBFDrAllCauseUL (18.1.8(a)), TBFDrAllCauseDL
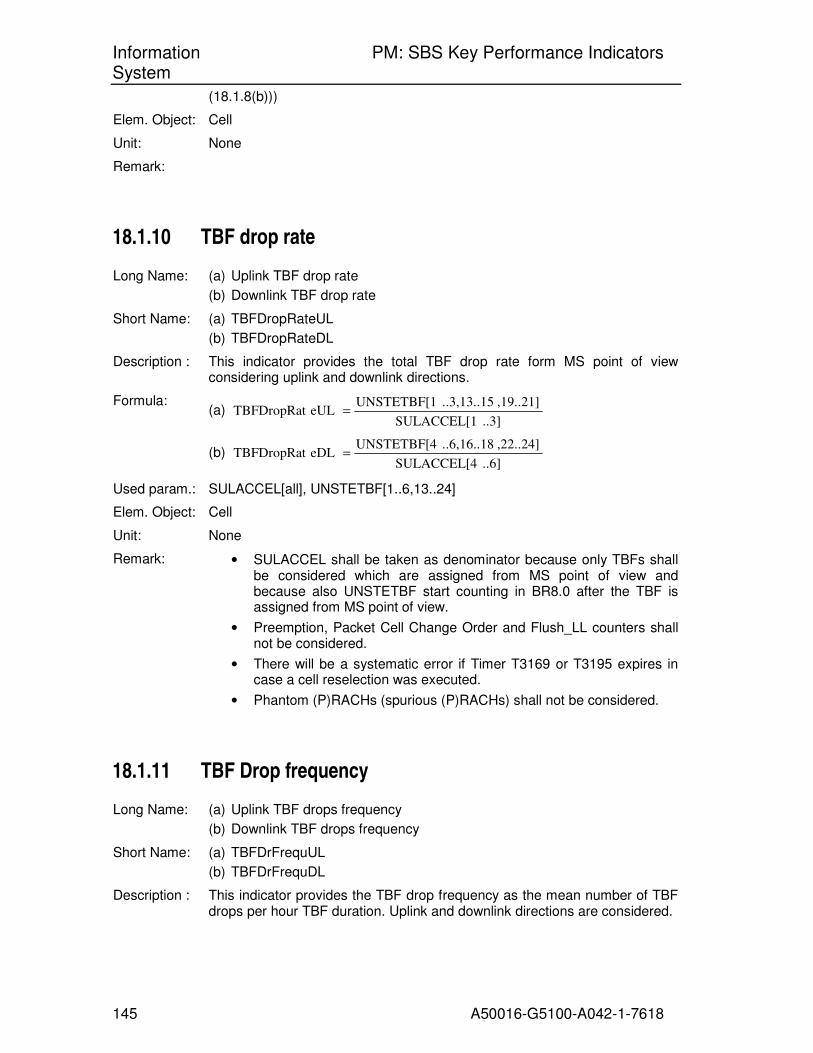
Information PM: SBS Key Performance Indicators System
145 A50016-G5100-A042-1-7618
(18.1.8(b)))
Elem. Object: Cell
Unit: None
Remark:
18.1.10 TBF drop rate
Long Name: (a) Uplink TBF drop rate
(b) Downlink TBF drop rate
Short Name: (a) TBFDropRateUL
(b) TBFDropRateDL
Description : This indicator provides the total TBF drop rate form MS point of view considering uplink and downlink directions.
Formula: (a)
..3]SULACCEL[1
,19..21]..3,13..15UNSTETBF[1 eULTBFDropRat =
(b) ..6]SULACCEL[4
,22..24]..6,16..18UNSTETBF[4 eDLTBFDropRat =
Used param.: SULACCEL[all], UNSTETBF[1..6,13..24]
Elem. Object: Cell
Unit: None
Remark: • SULACCEL shall be taken as denominator because only TBFs shall be considered which are assigned from MS point of view and because also UNSTETBF start counting in BR8.0 after the TBF is assigned from MS point of view.
• Preemption, Packet Cell Change Order and Flush_LL counters shall not be considered.
• There will be a systematic error if Timer T3169 or T3195 expires in case a cell reselection was executed.
• Phantom (P)RACHs (spurious (P)RACHs) shall not be considered.
18.1.11 TBF Drop frequency
Long Name: (a) Uplink TBF drops frequency
(b) Downlink TBF drops frequency
Short Name: (a) TBFDrFrequUL
(b) TBFDrFrequDL
Description : This indicator provides the TBF drop frequency as the mean number of TBF drops per hour TBF duration. Uplink and downlink directions are considered.

Information PM: SBS Key Performance Indicators System
146 A50016-G5100-A042-1-7618
Formula:
(a) 8]-NACTTBF[5
gran
60 * useULTBFDrAllCa
ULTBFDrFrequ =
(b) 16]-NACTTBF[13
gran
60 * useDLTBFDrAllCa
DLTBFDrFrequ =
Used param.: (a) NACTTBF[1-4, 9-12]; TBFDrAllCauseUL (18.1.8(a)), TBFDrAllCauseDL (18.1.8(b))
Elem. Object: Cell
Unit: Occurrences per hour = (1 / hour)
Remark: In case of low number of TBFs and short TBF duration (e.g. mainly GMM and SM) related data transfer on radio interface the formulas produce an inaccurate result under certain circumstances.
Reasons:
• NACTTBF[5-8, 13-16] is sampled on a second basis (GMM and SM related TBFs might be shorter)
• NACTTBF[5-8, 13-16] is a real number with 4 digits after decimal point (x.yyyy). In case of low number (and short duration) of TBFs during a granularity period the result might be 0.01 or 0.001.
Alternative formula (proposal):
ULMeanTBFDur * 4]-NACTTBF[1
3600 *useULTBFDrAllCa ULTBFDrFrequ =
Advantage:
• Formula works also In case of low number of TBFs and short TBF duration
Disadvantage:
• Formula might produce inaccurate result when considerable amount of TBFs are assigned (triggering of NACTTBF[5-8, 13-16]) and are seizured (triggering of NACTTBF[1-4, 9-12]) in different measurement intervals.
18.1.12 Mean time between TBF drop
Long Name: (a) Mean time between TBF drop of uplink TBF
(b) Mean time between TBF drop of downlink TBF
Short Name: (a) TBFDrMeanTimeUL
(b) TBFDrMeanTimeDL
Description : This indicator provides the mean time between TBF drops related to one hour TBF duration. Uplink and downlink directions are considered.
Formula: (a)
ULTBFDrFrequ
3600 imeULTBFDrMeanT =
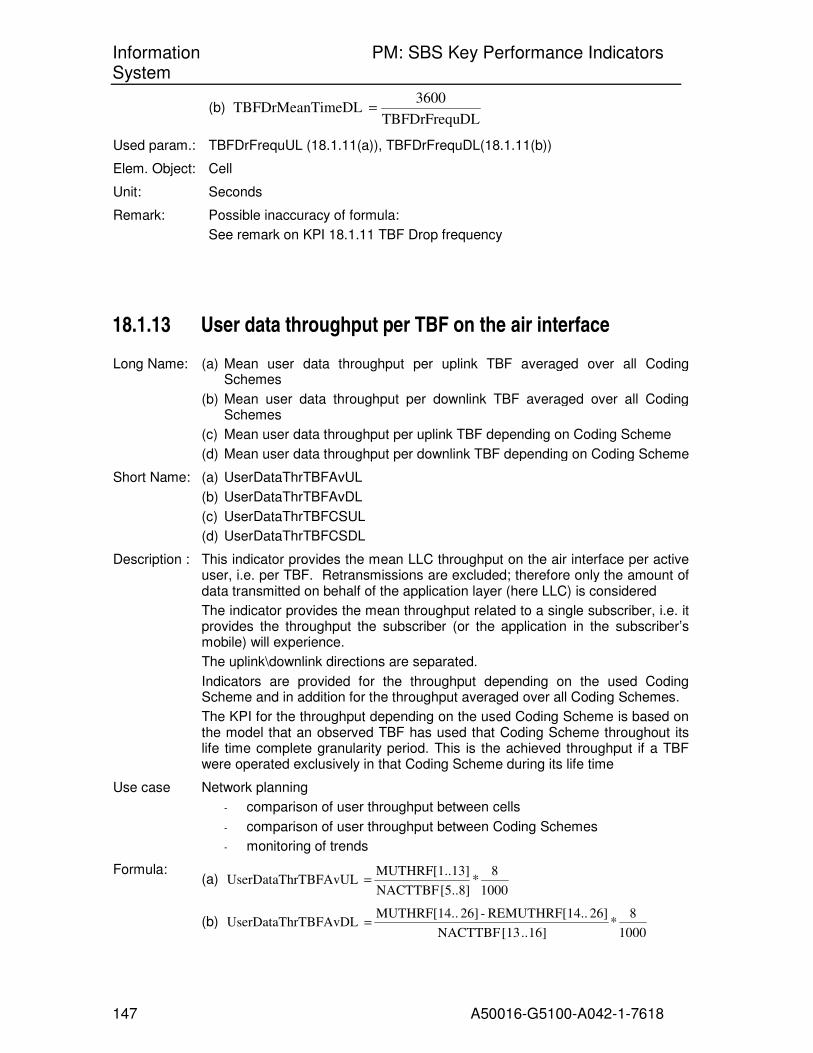
Information PM: SBS Key Performance Indicators System
147 A50016-G5100-A042-1-7618
(b) DLTBFDrFrequ
3600 imeDLTBFDrMeanT =
Used param.: TBFDrFrequUL (18.1.11(a)), TBFDrFrequDL(18.1.11(b))
Elem. Object: Cell
Unit: Seconds
Remark: Possible inaccuracy of formula:
See remark on KPI 18.1.11 TBF Drop frequency
18.1.13 User data throughput per TBF on the air interface
Long Name: (a) Mean user data throughput per uplink TBF averaged over all Coding Schemes
(b) Mean user data throughput per downlink TBF averaged over all Coding Schemes
(c) Mean user data throughput per uplink TBF depending on Coding Scheme
(d) Mean user data throughput per downlink TBF depending on Coding Scheme
Short Name: (a) UserDataThrTBFAvUL
(b) UserDataThrTBFAvDL
(c) UserDataThrTBFCSUL
(d) UserDataThrTBFCSDL
Description : This indicator provides the mean LLC throughput on the air interface per active user, i.e. per TBF. Retransmissions are excluded; therefore only the amount of data transmitted on behalf of the application layer (here LLC) is considered
The indicator provides the mean throughput related to a single subscriber, i.e. it provides the throughput the subscriber (or the application in the subscriber’s mobile) will experience.
The uplink\downlink directions are separated.
Indicators are provided for the throughput depending on the used Coding Scheme and in addition for the throughput averaged over all Coding Schemes.
The KPI for the throughput depending on the used Coding Scheme is based on the model that an observed TBF has used that Coding Scheme throughout its life time complete granularity period. This is the achieved throughput if a TBF were operated exclusively in that Coding Scheme during its life time
Use case Network planning
- comparison of user throughput between cells
- comparison of user throughput between Coding Schemes
- monitoring of trends
Formula: (a)
1000
8*
[5..8] NACTTBF
13]MUTHRF[1.. rTBFAvULUserDataTh =
(b) 1000
8*
16] .. [13 NACTTBF
26] 4..REMUTHRF[1 - 26] .MUTHRF[14. rTBFAvDLUserDataTh =
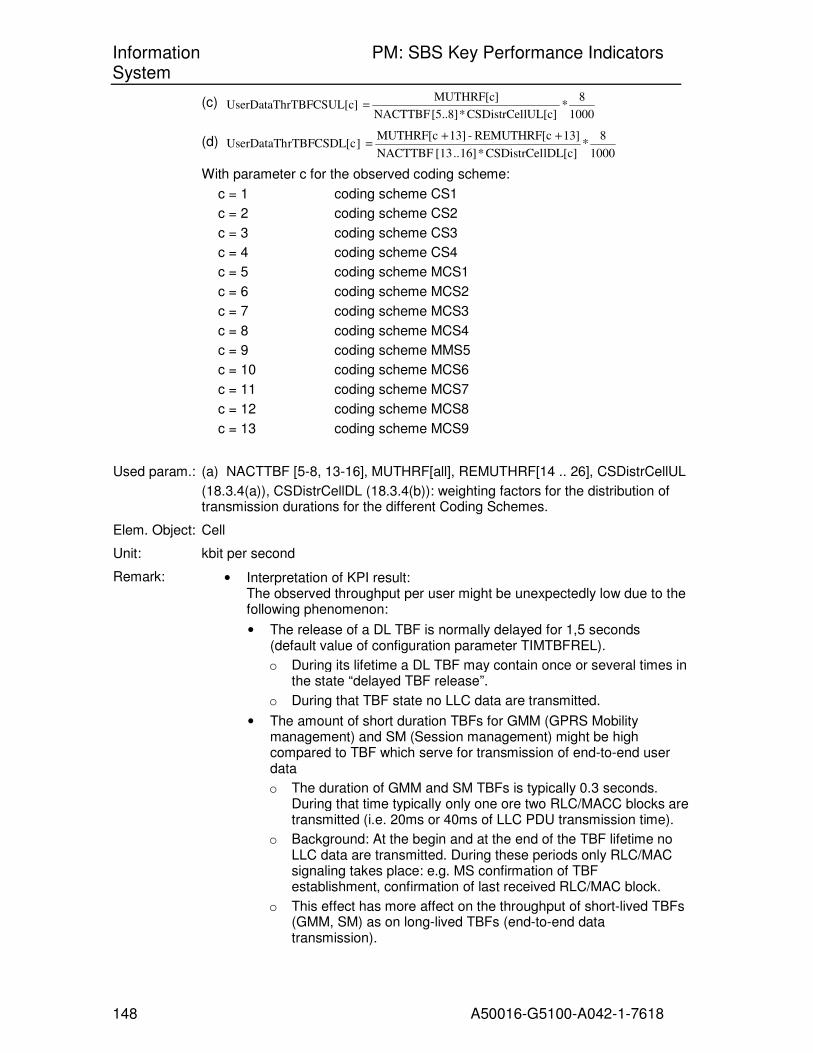
Information PM: SBS Key Performance Indicators System
148 A50016-G5100-A042-1-7618
(c) 1000
8*
lUL[c]CSDistrCel * [5..8] NACTTBF
MUTHRF[c] ]rTBFCSUL[cUserDataTh =
(d) 1000
8*
lDL[c]CSDistrCel * 16] .. [13 NACTTBF
13] REMUTHRF[c - 13] MUTHRF[c ]rTBFCSDL[cUserDataTh
++=
With parameter c for the observed coding scheme:
c = 1 coding scheme CS1
c = 2 coding scheme CS2
c = 3 coding scheme CS3
c = 4 coding scheme CS4
c = 5 coding scheme MCS1
c = 6 coding scheme MCS2
c = 7 coding scheme MCS3
c = 8 coding scheme MCS4
c = 9 coding scheme MMS5
c = 10 coding scheme MCS6
c = 11 coding scheme MCS7
c = 12 coding scheme MCS8
c = 13 coding scheme MCS9
Used param.: (a) NACTTBF [5-8, 13-16], MUTHRF[all], REMUTHRF[14 .. 26], CSDistrCellUL
(18.3.4(a)), CSDistrCellDL (18.3.4(b)): weighting factors for the distribution of transmission durations for the different Coding Schemes.
Elem. Object: Cell
Unit: kbit per second
Remark: • Interpretation of KPI result: The observed throughput per user might be unexpectedly low due to the following phenomenon:
• The release of a DL TBF is normally delayed for 1,5 seconds (default value of configuration parameter TIMTBFREL).
o During its lifetime a DL TBF may contain once or several times in the state “delayed TBF release”.
o During that TBF state no LLC data are transmitted.
• The amount of short duration TBFs for GMM (GPRS Mobility management) and SM (Session management) might be high compared to TBF which serve for transmission of end-to-end user data
o The duration of GMM and SM TBFs is typically 0.3 seconds. During that time typically only one ore two RLC/MACC blocks are transmitted (i.e. 20ms or 40ms of LLC PDU transmission time).
o Background: At the begin and at the end of the TBF lifetime no LLC data are transmitted. During these periods only RLC/MAC signaling takes place: e.g. MS confirmation of TBF establishment, confirmation of last received RLC/MAC block.
o This effect has more affect on the throughput of short-lived TBFs (GMM, SM) as on long-lived TBFs (end-to-end data transmission).
Information PM: SBS Key Performance Indicators System
149 A50016-G5100-A042-1-7618
• Different treatment of UL and DL direction in the formula
DL throughput:
o The retransmitted throughput in DL direction is included in the measurement MUTHRF (DL); therefore REMUTHRF (DL) has to be subtracted
UL throughput:
o Retransmissions due to bad radio link quality are not included in measurement MUTHRF (UL).
• Systematic error on formula: See remark on KPI 18.2.2 User Throughput on radio interface per cell
• Possible inaccuracy of formula:
See remark on KPI 18.1.11 TBF Drop frequency
18.1.14 Packet resource reassignment attempts
Long Name: (a) Number of packet resource reassignment attempts for uplink TBFs
(b) Number of packet resource reassignment attempts for downlink TBFs
Short Name: (a) ReasAttTBFUL
(b) ReasAttTBFDL
Description : This indicator provides the mean number of packet resource reassignment attempts per cell separated for uplink and downlink TBFs.
Use case Network optimization
Formula: (a) ReasAttTBFUL = NATPRRE[1]
(b) ReasAttTBFDL = NATPRRE[2]
Used param.: NATPRRE[all]
Elem. Object: Cell
Unit: none
Remark:
18.1.15 Packet resource reassignment failures
Long Name: (a) Number of unsuccessful packet resource reassignment procedures for uplink TBFs
(b) Number of unsuccessful packet resource reassignment procedures for downlink TBFs
Short Name: (a) ReasFailTBFUL
(b) ReasFailTBFDL
Description : This indicator provides the mean number of unsuccessful packet resource reassignment procedures per cell separated for uplink and downlink TBFs.
Information PM: SBS Key Performance Indicators System
150 A50016-G5100-A042-1-7618
Use case Network optimization
Formula: (a) ReasFailTBFUL = NATPRRE[1] - NSUPRRE[1]
(b) ReasFailTBFDL = NATPRRE[2] - NSUPRRE[2]
Used param.: NATPRRE[all], NSUPRRE[all]
Elem. Object: Cell
Unit: none
Remark:
18.1.16 Packet resource reassignment success rate
Long Name: (a) Packet resource reassignment success rate for uplink TBFs
(b) Packet resource reassignment success rate for downlink TBFs
Short Name: (a) ReasSuccRateTBFUL
(b) ReasSuccRateTBFDL
Description : This indicator provides packet resource reassignment success rate per cell separated for uplink and downlink TBFs.
Use case Network optimization
Formula:
(a) NATPRRE[1]
NSUPRRE[1] teTBFULReasSuccRa =
(b) NATPRRE[2]
NSUPRRE[2] teTBFDLReasSuccRa =
Used param.: NATPRRE[all], NSUPRRE[all]
Elem. Object: Cell
Unit: none
Remark:
18.1.17 Packet resource reassignment failure rate
Long Name: (a) Packet resource reassignment failure rate for uplink TBFs
(b) Packet resource reassignment failure rate for downlink TBFs
Short Name: (a) ReasFailRateTBFUL
(b) ReasFailRateTBFDL
Description : This indicator provides packet resource reassignment failure rate per cell separated for uplink and downlink TBFs.

Information PM: SBS Key Performance Indicators System
151 A50016-G5100-A042-1-7618
Use case Network optimization
Formula:
(a) NATPRRE[1]
[1] NSUPRRE1Re −=TBFULasFailRate
(b) NATPRRE[2]
[2] NSUPRRE1Re −=TBFDLasFailRate
Used param.: NATPRRE[all], NSUPRRE[all]
Elem. Object: Cell
Unit: none
Remark:
18.1.18 TBF downgrade / upgrade frequency
Long Name: (a) Uplink TBF upgrade frequency
(b) Uplink TBF downgrade frequency
(c) Downlink TBF upgrade frequency
(d) Downlink TBF downgrade frequency
Short Name: (a) TBFUpgrFrequUL
(b) TBFDowngrFrequUL
(c) TBFUpgrFrequDL
(d) TBFDowngrFrequDL
Description : This indicator provides the TBF downgrade / upgrade frequency as the mean number of TBF downgrades / upgrades per one hour busy PDCH. Uplink and downlink directions are considered.
Formula:
(a) ]NALLPDCH[3
gran
60 * [1]SERVUGDG
quULTBFUpgrFre =
(b) ]NALLPDCH[3
gran
60 * [2]SERVUGDG
requULTBFDowngrF =
(c) ]NALLPDCH[6
gran
60 * [3]SERVUGDG
quDLTBFUpgrFre =
(d) ]NALLPDCH[6
gran
60 * [4]SERVUGDG
requDLTBFDowngrF =
Used param.: SERVUGDG [1 .. 4], NALLPDCH[3,6]
Elem. Object: Cell

Information PM: SBS Key Performance Indicators System
152 A50016-G5100-A042-1-7618
Unit: Occurrences per hour = (1 / hour)
Remark:
18.1.19 Mean TBF duration per traffic class
Long Name: (a) Mean Uplink TBF duration
(b) Mean Uplink TBF duration acc. to Interactive traffic class
(c) Mean Uplink TBF duration acc. to Streaming traffic class
(d) Mean Uplink TBF duration acc. to Background traffic class
(e) Mean Downlink TBF duration
(f) Mean Downlink TBF duration acc. to Interactive traffic class
(g) Mean Downlink TBF duration acc. to Streaming traffic class
(h) Mean Downlink TBF duration acc. to Background traffic class
Short Name: (a) MeanTBFDurUL
(b) MeanTBFDurULInt
(c) MeanTBFDurULStream
(d) MeanTBFDurULBg
(e) MeanTBFDurDL
(f) MeanTBFDurDLInt
(g) MeanTBFDurDLStream
(h) MeanTBFDurDLBg
Description : This indicator provides the average TBF duration considering uplink and downlink directions.
Use case Network planning and optimization
Formula: (a)
4] - NACTTBF[1
gran * 8] - [5 NACTTBF ULMeanTBFDur =
(b) NACTTBF[2]
gran * [6] NACTTBFULInt MeanTBFDur =
(c) NACTTBF[3]
gran * [7] NACTTBF ULStreamMeanTBFDur =
(d) NACTTBF[4]
gran * [8] NACTTBF ULBgMeanTBFDur =
(e) 12] - NACTTBF[9
gran * 16] - [13 NACTTBF DLMeanTBFDur =
(f) ]NACTTBF[10
gran * [14] NACTTBFDLInt MeanTBFDur =
(g) ]NACTTBF[11
gran * [15] NACTTBF DLStreamMeanTBFDur =
(h) ]NACTTBF[12
gran * [16] NACTTBF DLBgMeanTBFDur =

Information PM: SBS Key Performance Indicators System
153 A50016-G5100-A042-1-7618
Used param.: NACTTBF[all]
Elem. Object: Cell
Unit: Seconds
Remark:
18.1.20 Link adaptation frequency
Long Name: (a) Upward link adaptation frequency for uplink TBF
(b) Downward link adaptation frequency for uplink TBF
(c) Upward link adaptation frequency for downlink TBF
(d) Downward link adaptation frequency for downlink TBF
Short Name: (a) LinkAdaptFrequUpwUL
(b) LinkAdaptFrequDownwUL
(c) LinkAdaptFrequUpwDL
(d) LinkAdaptFrequDownwDL
Description : This indicator provides the link adaptations frequency as the mean number of upward and downward link adaptations per one hour busy PDCH. Uplink and downlink directions are considered.
Use Case
Formula:
(a) ]NALLPDCH[3
gran
60 * [1] LADAPTUD
requUpwULLinkAdaptF =
(b) ]NALLPDCH[3
gran
60 * [2] LADAPTUD
LrequDownwULinkAdaptF =
(c) ]NALLPDCH[6
gran
60 * [3] LADAPTUD
requUpwDLLinkAdaptF =
(d) ]NALLPDCH[6
gran
60 * [4] LADAPTUD
LrequDownwDLinkAdaptF =
Used param.: LADAPTUD [1 .. 4], NALLPDCH[3,6]
Elem. Object: Cell
Unit: Occurrences per hour (= 1 / hour)
Remark:
Information PM: SBS Key Performance Indicators System
154 A50016-G5100-A042-1-7618
18.1.21 Total number of discarded LLC frames
Long Name: (a) Total number of discarded Uplink LLC Frames per Interactive class
(b) Total number of discarded Uplink LLC Frames per Streaming class
(c) Total number of discarded Uplink LLC Frames per Background class
(d) Total number of discarded Downlink LLC Frames per Interactive class
(e) Total number of discarded Downlink LLC Frames per Streaming class
(f) Total number of discarded Downlink LLC Frames per Background class
Short Name: (a) LLCIntFrDiscTotUL
(b) LLCStFrDiscTotUL
(c) LLCBgFrDiscTotUL
(d) LLCIntFrDiscTotDL
(e) LLCStFrDiscTotDL
(f) LLCBgFrDiscTotDL
Description : This indicator provides the total number of LLC frame discards for all causes per cell and per traffic class (interactive, streaming, background services). Uplink and downlink directions are considered.
Use case network optimization from operator view, trouble shooting
Formula: (a) LLCIntFrDiscTotUL= DISCLPDU[11, 12]
(b) LLCStFrDiscTotUL= DISCLPDU[24, 25]
(c) LLCBgFrDiscTotUL= DISCLPDU[37,38]
(d) LLCIntFrDiscTotDL= DISCLPDU[1..10, 13]
(e) LLCStFrDiscTotDL= DISCLPDU[14..23, 26]
(f) LLCBgFrDiscTotDL= DISCLPDU[27..36, 39]
Used param.: DISCLPDU[all]
Elem. Object: Cell
Unit: None
Remark:
18.1.22 LLC Frame discard rate
Long Name: (a) Rate for Uplink LLC Frame Discard per Interactive class
(b) Rate for Uplink LLC Frame Discard per Streaming class
(c) Rate for Uplink LLC Frame Discard per Background class
(d) Rate for Downlink LLC Frame Discard per Interactive class
(e) Rate for Downlink LLC Frame Discard per Streaming class
(f) Rate for Downlink LLC Frame Discard per Background class
Short Name: (a) LLCIntFrDiscRateUL
(b) LLCStFrDiscRateUL
(c) LLCBgFrDiscRateUL
(d) LLCIntFrDiscRateDL
(e) LLCStFrDiscRateDL

Information PM: SBS Key Performance Indicators System
155 A50016-G5100-A042-1-7618
(f) LLCBgFrDiscRateDL
Description : This indicator provides the LLC frame discard rate for all causes per traffic class (interactive, streaming, background services). Uplink and downlink directions are considered.
Use case network optimization from operator view, trouble shooting
Formula: (a)
]NTRLLCFR[1
1,12]DISCLPDU[1 scRateULLLCIntFrDi =
(b) ]NTRLLCFR[2
4,25]DISCLPDU[2 cRateULLLCStFrDis =
(c) ]NTRLLCFR[3
38] 7,DISCLPDU[3 cRateULLLCBgFrDis =
(d) ]NTRLLCFR[4
13] ..10,DISCLPDU[1 scRateDLLLCIntFrDi =
(e) ]NTRLLCFR[5
26] 4..23,DISCLPDU[1 cRateDLLLCStFrDis =
(f) ]NTRLLCFR[6
39] 7..36,DISCLPDU[2 cRateDLLLCBgFrDis =
Used param.: DISCLPDU[all], NTRLLCFR[all]
Elem. Object: Cell
Unit: None
Remark:
18.1.23 DTM establishment success rate
Long Name: (a) DTM establishment Success Rate
Short Name: (a) DTMEstSuccRate
Description : This indicator provides the DTM establishment success probability.
Formula: (a)
4] .. ATDTMREQ[1
2] [1SUDTMREQ RateDTMEstSucc
+=
Used param.: SUDTMREQ[all]; ATDTMREQ[all]
Elem. Object: Cell
Unit: None
Remark:
18.1.24 DTM establishment failure rate
Long Name: (a) DTM establishment failure rate
Short Name: (a) DTMEstFailRate
Information PM: SBS Key Performance Indicators System
156 A50016-G5100-A042-1-7618
Description : This indicator provides the DTM establishment failure rate.
Formula: (a)
4] .. [1ATDTMEREQ
] 3 .. 1 [UNSDTMREQRateDTMEstFail =
Used param.: UNSDTMREQ [all], ATDTMREQ[all]
Elem. Object: Cell
Unit: None
Remark: Cause “DTM Power Budget HO to another cell” will not be considered as failure.
18.1.25 Weighted LLC User Data Throughput
Long Name: (a) Weighted GPRS LLC User Data Throughput, UL
(b) Weighted EDGE LLC User Data Throughput, UL
(c) Weighted GPRS LLC User Data Throughput, DL
(d) Weighted EDGE LLC User Data Throughput, DL
Short Name: (a) WGprsLLCUsrThUL
(b) WEdgeLLCUsrThUL
(c) WGprsLLCUsrThDL
(d) WEdgeLLCUsrThDL
Description : This indicator provides the Weighted LLC User Data Throughput UL/DL per technique.
Formula:
(a)
∑
∑
=
=
+
+⋅
=5
1
5
1
]60[
]60[][
rThULWGprsLLCUs
i
i
iMUTLLC
iMUTLLCiMUTLLC
(b)
∑
∑
=
=
+
+⋅+
=5
1
5
1
]65[
]65[]5[
rThULWEdgeLLCUs
i
i
iMUTLLC
iMUTLLCiMUTLLC
(c)
∑
∑
=
=
+
+⋅+
=5
1
5
1
]70[
]70[]10[
rThDLWGprsLLCUs
i
i
iMUTLLC
iMUTLLCiMUTLLC
(d)
∑
∑
=
=
+
+⋅+
=5
1
5
1
]75[
]75[]15[
rThDLWEdgeLLCUs
i
i
iMUTLLC
iMUTLLCiMUTLLC
Used param.: MUTLLC [1..20, 61..80]
Elem. Object: Cell
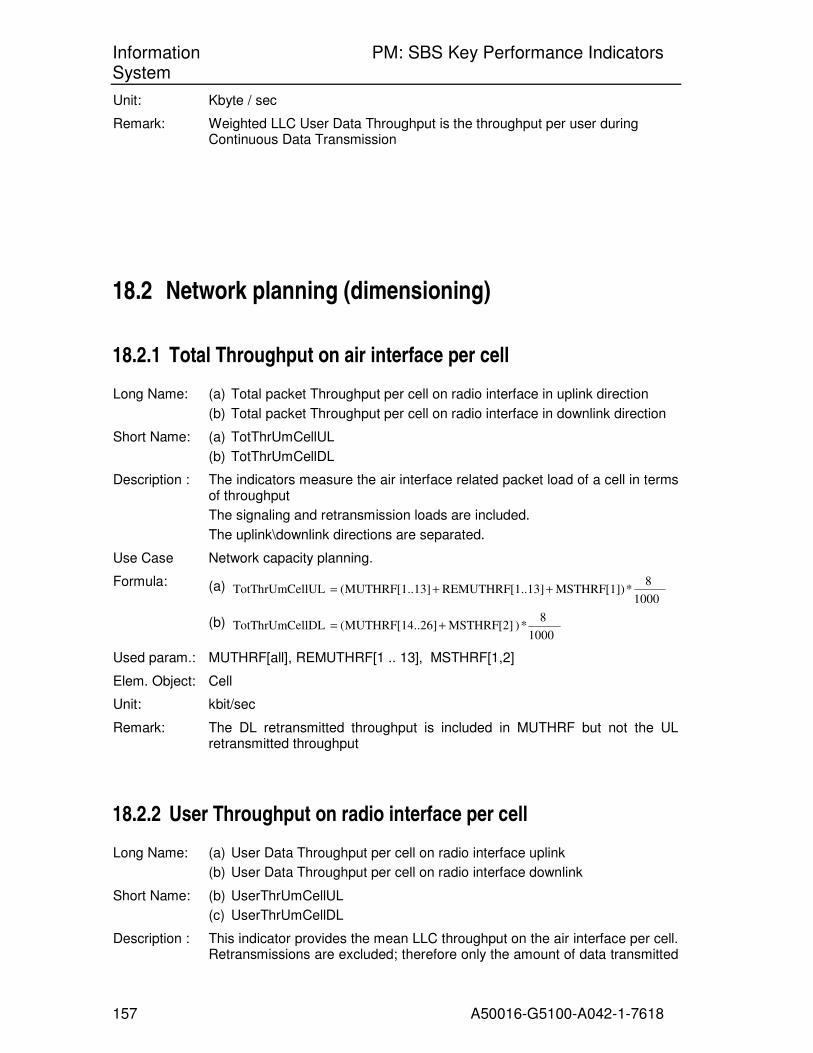
Information PM: SBS Key Performance Indicators System
157 A50016-G5100-A042-1-7618
Unit: Kbyte / sec
Remark: Weighted LLC User Data Throughput is the throughput per user during Continuous Data Transmission
18.2 Network planning (dimensioning)
18.2.1 Total Throughput on air interface per cell
Long Name: (a) Total packet Throughput per cell on radio interface in uplink direction
(b) Total packet Throughput per cell on radio interface in downlink direction
Short Name: (a) TotThrUmCellUL
(b) TotThrUmCellDL
Description : The indicators measure the air interface related packet load of a cell in terms of throughput
The signaling and retransmission loads are included.
The uplink\downlink directions are separated.
Use Case Network capacity planning.
Formula: (a) 1000
8 *MSTHRF[1]) ..13]REMUTHRF[1 13]MUTHRF[1..( llULTotThrUmCe ++=
(b) 1000
8 *) MSTHRF[2] .26]MUTHRF[14.( llDLTotThrUmCe +=
Used param.: MUTHRF[all], REMUTHRF[1 .. 13], MSTHRF[1,2]
Elem. Object: Cell
Unit: kbit/sec
Remark: The DL retransmitted throughput is included in MUTHRF but not the UL retransmitted throughput
18.2.2 User Throughput on radio interface per cell
Long Name: (a) User Data Throughput per cell on radio interface uplink
(b) User Data Throughput per cell on radio interface downlink
Short Name: (b) UserThrUmCellUL
(c) UserThrUmCellDL
Description : This indicator provides the mean LLC throughput on the air interface per cell. Retransmissions are excluded; therefore only the amount of data transmitted
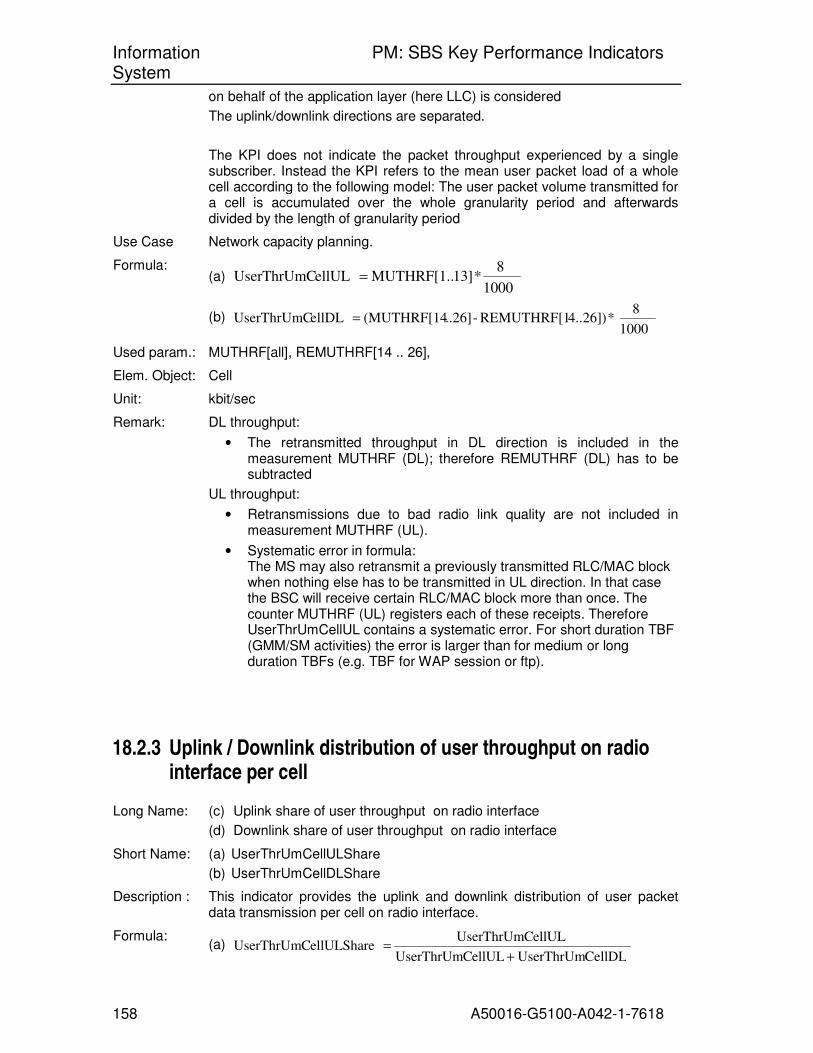
Information PM: SBS Key Performance Indicators System
158 A50016-G5100-A042-1-7618
on behalf of the application layer (here LLC) is considered
The uplink/downlink directions are separated.
The KPI does not indicate the packet throughput experienced by a single subscriber. Instead the KPI refers to the mean user packet load of a whole cell according to the following model: The user packet volume transmitted for a cell is accumulated over the whole granularity period and afterwards divided by the length of granularity period
Use Case Network capacity planning.
Formula: (a)
1000
8 * 13]MUTHRF[1.. ellULUserThrUmC =
(b) 1000
8 *4..26])REMUTHRF[1 - ..26](MUTHRF[14 ellDLUserThrUmC =
Used param.: MUTHRF[all], REMUTHRF[14 .. 26],
Elem. Object: Cell
Unit: kbit/sec
Remark: DL throughput:
• The retransmitted throughput in DL direction is included in the measurement MUTHRF (DL); therefore REMUTHRF (DL) has to be subtracted
UL throughput:
• Retransmissions due to bad radio link quality are not included in measurement MUTHRF (UL).
• Systematic error in formula: The MS may also retransmit a previously transmitted RLC/MAC block when nothing else has to be transmitted in UL direction. In that case the BSC will receive certain RLC/MAC block more than once. The counter MUTHRF (UL) registers each of these receipts. Therefore UserThrUmCellUL contains a systematic error. For short duration TBF (GMM/SM activities) the error is larger than for medium or long duration TBFs (e.g. TBF for WAP session or ftp).
18.2.3 Uplink / Downlink distribution of user throughput on radio interface per cell
Long Name: (c) Uplink share of user throughput on radio interface
(d) Downlink share of user throughput on radio interface
Short Name: (a) UserThrUmCellULShare
(b) UserThrUmCellDLShare
Description : This indicator provides the uplink and downlink distribution of user packet data transmission per cell on radio interface.
Formula: (a)
CellDL UserThrUm ellULUserThrUmC
ellULUserThrUmC ellULShareUserThrUmC
+=
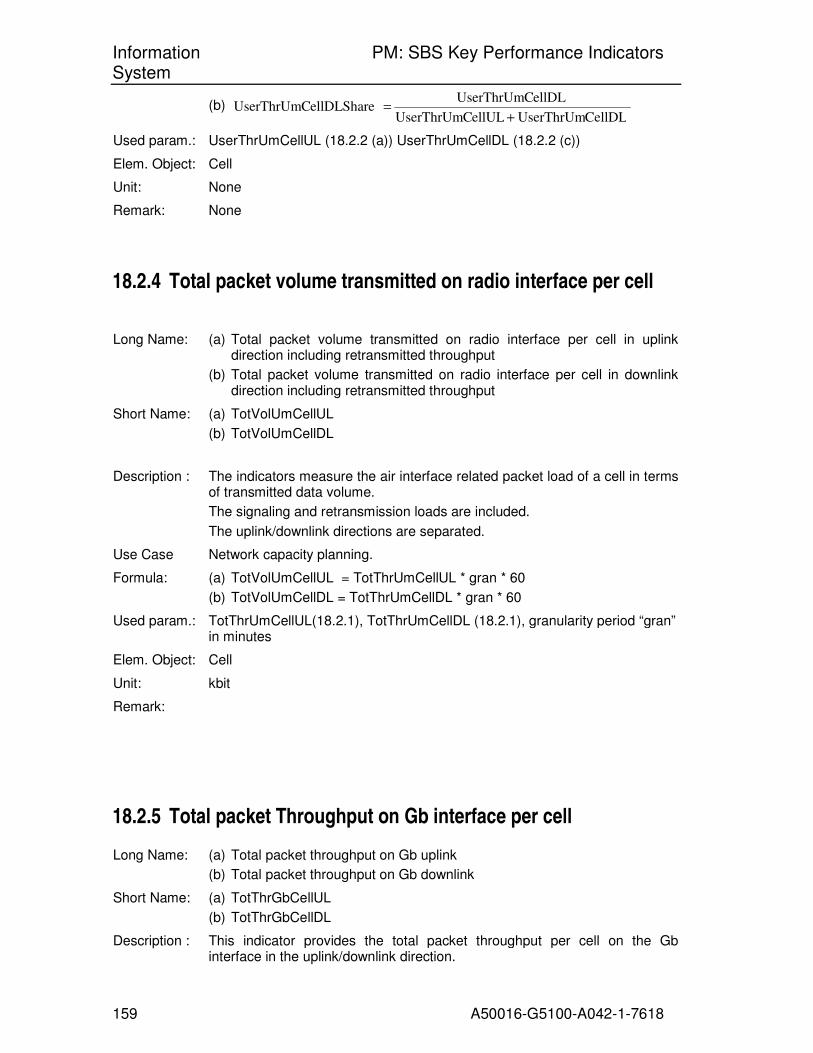
Information PM: SBS Key Performance Indicators System
159 A50016-G5100-A042-1-7618
(b) CellDL UserThrUm ellULUserThrUmC
ellDLUserThrUmC ellDLShareUserThrUmC
+=
Used param.: UserThrUmCellUL (18.2.2 (a)) UserThrUmCellDL (18.2.2 (c))
Elem. Object: Cell
Unit: None
Remark: None
18.2.4 Total packet volume transmitted on radio interface per cell
Long Name: (a) Total packet volume transmitted on radio interface per cell in uplink direction including retransmitted throughput
(b) Total packet volume transmitted on radio interface per cell in downlink direction including retransmitted throughput
Short Name: (a) TotVolUmCellUL
(b) TotVolUmCellDL
Description : The indicators measure the air interface related packet load of a cell in terms of transmitted data volume.
The signaling and retransmission loads are included.
The uplink/downlink directions are separated.
Use Case Network capacity planning.
Formula: (a) TotVolUmCellUL = TotThrUmCellUL * gran * 60
(b) TotVolUmCellDL = TotThrUmCellDL * gran * 60
Used param.: TotThrUmCellUL(18.2.1), TotThrUmCellDL (18.2.1), granularity period “gran” in minutes
Elem. Object: Cell
Unit: kbit
Remark:
18.2.5 Total packet Throughput on Gb interface per cell
Long Name: (a) Total packet throughput on Gb uplink
(b) Total packet throughput on Gb downlink
Short Name: (a) TotThrGbCellUL
(b) TotThrGbCellDL
Description : This indicator provides the total packet throughput per cell on the Gb interface in the uplink/downlink direction.

Information PM: SBS Key Performance Indicators System
160 A50016-G5100-A042-1-7618
The total packet throughput comprises user data (LLC layer) from traffic classes (interactive, streaming, background services) including BSSGP header and BSSGP signaling
Formula: (a)
1000
8 * MSTHBS[1]) .3](MUTHBS[1. llULTotThrGbCe +=
(b) 1000
8 * MSTHBS[2]) .6](MUTHBS[4. llDLTotThrGbCe +=
Used param.: MUTHBS[all]; MSTHBS[1,2];
Elem. Object: Cell
Unit: kbit/sec
Remark: None
18.2.6 User data Throughput on Gb interface per cell
Long Name: (a) User Data Throughput on Gb uplink
(b) User Data Throughput on Gb downlink
Short Name: (a) UserThrGbCellUL
(b) UserThrGbCellDL
Description : This indicator provides the mean user data throughput on LLC layer per cell on the Gb interface in the uplink/downlink direction.
Formula: (a)
1000
8 * 3]MUTHBS[1.. ellULUserThrGbC =
(b) 1000
8 * 6]MUTHBS[4.. ellDLUserThrGbC =
Used param.: MUTHBS[all]
Elem. Object: Cell
Unit: kbit/sec
Remark: None
18.2.7 Mean number of busy PDCH per cell
Long Name: (a) Mean number of PDCHs busy per cell for UL transmission
(b) Mean number of PDCHs busy per cell for DL transmission
Short Name: (a) MeanPDCHBusyCellUL

Information PM: SBS Key Performance Indicators System
161 A50016-G5100-A042-1-7618
(b) MeanPDCHBusyCellDL
Description : This KPI provides the mean number of PDCHs per cell with at least one UL TBF respectively at least one downlink TBF in progress
Use case Network planing
Formula: (a) MeanPDCHBusyCellUL = NALLPDCH [3]
(b) MeanPDCHBusyCellDL = NALLPDCH [6]
Used param.: NALLPDCH [3,6]
Elem. Object: Cell
Unit: None
Remark: None
18.2.8 PDCH utilization rate
Long Name: (a) Average utilization rate of UL busy PDCHs in terms of used transmission time
(b) Average utilization rate of DL busy PDCHs in terms of used transmission time
Short Name: (a) MeanBusyPdchUtilCellUL
(b) MeanBusyPdchUtilCellDL
Description : This KPI provides the average utilisation of busy PDCHs in terms of the number of transmitted PDUs relative to the possible PDUs.
In order to measure the overall utilization the retransmissions and the signaling PDUs are included.
The KPI is for uplink and downlink direction.
Difference to TCH utilization:
- A TCH is fully utilized by a single CS connection.
- The capacity of a PDCH is normally not fully occupied when one or more TBFs are allocated to that PDCH. The TBFs will in most cases occupy only a part of the PDCHs transmission capacity.
Use case Network planning
Formula: (a)
]3[
) 20
MSTHRF[1]
60 *gran
13]) [11. NRETPDU 1.13](NTRAPDU[1 ½ 11]) .. [1 NRETPDU ..11](NTRAPDU[1(*2
ULchUtilCellMeanBusyPd
NALLPDCH
++++
=
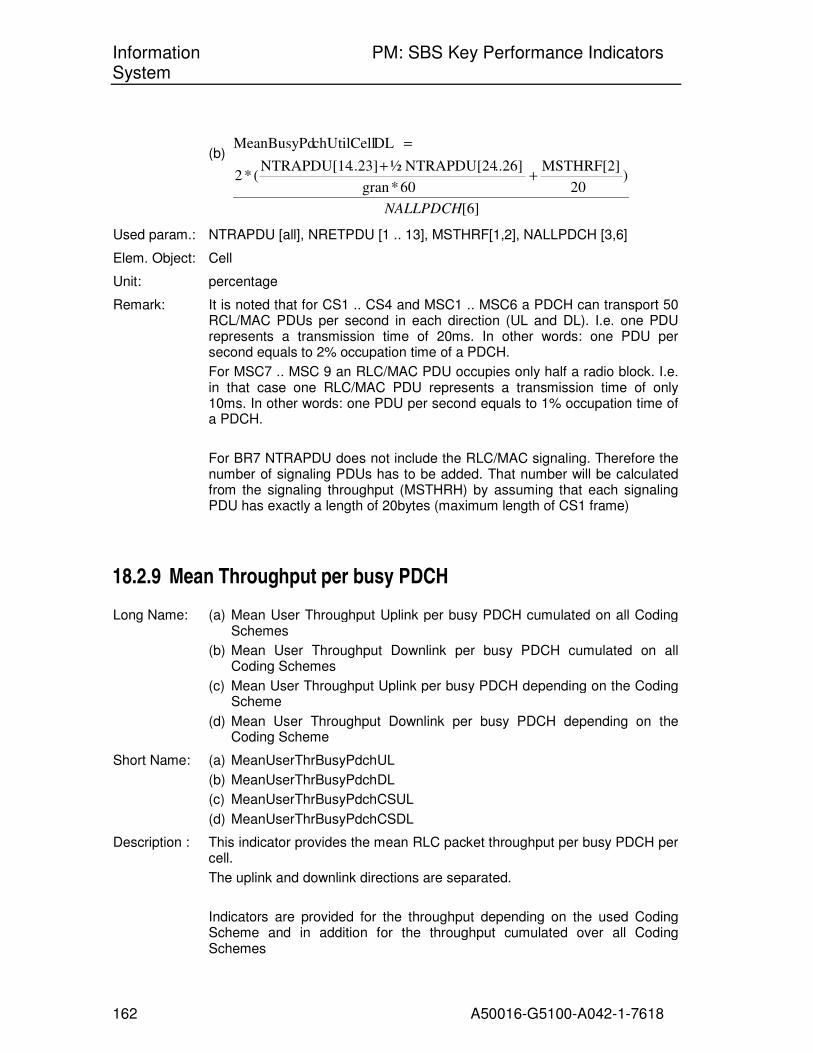
Information PM: SBS Key Performance Indicators System
162 A50016-G5100-A042-1-7618
(b)
]6[
) 20
MSTHRF[2]
60 *gran
..26]NTRAPDU[24 ½..23]NTRAPDU[14(*2
DLchUtilCellMeanBusyPd
NALLPDCH
++
=
Used param.: NTRAPDU [all], NRETPDU [1 .. 13], MSTHRF[1,2], NALLPDCH [3,6]
Elem. Object: Cell
Unit: percentage
Remark: It is noted that for CS1 .. CS4 and MSC1 .. MSC6 a PDCH can transport 50 RCL/MAC PDUs per second in each direction (UL and DL). I.e. one PDU represents a transmission time of 20ms. In other words: one PDU per second equals to 2% occupation time of a PDCH.
For MSC7 .. MSC 9 an RLC/MAC PDU occupies only half a radio block. I.e. in that case one RLC/MAC PDU represents a transmission time of only 10ms. In other words: one PDU per second equals to 1% occupation time of a PDCH.
For BR7 NTRAPDU does not include the RLC/MAC signaling. Therefore the number of signaling PDUs has to be added. That number will be calculated from the signaling throughput (MSTHRH) by assuming that each signaling PDU has exactly a length of 20bytes (maximum length of CS1 frame)
18.2.9 Mean Throughput per busy PDCH
Long Name: (a) Mean User Throughput Uplink per busy PDCH cumulated on all Coding Schemes
(b) Mean User Throughput Downlink per busy PDCH cumulated on all Coding Schemes
(c) Mean User Throughput Uplink per busy PDCH depending on the Coding Scheme
(d) Mean User Throughput Downlink per busy PDCH depending on the Coding Scheme
Short Name: (a) MeanUserThrBusyPdchUL
(b) MeanUserThrBusyPdchDL
(c) MeanUserThrBusyPdchCSUL
(d) MeanUserThrBusyPdchCSDL
Description : This indicator provides the mean RLC packet throughput per busy PDCH per cell.
The uplink and downlink directions are separated.
Indicators are provided for the throughput depending on the used Coding Scheme and in addition for the throughput cumulated over all Coding Schemes

Information PM: SBS Key Performance Indicators System
163 A50016-G5100-A042-1-7618
The KPI for the throughput depending on the used Coding Scheme is based on the model that an observed busy PDCH has used that Coding Scheme throughout the complete granularity period. This is the achieved throughput if a PDCH were operated exclusively in that Coding Scheme during the granularity period
Use case Network planning (network extension): KPI provides the capacity, which can be provided per PDCH. Assume the user traffic model is given by means of data volume per subscriber and number of subscribers per cell. For that scenario the present KPIs aids to calculate the number of needed PDCHs for the concerned cell
Formula: (a)
]3[
tRateULMeanPDCHBi LrBusyPdchUMeanUserTh
NALLPDCH=
(b) ]6[
tRateDLMeanPDCHBi LrBusyPdchDMeanUserTh
NALLPDCH=
(c) [c] lULCSDistrCel * ]3[
eULCS[c]PDCHBitRat SUL[c]rBusyPdchCMeanUserTh
NALLPDCH=
(d) [c] lDLCSDistrCel * 6][
eDLCS[c]PDCHBitRat SDL[c]rBusyPdchCMeanUserTh
NALLPDCH=
With parameter c for the observed coding scheme:
c = 1 coding scheme CS1
c = 2 coding scheme CS2
c = 3 coding scheme CS4
c = 4 coding scheme CS5
c = 5 coding scheme MCS1
c = 6 coding scheme MCS2
c = 7 coding scheme MCS3
c = 8 coding scheme MCS4
c = 9 coding scheme MCS5
c = 10 coding scheme MCS6
c = 11 coding scheme MCS7
c = 12 coding scheme MCS8
c = 13 coding scheme MCS9
Used param.: NALLPDCH [3,6],
CSDistrCellUL (18.3.4(a)), CSDistrCellDL (18.3.4(b)): weighting factors for the distribution of transmission durations for the different Coding Schemes.
MeanPDCHBitRateUL(18.2.14(a)), MeanPDCHBitRateDL (18.2.14(d)),
PDCHBitRateULCS (18.2.13(a)), PDCHBitRateDLCS (18.2.13(b))
Elem. Object: Cell
Unit: kbit/sec
Remark:
• Please note that no RLC/MAC signaling and no RLC/MAC headers and are included in this indicator. Also retransmissions are excluded. Therefore the total amount of data transmitted via RLC/MAC layers per PDCH is higher.
Information PM: SBS Key Performance Indicators System
164 A50016-G5100-A042-1-7618
• Interpretation of KPI result: The observed throughput per user might be unexpectedly low due to the following phenomenon:
• The release of a DL TBF is normally delayed for 1,5 seconds (default value of configuration parameter TIMTBFREL).
o During its lifetime a DL TBF may contain once or several times in the state “delayed TBF release”.
o During that TBF state no LLC data are transmitted.
• The amount of short duration TBFs for GMM (GPRS Mobility management) and SM (Session management) might be high compared to TBF which serve for transmission of end-to-end user data
o The duration of GMM and SM TBFs is typically 0.3 seconds. During that time typically only one ore two RLC/MACC blocks are transmitted (i.e. 20ms or 40ms of LLC PDU transmission time).
o Background: At the beginning and at the end of the TBF lifetime no LLC data are transmitted. During these periods only RLC/MAC signaling takes place: e.g. MS confirmation of TBF establishment, confirmation of last received RLC/MAC block.
o This effect has more affect on the throughput of short-lived TBFs (GMM, SM) as on long-lived TBFs (end-to-end data transmission)
• Different treatment of UL and DL direction in the formula
DL throughput:
o The retransmitted throughput in DL direction is included in the measurement MUTHRF (DL); therefore REMUTHRF (DL) has to be subtracted
UL throughput:
o Retransmissions due to bad radio link quality are not included in measurement MUTHRF (UL).
• Systematic error on formula: See remark on KPI 18.2.2 User Throughput on radio interface per cell
• Possible inaccuracy of formula:
See remark on KPI 18.1.11 TBF Drop frequency
18.2.10 Mean number of simultaneously active TBFs per cell
Long Name: (a) Mean number of simultaneously active TBF per cell uplink
(b) Mean number of simultaneously active TBF per cell downlink
Short Name: (a) MeanActTbfUL
(b) MeanActTbfDL
Description : This indicator provides the mean number of simultaneously active TBFs for the uplink and downlink direction.

Information PM: SBS Key Performance Indicators System
165 A50016-G5100-A042-1-7618
Use case Network planning: how many MS have data transmission simultaneously in a cell.
Formula: (a) MeanActTbfUL = NACTTBF[5 .. 8];
(b) MeanActTbfDL = NACTTBF[13 ..16];
Used param.: NACTTBF[5..8, 13..16];
Elem. Object: Cell
Unit: None
Remark: None
18.2.11 Mean number of TBFs multiplexed on same PDCH
Long Name: (a) Mean number of uplink TBFs multiplexed on the same PDCH
(b) Mean number of downlink TBFs multiplexed on the same PDCH
Short Name: (a) MeanTBFMultiplPDCHUL
(b) MeanTBFMultiplPDCHDL
Description : This indicator provides the mean number of TBFs multiplexed on the same PDCH (horizontal allocation) for the uplink and downlink direction.
Use case Network optimization. E.g. tuning of the parameters for PDCH allocation (in connection with the KPIs for packet throughput per user, see chapter 18.1.13)
Formula: (a) MeanTBFMultiplPDCHUL = NTBFPDC[2];
(b) MeanTBFMultiplPDCHDL = NTBFPDC[4];
Used param.: NTBFPDC[2,4];
Elem. Object: Cell
Unit: None
Remark: None
18.2.12 Mean number of allocated PDCHs per TBF
Long Name: (a) Mean number of allocated PDCHs per uplink TBF
(b) Mean number of allocated PDCHs per downlink TBF
Short Name: (a) MeanAllocPdchTbfUL
(b) MeanAllocPdchTbfDL
Description : This indicator provides the mean number of PDCHs assigned to a TBF for the uplink and downlink direction (horizontal allocation)
Use case Monitoring of MS behavior: penetration of the MS multi slot classes
Formula: (a)
.8],NACTTBF[5.
[3] NALLPDCH * NTBFPDC[2] dchTbfULMeanAllocP =
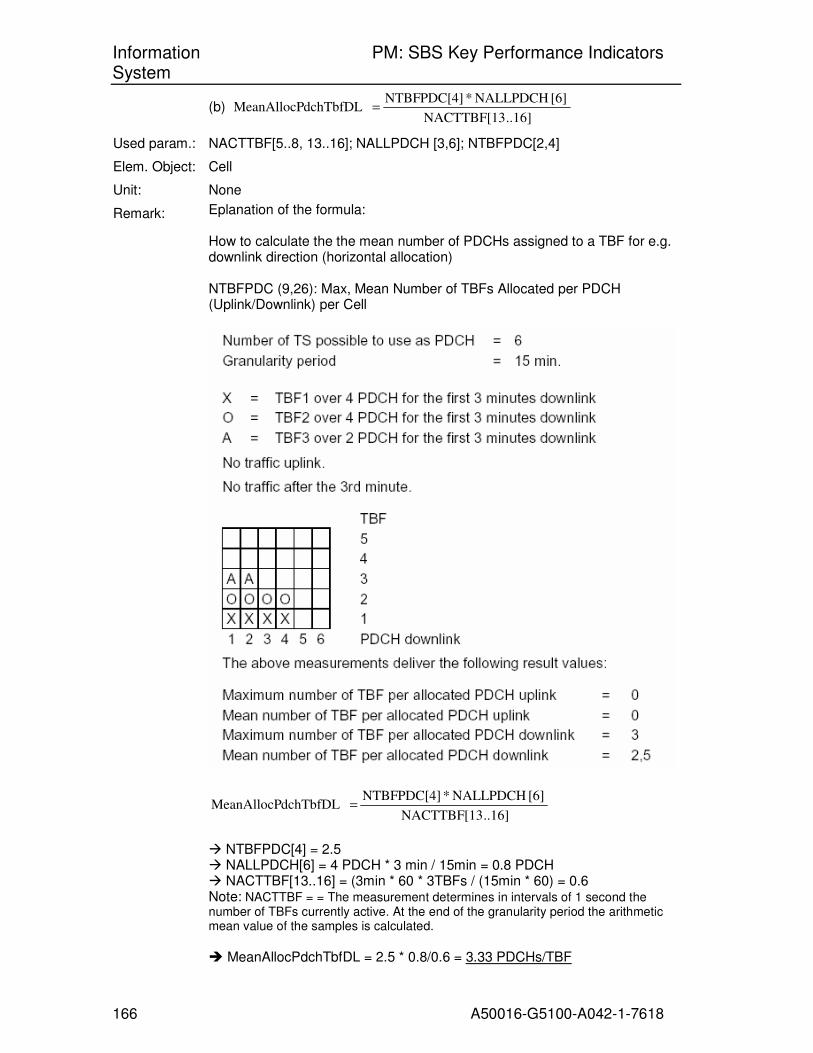
Information PM: SBS Key Performance Indicators System
166 A50016-G5100-A042-1-7618
(b) ..16]NACTTBF[13
[6] NALLPDCH * NTBFPDC[4] dchTbfDLMeanAllocP =
Used param.: NACTTBF[5..8, 13..16]; NALLPDCH [3,6]; NTBFPDC[2,4]
Elem. Object: Cell
Unit: None
Remark: Eplanation of the formula: How to calculate the the mean number of PDCHs assigned to a TBF for e.g. downlink direction (horizontal allocation) NTBFPDC (9,26): Max, Mean Number of TBFs Allocated per PDCH (Uplink/Downlink) per Cell
..16]NACTTBF[13
[6] NALLPDCH * NTBFPDC[4] dchTbfDLMeanAllocP =
� NTBFPDC[4] = 2.5 � NALLPDCH[6] = 4 PDCH * 3 min / 15min = 0.8 PDCH � NACTTBF[13..16] = (3min * 60 * 3TBFs / (15min * 60) = 0.6 Note: NACTTBF = = The measurement determines in intervals of 1 second the number of TBFs currently active. At the end of the granularity period the arithmetic mean value of the samples is calculated.
� MeanAllocPdchTbfDL = 2.5 * 0.8/0.6 = 3.33 PDCHs/TBF
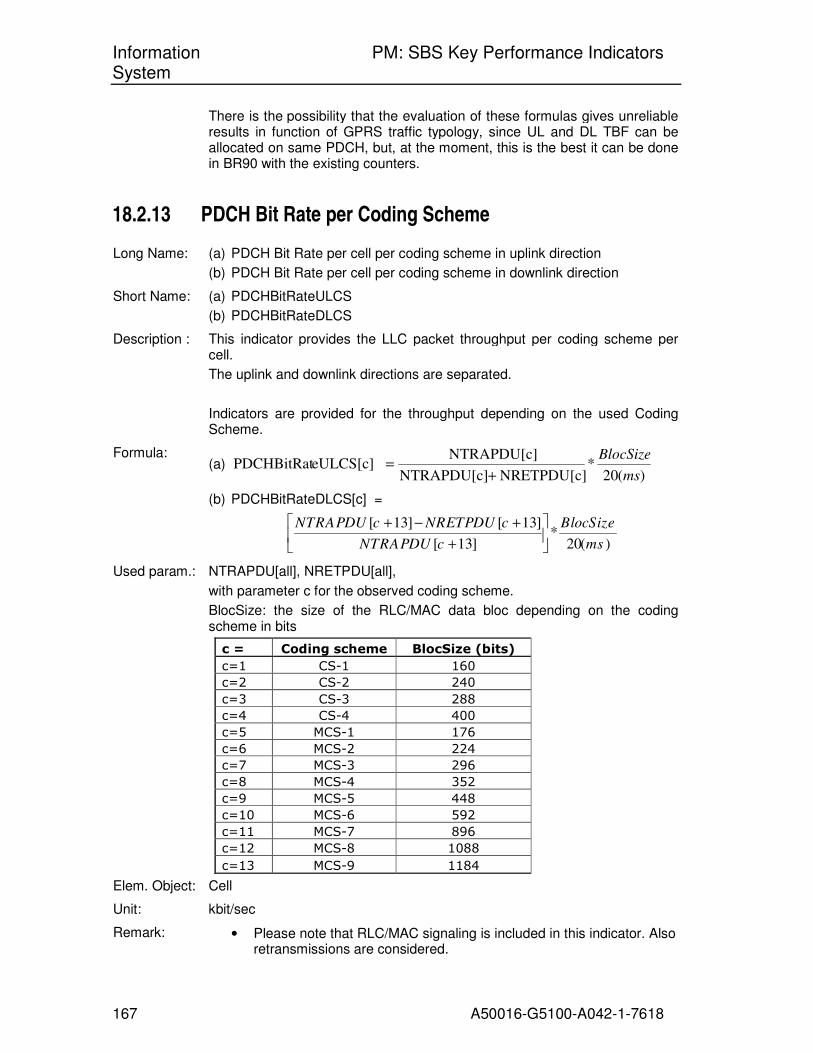
Information PM: SBS Key Performance Indicators System
167 A50016-G5100-A042-1-7618
There is the possibility that the evaluation of these formulas gives unreliable results in function of GPRS traffic typology, since UL and DL TBF can be allocated on same PDCH, but, at the moment, this is the best it can be done in BR90 with the existing counters.
18.2.13 PDCH Bit Rate per Coding Scheme
Long Name: (a) PDCH Bit Rate per cell per coding scheme in uplink direction
(b) PDCH Bit Rate per cell per coding scheme in downlink direction
Short Name: (a) PDCHBitRateULCS
(b) PDCHBitRateDLCS
Description : This indicator provides the LLC packet throughput per coding scheme per cell.
The uplink and downlink directions are separated.
Indicators are provided for the throughput depending on the used Coding Scheme.
Formula: (a)
)(20*
NRETPDU[c] NTRAPDU[c]
NTRAPDU[c] eULCS[c]PDCHBitRat
ms
BlocSize
+=
(b) PDCHBitRateDLCS[c] =
[ 13] [ 13]
*[ 13] 20( )
NTRAPDU c NRETPDU c BlocSize
NTRAPDU c ms
+ − +
+
Used param.: NTRAPDU[all], NRETPDU[all],
with parameter c for the observed coding scheme.
BlocSize: the size of the RLC/MAC data bloc depending on the coding scheme in bits
c = Coding scheme BlocSize (bits)
c=1 CS-1 160
c=2 CS-2 240
c=3 CS-3 288
c=4 CS-4 400
c=5 MCS-1 176
c=6 MCS-2 224
c=7 MCS-3 296
c=8 MCS-4 352
c=9 MCS-5 448
c=10 MCS-6 592
c=11 MCS-7 896
c=12 MCS-8 1088
c=13 MCS-9 1184
Elem. Object: Cell
Unit: kbit/sec
Remark: • Please note that RLC/MAC signaling is included in this indicator. Also retransmissions are considered.
Information PM: SBS Key Performance Indicators System
168 A50016-G5100-A042-1-7618
• Different treatment of UL and DL direction in the formula
DL throughput:
o The retransmitted throughput in DL direction is included in the measurement NTRAPDU(DL); therefore NRETPDU (DL) has to be subtracted
UL throughput:
o Retransmissions due to bad radio link quality are not included in measurement NTRAPDU (UL).
18.2.14 Mean PDCH Bit Rate
Long Name: (a) Mean PDCH Bit Rate for GPRS per cell in uplink direction
(b) Mean PDCH Bit Rate for EDGE per cell in uplink direction
(c) Mean PDCH Bit Rate for GPRS per cell in downlink direction
(d) Mean PDCH Bit Rate for EDGE per cell in downlink direction
Short Name: (a) MeanPDCHBitRateGprsUL
(b) MeanPDCHBitRateEdgeUL
(c) MeanPDCHBitRateGprsDL
(d) MeanPDCHBitRateEdgeDL
Description : This indicator provides the average LLC packet throughput per PDCH.
The uplink and downlink directions are separated.
Indicators are provided for the throughput cumulated over all Coding Schemes.
Use case
Formula: (a) ∑
=
=4
1
][*][LtRateGprsUMeanPDCHBic
clULCSDistrCelceULCSPDCHBitRat
(b) ∑=
=13
5
][*][LtRateEdgeUMeanPDCHBic
clULCSDistrCelceULCSPDCHBitRat
(c) ∑=
=4
1
][*][LtRateGprsDMeanPDCHBic
clDLCSDistrCelceDLCSPDCHBitRat
(d) ∑=
=13
5
][*][LtRateEdgeDMeanPDCHBic
clDLCSDistrCelceDLCSPDCHBitRat
Used param.: PDCHBitRateULCS[all] (18.2.13(a)), PDCHBitRateDLCS[all] (18.2.13(b))
CSDistrCellUL (18.3.4(a)), CSDistrCellDL (18.3.4(b)): weighting factors for the distribution of transmission durations for the different Coding Schemes.
Elem. Object: Cell
Unit: kbit/sec
Remark: None
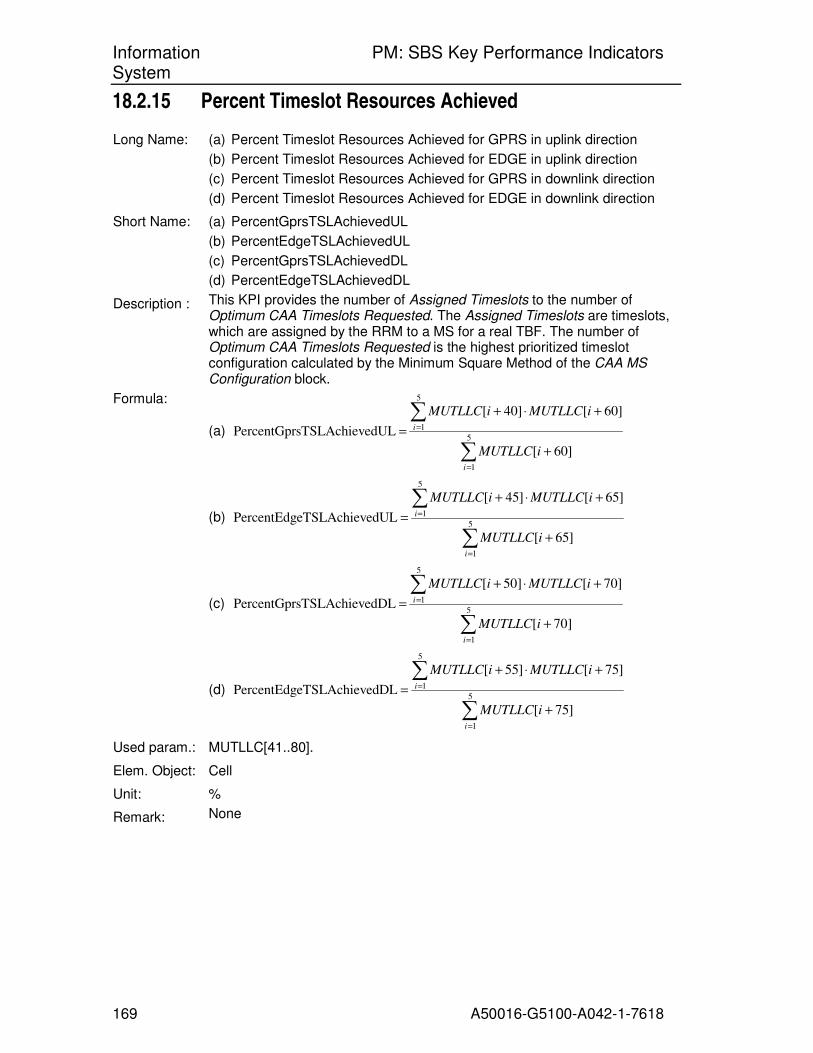
Information PM: SBS Key Performance Indicators System
169 A50016-G5100-A042-1-7618
18.2.15 Percent Timeslot Resources Achieved
Long Name: (a) Percent Timeslot Resources Achieved for GPRS in uplink direction
(b) Percent Timeslot Resources Achieved for EDGE in uplink direction
(c) Percent Timeslot Resources Achieved for GPRS in downlink direction
(d) Percent Timeslot Resources Achieved for EDGE in downlink direction
Short Name: (a) PercentGprsTSLAchievedUL
(b) PercentEdgeTSLAchievedUL
(c) PercentGprsTSLAchievedDL
(d) PercentEdgeTSLAchievedDL
Description : This KPI provides the number of Assigned Timeslots to the number of Optimum CAA Timeslots Requested. The Assigned Timeslots are timeslots, which are assigned by the RRM to a MS for a real TBF. The number of Optimum CAA Timeslots Requested is the highest prioritized timeslot configuration calculated by the Minimum Square Method of the CAA MS Configuration block.
Formula:
(a)
∑
∑
=
=
+
+⋅+
=5
1
5
1
]60[
]60[]40[
edULsTSLAchievPercentGpr
i
i
iMUTLLC
iMUTLLCiMUTLLC
(b)
∑
∑
=
=
+
+⋅+
=5
1
5
1
]65[
]65[]45[
edULeTSLAchievPercentEdg
i
i
iMUTLLC
iMUTLLCiMUTLLC
(c)
∑
∑
=
=
+
+⋅+
=5
1
5
1
]70[
]70[]50[
edDLsTSLAchievPercentGpr
i
i
iMUTLLC
iMUTLLCiMUTLLC
(d)
∑
∑
=
=
+
+⋅+
=5
1
5
1
]75[
]75[]55[
edDLeTSLAchievPercentEdg
i
i
iMUTLLC
iMUTLLCiMUTLLC
Used param.: MUTLLC[41..80].
Elem. Object: Cell
Unit: %
Remark: None

Information PM: SBS Key Performance Indicators System
170 A50016-G5100-A042-1-7618
18.3 Network optimization
18.3.1 Retransmission Rate on radio interface per cell per coding scheme
Long Name: (a) Uplink retransmission Rate on radio interface per cell per coding scheme
(b) Downlink retransmission Rate on radio interface per cell per coding scheme
Short Name: (a) RetransRateUmCellULCS
(b) RetransRateUmCellDLCS
Description : This indicator provides the retransmission rate on the radio interface per coding scheme by the ratio of the number of RLC/MAC PDUs needed for user data retransmission and the overall number of transmitted user data PDUs.
The uplink and downlink directions are considered separately
Use case KPI used for Network quality optimization: -> optimize C/I thresholds for coding scheme selection
Formula: (a)
NRETPDU[c] NTRAPDU[c]
NRETPDU[c] S[c]eUmCellULCRetransRat
+=
(b) c]NTRAPDU[13
c]NRETPDU[13 S[c]eUmCellDLCRetransRat
+
+=
With parameter c for the observed coding scheme:
c = 1 coding scheme CS1
c = 2 coding scheme CS2
c = 3 coding scheme CS3
c = 4 coding scheme CS4
c = 5 coding scheme MCS1
c = 6 coding scheme MCS2
c = 7 coding scheme MCS3
c = 8 coding scheme MCS4
c = 9 coding scheme MCS5
c = 10 coding scheme MCS6
c = 11 coding scheme MCS7
c = 12 coding scheme MCS8
c = 13 coding scheme MCS9
Used param.: NTRAPDU[all], NRETPDU[all],
Elem. Object: Cell
Unit: none
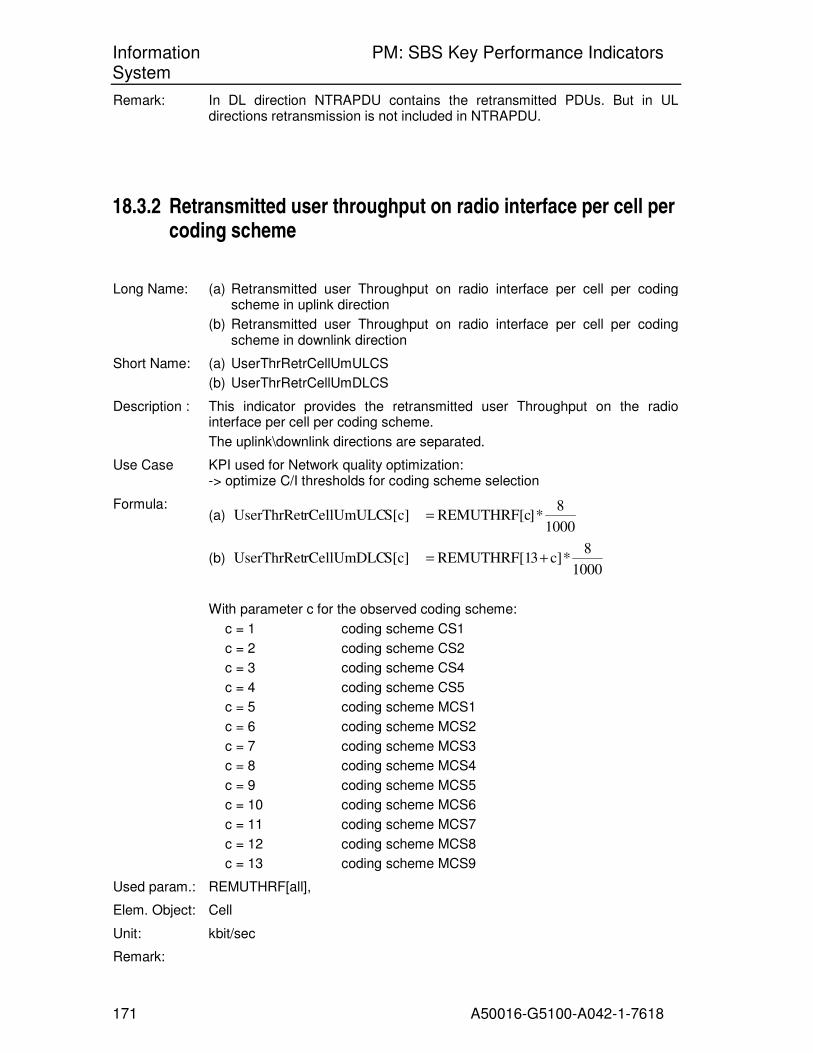
Information PM: SBS Key Performance Indicators System
171 A50016-G5100-A042-1-7618
Remark: In DL direction NTRAPDU contains the retransmitted PDUs. But in UL directions retransmission is not included in NTRAPDU.
18.3.2 Retransmitted user throughput on radio interface per cell per coding scheme
Long Name: (a) Retransmitted user Throughput on radio interface per cell per coding scheme in uplink direction
(b) Retransmitted user Throughput on radio interface per cell per coding scheme in downlink direction
Short Name: (a) UserThrRetrCellUmULCS
(b) UserThrRetrCellUmDLCS
Description : This indicator provides the retransmitted user Throughput on the radio interface per cell per coding scheme.
The uplink\downlink directions are separated.
Use Case KPI used for Network quality optimization: -> optimize C/I thresholds for coding scheme selection
Formula: (a)
1000
8 * ]REMUTHRF[c S[c]rCellUmULCUserThrRet =
(b) 1000
8 * c]3REMUTHRF[1 S[c]rCellUmDLCUserThrRet +=
With parameter c for the observed coding scheme:
c = 1 coding scheme CS1
c = 2 coding scheme CS2
c = 3 coding scheme CS4
c = 4 coding scheme CS5
c = 5 coding scheme MCS1
c = 6 coding scheme MCS2
c = 7 coding scheme MCS3
c = 8 coding scheme MCS4
c = 9 coding scheme MCS5
c = 10 coding scheme MCS6
c = 11 coding scheme MCS7
c = 12 coding scheme MCS8
c = 13 coding scheme MCS9
Used param.: REMUTHRF[all],
Elem. Object: Cell
Unit: kbit/sec
Remark:

Information PM: SBS Key Performance Indicators System
172 A50016-G5100-A042-1-7618
18.3.3 Distribution of user throughput on radio interface on Coding Schemes per cell
Long Name: (a) Distribution of Uplink radio interface User Throughput per cell on coding schemes
(b) Distribution of Downlink radio interface User Throughput per cell on coding schemes
Short Name: (a) UserDataUmCellULCSDistr
(b) UserDataUmCellDLCSDistr
Description : This indicator provides the distribution of the user data throughput on the radio interface on Coding Schemes.
The uplink and downlink directions are considered separately
Use Case During the planning phase of a radio network (i.e. before deployment) the distribution of the user throughput on Coding Schemes is predicted by simulation results. By aid of the presents KPIs these simulation results may be replaced by the experiences of an operating network. This could help e.g. for the planning of future network expansions (capacity enhancements or expansion of the coverage area of the network)
Formula: (a)
13]MUTHRF[1..
MUTHRF[c] str[c]CellULCSDiUserDataUm =
(b) .26]MUTHRF[14.
c]MUTHRF[13 str[c]CellDLCSDiUserDataUm
+=
With parameter c for the observed coding scheme:
c = 1 coding scheme CS1
c = 2 coding scheme CS2
c = 3 coding scheme CS4
c = 4 coding scheme CS5
c = 5 coding scheme MCS1
c = 6 coding scheme MCS2
c = 7 coding scheme MCS3
c = 8 coding scheme MCS4
c = 9 coding scheme MCS5
c = 10 coding scheme MCS6
c = 11 coding scheme MCS7
c = 12 coding scheme MCS8
c = 13 coding scheme MCS9
Used param.: MUTHRF[all],
Elem. Object: Cell
Unit: none

Information PM: SBS Key Performance Indicators System
173 A50016-G5100-A042-1-7618
Remark: Remarks
In DL directions the retransmission is included in MUTHRF[14 .. 26] but in UL direction the retransmission is excluded from MUTHRF[1.. 13]. For simplicity it is assumed that the throughput distribution on coding schemes is mainly independent from the inclusion or exclusion of retransmissions.
18.3.4 Timely distribution of the coding scheme utilization on the radio interface
Long Name: (a) Timely distribution of the coding scheme utilization in uplink direction per cell
(b) Timely distribution of the coding scheme utilization in downlink direction per cell
Short Name: (a) CSDistrCellUL
(b) CSDistrCellDL
Description : This indicator provides the timely distribution of the utilization of the various coding schemes during the observed granularity period
The uplink and downlink directions are considered separately
Use Case During the planning phase of a radio network (i.e. before deployment) the distribution of the user data transmission on Coding Schemes is predicted by simulation results. By aid of the presents KPIs these simulation results may be replaced by the experiences of an operating network. This could help e.g. for the planning of future network expansions (capacity enhancements or expansion of the coverage area of the network)
Formula: (a)
13] 1.. NTRAPDU[1*½ 10] .. NTRAPDU[1
NTRAPDU[c] lUL[c]CSDistrCel
+=
for c = 1 .. 10
13] 1.. NTRAPDU[1*½ 10] .. NTRAPDU[1
NTRAPDU[c] *½ lUL[c]CSDistrCel
+=
for c = 11 .. 13
(b) 26] ..NTRAPDU[24*½ 23] .. NTRAPDU[14
13]NTRAPDU[c lDL[c]CSDistrCel
+
+=
for c = 1 .. 10
26] ..NTRAPDU[24*½ 23] .. NTRAPDU[14
13]NTRAPDU[c *½ lDL[c]CSDistrCel
+
+=
for c = 11 .. 13
With parameter c for the observed coding scheme:
c = 1 coding scheme CS1
c = 2 coding scheme CS2
c = 3 coding scheme CS4
c = 4 coding scheme CS5
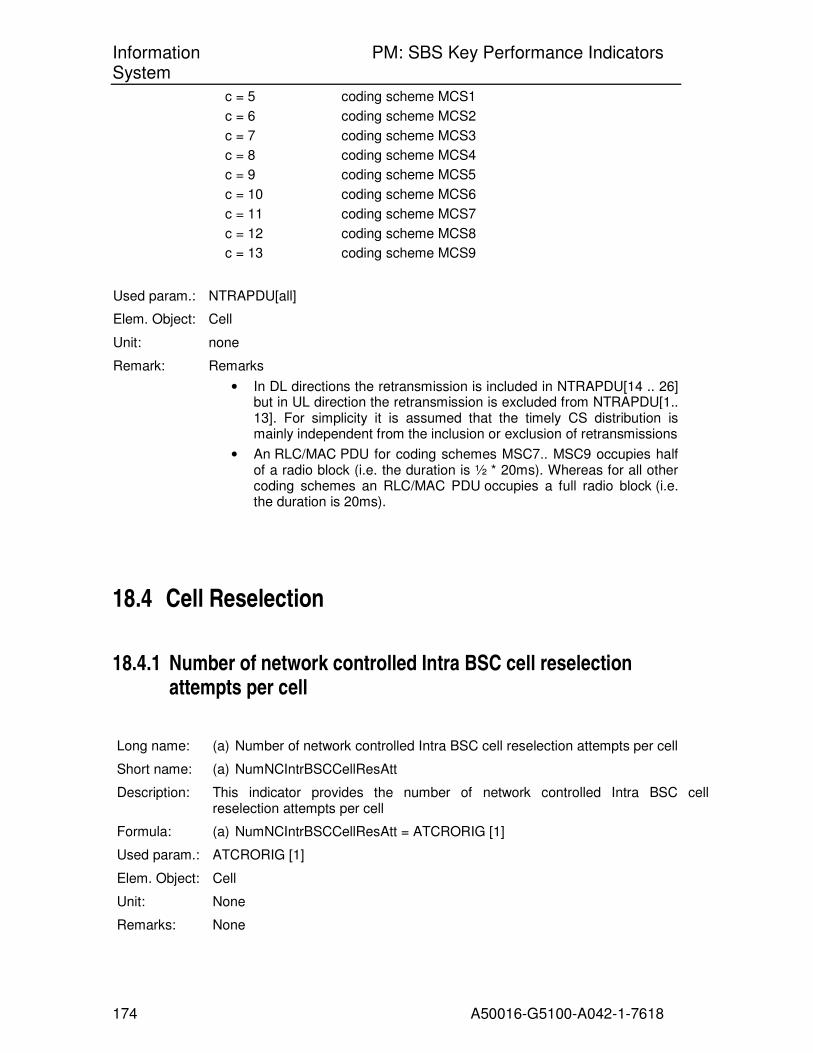
Information PM: SBS Key Performance Indicators System
174 A50016-G5100-A042-1-7618
c = 5 coding scheme MCS1
c = 6 coding scheme MCS2
c = 7 coding scheme MCS3
c = 8 coding scheme MCS4
c = 9 coding scheme MCS5
c = 10 coding scheme MCS6
c = 11 coding scheme MCS7
c = 12 coding scheme MCS8
c = 13 coding scheme MCS9
Used param.: NTRAPDU[all]
Elem. Object: Cell
Unit: none
Remark: Remarks
• In DL directions the retransmission is included in NTRAPDU[14 .. 26] but in UL direction the retransmission is excluded from NTRAPDU[1.. 13]. For simplicity it is assumed that the timely CS distribution is mainly independent from the inclusion or exclusion of retransmissions
• An RLC/MAC PDU for coding schemes MSC7.. MSC9 occupies half of a radio block (i.e. the duration is ½ * 20ms). Whereas for all other coding schemes an RLC/MAC PDU occupies a full radio block (i.e. the duration is 20ms).
18.4 Cell Reselection
18.4.1 Number of network controlled Intra BSC cell reselection attempts per cell
Long name: (a) Number of network controlled Intra BSC cell reselection attempts per cell
Short name: (a) NumNCIntrBSCCellResAtt
Description: This indicator provides the number of network controlled Intra BSC cell reselection attempts per cell
Formula: (a) NumNCIntrBSCCellResAtt = ATCRORIG [1]
Used param.: ATCRORIG [1]
Elem. Object: Cell
Unit: None
Remarks: None
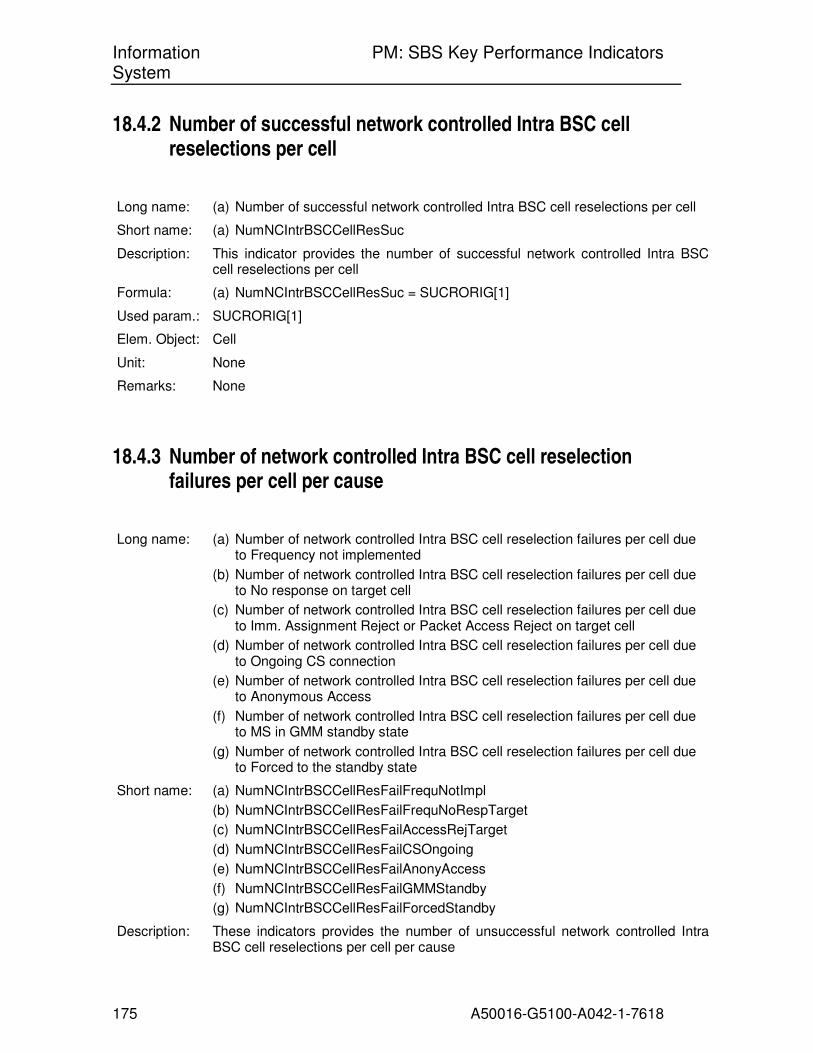
Information PM: SBS Key Performance Indicators System
175 A50016-G5100-A042-1-7618
18.4.2 Number of successful network controlled Intra BSC cell reselections per cell
Long name: (a) Number of successful network controlled Intra BSC cell reselections per cell
Short name: (a) NumNCIntrBSCCellResSuc
Description: This indicator provides the number of successful network controlled Intra BSC cell reselections per cell
Formula: (a) NumNCIntrBSCCellResSuc = SUCRORIG[1]
Used param.: SUCRORIG[1]
Elem. Object: Cell
Unit: None
Remarks: None
18.4.3 Number of network controlled Intra BSC cell reselection failures per cell per cause
Long name: (a) Number of network controlled Intra BSC cell reselection failures per cell due to Frequency not implemented
(b) Number of network controlled Intra BSC cell reselection failures per cell due to No response on target cell
(c) Number of network controlled Intra BSC cell reselection failures per cell due to Imm. Assignment Reject or Packet Access Reject on target cell
(d) Number of network controlled Intra BSC cell reselection failures per cell due to Ongoing CS connection
(e) Number of network controlled Intra BSC cell reselection failures per cell due to Anonymous Access
(f) Number of network controlled Intra BSC cell reselection failures per cell due to MS in GMM standby state
(g) Number of network controlled Intra BSC cell reselection failures per cell due to Forced to the standby state
Short name: (a) NumNCIntrBSCCellResFailFrequNotImpl
(b) NumNCIntrBSCCellResFailFrequNoRespTarget
(c) NumNCIntrBSCCellResFailAccessRejTarget
(d) NumNCIntrBSCCellResFailCSOngoing
(e) NumNCIntrBSCCellResFailAnonyAccess
(f) NumNCIntrBSCCellResFailGMMStandby
(g) NumNCIntrBSCCellResFailForcedStandby
Description: These indicators provides the number of unsuccessful network controlled Intra BSC cell reselections per cell per cause

Information PM: SBS Key Performance Indicators System
176 A50016-G5100-A042-1-7618
Formula: (a) NumNCIntrBSCCellResFailFrequNotImpl = UNCRORIG [1]
(b) NumNCIntrBSCCellResFailFrequNoRespTarget = UNCRORIG [2]
(c) NumNCIntrBSCCellResFailAccessRejTarget = UNCRORIG [3]
(d) NumNCIntrBSCCellResFailCSOngoing = UNCRORIG [4]
(e) NumNCIntrBSCCellResFailAnonyAccess = UNCRORIG S [5]
(f) NumNCIntrBSCCellResFailGMMStandby = UNCRORIG [6]
(g) NumNCIntrBSCCellResFailForcedStandby = UNCRORIG [7]
Used param.: UNCRORIG [all]
Elem. Object: Cell
Unit: None
Remarks: None
18.4.4 Network controlled Intra BSC cell reselection success rate
Long name: (a) Success rate for network controlled Intra BSC cell reselections
Short name: (a) NCIntrBSCCellSucRate
Description: This indicator provides the success rate for network controlled Intra BSC cell reselection per cell
Formula: (a)
]9,1[ATCRORIG
]3,1[SUCRORIGellSucRateNCIntrBSCC =
Used param.: SUCRORIG[1], ATCRORIG [1]
Elem. Object: Cell
Unit: None
Remarks: None
18.4.5 Network controlled Intra BSC cell reselection failure rate
Long name: (a) Network controlled Intra BSC cell reselection failure rate for cause Frequency not implemented
(b) Network controlled Intra BSC cell reselection failure rate for cause No response on target cell
(c) Network controlled Intra BSC cell reselection failure rate for cause Imm. Assignment Reject or Packet Access Reject on target cell
(d) Network controlled Intra BSC cell reselection failure rate for cause Ongoing CS connection
(e) Network controlled Intra BSC cell reselection failure rate for cause MS in GMM standby state
(f) Network controlled Intra BSC cell reselection failure rate for cause Forced to
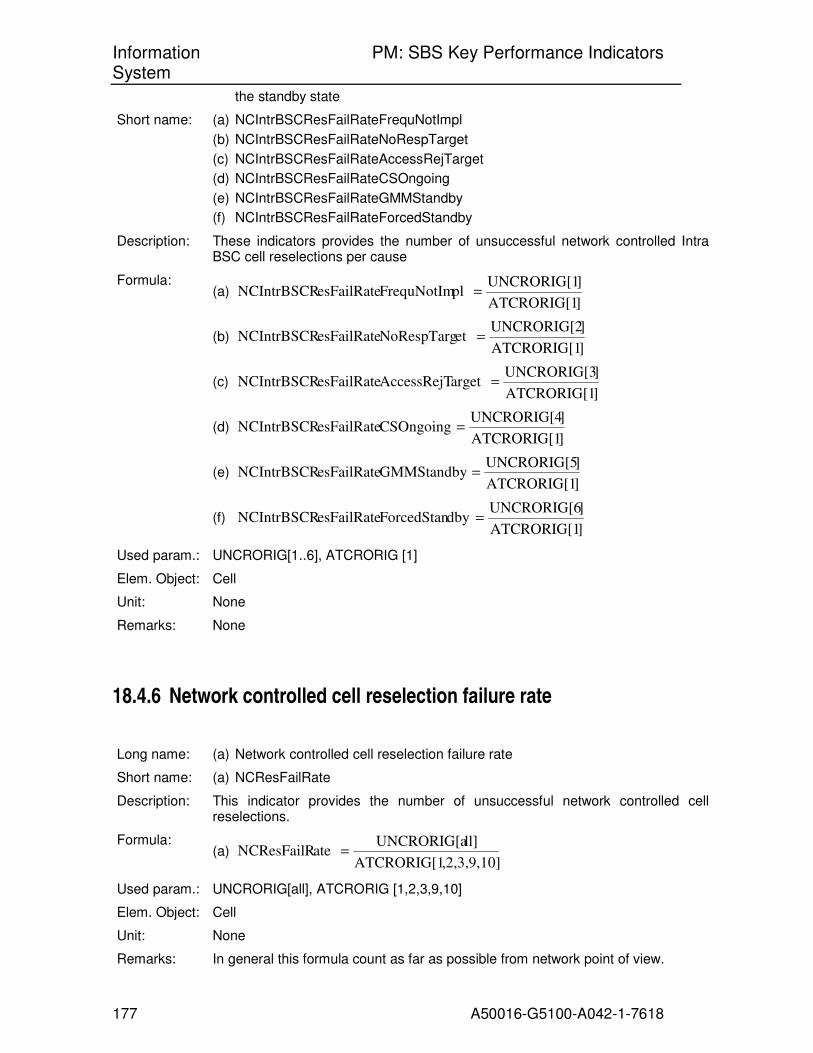
Information PM: SBS Key Performance Indicators System
177 A50016-G5100-A042-1-7618
the standby state
Short name: (a) NCIntrBSCResFailRateFrequNotImpl
(b) NCIntrBSCResFailRateNoRespTarget
(c) NCIntrBSCResFailRateAccessRejTarget
(d) NCIntrBSCResFailRateCSOngoing
(e) NCIntrBSCResFailRateGMMStandby
(f) NCIntrBSCResFailRateForcedStandby
Description: These indicators provides the number of unsuccessful network controlled Intra BSC cell reselections per cause
Formula: (a)
]ATCRORIG[1
]UNCRORIG[1 plFrequNotImesFailRateNCIntrBSCR =
(b) ]ATCRORIG[1
]UNCRORIG[2et NoRespTargesFailRateNCIntrBSCR =
(c) ]ATCRORIG[1
]UNCRORIG[3arget AccessRejTesFailRateNCIntrBSCR =
(d) ]ATCRORIG[1
]UNCRORIG[4 CSOngoingesFailRateNCIntrBSCR =
(e) ]ATCRORIG[1
]UNCRORIG[5 GMMStandbyesFailRateNCIntrBSCR =
(f) ]ATCRORIG[1
]UNCRORIG[6dby ForcedStanesFailRateNCIntrBSCR =
Used param.: UNCRORIG[1..6], ATCRORIG [1]
Elem. Object: Cell
Unit: None
Remarks: None
18.4.6 Network controlled cell reselection failure rate
Long name: (a) Network controlled cell reselection failure rate
Short name: (a) NCResFailRate
Description: This indicator provides the number of unsuccessful network controlled cell reselections.
Formula: (a)
,2,3,9,10]ATCRORIG[1
ll]UNCRORIG[a ateNCResFailR =
Used param.: UNCRORIG[all], ATCRORIG [1,2,3,9,10]
Elem. Object: Cell
Unit: None
Remarks: In general this formula count as far as possible from network point of view.
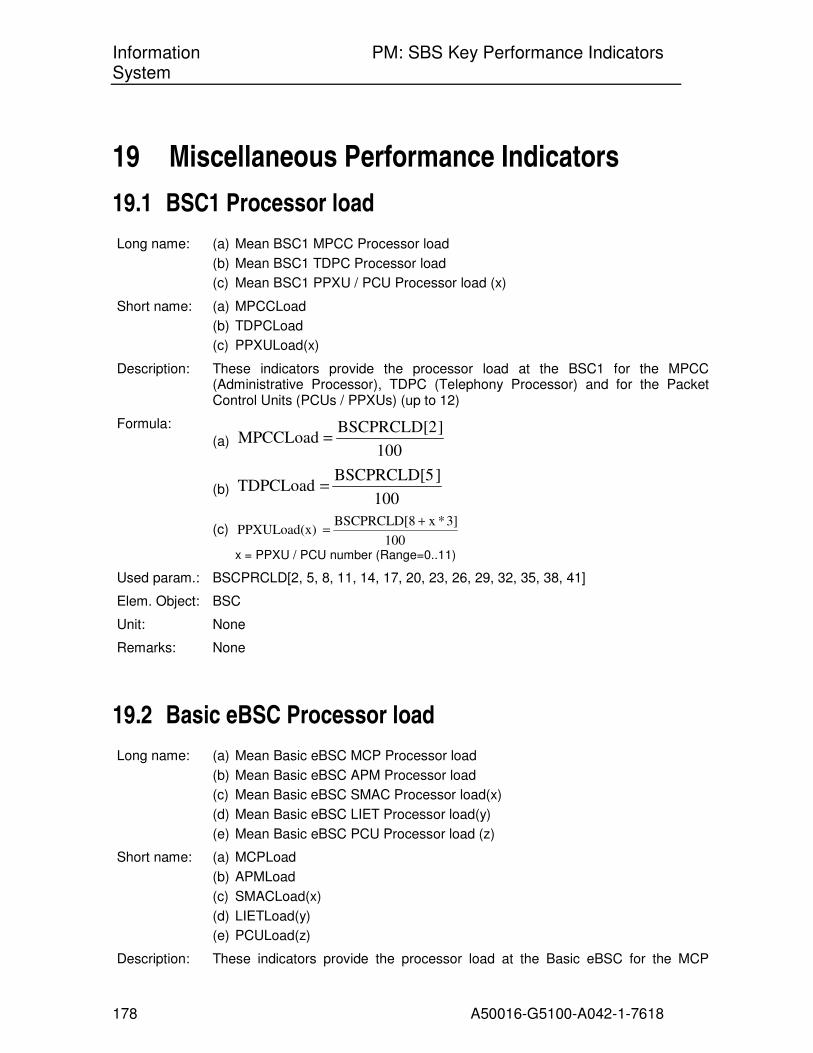
Information PM: SBS Key Performance Indicators System
178 A50016-G5100-A042-1-7618
19 Miscellaneous Performance Indicators
19.1 BSC1 Processor load
Long name: (a) Mean BSC1 MPCC Processor load
(b) Mean BSC1 TDPC Processor load
(c) Mean BSC1 PPXU / PCU Processor load (x)
Short name: (a) MPCCLoad
(b) TDPCLoad
(c) PPXULoad(x)
Description: These indicators provide the processor load at the BSC1 for the MPCC (Administrative Processor), TDPC (Telephony Processor) and for the Packet Control Units (PCUs / PPXUs) (up to 12)
Formula:
(a) 100
]BSCPRCLD[2 MPCCLoad =
(b) 100
]BSCPRCLD[5 TDPCLoad =
(c) 100
3] *x BSCPRCLD[8 )PPXULoad(x
+=
x = PPXU / PCU number (Range=0..11)
Used param.: BSCPRCLD[2, 5, 8, 11, 14, 17, 20, 23, 26, 29, 32, 35, 38, 41]
Elem. Object: BSC
Unit: None
Remarks: None
19.2 Basic eBSC Processor load
Long name: (a) Mean Basic eBSC MCP Processor load
(b) Mean Basic eBSC APM Processor load
(c) Mean Basic eBSC SMAC Processor load(x)
(d) Mean Basic eBSC LIET Processor load(y)
(e) Mean Basic eBSC PCU Processor load (z)
Short name: (a) MCPLoad
(b) APMLoad
(c) SMACLoad(x)
(d) LIETLoad(y)
(e) PCULoad(z)
Description: These indicators provide the processor load at the Basic eBSC for the MCP
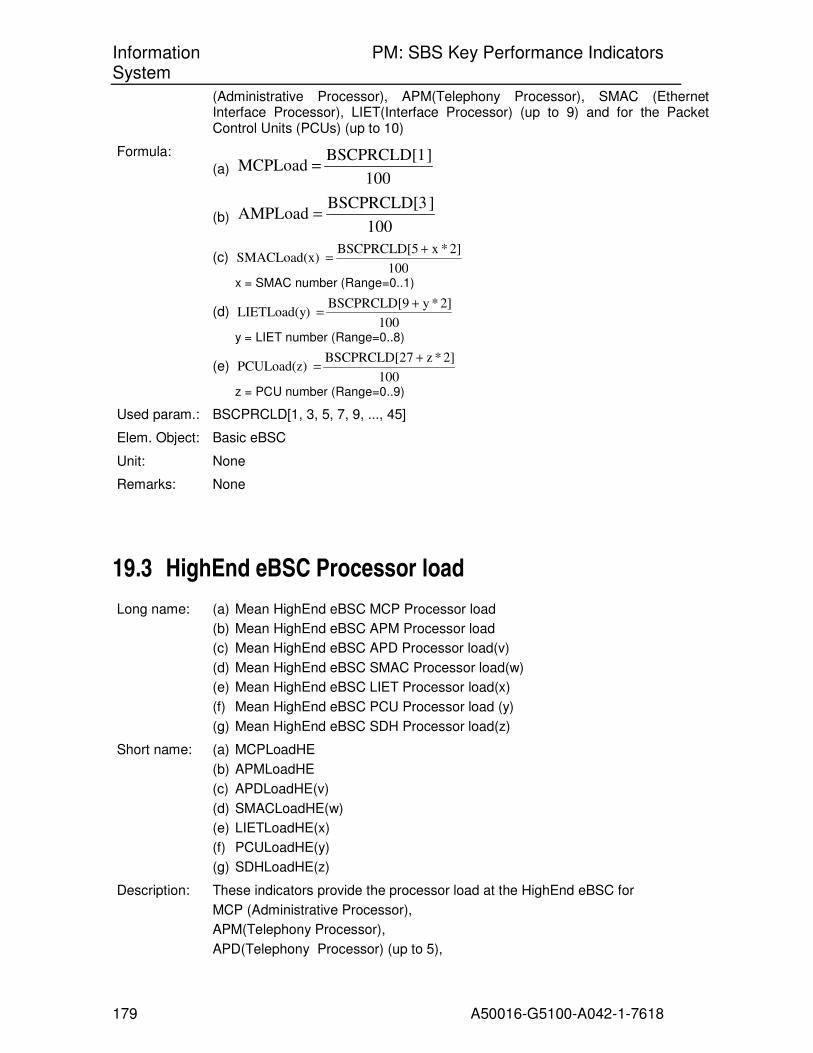
Information PM: SBS Key Performance Indicators System
179 A50016-G5100-A042-1-7618
(Administrative Processor), APM(Telephony Processor), SMAC (Ethernet Interface Processor), LIET(Interface Processor) (up to 9) and for the Packet Control Units (PCUs) (up to 10)
Formula:
(a) 100
]BSCPRCLD[1 MCPLoad =
(b) 100
]BSCPRCLD[3 AMPLoad =
(c) 100
2] *x BSCPRCLD[5 )SMACLoad(x
+=
x = SMAC number (Range=0..1)
(d) 100
2] *y BSCPRCLD[9 )LIETLoad(y
+=
y = LIET number (Range=0..8)
(e) 100
2] * z7BSCPRCLD[2 PCULoad(z)
+=
z = PCU number (Range=0..9)
Used param.: BSCPRCLD[1, 3, 5, 7, 9, ..., 45]
Elem. Object: Basic eBSC
Unit: None
Remarks: None
19.3 HighEnd eBSC Processor load
Long name: (a) Mean HighEnd eBSC MCP Processor load
(b) Mean HighEnd eBSC APM Processor load
(c) Mean HighEnd eBSC APD Processor load(v)
(d) Mean HighEnd eBSC SMAC Processor load(w)
(e) Mean HighEnd eBSC LIET Processor load(x)
(f) Mean HighEnd eBSC PCU Processor load (y)
(g) Mean HighEnd eBSC SDH Processor load(z)
Short name: (a) MCPLoadHE
(b) APMLoadHE
(c) APDLoadHE(v)
(d) SMACLoadHE(w)
(e) LIETLoadHE(x)
(f) PCULoadHE(y)
(g) SDHLoadHE(z)
Description: These indicators provide the processor load at the HighEnd eBSC for
MCP (Administrative Processor),
APM(Telephony Processor),
APD(Telephony Processor) (up to 5),

Information PM: SBS Key Performance Indicators System
180 A50016-G5100-A042-1-7618
SMAC (Ethernet Interface Processor) (up to 4),
LIET(Interface Processor) (up to 9)
Packet Control Units (PCUs) (up to 24 slots)
and for the SDH (STM1 Interface Processor) (up to 4)
Formula:
(a) 100
]BSCPRCLD[1 MCPLoadHE =
(b) 100
]BSCPRCLD[3 AMPLoadHE =
(c) 100
2] * vBSCPRCLD[5 v)APDLoadHE(
+=
x = APD number (Range=0..4)
(d) 100
2] * w5BSCPRCLD[1 (w)SMACLoadHE
+=
w = SMAC number (Range=0..3)
(e) 100
2] *x 3BSCPRCLD[2 (x)LIETLoadHE
+=
x = LIET number (Range=0..8)
(f) 100
2] *y 1BSCPRCLD[4 y)PCULoadHE(
+=
y = PCU slot number (Range=0..23)
(g) 100
2] * z9BSCPRCLD[8 z)SDHLoadHE(
+=
z = SDH number (Range=0..3)
Used param.: BSCPRCLD[1, 3, 5, 7, 9, ..., 95]
Elem. Object: HighEnd eBSC
Unit: None
Remarks: None
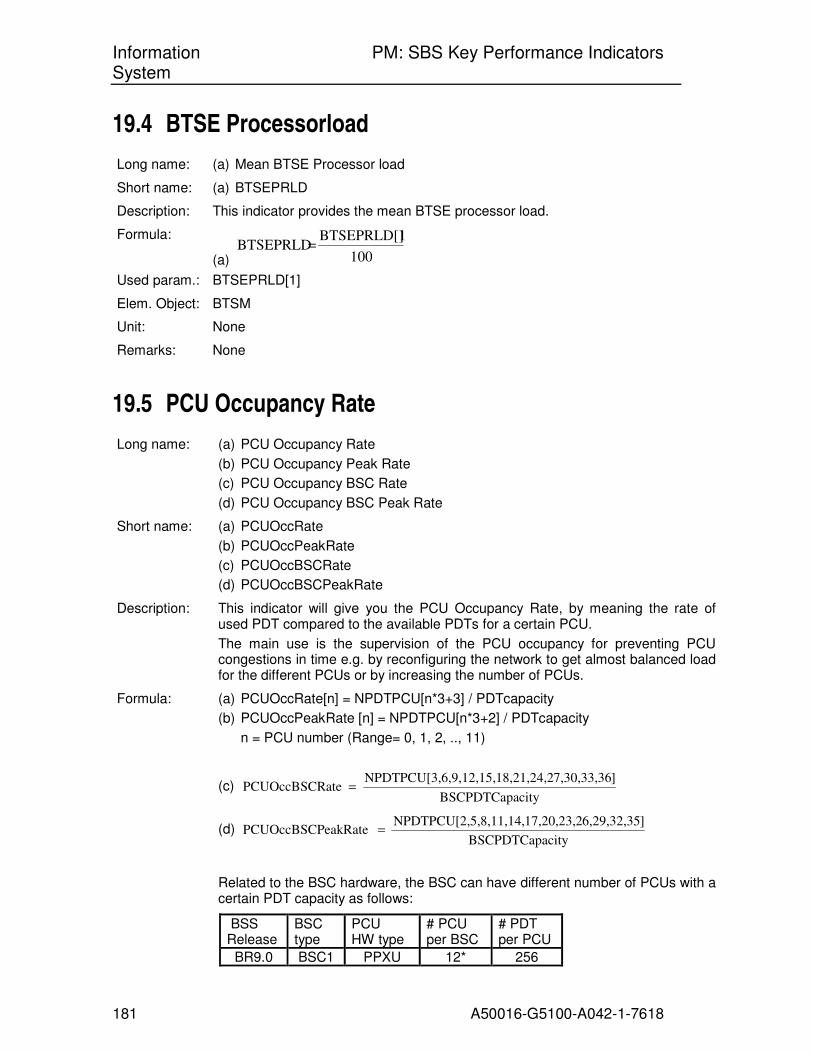
Information PM: SBS Key Performance Indicators System
181 A50016-G5100-A042-1-7618
19.4 BTSE Processorload
Long name: (a) Mean BTSE Processor load
Short name: (a) BTSEPRLD
Description: This indicator provides the mean BTSE processor load.
Formula:
(a) 100
]BTSEPRLD[1 BTSEPRLD=
Used param.: BTSEPRLD[1]
Elem. Object: BTSM
Unit: None
Remarks: None
19.5 PCU Occupancy Rate
Long name: (a) PCU Occupancy Rate
(b) PCU Occupancy Peak Rate
(c) PCU Occupancy BSC Rate
(d) PCU Occupancy BSC Peak Rate
Short name: (a) PCUOccRate
(b) PCUOccPeakRate
(c) PCUOccBSCRate
(d) PCUOccBSCPeakRate
Description: This indicator will give you the PCU Occupancy Rate, by meaning the rate of used PDT compared to the available PDTs for a certain PCU.
The main use is the supervision of the PCU occupancy for preventing PCU congestions in time e.g. by reconfiguring the network to get almost balanced load for the different PCUs or by increasing the number of PCUs.
Formula: (a) PCUOccRate[n] = NPDTPCU[n*3+3] / PDTcapacity
(b) PCUOccPeakRate [n] = NPDTPCU[n*3+2] / PDTcapacity
n = PCU number (Range= 0, 1, 2, .., 11)
(c) cityBSCPDTCapa
]7,30,33,3618,21,24,26,9,12,15,NPDTPCU[3, atePCUOccBSCR =
(d) cityBSCPDTCapa
]6,29,32,3517,20,23,25,8,11,14,NPDTPCU[2, eakRatePCUOccBSCP =
Related to the BSC hardware, the BSC can have different number of PCUs with a certain PDT capacity as follows:
BSS Release
BSC type
PCU HW type
# PCU per BSC
# PDT per PCU
BR9.0 BSC1 PPXU 12* 256
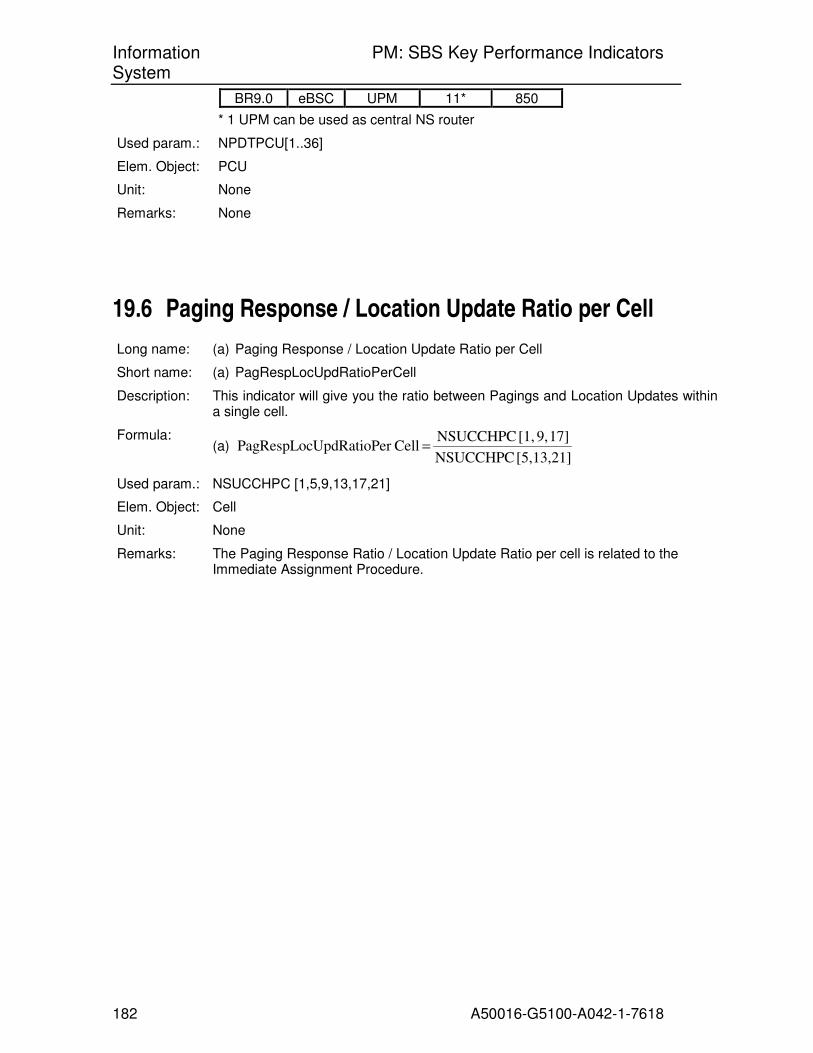
Information PM: SBS Key Performance Indicators System
182 A50016-G5100-A042-1-7618
BR9.0 eBSC UPM 11* 850
* 1 UPM can be used as central NS router
Used param.: NPDTPCU[1..36]
Elem. Object: PCU
Unit: None
Remarks: None
19.6 Paging Response / Location Update Ratio per Cell
Long name: (a) Paging Response / Location Update Ratio per Cell
Short name: (a) PagRespLocUpdRatioPerCell
Description: This indicator will give you the ratio between Pagings and Location Updates within a single cell.
Formula: (a)
[5,13,21] NSUCCHPC
17] 9, [1, NSUCCHPC Cellr UpdRatioPePagRespLoc =
Used param.: NSUCCHPC [1,5,9,13,17,21]
Elem. Object: Cell
Unit: None
Remarks: The Paging Response Ratio / Location Update Ratio per cell is related to the Immediate Assignment Procedure.

Information PM: SBS Key Performance Indicators System
183 A50016-G5100-A042-1-7618
19.7 BSC <-> MSC/SMLC CCS7 Load
Long name: (a) BSC -> MSC CCS7 Load
(b) MSC -> BSC CCS7 Load
(c) Total BSC <-> MSC CCS7 Load
Short name: (a) Y_BSC->MSC
(b) Y_MSC->BSC
(c) Y_BSC<->BSC
Description: Approximate load on the Link Set between BSC and MSC, which were caused of MSUs sent by BSC, vice versa and total.
Formula: (a) Erl
ssbyteGRAN
MinLengthMSUNMSUTRASMSCBSCY
60/8000
1_]1[_
⋅⋅
⋅∅⋅=>−
(b) ErlssbyteGRAN
MinLengthMSUNMSURECBSCMSCY
60/8000
1_]1[_
⋅⋅
⋅∅⋅=>−
(c) Erl 2
BSCY_MSC- MSCY_BSC- MSC-Y_BSC
>+>=><
Used param.: NMSUTRAS[1], NMSUREC[1], Granularity in minutes
Elem. Object: Cell
Unit: Erlang
Remarks: ∅MSU_Length: Average length of a MSU. This value cannot be measured with the existing scanners. An assumption has to be made with the help of traffic models. At the present message structure the MSU has an average length about 35byte. With introduction or extension of services (for example SMS) this value will increase in future.
19.8 Frame Relay Link Utilization
Long name: (a) FRL Utilization
Short name: (a) FRLUtil
Description: This indicator will give you the Frame Relay Link Utilization on the Gb interface by meaning of the carried Frame Relay data per NSVC.
Formula: (a) FRLUtil = MFRLDATA [1,2] / Capacity FRL
Capacity FRL: The FRL is an n X 64 kbit/s physical channel, created over a PCM line, represented by PCMG/PCMA objects.
Used param.: MFRLDATA [all]
Elem. Object: NSVC
Unit: kbit/s
Remarks: None

Information PM: SBS Key Performance Indicators System
184 A50016-G5100-A042-1-7618
19.9 ARP-type Receiver Penetration
Long name: (a) ARP-type Receiver Penetration Rate
Short name: (a) ARPPenetrationRate
Description: This indicator will give you the penetration of Advance Receiver Performance (ARP) - type receiver and conventional receiver.
Formula: (a)
[1,2] SUCTCHSE
1,2]SUCTCHARP[tionRateARPPenetra =
Used param.: SUCTCHARP[1,2], SUCTCHSE[1,2]
Elem. Object: cell
Unit: none
Remarks: ARP-type receivers will be a synonym for Single Antenna Interference Cancellation (SAIC) – type receivers.
20 BSS related KPIs at Siemens MSC At the Siemens MSC/VLR it is also possible to start the following measurement jobs for BSS specific measurements:
• REC INTCELL: BSS specific measurements per cell,
• REC LOCAREA: BSS specific measurements per Location Area,
• RECMSC: MSC and BSS specific measurements per MSC.
With the above Siemens performance measurements it is possible to evaluate at least the following key performance indicators:
• Location Update Success Rate per Location Area,
• Paging Success Rate per Location Area,
• Paging Ratio / Location Update Ratio per Location Area,
• Handover Failures per Cell,
• Handover Successes per Cell,
• Dropped Calls per Cell,
• Call Setup Failures per Cell,
• Assignment Failures per Cell,
• TCH Requests per Cell,
Information PM: SBS Key Performance Indicators System
185 A50016-G5100-A042-1-7618
• Busy Hour Call Attempts (BHCA) per MSC,
• Mean Holding Time per MSC,
• MOC / MTC / MTM distribution.
For more information please refer to the SSS customer documentation.

Information PM: SBS Key Performance Indicators System
186 A50016-G5100-A042-1-7618
21 Appendix
21.1 List of BSS Performance Measurements
Short Name Long Name
AALTCHTI All available TCH allocated time ABISPDIS Abis Pool Distribution ABISPSUP Abis Pool Supervision ACADMCDMA Number of Calls Admitted on the DMA Layer ACREJCDMA Number of Calls Rejected on the DMA Layer AININIRH Attempted incoming internal intercell Handovers per originating cell AISHINTE Attempted Internal SDCCH Handovers Intercell
AISHINTR Attempted internal SDCCH Handovers Intracell AMRCHDIS Adaptive Multirate channel type uplink/downlink distribution AMRFRMDL Frame measurements for Adaptive Multi-Rate (AMR) on uplink busy
TCHs’ AMRFRMUL Frame measurements for Adaptive Multi-Rate (AMR) on downlink busy
TCHs’ AMRSIDUL SID_UPDATE frame measurements for Adaptive Multi-Rate (AMR) on
uplink busy TCHs’ AMRVAR Voice Activity Rate for Adaptive Multi-Rate (AMR) on uplink/downlink
busy TCHs’ AOINTESH Attempted MSC controlled SDCCH Handovers
AOUINIRH Attempted outgoing intercell Handovers per cause, per neigh-bourcell relationship
ARPAPDAS Number Of Attempted PDCH Assignments (UP/DL) with ARP priority ARPSPDAS Number Of Successful PDCH Assignments (UP/DL) with ARP priority ASDCALTI All available SDCCH allocated time ATCHSMBS Attempted TCH seizures meeting a TCH blocked state (Full-
rate/Halfrate) ATCRORIG Attempted network supported cell reselections per cause. ATDTMREQ Number of attempts to establish a DTM (UL/DL) per Cell ATIMASCA Attempted immediate assignment procedures, per cause ATINBHDO Attempted outgoing inter BSC Handovers per neighbour cell re-
lationship ATINHIAC Attempted internal Handovers, intracell, per cause
ATINHIRC Attempted internal Handovers, intercell, per cause ATOISHDO Attempted Outgoing Intersystem Handover per neighbourcell per cause
ATSDCMBS Attempted SDCCH seizure meeting an SDCCH blocked state ATTCHSEI Attempted TCH seizures (Fullrate/Halfrate)
BSCPRCLD BSC processor load BTSEPRLD BTSE processor load CFERRXQU Correlated FER to RXQUAL measurements
CHALNHLY Number of Channel Allocation Requests Not Served in the Highest Layer or at all
CNSPRCLD Central NS functionality load CRXLVQUD Correlated RXLEV to RXQUAL measurements (downlink)
CRXLVQUU Correlated RXLEV to RXQUAL measurements (uplink)
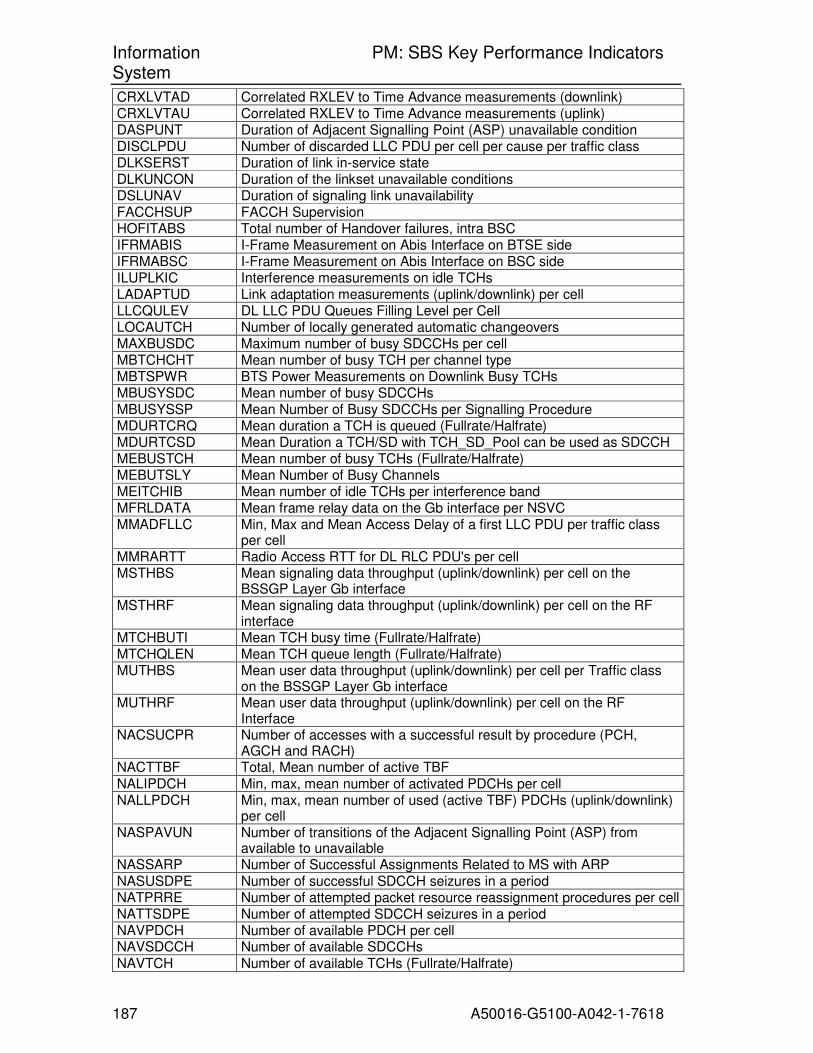
Information PM: SBS Key Performance Indicators System
187 A50016-G5100-A042-1-7618
CRXLVTAD Correlated RXLEV to Time Advance measurements (downlink) CRXLVTAU Correlated RXLEV to Time Advance measurements (uplink) DASPUNT Duration of Adjacent Signalling Point (ASP) unavailable condition DISCLPDU Number of discarded LLC PDU per cell per cause per traffic class DLKSERST Duration of link in-service state DLKUNCON Duration of the linkset unavailable conditions DSLUNAV Duration of signaling link unavailability FACCHSUP FACCH Supervision HOFITABS Total number of Handover failures, intra BSC IFRMABIS I-Frame Measurement on Abis Interface on BTSE side IFRMABSC I-Frame Measurement on Abis Interface on BSC side ILUPLKIC Interference measurements on idle TCHs LADAPTUD Link adaptation measurements (uplink/downlink) per cell LLCQULEV DL LLC PDU Queues Filling Level per Cell LOCAUTCH Number of locally generated automatic changeovers MAXBUSDC Maximum number of busy SDCCHs per cell MBTCHCHT Mean number of busy TCH per channel type MBTSPWR BTS Power Measurements on Downlink Busy TCHs MBUSYSDC Mean number of busy SDCCHs MBUSYSSP Mean Number of Busy SDCCHs per Signalling Procedure MDURTCRQ Mean duration a TCH is queued (Fullrate/Halfrate) MDURTCSD Mean Duration a TCH/SD with TCH_SD_Pool can be used as SDCCH MEBUSTCH Mean number of busy TCHs (Fullrate/Halfrate) MEBUTSLY Mean Number of Busy Channels MEITCHIB Mean number of idle TCHs per interference band MFRLDATA Mean frame relay data on the Gb interface per NSVC MMADFLLC Min, Max and Mean Access Delay of a first LLC PDU per traffic class
per cell MMRARTT Radio Access RTT for DL RLC PDU's per cell MSTHBS Mean signaling data throughput (uplink/downlink) per cell on the
BSSGP Layer Gb interface MSTHRF Mean signaling data throughput (uplink/downlink) per cell on the RF
interface MTCHBUTI Mean TCH busy time (Fullrate/Halfrate) MTCHQLEN Mean TCH queue length (Fullrate/Halfrate) MUTHBS Mean user data throughput (uplink/downlink) per cell per Traffic class
on the BSSGP Layer Gb interface MUTHRF Mean user data throughput (uplink/downlink) per cell on the RF
Interface NACSUCPR Number of accesses with a successful result by procedure (PCH,
AGCH and RACH) NACTTBF Total, Mean number of active TBF
NALIPDCH Min, max, mean number of activated PDCHs per cell NALLPDCH Min, max, mean number of used (active TBF) PDCHs (uplink/downlink)
per cell NASPAVUN Number of transitions of the Adjacent Signalling Point (ASP) from
available to unavailable NASSARP Number of Successful Assignments Related to MS with ARP
NASUSDPE Number of successful SDCCH seizures in a period NATPRRE Number of attempted packet resource reassignment procedures per cell NATTSDPE Number of attempted SDCCH seizures in a period NAVPDCH Number of available PDCH per cell NAVSDCCH Number of available SDCCHs
NAVTCH Number of available TCHs (Fullrate/Halfrate)
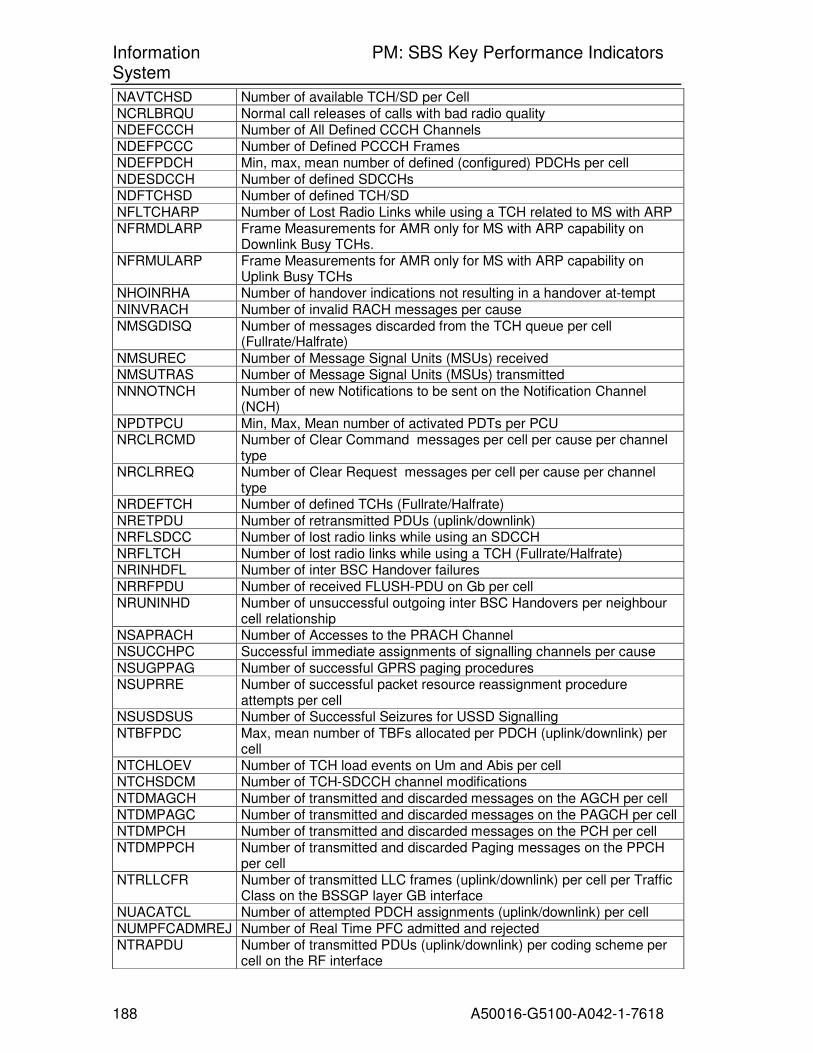
Information PM: SBS Key Performance Indicators System
188 A50016-G5100-A042-1-7618
NAVTCHSD Number of available TCH/SD per Cell NCRLBRQU Normal call releases of calls with bad radio quality NDEFCCCH Number of All Defined CCCH Channels
NDEFPCCC Number of Defined PCCCH Frames
NDEFPDCH Min, max, mean number of defined (configured) PDCHs per cell NDESDCCH Number of defined SDCCHs NDFTCHSD Number of defined TCH/SD NFLTCHARP Number of Lost Radio Links while using a TCH related to MS with ARP NFRMDLARP Frame Measurements for AMR only for MS with ARP capability on
Downlink Busy TCHs. NFRMULARP Frame Measurements for AMR only for MS with ARP capability on
Uplink Busy TCHs NHOINRHA Number of handover indications not resulting in a handover at-tempt NINVRACH Number of invalid RACH messages per cause
NMSGDISQ Number of messages discarded from the TCH queue per cell (Fullrate/Halfrate)
NMSUREC Number of Message Signal Units (MSUs) received NMSUTRAS Number of Message Signal Units (MSUs) transmitted
NNNOTNCH Number of new Notifications to be sent on the Notification Channel (NCH)
NPDTPCU Min, Max, Mean number of activated PDTs per PCU NRCLRCMD Number of Clear Command messages per cell per cause per channel
type NRCLRREQ Number of Clear Request messages per cell per cause per channel
type NRDEFTCH Number of defined TCHs (Fullrate/Halfrate)
NRETPDU Number of retransmitted PDUs (uplink/downlink) NRFLSDCC Number of lost radio links while using an SDCCH
NRFLTCH Number of lost radio links while using a TCH (Fullrate/Halfrate) NRINHDFL Number of inter BSC Handover failures
NRRFPDU Number of received FLUSH-PDU on Gb per cell NRUNINHD Number of unsuccessful outgoing inter BSC Handovers per neighbour
cell relationship NSAPRACH Number of Accesses to the PRACH Channel NSUCCHPC Successful immediate assignments of signalling channels per cause
NSUGPPAG Number of successful GPRS paging procedures NSUPRRE Number of successful packet resource reassignment procedure
attempts per cell NSUSDSUS Number of Successful Seizures for USSD Signalling
NTBFPDC Max, mean number of TBFs allocated per PDCH (uplink/downlink) per cell
NTCHLOEV Number of TCH load events on Um and Abis per cell NTCHSDCM Number of TCH-SDCCH channel modifications
NTDMAGCH Number of transmitted and discarded messages on the AGCH per cell NTDMPAGC Number of transmitted and discarded messages on the PAGCH per cell NTDMPCH Number of transmitted and discarded messages on the PCH per cell NTDMPPCH Number of transmitted and discarded Paging messages on the PPCH
per cell NTRLLCFR Number of transmitted LLC frames (uplink/downlink) per cell per Traffic
Class on the BSSGP layer GB interface NUACATCL Number of attempted PDCH assignments (uplink/downlink) per cell NUMPFCADMREJ Number of Real Time PFC admitted and rejected NTRAPDU Number of transmitted PDUs (uplink/downlink) per coding scheme per
cell on the RF interface
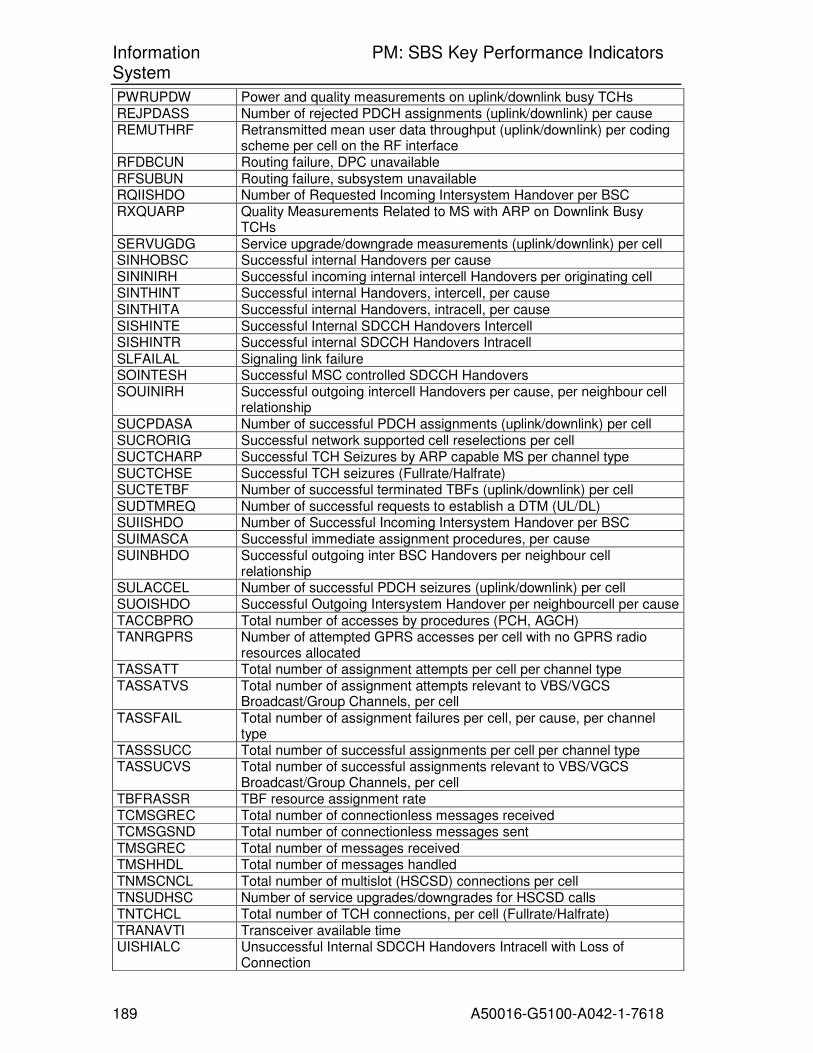
Information PM: SBS Key Performance Indicators System
189 A50016-G5100-A042-1-7618
PWRUPDW Power and quality measurements on uplink/downlink busy TCHs REJPDASS Number of rejected PDCH assignments (uplink/downlink) per cause REMUTHRF Retransmitted mean user data throughput (uplink/downlink) per coding
scheme per cell on the RF interface RFDBCUN Routing failure, DPC unavailable
RFSUBUN Routing failure, subsystem unavailable RQIISHDO Number of Requested Incoming Intersystem Handover per BSC RXQUARP Quality Measurements Related to MS with ARP on Downlink Busy
TCHs
SERVUGDG Service upgrade/downgrade measurements (uplink/downlink) per cell SINHOBSC Successful internal Handovers per cause SININIRH Successful incoming internal intercell Handovers per originating cell SINTHINT Successful internal Handovers, intercell, per cause SINTHITA Successful internal Handovers, intracell, per cause
SISHINTE Successful Internal SDCCH Handovers Intercell SISHINTR Successful internal SDCCH Handovers Intracell
SLFAILAL Signaling link failure SOINTESH Successful MSC controlled SDCCH Handovers SOUINIRH Successful outgoing intercell Handovers per cause, per neighbour cell
relationship SUCPDASA Number of successful PDCH assignments (uplink/downlink) per cell SUCRORIG Successful network supported cell reselections per cell SUCTCHARP Successful TCH Seizures by ARP capable MS per channel type
SUCTCHSE Successful TCH seizures (Fullrate/Halfrate) SUCTETBF Number of successful terminated TBFs (uplink/downlink) per cell
SUDTMREQ Number of successful requests to establish a DTM (UL/DL) SUIISHDO Number of Successful Incoming Intersystem Handover per BSC SUIMASCA Successful immediate assignment procedures, per cause SUINBHDO Successful outgoing inter BSC Handovers per neighbour cell
relationship SULACCEL Number of successful PDCH seizures (uplink/downlink) per cell SUOISHDO Successful Outgoing Intersystem Handover per neighbourcell per cause
TACCBPRO Total number of accesses by procedures (PCH, AGCH) TANRGPRS Number of attempted GPRS accesses per cell with no GPRS radio
resources allocated TASSATT Total number of assignment attempts per cell per channel type
TASSATVS Total number of assignment attempts relevant to VBS/VGCS Broadcast/Group Channels, per cell
TASSFAIL Total number of assignment failures per cell, per cause, per channel type
TASSSUCC Total number of successful assignments per cell per channel type TASSUCVS Total number of successful assignments relevant to VBS/VGCS
Broadcast/Group Channels, per cell TBFRASSR TBF resource assignment rate TCMSGREC Total number of connectionless messages received TCMSGSND Total number of connectionless messages sent
TMSGREC Total number of messages received TMSHHDL Total number of messages handled
TNMSCNCL Total number of multislot (HSCSD) connections per cell TNSUDHSC Number of service upgrades/downgrades for HSCSD calls TNTCHCL Total number of TCH connections, per cell (Fullrate/Halfrate) TRANAVTI Transceiver available time UISHIALC Unsuccessful Internal SDCCH Handovers Intracell with Loss of
Connection
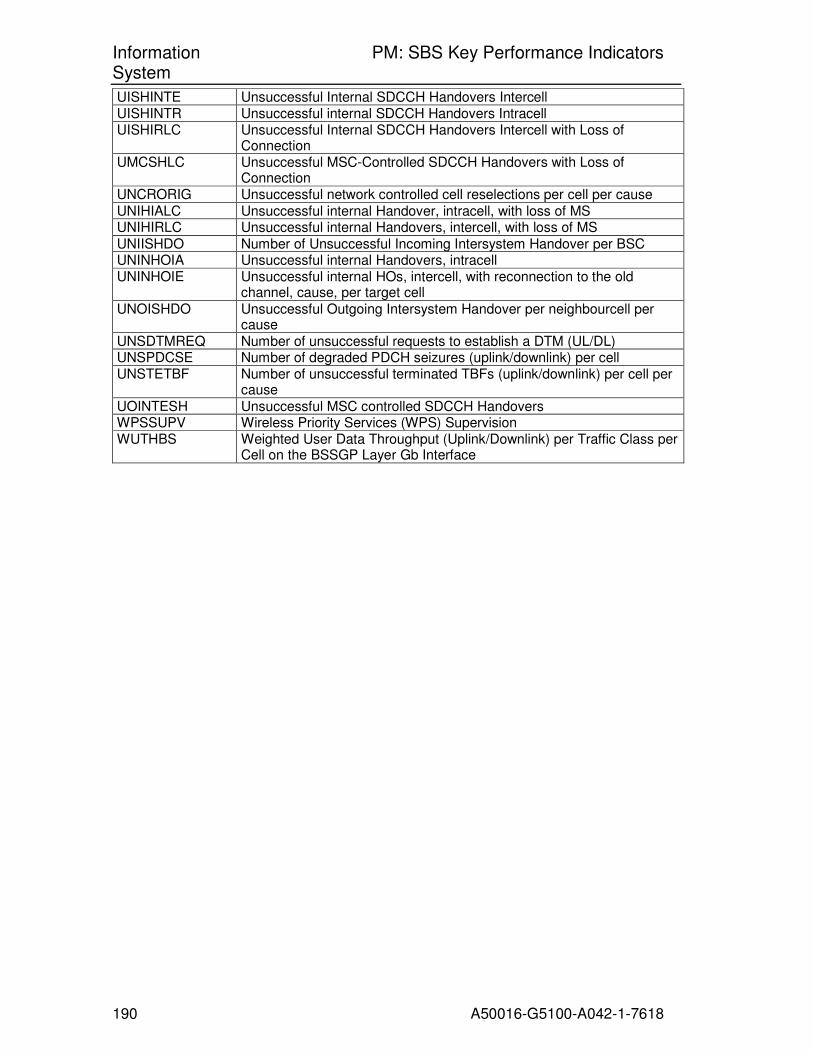
Information PM: SBS Key Performance Indicators System
190 A50016-G5100-A042-1-7618
UISHINTE Unsuccessful Internal SDCCH Handovers Intercell UISHINTR Unsuccessful internal SDCCH Handovers Intracell UISHIRLC Unsuccessful Internal SDCCH Handovers Intercell with Loss of
Connection UMCSHLC Unsuccessful MSC-Controlled SDCCH Handovers with Loss of
Connection UNCRORIG Unsuccessful network controlled cell reselections per cell per cause
UNIHIALC Unsuccessful internal Handover, intracell, with loss of MS UNIHIRLC Unsuccessful internal Handovers, intercell, with loss of MS
UNIISHDO Number of Unsuccessful Incoming Intersystem Handover per BSC UNINHOIA Unsuccessful internal Handovers, intracell UNINHOIE Unsuccessful internal HOs, intercell, with reconnection to the old
channel, cause, per target cell
UNOISHDO Unsuccessful Outgoing Intersystem Handover per neighbourcell per cause
UNSDTMREQ Number of unsuccessful requests to establish a DTM (UL/DL) UNSPDCSE Number of degraded PDCH seizures (uplink/downlink) per cell UNSTETBF Number of unsuccessful terminated TBFs (uplink/downlink) per cell per
cause
UOINTESH Unsuccessful MSC controlled SDCCH Handovers WPSSUPV Wireless Priority Services (WPS) Supervision WUTHBS Weighted User Data Throughput (Uplink/Downlink) per Traffic Class per
Cell on the BSSGP Layer Gb Interface