5.8 air quality - santa barbara county · note: μg/m3 = microgram/cubic meter; ppm = parts per...
TRANSCRIPT

5.8 Air Quality
April 2008 5.8-1 Final EIR
5.8 Air Quality This section describes environmental and regulatory settings related to air quality in the project area, identifies air quality impacts of the proposed project, the alternatives and the cumulative impacts in the area, and lists potential mitigation measures. This section also addresses greenhouse gas emissions associated with the proposed project.
5.8.1 Environmental Setting
5.8.1.1 Regional Overview
The proposed project would be located within the South Central Coast Air Basin (SCCAB) in northwestern Santa Barbara County (SBC). and southwestern San Luis Obispo County. However, no impacts have been identified for facilities in San Luis Obispo County, and therefore only SBC is included in the discussion.SBC has a Mediterranean climate characterized by mild winters, when most rainfall occurs and warm, dry summers. The influence of the Pacific Ocean causes mild temperatures year-round along the coast, while inland areas experience a wider range of temperatures. The mean maximum temperatures between 1979 and 1989 at the Vandenberg Air Force Base (VAFB) Weather Station varied from 60°F to 68°F; the mean minimum was from 45° to 55°F; and the annual mean temperature averaged over that period was 61.8°F. Precipitation is confined primarily to the winter months. Occasionally, tropical air masses result in rainfall during summer months. At the VAFB Weather Station, mean precipitation for the same years ranged from 0.02 inches in July to 14 inches in December. Annual precipitation in the region varies widely over relatively short distances mainly because of topographical effects. The long-term annual total precipitation along the north coast is approximately 12 inches, but on mountaintops, totals are nearly 30 inches.
The regional climate is dominated by a strong and persistent high-pressure system, which frequently lies off the Pacific Coast (generally referred to as the Pacific High). The Pacific High shifts northward or southward in response to seasonal changes or the presence of cyclonic storms. In its usual position to the west, the high produces an elevated temperature inversion. An inversion is characterized by a layer of warmer air above cooler air near the ground surface. Normally, air temperature decreases with altitude. In an inversion, the temperature of a layer of air increases with altitude. The inversion acts like a lid on the cooler air mass near the ground, preventing pollutants in the lower air mass from dispersing upward beyond the inversion "lid." This results in higher concentrations of pollutants trapped below the inversion.
Atmospheric stability is a primary factor that affects air quality in the study region. Atmospheric stability regulates the amount of air exchange (referred to as mixing) both horizontally and vertically. Restricted mixing (that is, a high degree of stability) and low wind speeds are generally associated with higher pollutant concentrations. These conditions are typically related to temperature inversions that cap the pollutants emitted below or within them.
The airflow plays an important role in the movement of pollutants. Local winds are normally controlled by the location of the Pacific High. Wind speeds typical of the region are generally light, another factor that contributes to higher levels of pollution since low wind speeds minimize dispersion of pollutants. The sea breeze is typically northwesterly throughout the year; however, local topography causes variations. During summer months, these northwesterly winds are
5.8 Air Quality
April 2008 5.8-2 Final EIR
stronger and persist later into the night. For example, Lompoc experiences predominant winds from the west-northwest throughout the year with an average annual speed of 9.7 miles per hour (mph) with the maximum wind speeds reaching 62 mph. When the Pacific High weakens, a Santa Ana condition can develop with air traveling westward into the county from the east. Stagnant air often occurs at the end of a Santa Ana condition, causing a buildup of pollutants offshore. The dominant wind patterns in the area are presented in Figure 5.8-1.
Several types of inversions are common to the area. In winter, weak surface inversions occur, caused by radiation cooling of air in contact with the cold surface of the earth. During the spring and summer, marine inversions occur when cool air from over the ocean intrudes under the warmer air that lies over the land. During the summer, the Pacific High can cause the air mass to sink, creating a subsidence inversion.
Topography plays a significant role in affecting the direction and speed of winds. During the months of May to October, it is common in the project area for an inversion layer to form. Year round, light onshore winds hamper the dispersion of primary pollutants and the orientation of the inland mountain ranges interrupt air circulation patterns. Pollutants become trapped, creating ideal conditions for the production of secondary pollutants.
5.8.1.2 Air Quality
Air quality is determined by measuring ambient concentrations of air pollutants that are known to have adverse health effects. For regulatory purposes there are only several air pollutants for which standards have been set. These pollutants are generally recognized as “criteria pollutants.” For most criteria pollutants, regulations and standards have been in effect, in varying degrees, for more than 25 years, and control strategies are designed to ensure that the ambient concentrations do not exceed certain thresholds. Another class of air pollutants that are subject to regulatory requirements are called hazardous air pollutants (HAPs) or air toxics. Substances that are especially harmful to health, such as those considered under U.S. Environmental Protection Agency’s (EPA) hazardous air pollutant program or California's AB 1807 and/or AB 2588 air toxics programs, are considered to be air toxics. Regulatory air quality standards are based on scientific and medical research. These standards establish minimum concentration of an air pollutant in the ambient air that could start to cause adverse health effects.
For air toxics emissions, however, the regulatory process usually assesses the potential impacts to public health in terms of “risk” (such as the Air Toxics “Hot Spots” Program in California), or the emissions may be controlled by prescribed technologies (as in the new federal approach for controlling hazardous air pollutants).
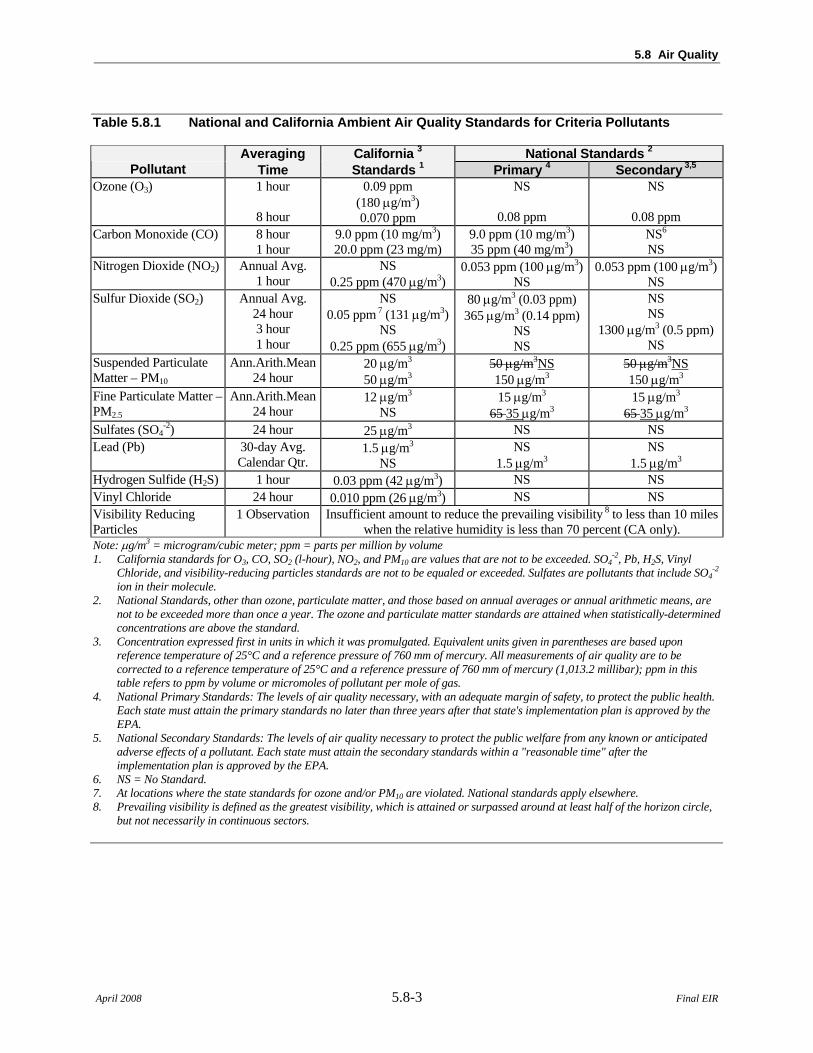
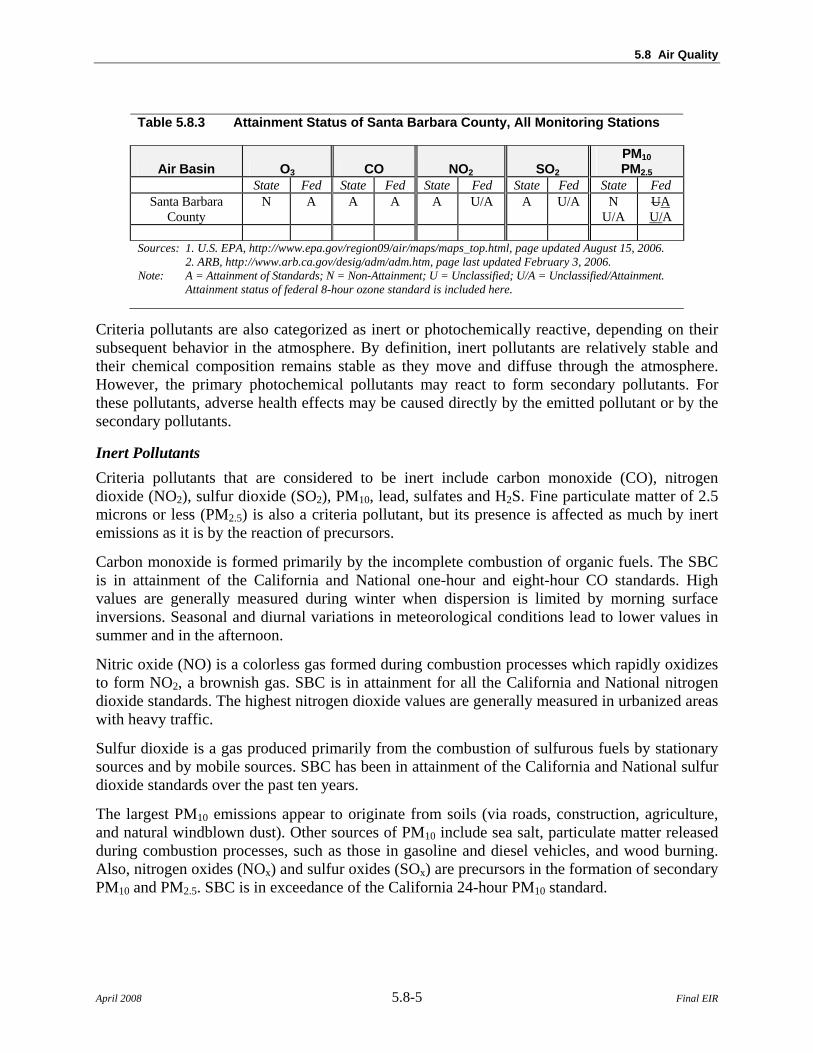
The degree of air quality degradation for criteria pollutants is determined by comparing the ambient pollutant concentrations to health-based standards developed by government agencies. The current National Ambient Air Quality Standards (NAAQS) and California Ambient Air Quality Standards (CAAQS) for “criteria pollutants” are listed in Table 5.8.1. Ambient air quality monitoring for criteria pollutants is conducted at numerous sites throughout the state. Table 5.8.2 presents relevant data from several monitoring stations located in the proposed project area. A summary of the attainment status for SBC is provided in Table 5.8.3. Ambient air quality in the county is generally good (i.e., within applicable ambient air quality standards), with the exception of particulate matter with an aerodynamic diameter of ten microns or less (PM10), and ozone (O3).
5.8 Air Quality
April 2008 5.8-3 Final EIR
Table 5.8.1 National and California Ambient Air Quality Standards for Criteria Pollutants
Averaging California 3 National Standards 2 Pollutant Time Standards 1 Primary 4 Secondary 3,5
Ozone (O3) 1 hour
8 hour
0.09 ppm (180 μg/m3) 0.070 ppm
NS
0.08 ppm
NS
0.08 ppm Carbon Monoxide (CO) 8 hour
1 hour 9.0 ppm (10 mg/m3) 20.0 ppm (23 mg/m)
9.0 ppm (10 mg/m3) 35 ppm (40 mg/m3)
NS6 NS
Nitrogen Dioxide (NO2) Annual Avg. 1 hour
NS 0.25 ppm (470 μg/m3)
0.053 ppm (100 μg/m3) NS
0.053 ppm (100 μg/m3)NS
Sulfur Dioxide (SO2) Annual Avg. 24 hour 3 hour 1 hour
NS 0.05 ppm 7 (131 μg/m3)
NS 0.25 ppm (655 μg/m3)
80 μg/m3 (0.03 ppm) 365 μg/m3 (0.14 ppm)
NS NS
NS NS
1300 μg/m3 (0.5 ppm) NS
Suspended Particulate Matter – PM10
Ann.Arith.Mean 24 hour
20 μg/m3 50 μg/m3
50 μg/m3NS 150 μg/m3
50 μg/m3NS 150 μg/m3
Fine Particulate Matter – PM2.5
Ann.Arith.Mean 24 hour
12 μg/m3 NS
15 μg/m3 65 35 μg/m3
15 μg/m3 65 35 μg/m3
Sulfates (SO4-2) 24 hour 25 μg/m3 NS NS
Lead (Pb) 30-day Avg. Calendar Qtr.
1.5 μg/m3 NS
NS 1.5 μg/m3
NS 1.5 μg/m3
Hydrogen Sulfide (H2S) 1 hour 0.03 ppm (42 μg/m3) NS NS Vinyl Chloride 24 hour 0.010 ppm (26 μg/m3) NS NS Visibility Reducing Particles
1 Observation Insufficient amount to reduce the prevailing visibility 8 to less than 10 miles when the relative humidity is less than 70 percent (CA only).
Note: μg/m3 = microgram/cubic meter; ppm = parts per million by volume 1. California standards for O3, CO, SO2 (l-hour), NO2, and PM10 are values that are not to be exceeded. SO4
-2, Pb, H2S, Vinyl Chloride, and visibility-reducing particles standards are not to be equaled or exceeded. Sulfates are pollutants that include SO4
-2 ion in their molecule.
2. National Standards, other than ozone, particulate matter, and those based on annual averages or annual arithmetic means, are not to be exceeded more than once a year. The ozone and particulate matter standards are attained when statistically-determined concentrations are above the standard.
3. Concentration expressed first in units in which it was promulgated. Equivalent units given in parentheses are based upon reference temperature of 25°C and a reference pressure of 760 mm of mercury. All measurements of air quality are to be corrected to a reference temperature of 25°C and a reference pressure of 760 mm of mercury (1,013.2 millibar); ppm in this table refers to ppm by volume or micromoles of pollutant per mole of gas.
4. National Primary Standards: The levels of air quality necessary, with an adequate margin of safety, to protect the public health. Each state must attain the primary standards no later than three years after that state's implementation plan is approved by the EPA.
5. National Secondary Standards: The levels of air quality necessary to protect the public welfare from any known or anticipated adverse effects of a pollutant. Each state must attain the secondary standards within a "reasonable time" after the implementation plan is approved by the EPA.
6. NS = No Standard. 7. At locations where the state standards for ozone and/or PM10 are violated. National standards apply elsewhere. 8. Prevailing visibility is defined as the greatest visibility, which is attained or surpassed around at least half of the horizon circle,
but not necessarily in continuous sectors.

5.8 Air Quality
April 2008 5.8-4 Final EIR
Table 5.8.2 Ambient Air Quality Summary for Project Area – 2003 to 2005
Maximum Observed Concentration (Number of Standard Exceedances)*
Pollutant Year Lompoc OGP Lompoc S H
Street VAFB STS
Power Santa Maria –
Broadway Ozone, ppm
1-hour 8-hour
2003 0.107 (1 day) 0.080 (0)
0.071 (0) 0.060 (0)
0.089 (0) 0.077 (0)
0.065 (0) 0.060 (0)
1-hour 8-hour
2004 0.097 (1 day) 0.089 (2 days)
0.084 (0) 0.075 (0)
0.090 (0) 0.083 (0)
0.074 (0) 0.064 (0)
1-hour 8-hour
2005 0.072 (0) 0.069 (0)
0.064 (0) 0.052 (0)
0.072 (0) 0.066 (0)
0.063 (0) 0.061 (0)
CO, ppm 8-hour 2003 NA 1.71 (0) 0.36 (0) 1.13 (0) 8-hour 2004 NA 1.26 (0) 0.36 (0) 0.95 (0) 8-hour 2005 NA 1.07 (0) 0.70 (0) 0.94 (0)
NO2, ppm 1-hour
Annual Avg. 2003 0.024 (0)
0.002 0.051 (0)
0.006 0.023 (0)
0.001 0.056 (0)
0.011 1-hour
Annual Avg. 2004 0.022 (0)
0.002 0.036 (0)
0.006 0.023 (0)
0.001 0.050 (0)
0.010 1-hour
Annual Avg. 2005 0.020 (0)
0.002 0.035 (0)
0.006 0.019 (0)
0.001 0.048 (0)
0.010 SO2, ppm
24-hour Annual Avg.
2003 0.002 (0) NA
0.003 (0) 0.001
0.001 (0) NA
NA NA
24-hour Annual Avg.
2004 0.002 (0) NA
0.002 (0) NA
0.002 (0) NA
NA NA
24-hour Annual Avg.
2005 0.001 (0) NA
0.003 (0) NA
0.001 (0) NA
NA NA
PM10, µg/m3 24-hour Annual Avg
2003
NA NA
57.1 (1 day) 22.1
97.8 (1 day) 13.6
58.0 (1 day) 24.4
24-hour Annual Avg
2004
NA NA
52.3 (1 day) 20.1
38.1 (0) 18.0
52.0 (1 day) 24.1
24-hour Annual Avg
2005 NA NA
86.6 (1 day) 17.5
41.8 (0) 15.3
43.0 (0) 21.4
PM2.5, µg/m3 24-hour Annual Avg
2003
NA NA
NA NA
NA NA
20.5 (0) 8.6
24-hour Annual Avg
2004
NA NA
NA NA
NA NA
16.6 (0) 7.6
24-hour Annual Avg
2005 NA NA
NA NA
NA NA
29.8 (0) NA
Sources: Air Resources Board Air Quality Data Annual Summaries 2003-2005 from http://www.arb.ca.gov. Notes: * Number or percent of exceedances of the most restrictive standard (usually, the State Standard) NA – No data available State MG – State Annual Mean Geometrical National MA – National Mean Arithmetic
5.8 Air Quality
April 2008 5.8-5 Final EIR
Table 5.8.3 Attainment Status of Santa Barbara County, All Monitoring Stations
Air Basin O3 CO NO2 SO2 PM10 PM2.5
State Fed State Fed State Fed State Fed State Fed Santa Barbara
County N A A A A U/A A U/A N
U/A UA U/A
Sources: 1. U.S. EPA, http://www.epa.gov/region09/air/maps/maps_top.html, page updated August 15, 2006.
2. ARB, http://www.arb.ca.gov/desig/adm/adm.htm, page last updated February 3, 2006. Note: A = Attainment of Standards; N = Non-Attainment; U = Unclassified; U/A = Unclassified/Attainment.
Attainment status of federal 8-hour ozone standard is included here.
Criteria pollutants are also categorized as inert or photochemically reactive, depending on their subsequent behavior in the atmosphere. By definition, inert pollutants are relatively stable and their chemical composition remains stable as they move and diffuse through the atmosphere. However, the primary photochemical pollutants may react to form secondary pollutants. For these pollutants, adverse health effects may be caused directly by the emitted pollutant or by the secondary pollutants.
Inert Pollutants Criteria pollutants that are considered to be inert include carbon monoxide (CO), nitrogen dioxide (NO2), sulfur dioxide (SO2), PM10, lead, sulfates and H2S. Fine particulate matter of 2.5 microns or less (PM2.5) is also a criteria pollutant, but its presence is affected as much by inert emissions as it is by the reaction of precursors.
Carbon monoxide is formed primarily by the incomplete combustion of organic fuels. The SBC is in attainment of the California and National one-hour and eight-hour CO standards. High values are generally measured during winter when dispersion is limited by morning surface inversions. Seasonal and diurnal variations in meteorological conditions lead to lower values in summer and in the afternoon.
Nitric oxide (NO) is a colorless gas formed during combustion processes which rapidly oxidizes to form NO2, a brownish gas. SBC is in attainment for all the California and National nitrogen dioxide standards. The highest nitrogen dioxide values are generally measured in urbanized areas with heavy traffic.
Sulfur dioxide is a gas produced primarily from the combustion of sulfurous fuels by stationary sources and by mobile sources. SBC has been in attainment of the California and National sulfur dioxide standards over the past ten years.
The largest PM10 emissions appear to originate from soils (via roads, construction, agriculture, and natural windblown dust). Other sources of PM10 include sea salt, particulate matter released during combustion processes, such as those in gasoline and diesel vehicles, and wood burning. Also, nitrogen oxides (NOx) and sulfur oxides (SOx) are precursors in the formation of secondary PM10 and PM2.5. SBC is in exceedance of the California 24-hour PM10 standard.

5.8 Air Quality
April 2008 5.8-6 Final EIR
Lead is a heavy metal that in ambient air occurs as a lead oxide aerosol or dust. Since lead is no longer added to gasoline or to paint products, lead emissions have reduced significantly in recent years. SBC is in attainment with the NAAQS and the CAAQS for lead.
Sulfates are aerosols (i.e., wet particulate) that are formed by sulfur oxides in moist environments. They exist in the atmosphere as sulfuric acid and sulfate salts. The primary source of sulfate is from the combustion of sulfurous fuels. SBC is in attainment for the California sulfate standard and there has been a steady decrease in ambient concentrations since the last violation in 1984.
Hydrogen sulfide (H2S) is an odorous, toxic, gaseous compound that can be detected by humans at very low concentrations. The gas is produced during the decay of organic material and is also found naturally in petroleum. SBC is in attainment of the H2S standard.
Photochemical Pollutants Ozone is formed in the atmosphere through a series of complex photochemical reactions involving oxides of nitrogen (NOx), reactive organic compounds (ROC), and sunlight occurring over a period of several hours. Since ozone is not emitted directly into the atmosphere, but is formed as a result of photochemical reactions, it is classified as a secondary or regional pollutant. Because these ozone-forming reactions take time, peak ozone levels are often found downwind of major source areas.
SBC is designated non-attainment for the State 1-hour ozone standard, but SBC is classified as in attainment for the federal 8-hour standard.
Toxic Air Contaminants Toxic Air Contaminants (TACs) are hazardous air pollutants that are known or suspected to cause cancer, genetic mutations, birth defects, or other serious illnesses to people. TACs may be emitted from three main source categories: (1) industrial facilities; (2) internal combustion engines (stationary and mobile); and (3) small “area sources” (such as solvent use). The California Air Resources Board (CARB) publishes lists of Volatile Organic Compound Species Profiles for many industrial applications and substances.
Generally, TACs behave in the atmosphere in the same general way as inert pollutants (those that do not react chemically, but preserve the same chemical composition from point of emission to point of impact). The concentrations of toxic pollutants are therefore determined by the quantity and concentration emitted at the source and the meteorological conditions encountered as the pollutants are transported away from the source. Thus, impacts from toxic pollutant emissions tend to be site-specific and their intensity is subject to constantly changing meteorological conditions. The worst meteorological conditions that affect short-term impacts (low wind speeds, highly stable air mass, and constant wind direction) occur relatively infrequently.
Greenhouse Gases Greenhouse gases (GHGs) are defined as any gas that absorbs infrared radiation in the atmosphere. Greenhouse gases include, but are not limited to, water vapor, carbon dioxide (CO2), methane (CH4), and nitrous oxide (N2O). These greenhouse gases lead to the trapping and buildup of heat in the atmosphere near the earth’s surface, commonly known as the Greenhouse

5.8 Air Quality
April 2008 5.8-7 Final EIR
Effect. There is increasing evidence that the Greenhouse Effect is leading to global warming and climate change (U.S. EPA, February20006).
The primary source of GHG in the United States is energy-use related activities, which include fuel combustion, as well as energy production, transmission, storage and distribution. These energy related activities generated 85 percent of the total U.S. emissions on a carbon equivalent basis in 1998 and 86 percent in 2004. Fossil fuel combustion represents the vast majority of the energy related GHG emissions, with CO2 being the primary GHG. The total 1998 U.S. GHG emissions associated with energy related activities included 6,006 million tons of CO2 (or 5,448.3 teragrams [Tg]1) and 12.3 million tons (11.2 Tg) of methane (Inventory of U.S. Greenhouse Gases Emissions and Sinks: 1990-2004, EPA, April 2006). The CO2 emissions increased to 6,419 million tons (5,835.3 Tg) and methane emissions decreased to 11.3 million tons (10.3 Tg) for all energy related activities in 2004. Much smaller quantities of N2O are caused by mobile fossil fuel combustion and have been decreasing similar to the trend in methane. Figure 5.8-2 shows the relative trend of U.S. GHG emissions for energy related activities from 1998 through 2004.
The total U.S. GHG emissions associated with energy related activities was 5,752.3 teragrams (Tg) of carbon equivalent (Tg CO2 Eq) in 1998, of which 5,448.3 Tg was CO2 emissions (Inventory of U.S. Greenhouse Gases Emissions and Sinks: 1990-2004, EPA, April 2006). These emissions grew to 6,108.2 Tg CO2 Eq for all energy related activities in 2004, of which 5,835.3 Tg was CO2 emissions. Figure 5.8-2 shows the relative breakdown of U.S. GHG emissions for energy related activities in 1998.
Eighty-six percent of the energy consumed in the U.S. in 2004 was from fossil fuels such as coal, natural gas and petroleum. The remaining 14 percent was supplied by nuclear electric power (8 percent) and renewable sources (6 percent) (U.S. EPA, 2006).
5.8.1.3 Regional Emissions Emissions within SBC are estimated periodically by the Santa Barbara County Air Pollution Control District (APCD). These estimates are used to address federal and state clean air mandates. Table 5.8.4 lists the estimated emissions for SBC by source category. Table 5.8.4 Regional Emissions Inventory (Tons Per Year) for Santa Barbara County
1996 Emission Sourcesa ROC CO NOx SO2 PM10 Stationary Sources 2,838 1,551 2,159 552 554 Petroleum Activities 1,112 104 1,143 9 14 Petroleum Activities % of Total 2.5 0.1 6.9 1.0 0.1 Area-Wide Sources 3,420 9,433 2,653 8 10,584 Mobile Sources 8,907 82,532 12,878 305 572 Natural Sources 29,295 11,404 1,058 0.0 1,843 SBC Total 44,460 103,369 16,589 865 13,553 a. For Clean Air Plan (CAP) base year 1996.
2000 2002 Emission Sourcesb ROC NOx Stationary Sources 3,6673,211 2,0972,469
1 One tera-gram is one trillion (1012) grams.

5.8 Air Quality
April 2008 5.8-8 Final EIR
Petroleum ActivitiesProduction and Marketing
1,224892 77627
Petroleum Activities % of Total 2.80 4.40.2 Area-Wide Sources 3,0643,732 350412 Mobile Sources 8,6877,889 13,80412,41
2
Natural Sources 28,93028,608
1,365882
SBC Total 44,34843,440
17,61516,156
b. Updated inventory available for ozone precursors only, from Clean Air Plan (CAP) base year 20002002, as in 2004 2007 CAP.
In SBC the highest contributors to the ROC emissions are natural sources, primarily seeps of different oil and gas constituents through voids in the ground. Carbon monoxide and NOx emissions mostly occur due to mobile sources (e.g., on-road vehicles). The majority of SOx emissions come from mineral processes, specifically from diatomaceous earth processing. PM10 emissions are mostly due to road dust.
5.8.1.4 Study Area Baseline Emissions The current level of air emissions at the following facilities represents the baseline for the proposed project and modification of the associated facilities: Platform Irene, the LOGP, and the associated pipelines. Also, the baseline is characterized by current emissions from several mobile sources such as helicopters and supply-boats servicing Platform Irene, as well as emissions from mobile services sources including commuters, LPG/NGL, sulfur and miscellaneous trucks servicing the LOGP.
Table 5.8.5 summarizes the estimated current emissions of the operating equipment at the facilities that are covered under the appropriate APCD Permits to Operate (PTO). Emissions from all sources were summarized as part of annual operating reports provided to the APCD for 2005. The stationary project emissions are comprised of the following categories of equipment emissions:
Platform Irene LOGP Engines (Cranes) Flare Fugitive Components Supply Boat Pigging Equipment Sumps/Tanks/Separators Solvent Usage
Heater Treaters Thermal Oxidizer (Heating Medium Heater) Flare Fugitive Emissions (including pipelines) Pigging Sumps Solvent Usage
Table 5.8.5 Point Pedernales Current Emissions
Facility NOx, (tons/yr)
ROC, (tons/yr)
CO, (tons/yr)
SOx, (tons/yr)
PM10, (tons/yr)
Platform Irene a 12.52 26.05 2.66 1.04 1.01 LOGP b 2.53 35.86 0.89 0.58 0.61 Sources: PXP annual report to SBCAPCD for Platform Irene, 2006; PXP report to SBCAPCD for LOGP, 2006. a. Includes emissions from supply boats. b. Includes emissions from pipelines.

5.8 Air Quality
April 2008 5.8-9 Final EIR
Emissions that comprise the project air quality baseline are within the permitted limits established by the SBCAPCD. Table 5.8.6 below summarizes the limits stated by SBCAPCD in the appropriate PTO. Table 5.8.6 Point Pedernales Permitted Emissions Levels
Facility
NOx, tons/yr
(lbs/day)
ROC, tons/yr
(lbs/day)
CO, tons/yr
(lbs/day)
SO2, tons/yr
(lbs/day)
PM10, tons/yr
(lbs/day) Platform Irene – PTO 9106a 45.64
(1187.40) 28.01
(231.40) 13.87
(165.70) 9.30
(66.40) 4.66
(80.10) LOGP – PTO 6708b 8.25
(45.00) 43.66
(263.65) 5.89
(32.19) 3.48
(18.72) 2.17
(11.81) Sources: SBC APCD, Permits to Operate #6708 and #9106, 2003. a. Includes emissions from supply boats. b. Includes emissions from pipelines, emissions from trucks are exempt.
5.8.1.5 Emissions Reductions Requirements Increases in emissions of any non-attainment pollutant or its pre-cursor from a new or modified project that exceed the thresholds identified in the APCD Rule 802(E) are required to be mitigated. When the Point Pedernales Project was permitted, project emissions did not exceed the existing thresholds for emission reductions. However, subsequent modifications triggered offset requirements for ROC, NAROC (non-alkane ROC), and NOx only under SBCAPCD rules.
Mitigation was required in 1986 for the Point Pedernales Project pursuant to CEQA and to achieve maximum feasible mitigation requirements. In particular, an agreement between the operator and the SBCAPCD in 1986, entitled “Emission Reduction Agreement-Union Oil Point Pedernales Project,” established these emission mitigations. Mitigations for emissions from Platform Irene were also included through offsets as part of the permitting of onshore sources. The 1986 agreement was amended in 1996 to give credit for the shutdown of the Battles Gas Plant. Under CEQA, reducing existing sources of emissions on a 1:1 basis mitigated total project emissions increases. Mitigation of project emissions was required to maintain consistency with the 1986 Air Quality Attainment Plan (AQAP).
Emission offsets were originally obtained for the project through electrification of internal combustion engines, installation of emission reduction technologies (such as Pre-Stratified Charge) on other engines and installation of vapor recovery systems. Since that time, the Battles Gas Plant shutdown provided a “swap” for the above-listed offsets along with electrification of compressors. Any new ROC emissions subject to APCD permit as a result of the project will be subject to offset requirements per APCD rules.
5.8.2 Regulatory Setting Federal, state, and local agencies have established standards and regulations that will affect the proposed project. A summary of the regulatory setting for air quality is provided below.

5.8 Air Quality
April 2008 5.8-10 Final EIR
5.8.2.1 Federal Regulations The Federal Clean Air Act of 1970 directs the attainment and maintenance of the NAAQS. The 1990 Amendments to this Act included new provisions that address air emissions that affect local, regional and global air quality. The main elements of the 1990 Clean Air Act Amendments are summarized below:
• Title I Attainment and maintenance of NAAQS
• Title II Motor vehicles and fuel reformulation
• Title III Hazardous air pollutants
• Title IV Acid deposition
• Title V Facility operating permits
• Title VI Stratospheric ozone protection
• Title VII Enforcement
The U.S. EPA is responsible for implementing the Federal Clean Air Act and establishing the NAAQS for criteria pollutants. In 1997 EPA adopted revisions to the Ozone and Particulate Matter Standards contained in the Clean Air Act. These revisions included a new 8-hour ozone standard and a new particulate matter standard for particles below 2.5 micron in diameter. These standards were suspended, however, when in May 1999 the U.S. Court of Appeals for District of Columbia remanded the new ozone standard. In January 2001 EPA issued a Proposed Response to Remand, where it stated that the revised ozone standard should remain at 0.08 ppm. In February 2001 the U.S. Supreme Court upheld the constitutionality of the Clean Air Act as EPA had interpreted it in setting health-protective air quality standards for ground-level ozone and particulate matter.
5.8.2.2 State Regulations
California Air Resources Board (CARB). The CARB established the CAAQS. Comparison of the criteria pollutant concentrations in ambient air to the CAAQS determines State attainment status for criteria pollutants. The CARB has jurisdiction over all air pollutant sources in the state; it has delegated to local air districts the responsibility for stationary sources and has retained authority for emissions from mobile sources. The CARB in partnership with the local air quality management districts within California has developed a pollutant monitoring network to aid attainment of CAAQS. The network consists of numerous monitoring stations located throughout the state, which monitor and report various pollutants concentrations in ambient air.
California Clean Air Act (CCAA) (California Health and Safety Code, Division 26).
This act went into effect on January 1, 1989, and was amended in 1992. The CCAA mandates achieving the health-based CAAQS at the earliest practical date.
Air Toxics “Hot Spots” Information and Assessment Act of 1987 (California Health & Safety Code, Division 26, Part 6). The Hot Spots Act requires an inventory of air toxics emissions from individual facilities, an assessment of health risk, and notification of potential significant health risk.

5.8 Air Quality
April 2008 5.8-11 Final EIR
The California Global Warming Solutions Act of 2006, Assembly Bill (AB 32), (California Health & Safety Code Sections 38500, et seq). Following Executive Order S-3-05 in June 2005, which declared California’s particular vulnerability to climate change, AB 32 was signed by Governor Arnold Schwarzenegger on September 27, 2006. In passing the bill, the California Legislature found that “Global warming poses a serious threat to the economic well-being, public health, natural resources, and the environment of California. The potential adverse impacts of global warming include the exacerbation of air quality problems, a reduction in the quality and supply of water to the state from the Sierra snowpack, a rise in sea levels resulting in the displacement of thousands of coastal businesses and residences, damage to marine ecosystems and the natural environment, and an increase in the incidences of infectious diseases, asthma, and other human health-related problems” (California Health & Safety Code, Division 25.5, Part 1). In response to global warming, AB 32 requires the CARB to adopt a statewide greenhouse gas emissions limit equivalent to the statewide GHG emissions levels in 1990 to be achieved by 2020 and requires the CARB to adopt rules and regulations to achieve the maximum technologically feasible and cost-effective GHG emission reductions. By January 1, 2008, CARB is scheduled to adopt regulations requiring mandatory GHG emissions reporting and define the statewide GHG emissions cap for 2020. The remainder of the timeline for implementation would have CARB adopting a plan by January 1, 2009 that would indicate how emission reductions will be achieved from significant sources of GHGs via regulations, market mechanisms, and other actions. Then, during 2009, ARB staff would draft rule language to implement its plan and hold public workshops on each measure including market mechanisms (CARB, 2006). Strategies that the state should pursue for managing GHG emissions in California are identified in the California Climate Action Team’s Report to the Governor (CalEPA, 2006). Many focus on generally reducing consumption of petroleum across all areas of the California economy. Improvements in transportation energy efficiency (fuel economy) and alternatives to petroleum-based fuels are to provide substantial reductions by 2020. Oil and gas extraction is an industry that directly contributes approximately three percent of California GHG emissions (CalEPA, 2006). As such, the state plans to mandate GHG emissions reporting for the oil and gas industry and more aggressive strategies to reduce venting and leaks in oil and gas systems.
The Calderon Bill (SB 1889), (California Health & Safety Code Sections 25531-25543). This bill, signed by Governor Pete Wilson in September 1996, sets forth changes in the following four areas: provides guidelines to identify a more realistic health risk; requires high risk facilities to submit an air toxic emission reduction plan; holds air pollution control districts accountable for ensuring that the plans will achieve their objectives; and requires high risk facilities to achieve their planned emissions reduction.
CARB Airborne Toxic Control Measure (ATCM) for Stationary Compression Ignition Engines. The ATCM for Stationary Compression Ignition Engines was adopted by CARB in 2004 to reduce diesel PM emissions from new and in-use stationary diesel engines. The ATCM requires emergency standby and prime diesel engines to meet stringent operating requirements and emission standards.

5.8 Air Quality
April 2008 5.8-12 Final EIR
CARB Portable Equipment Registration Program and Airborne Toxic Control Measure (ATCM) for Diesel Particulate Matter from Portable Engines. The Portable Engine ATCM affects all diesel-fueled portable engines that are 50 horsepower and larger. Included are engines that are registered under CARB’s Portable Equipment Registration Program (PERP), engines that are permitted by the districts, and engines that were historically exempt from district permits. The ATCM requires all portable engines to meet the most stringent of the federal or California emission standards for nonroad engines in effect at the time of registration in the Portable Equipment Registration Program or permitting. After 2010, all fleets of portable engines are required to meet diesel PM emission averages that become more stringent after 2013. Previously-exempt emergency and prime diesel engines rated at greater than 50 brake-horsepower were required to obtain SBCAPCD permits in 2005. For Platform Irene and LOGP, these sources were considered “exempt” in the 2003 permits but are now included in APCD permits issued December 2006. The diesel stationary engines under permit are subject to the ATCM for Stationary Compression Ignition Engines described above, which also primarily focuses on PM emissions control.
5.8.2.3 County Rules and Regulations Local APCDs in California have jurisdiction over stationary sources in their respective areas and must adopt plans and regulations necessary to demonstrate attainment of federal and state air quality standards. As directed by the Federal and State Clean Air Acts, local air districts are required to prepare plans with strategies for attaining and maintaining state and federal ozone standards. The 1998 Clean Air Plan and subsequent updates, including the most recent August 2004 2007 Clean Air Plan adopted in December 2004, outline the steps to be taken to ensure that ozone levels attain the state standards. The 2004 2007 CAP begins with county-wide emissions from a 2000 base year and uses projections of population growth and trends in energy and transportation demand to predict future emissions and determine the control strategies needed to eventually achieve attainment. The control strategies are then either codified into the SBCAPCD rules and regulations or otherwise set forth as formal recommendations from SBCAPCD to other agencies. In the project area, air quality rules and regulations are promulgated by the SBCAPCD. In order to ultimately achieve the air quality standards, the rules and regulations limit emissions and permissible impacts from proposed projects. Some rules also specify emission controls and control technologies for each type of emitting source. The regulations also include requirements for obtaining an Authority to Construct (ATC) permit and a PTO.
The SBCAPCD has jurisdiction over air quality attainment in the SBC portion of the SCCAB. All aspects of the proposed project and alternatives occurring in SBC must obtain a SBCAPCD permit, if applicable.
SBCAPCD also has jurisdiction over outer continental shelf (OCS) sources located within 25 miles of the seaward boundaries of the State of California (Rule 903).
5.8.3 Significance Criteria
5.8.3.1 Significance Criteria for Construction Emissions from construction are normally short-term. Currently, neither the County nor the SBCAPCD have daily or quarterly quantifiable emission thresholds established for short-term

5.8 Air Quality
April 2008 5.8-13 Final EIR
construction emissions. NOx and ROC emissions from construction equipment and PM10 impacts from dust emissions are discussed and mitigation measures are proposed as per AQAP policies.
5.8.3.2 Significance Criteria for Operation Quantitative significance criteria have been developed for air quality impacts by the SBC P&D (Environmental Thresholds and Guidelines, 2006). According to the SBC guidelines, proposed project air quality impacts are considered significant if the project:
• Interferes with the progress toward attainment of the ozone standard by releasing emissions, which equal or exceed the established long-term quantitative thresholds for NOx and ROC. The quantitative threshold for NOx and ROC is 25 lbs/day of either contaminant from motor vehicle trips only.
• Equals or exceeds the daily trigger for offsets set in the SBCAPCD New Source Review Rule 802, for any pollutant from all project sources, mobile and stationary, which are 80 lbs/day PM10 or 55 lbs/day NOx or ROC.
• Equals or exceeds the state or federal ambient air quality standards for any criteria pollutant (as determined by modeling).
The SBC P&D guidelines specify screening Criteria for triggeringmodeling have been establishedfor CO under certain circumstances, although Santa Barbara County has attained the CO standards for many years. A project would have a significant air quality impact if it causes, by adding to the existing background CO levels, a CO “hot spot” where California one-hour standard of 20 ppm of CO is exceeded.Screening criteria for potential CO impacts are the following:
• If a project contributes less than 800 peak hour trips, then CO modeling is not required.
• Projects contributing more than 800 peak hour trips to an existing congested intersection at level of service (LOS) D* or below, or will cause an intersection to reach LOS of D or below, may be required to model for CO impacts.
The following issues should be discussed only if they are applicable to the project: • Emissions which may affect sensitive receptors (e.g., children, elderly or acutely ill);
• Toxic or hazardous air pollutants in amounts which may increase cancer risk for the affected population; or
• Odor or another air quality nuisance problem impacting a considerable number of people.
5.8.3.3 Significance Criteria for Health Risks The SBCAPCD has established criteria for determining the significance of potential health risks associated with toxic emissions from a project. These criteria have been developed for both carcinogenic and non-carcinogenic compounds, as well as for acute and chronic exposure as follows:
Potential Health Risk Criterion Cancer Risk 10 in one million (1 x 10⁻⁵) Health Hazard Index 1.0
* See Section 5.9, Transportation/Circulation, for explanation of LOS levels.
5.8 Air Quality
April 2008 5.8-14 Final EIR
A cancer risk of 10 in one million represents the number of potential excess cancer cases (10) per million individuals exposed. The health hazard index is the cumulative ratio of the estimated exposure level to a chemical-specific health threshold. The health hazard index is the sum of the ratios for all chemicals present. Therefore, potential health hazards can be significant even if the threshold for a single chemical is not exceeded, but the sum of the exposure ratios exceeds one.
5.8.4 Impact Analysis for the Proposed Project The proposed project would have construction and operation air quality impacts. The remainder of this section is broken down into construction and operational impacts. Detailed calculations of the emissions are presented in Appendix C.
5.8.4.1 Construction Impacts Impact # Impact Description Phase Residual
Impact Air.1 Construction activities would generate air emissions. Construction Class III
Construction (short-term) emissions would occur during the following activities: 1. Modifications at Platform Irene:
- equipment modifications; - additional helicopter and supply boat trips to support modification activities (offsite).
2. Modifications at Valve Site #2:
- delivery and installation of the new pumps; - construction of the power lines and transformer.
3. Modifications at the LOGP:
- delivery and installation of the new/replacement pumps, upgrades to the existing equipment (e.g., heat exchangers plates).
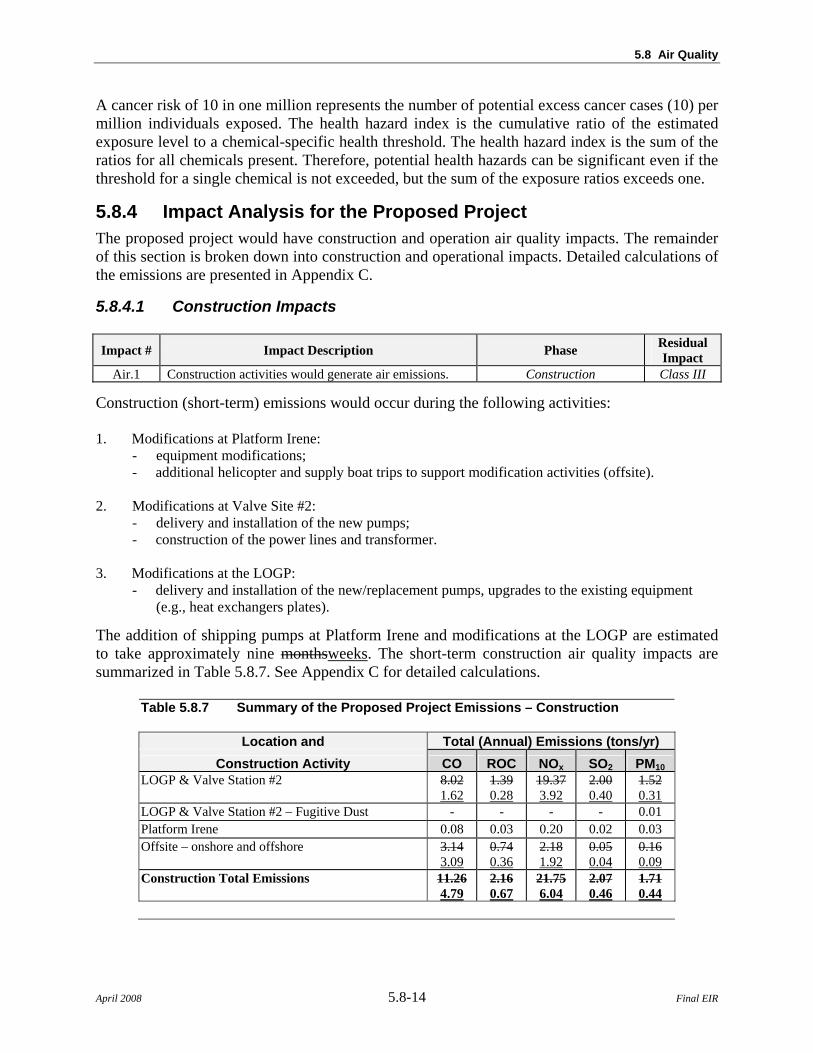
The addition of shipping pumps at Platform Irene and modifications at the LOGP are estimated to take approximately nine monthsweeks. The short-term construction air quality impacts are summarized in Table 5.8.7. See Appendix C for detailed calculations.
Table 5.8.7 Summary of the Proposed Project Emissions – Construction
Location and Total (Annual) Emissions (tons/yr) Construction Activity CO ROC NOx SO2 PM10
LOGP & Valve Station #2 8.02 1.62
1.39 0.28
19.373.92
2.00 0.40
1.52 0.31
LOGP & Valve Station #2 – Fugitive Dust - - - - 0.01 Platform Irene 0.08 0.03 0.20 0.02 0.03 Offsite – onshore and offshore 3.14
3.09 0.74 0.36
2.18 1.92
0.05 0.04
0.16 0.09
Construction Total Emissions 11.264.79
2.16 0.67
21.756.04
2.07 0.46
1.71 0.44
5.8 Air Quality
April 2008 5.8-15 Final EIR
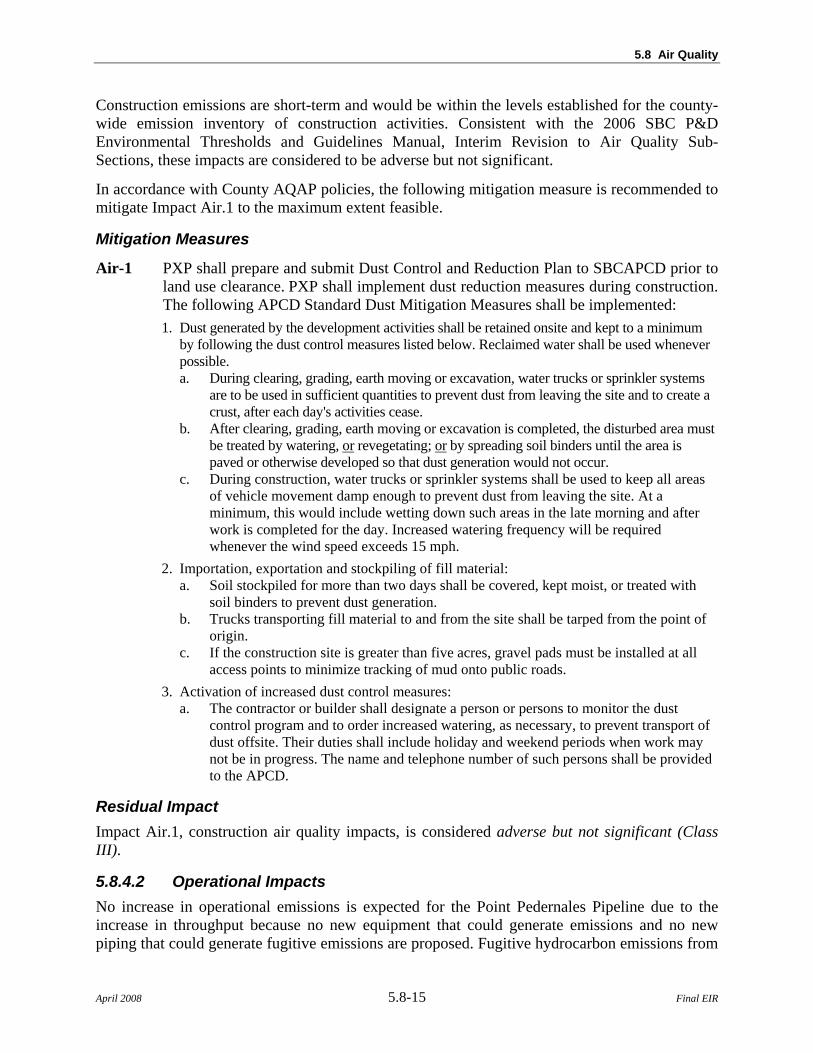
Construction emissions are short-term and would be within the levels established for the county-wide emission inventory of construction activities. Consistent with the 2006 SBC P&D Environmental Thresholds and Guidelines Manual, Interim Revision to Air Quality Sub-Sections, these impacts are considered to be adverse but not significant.
In accordance with County AQAP policies, the following mitigation measure is recommended to mitigate Impact Air.1 to the maximum extent feasible.
Mitigation Measures
Air-1 PXP shall prepare and submit Dust Control and Reduction Plan to SBCAPCD prior to land use clearance. PXP shall implement dust reduction measures during construction. The following APCD Standard Dust Mitigation Measures shall be implemented:
1. Dust generated by the development activities shall be retained onsite and kept to a minimum by following the dust control measures listed below. Reclaimed water shall be used whenever possible. a. During clearing, grading, earth moving or excavation, water trucks or sprinkler systems
are to be used in sufficient quantities to prevent dust from leaving the site and to create a crust, after each day's activities cease.
b. After clearing, grading, earth moving or excavation is completed, the disturbed area must be treated by watering, or revegetating; or by spreading soil binders until the area is paved or otherwise developed so that dust generation would not occur.
c. During construction, water trucks or sprinkler systems shall be used to keep all areas of vehicle movement damp enough to prevent dust from leaving the site. At a minimum, this would include wetting down such areas in the late morning and after work is completed for the day. Increased watering frequency will be required whenever the wind speed exceeds 15 mph.
2. Importation, exportation and stockpiling of fill material: a. Soil stockpiled for more than two days shall be covered, kept moist, or treated with
soil binders to prevent dust generation. b. Trucks transporting fill material to and from the site shall be tarped from the point of
origin. c. If the construction site is greater than five acres, gravel pads must be installed at all
access points to minimize tracking of mud onto public roads. 3. Activation of increased dust control measures:
a. The contractor or builder shall designate a person or persons to monitor the dust control program and to order increased watering, as necessary, to prevent transport of dust offsite. Their duties shall include holiday and weekend periods when work may not be in progress. The name and telephone number of such persons shall be provided to the APCD.
Residual Impact Impact Air.1, construction air quality impacts, is considered adverse but not significant (Class III).
5.8.4.2 Operational Impacts No increase in operational emissions is expected for the Point Pedernales Pipeline due to the increase in throughput because no new equipment that could generate emissions and no new piping that could generate fugitive emissions are proposed. Fugitive hydrocarbon emissions from
5.8 Air Quality
April 2008 5.8-16 Final EIR
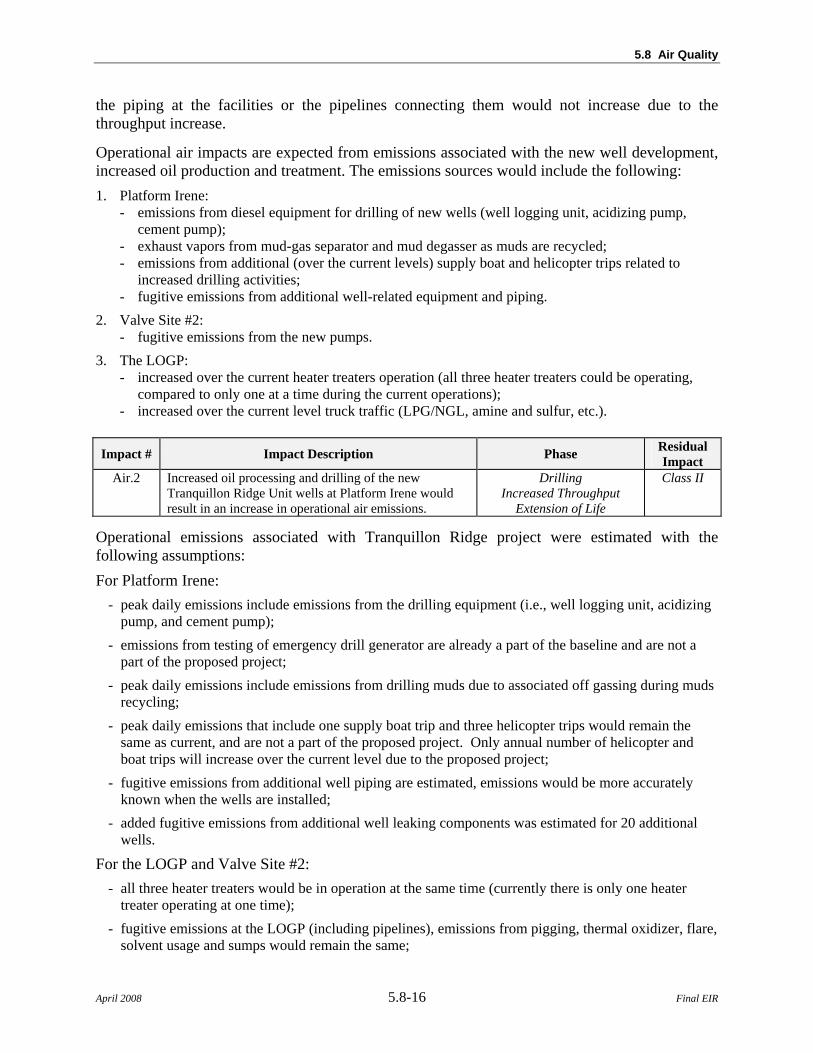
the piping at the facilities or the pipelines connecting them would not increase due to the throughput increase.
Operational air impacts are expected from emissions associated with the new well development, increased oil production and treatment. The emissions sources would include the following: 1. Platform Irene:
- emissions from diesel equipment for drilling of new wells (well logging unit, acidizing pump, cement pump);
- exhaust vapors from mud-gas separator and mud degasser as muds are recycled; - emissions from additional (over the current levels) supply boat and helicopter trips related to
increased drilling activities; - fugitive emissions from additional well-related equipment and piping.
2. Valve Site #2: - fugitive emissions from the new pumps.
3. The LOGP: - increased over the current heater treaters operation (all three heater treaters could be operating,
compared to only one at a time during the current operations); - increased over the current level truck traffic (LPG/NGL, amine and sulfur, etc.).
Impact # Impact Description Phase Residual
Impact Air.2 Increased oil processing and drilling of the new
Tranquillon Ridge Unit wells at Platform Irene would result in an increase in operational air emissions.
Drilling Increased Throughput
Extension of Life
Class II
Operational emissions associated with Tranquillon Ridge project were estimated with the following assumptions: For Platform Irene:
- peak daily emissions include emissions from the drilling equipment (i.e., well logging unit, acidizing pump, and cement pump);
- emissions from testing of emergency drill generator are already a part of the baseline and are not a part of the proposed project;
- peak daily emissions include emissions from drilling muds due to associated off gassing during muds recycling;
- peak daily emissions that include one supply boat trip and three helicopter trips would remain the same as current, and are not a part of the proposed project. Only annual number of helicopter and boat trips will increase over the current level due to the proposed project;
- fugitive emissions from additional well piping are estimated, emissions would be more accurately known when the wells are installed;
- added fugitive emissions from additional well leaking components was estimated for 20 additional wells.
For the LOGP and Valve Site #2: - all three heater treaters would be in operation at the same time (currently there is only one heater
treater operating at one time); - fugitive emissions at the LOGP (including pipelines), emissions from pigging, thermal oxidizer, flare,
solvent usage and sumps would remain the same;
5.8 Air Quality
April 2008 5.8-17 Final EIR
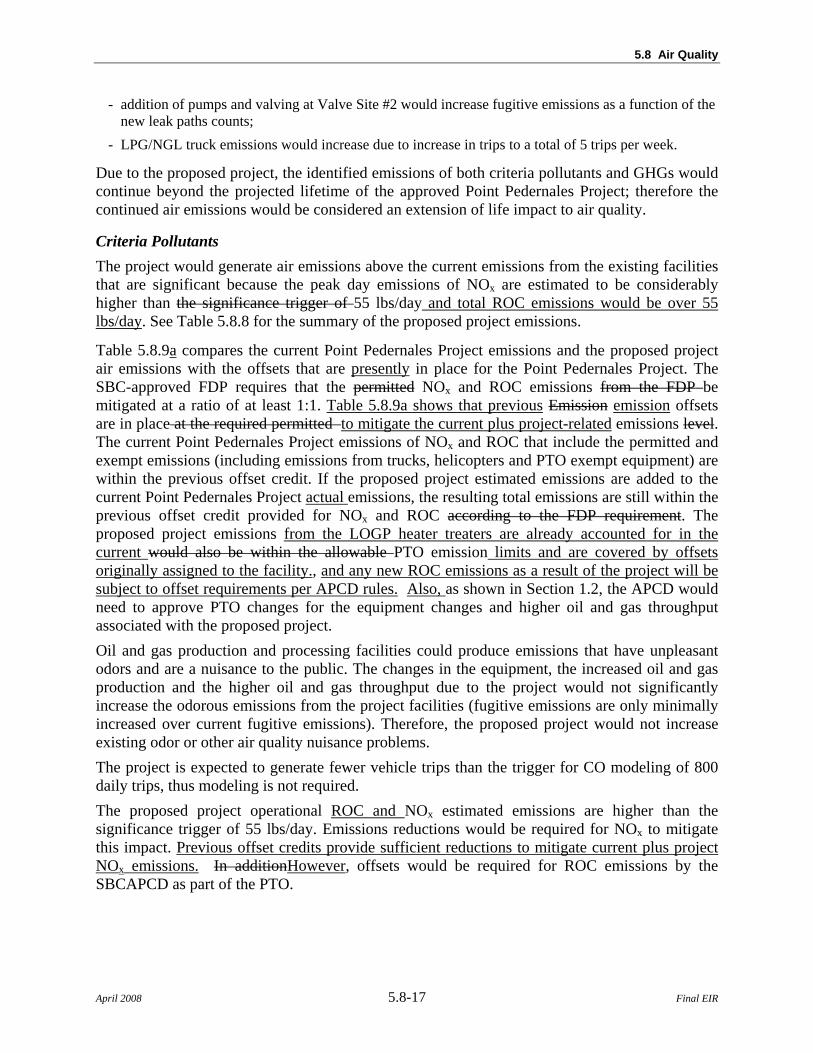
- addition of pumps and valving at Valve Site #2 would increase fugitive emissions as a function of the new leak paths counts;
- LPG/NGL truck emissions would increase due to increase in trips to a total of 5 trips per week.
Due to the proposed project, the identified emissions of both criteria pollutants and GHGs would continue beyond the projected lifetime of the approved Point Pedernales Project; therefore the continued air emissions would be considered an extension of life impact to air quality.
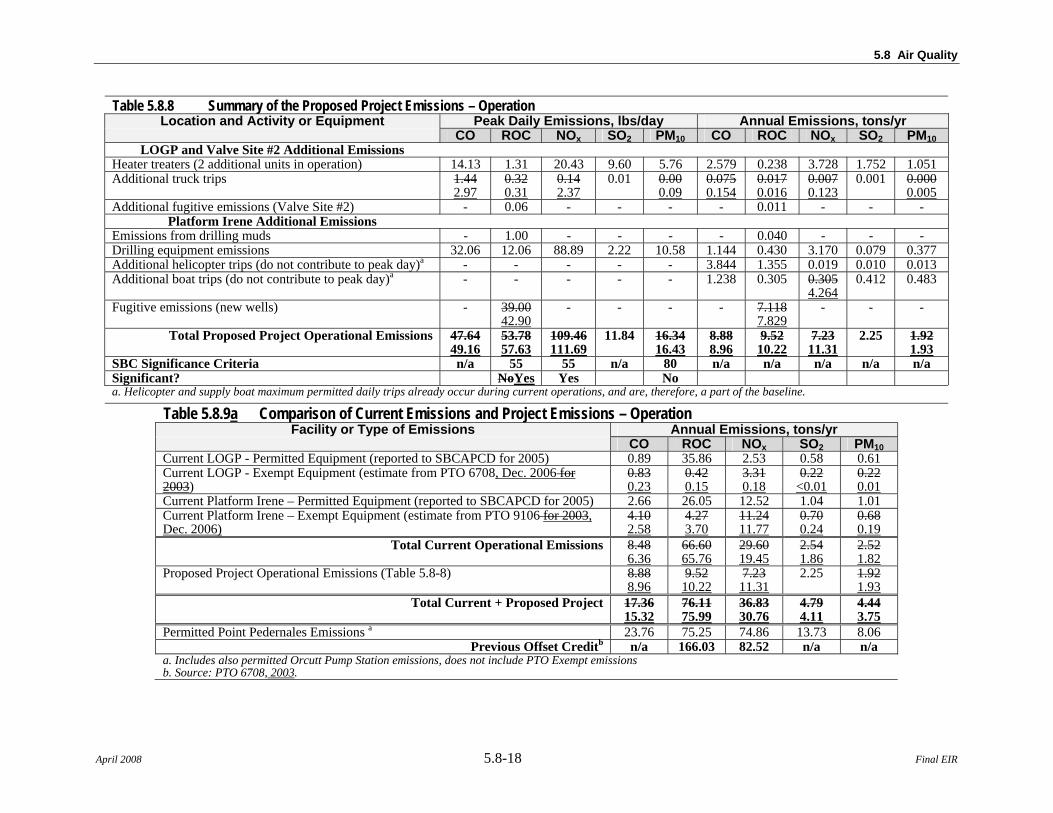
Criteria Pollutants The project would generate air emissions above the current emissions from the existing facilities that are significant because the peak day emissions of NOx are estimated to be considerably higher than the significance trigger of 55 lbs/day and total ROC emissions would be over 55 lbs/day. See Table 5.8.8 for the summary of the proposed project emissions.
Table 5.8.9a compares the current Point Pedernales Project emissions and the proposed project air emissions with the offsets that are presently in place for the Point Pedernales Project. The SBC-approved FDP requires that the permitted NOx and ROC emissions from the FDP be mitigated at a ratio of at least 1:1. Table 5.8.9a shows that previous Emission emission offsets are in place at the required permitted to mitigate the current plus project-related emissions level. The current Point Pedernales Project emissions of NOx and ROC that include the permitted and exempt emissions (including emissions from trucks, helicopters and PTO exempt equipment) are within the previous offset credit. If the proposed project estimated emissions are added to the current Point Pedernales Project actual emissions, the resulting total emissions are still within the previous offset credit provided for NOx and ROC according to the FDP requirement. The proposed project emissions from the LOGP heater treaters are already accounted for in the current would also be within the allowable PTO emission limits and are covered by offsets originally assigned to the facility., and any new ROC emissions as a result of the project will be subject to offset requirements per APCD rules. Also, as shown in Section 1.2, the APCD would need to approve PTO changes for the equipment changes and higher oil and gas throughput associated with the proposed project. Oil and gas production and processing facilities could produce emissions that have unpleasant odors and are a nuisance to the public. The changes in the equipment, the increased oil and gas production and the higher oil and gas throughput due to the project would not significantly increase the odorous emissions from the project facilities (fugitive emissions are only minimally increased over current fugitive emissions). Therefore, the proposed project would not increase existing odor or other air quality nuisance problems. The project is expected to generate fewer vehicle trips than the trigger for CO modeling of 800 daily trips, thus modeling is not required. The proposed project operational ROC and NOx estimated emissions are higher than the significance trigger of 55 lbs/day. Emissions reductions would be required for NOx to mitigate this impact. Previous offset credits provide sufficient reductions to mitigate current plus project NOx emissions. In additionHowever, offsets would be required for ROC emissions by the SBCAPCD as part of the PTO.
5.8 Air Quality
April 2008 5.8-18 Final EIR
Table 5.8.8 Summary of the Proposed Project Emissions – Operation Location and Activity or Equipment Peak Daily Emissions, lbs/day Annual Emissions, tons/yr
CO ROC NOx SO2 PM10 CO ROC NOx SO2 PM10 LOGP and Valve Site #2 Additional Emissions
Heater treaters (2 additional units in operation) 14.13 1.31 20.43 9.60 5.76 2.579 0.238 3.728 1.752 1.051 Additional truck trips 1.44
2.97 0.32 0.31
0.14 2.37
0.01 0.00 0.09
0.0750.154
0.0170.016
0.0070.123
0.001 0.0000.005
Additional fugitive emissions (Valve Site #2) - 0.06 - - - - 0.011 - - - Platform Irene Additional Emissions
Emissions from drilling muds - 1.00 - - - - 0.040 - - - Drilling equipment emissions 32.06 12.06 88.89 2.22 10.58 1.144 0.430 3.170 0.079 0.377 Additional helicopter trips (do not contribute to peak day)a - - - - - 3.844 1.355 0.019 0.010 0.013 Additional boat trips (do not contribute to peak day)a - - - - - 1.238 0.305 0.305
4.264 0.412 0.483
Fugitive emissions (new wells) - 39.0042.90
- - - - 7.118 7.829
- - -
Total Proposed Project Operational Emissions 47.6449.16
53.7857.63
109.46111.69
11.84 16.3416.43
8.88 8.96
9.52 10.22
7.23 11.31
2.25 1.92 1.93
SBC Significance Criteria n/a 55 55 n/a 80 n/a n/a n/a n/a n/a Significant? NoYes Yes No a. Helicopter and supply boat maximum permitted daily trips already occur during current operations, and are, therefore, a part of the baseline.
Table 5.8.9a Comparison of Current Emissions and Project Emissions – Operation Facility or Type of Emissions Annual Emissions, tons/yr
CO ROC NOx SO2 PM10 Current LOGP - Permitted Equipment (reported to SBCAPCD for 2005) 0.89 35.86 2.53 0.58 0.61 Current LOGP - Exempt Equipment (estimate from PTO 6708, Dec. 2006 for 2003)
0.83 0.23
0.42 0.15
3.31 0.18
0.22 <0.01
0.22 0.01
Current Platform Irene – Permitted Equipment (reported to SBCAPCD for 2005) 2.66 26.05 12.52 1.04 1.01 Current Platform Irene – Exempt Equipment (estimate from PTO 9106 for 2003, Dec. 2006)
4.10 2.58
4.27 3.70
11.24 11.77
0.70 0.24
0.68 0.19
Total Current Operational Emissions 8.48 6.36
66.60 65.76
29.60 19.45
2.54 1.86
2.52 1.82
Proposed Project Operational Emissions (Table 5.8-8) 8.88 8.96
9.52 10.22
7.23 11.31
2.25 1.92 1.93
Total Current + Proposed Project 17.36 15.32
76.11 75.99
36.83 30.76
4.79 4.11
4.44 3.75
Permitted Point Pedernales Emissions a 23.76 75.25 74.86 13.73 8.06 Previous Offset Creditb n/a 166.03 82.52 n/a n/a
a. Includes also permitted Orcutt Pump Station emissions, does not include PTO Exempt emissions b. Source: PTO 6708, 2003.
5.8 Air Quality
April 2008 5.8-19 Final EIR
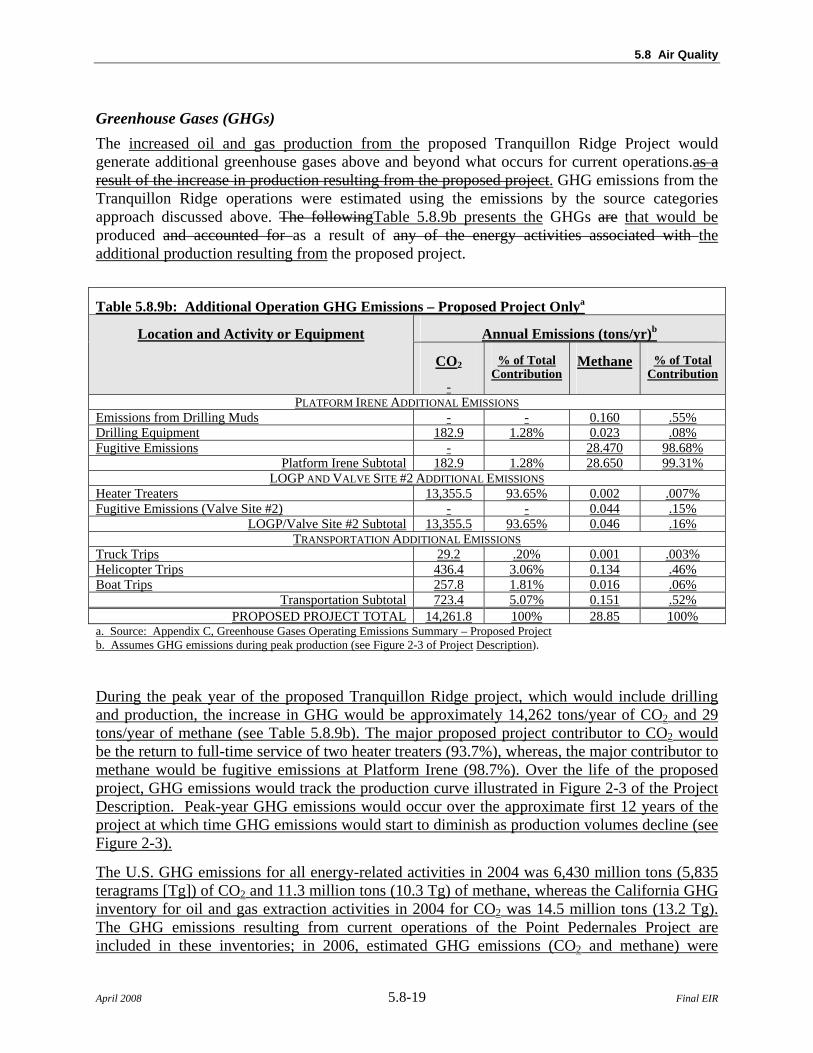
Greenhouse Gases (GHGs) The increased oil and gas production from the proposed Tranquillon Ridge Project would generate additional greenhouse gases above and beyond what occurs for current operations.as a result of the increase in production resulting from the proposed project. GHG emissions from the Tranquillon Ridge operations were estimated using the emissions by the source categories approach discussed above. The followingTable 5.8.9b presents the GHGs are that would be produced and accounted for as a result of any of the energy activities associated with the additional production resulting from the proposed project.
Table 5.8.9b: Additional Operation GHG Emissions – Proposed Project Onlya
Annual Emissions (tons/yr)b Location and Activity or Equipment
CO2
-
% of Total Contribution
Methane
% of Total Contribution
PLATFORM IRENE ADDITIONAL EMISSIONS Emissions from Drilling Muds - - 0.160 .55% Drilling Equipment 182.9 1.28% 0.023 .08% Fugitive Emissions - 28.470 98.68%
Platform Irene Subtotal 182.9 1.28% 28.650 99.31% LOGP AND VALVE SITE #2 ADDITIONAL EMISSIONS
Heater Treaters 13,355.5 93.65% 0.002 .007% Fugitive Emissions (Valve Site #2) - - 0.044 .15%
LOGP/Valve Site #2 Subtotal 13,355.5 93.65% 0.046 .16% TRANSPORTATION ADDITIONAL EMISSIONS
Truck Trips 29.2 .20% 0.001 .003% Helicopter Trips 436.4 3.06% 0.134 .46% Boat Trips 257.8 1.81% 0.016 .06%
Transportation Subtotal 723.4 5.07% 0.151 .52% PROPOSED PROJECT TOTAL 14,261.8 100% 28.85 100%
a. Source: Appendix C, Greenhouse Gases Operating Emissions Summary – Proposed Project b. Assumes GHG emissions during peak production (see Figure 2-3 of Project Description).
During the peak year of the proposed Tranquillon Ridge project, which would include drilling and production, the increase in GHG would be approximately 14,262 tons/year of CO2 and 29 tons/year of methane (see Table 5.8.9b). The major proposed project contributor to CO2 would be the return to full-time service of two heater treaters (93.7%), whereas, the major contributor to methane would be fugitive emissions at Platform Irene (98.7%). Over the life of the proposed project, GHG emissions would track the production curve illustrated in Figure 2-3 of the Project Description. Peak-year GHG emissions would occur over the approximate first 12 years of the project at which time GHG emissions would start to diminish as production volumes decline (see Figure 2-3).
The U.S. GHG emissions for all energy-related activities in 2004 was 6,430 million tons (5,835 teragrams [Tg]) of CO2 and 11.3 million tons (10.3 Tg) of methane, whereas the California GHG inventory for oil and gas extraction activities in 2004 for CO2 was 14.5 million tons (13.2 Tg). The GHG emissions resulting from current operations of the Point Pedernales Project are included in these inventories; in 2006, estimated GHG emissions (CO2 and methane) were

5.8 Air Quality
April 2008 5.8-20 Final EIR
11,762 tons/year for LOGP and Platform Irene. The Tranquillon Ridge project operations would add very little GHGs to the U.S. and California inventories (see Table 5.8.9cb) and, potentially, could reduce overall greenhouse gas emissions if it displaced another source of oil with higher emissions (e.g., imported oil).
• CO2 emissions from fuel combustion due to transportation activities (e.g., supply boat, LPG/NGL/sulfur trucks, trucks for transport of project-generated wastes to a disposal facility)
• SO2 emissions from fuel combustion due to transportation activities (same transportation activities as for CO2 emissions).
• NOx emissions from fuel combustion due to transportation activities (same transportation activities as for CO2 emissions).
During the peak year of the proposed Tranquillon Ridge Project, which would include drilling and production, the increase in GHG would be approximately 15,000 tons of CO2, 29 tons of methane, 7 tons of NOx, and 2 tons of SO2. This compares with U.S. GHG emissions for all energy related activities in 2004 of 6,430 million tons (5,835 Tg) of CO2, 11.3 million tons (10.3 Tg) of methane, and 198 million tons (0.18 Tg) of N2O. The Tranquillon Ridge project operations would add very little GHGs to the U.S. inventory (less than 0.0002 percent). Table 5.8.9cb Comparison of GHG Emissions Inventory and Project Emissions – Operation
Source Category
CO2 (tons/yr)
CH4Methane (tons/yr)
U.S. Energy-Related Activities in 2004 a 6.43 x 10⁹ 11.3 x 10⁶ California-wide Oil and Gas Extraction in 2004 b 14.5 x 10⁶ na Proposed Project during Peak Year c 15.3 14.3 x 10³ 29 Percentage of Proposed Project contribution to U.S. and California-wide Oil and Gas Extraction in 2004
U.S.: 0.0002% CA: 0.1 .11%
U.S.: 0.0003% CA: na
Sources: a. U.S. EPA, 2006. b. CEC, 2006. Subset of Energy Industrial Sector reported in CO2-equivalent tons, which includes the effects of methane, and includes current Pt. Pedernales GHG emissions. c. SeeAppendix C. Proposed project includes drilling equipment, helicopter, and boat emissions at Platform Irene, heater emissions from LOGP, and fugitive emissionsTable 5.8.9b. na: Not Available
The crude oil would most likely be refined initially at the Santa Maria Refinery , but could be potentially and then transported to Bay Area facilities for additional refining and distribution. These refineries produce a number of petroleum products (such as gasoline, jet fuel, diesel fuel, asphalt, etc.), using crude oil as the primary feed stock. As discussed in Section 5.16, Energy and Mineral Resources, in 2005, California’s petroleum refineries processed approximately 674,276,000 barrels of crude oil into a variety of products, with gasoline representing about half of the total product volume. In 2005, California oil refineries received 39.5% or 266,052,000 barrels of crude from Californian petroleum sources and 60.5% or 408,224,000 barrels from imported sources outside of California. At peak Tranquillon Ridge Field production (27,000 barrels per day), annual production would reach 9,855 thousand barrels or approximately 3.7% of annual California production (266,052 thousand barrels in 2005), representing about 1.5% of the crude oil received by California refineries (674,276,000 barrels in 2005).
The end use of the fossil fuel produced from the proposed Tranquillon Ridge project would also generate GHGs, but would not it is too speculative to conclude that the proposed project would result in any overall change to the U.S. or California GHG inventories inventory. Rather than

5.8 Air Quality
April 2008 5.8-21 Final EIR
estimating GHG emissions from a myriad of possible future end uses, the GHG emissions from end use combustion of the project’s 5 mmscfd of natural gas2 and the various petroleum products yielded from the peak production of 27,000 barrels per day3 were estimated based on full oxidation of the natural gas and crude oil that would be produced by the proposed project. This approach results in an estimated 5.38 million tons of CO2 (4.88 Tg of CO2) per year (CCAR 2007, U.S. EPA 2007). This is a gross estimate of GHG emissions from the eventual use of crude oil and natural gas generated by the proposed project. Determining the exact products yielded and emissions throughout the production period is speculative depending on the refineries processing the oil and the ultimate consumption of the products.
GHG emissions from the Tranquillon Ridge project could be offset by reducing GHG emissions from existing PXP sources or other activities related to oil and gas production. PXP could decommission or retrofit control measures for other facilities currently emitting greenhouse gases. In addition, opportunities for GHG control at Platform Irene or LOGP include reducing methane venting and leaks, capturing waste gas instead of flaring, electrifying stationary sources, retrofitting platform crane engines from liquid fuel to bio-fuel or natural gas firing, retrofitting process heaters to ultra-low emitting units, or improving energy efficiency of equipment or vessels. For example, cogeneration power at LOGP could offset up to 3.5 megawatts of electricity otherwise generated by the utilities, which may eliminate as much as about 10,000 tons of CO2 annually that would otherwise be emitted by the electricity generators. Carbon capture and sequestration from combustion sources at LOGP may also be an economically viable option if enhanced oil production can be accomplished by injecting the GHG emissions into the wells. However, it is not generally known whether this type of sequestration would permanently prevent release of carbon dioxide. Determining the net GHG reductions that could be achieved through sequestration would require additional study because of the high level of energy demanded by sequestration and uncertainties about the permanence of storage. Other potential GHG offsetting measures may include PXP’s contribution to a carbon offset fund and to reforestation and habitat restoration efforts. Before implementing any of these options, PXP would need to conduct a review of its existing GHG emissions. GHG reduction options would then need to be compared and ranked for relative capital costs, GHG abatement amounts, and feasibility. The magnitude of actual GHG reductions possible from existing Platform Irene and LOGP sources would likely be small compared to the estimated GHG emissions from end-use combustion of the project’s natural gas and petroleum products.
PXP has committed to preparing a greenhouse gas audit of its project facilities and to implementing feasible measures at those facilities to reduce GHG emissions, up to a total cost of $20 per ton of GHG emissions attributable to Tranquillon Ridge project operations for one year (14,925.35 tons CO2 = $298,507). PXP will measure, and the SBCAPCD will verify, residual GHG emissions that would occur after implementation of the measures identified in the greenhouse gas audit. PXP will then offset these residual emissions each year at a rate of $10 2 CO2 from end use of natural gas: (5 x 10⁶ scf/day)*(1,030 Btu/scf)*(53.05 kg CO2/106 Btu)*(365 day/yr)*(1.102 ton/103 kg) = = 99.72 x 10⁶ kg CO2/yr = 0.099 million metric tons CO2/yr = 109,900 ton CO2/yr 3 CO2 from end use of crude oil, assuming 16 degrees API (or specific gravity of 0.959): (27,000 bbl/day)*(42 gal/bbl)*(0.959*8.337 lb/gal)*(0.868 lb C/lb)*(44 lb CO2/12 lb C)*(365 day/yr) = = 10,530 x 106 lb CO2/yr = 4.779 million metric tons CO2/yr = 5,266,000 ton CO2/yr

5.8 Air Quality
April 2008 5.8-22 Final EIR
per ton (in 2008 dollars) for the life of the project. The annual funds will be offered to an entity such as the Climate Trust or California Wildfire ReLeaf for GHG mitigation projects.
Mandatory GHG emission reporting may be required as a result of rulemaking expected to occur by 2008 under the California Global Warming Solutions Act of 2006 (AB 32). The California Climate Action Team’s Report to the Governor also indicates that a model rule to reduce venting and leaks in oil and gas systems would be developed to be considered for adoption by local air districts (CalEPA, 2006); however, the SBCAPCD’s Fugitive Inspection and Maintenance rule (Rule 331) already requires reduction of venting and leaks. Project-related facilities could be subject to these requirements. In addition, PXP would likely be affected by future mandatory improvements in transportation energy efficiency (fuel economy) and alternatives to petroleum-based fuels for their truck and boat trips. GHG emission reductions required as a result of the rules and regulations under AB 32 could occur as early as 2009 (CARB, 2006). Section 5.8.2.2 identifies how this rulemaking activity will reduce the potential impacts of GHG emissions.
Mitigation Measures
Air-2 PXP shall ensure that emission reductions are provided to fully mitigate increases in operational criteria pollutant emissions associated with the proposed project consistent with SBCAPCD Rules and Regulations. The documentation supporting the available emission mitigations for operations shall be submitted to the SBCAPCD prior to land use clearance. No operations shall occur until the applicable project Permits to Operate are modified.
Residual Impact Emissions would be less than the SBC significance criteria with the application of mitigations. Therefore, the operational air quality impacts are considered to be significant but mitigable (Class II). As the emissions in the years beyond the previously expected life of the Point Pedernales Project would be below the significance criteria (after the application of mitigation), the impacts due to extension of life are also considered to be significant but mitigable (Class II). Impact # Impact Description Phase Residual
Impact Air.3 Increased health risks from the increased air emissions
due to the expected increase in equipment operation and oil volumes processed.
Increased Throughput Extension of Life
Class III
A health risk assessment is not required for Platform Irene as per PTO 9106, Section 6.4. Health risk from Hazardous Air Pollutants (HAPs) is evaluated based on the population that is continuously exposed to the emissions of HAPs. The platform is located offshore, therefore no permanent population would be continuously exposed to the HAPs.
For the LOGP facility, a cancer risk of approximately 0.1 per million, occurring on the site’s property boundary, was estimated by the SBCAPCD based on the 1992 HAPs inventory. This cancer risk is primarily due to emissions of benzene and acrolein. In addition, chronic and acute non-carcinogenic risks, or hazard indices, were estimated to be 0.008 and 0.2, respectively.
The current LOGP estimated emissions of HAPs (based on the 1994 AB2588 Toxic Inventory) are given in Part 70 PTO 6708 (see Appendix C). These emissions were estimated based on the
5.8 Air Quality
April 2008 5.8-23 Final EIR
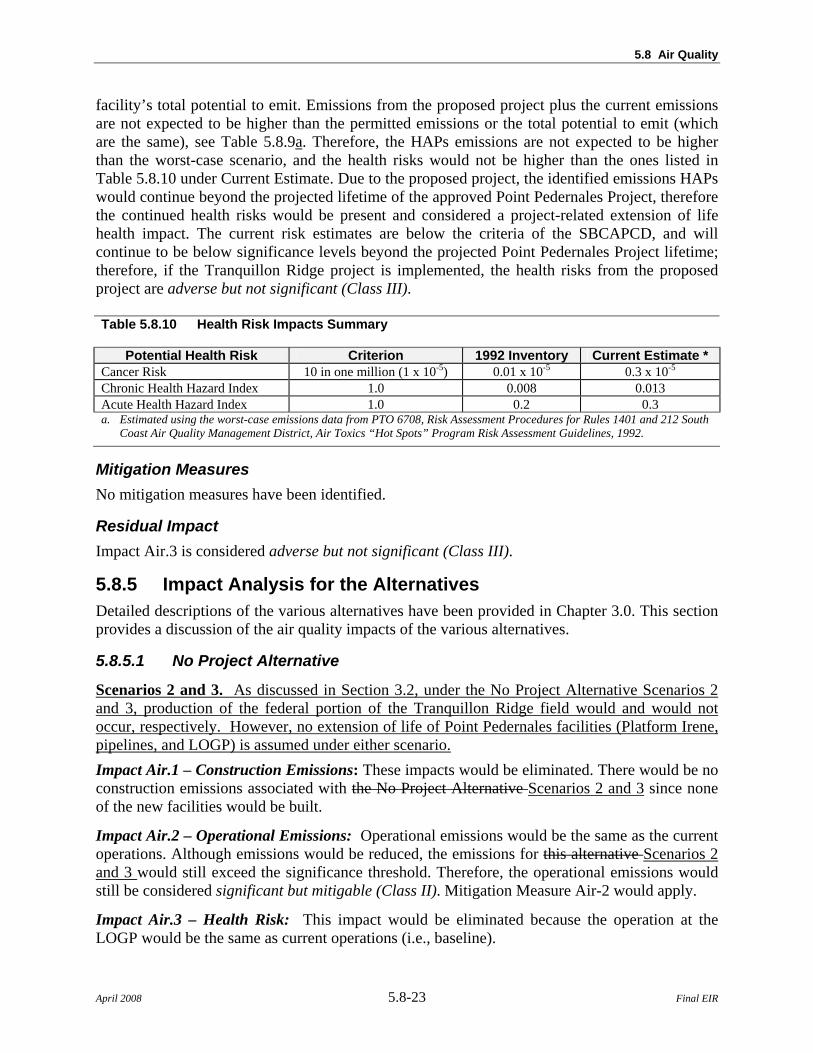
facility’s total potential to emit. Emissions from the proposed project plus the current emissions are not expected to be higher than the permitted emissions or the total potential to emit (which are the same), see Table 5.8.9a. Therefore, the HAPs emissions are not expected to be higher than the worst-case scenario, and the health risks would not be higher than the ones listed in Table 5.8.10 under Current Estimate. Due to the proposed project, the identified emissions HAPs would continue beyond the projected lifetime of the approved Point Pedernales Project, therefore the continued health risks would be present and considered a project-related extension of life health impact. The current risk estimates are below the criteria of the SBCAPCD, and will continue to be below significance levels beyond the projected Point Pedernales Project lifetime; therefore, if the Tranquillon Ridge project is implemented, the health risks from the proposed project are adverse but not significant (Class III). Table 5.8.10 Health Risk Impacts Summary
Potential Health Risk Criterion 1992 Inventory Current Estimate * Cancer Risk 10 in one million (1 x 10⁻⁵) 0.01 x 10⁻⁵ 0.3 x 10⁻⁵ Chronic Health Hazard Index 1.0 0.008 0.013 Acute Health Hazard Index 1.0 0.2 0.3 a. Estimated using the worst-case emissions data from PTO 6708, Risk Assessment Procedures for Rules 1401 and 212 South
Coast Air Quality Management District, Air Toxics “Hot Spots” Program Risk Assessment Guidelines, 1992.
Mitigation Measures No mitigation measures have been identified.
Residual Impact Impact Air.3 is considered adverse but not significant (Class III).
5.8.5 Impact Analysis for the Alternatives Detailed descriptions of the various alternatives have been provided in Chapter 3.0. This section provides a discussion of the air quality impacts of the various alternatives.
5.8.5.1 No Project Alternative
Scenarios 2 and 3. As discussed in Section 3.2, under the No Project Alternative Scenarios 2 and 3, production of the federal portion of the Tranquillon Ridge field would and would not occur, respectively. However, no extension of life of Point Pedernales facilities (Platform Irene, pipelines, and LOGP) is assumed under either scenario. Impact Air.1 – Construction Emissions: These impacts would be eliminated. There would be no construction emissions associated with the No Project Alternative Scenarios 2 and 3 since none of the new facilities would be built.
Impact Air.2 – Operational Emissions: Operational emissions would be the same as the current operations. Although emissions would be reduced, the emissions for this alternative Scenarios 2 and 3 would still exceed the significance threshold. Therefore, the operational emissions would still be considered significant but mitigable (Class II). Mitigation Measure Air-2 would apply.
Impact Air.3 – Health Risk: This impact would be eliminated because the operation at the LOGP would be the same as current operations (i.e., baseline).

5.8 Air Quality
April 2008 5.8-24 Final EIR
Options for Meeting California Fuel Demand. The relative air quality impacts associated with the various options for meeting California fuel demand are summarized in Table 5.8.11.
Table 5.8.11 No Project Alternative Comparison to Options for Meeting California Fuel Demand, Air Quality
Source of Energy Impacts
Other Conventional Oil & Gas Domestic onshore crude oil and gas Likely to displace air quality impacts. Increased marine tanker imports of crude oil Air quality impacts would be greater because crude
would be transported via tanker instead of pipeline. Increased gasoline imports1 Production impacts would be displaced. If gasoline
imported via tanker trucks, air quality impacts would be greater.
Increased natural gas imports (LNG)
Air quality impacts would increase with LNG tankering and/or development of offshore ports.
Alternatives to Oil and Gas Fuel Demand Reduction: increased fuel efficiencies, conservation, electrification2
Alternative transportation modes Proposed project impacts would be eliminated. Implementation of regulatory measures Proposed project impacts would be eliminated. Coal, Nuclear, Hydroelectric Proposed project impacts would be eliminated. Facility
construction could result in air quality impacts. Coal transportation to power plants would result in increased emissions and coal combustion would result in increased emissions in comparison to oil and gas. Nuclear facility operations would result in emissions.
Alternative Transportation Fuels Ethanol/Biodiesel3
Ethanol feed-stock production and ethanol transportation would result in increased emissions.
Hydrogen2
Proposed project impacts would be eliminated. Fuel burned for hydrogen production would result in emissions.
Other Energy Resources2 Solar2,4
Proposed project impacts would be eliminated. Construction of solar facility infrastructure could result in air quality impacts. Emissions due to operations would be nominal in comparison to oil and gas.
Wind2,4
Proposed project impacts would be eliminated. Construction of wind facility infrastructure could result in air quality impacts. Emissions due to operations would be nominal in comparison to oil and gas.
Wave2,4
Proposed project impacts would be eliminated. Construction of wave facility infrastructure could result in air quality impacts. Emissions due to operations would be nominal in comparison to oil and gas.
Footnotes: 1. Pipeline and tanker truck import from out-of-State assumed. 2. Assumes that Tranquillon Ridge production would not be replaced with other petroleum-based energy supply. 3. Assumes ethanol and biodiesel used as blends only and therefore would reduce, but not eliminate Tranquillon Ridge
or equivalent production. 4. Assumes, large centralized facilities.
5.8 Air Quality
April 2008 5.8-25 Final EIR
5.8.5.2 VAFB Onshore Alternative The VAFB Onshore Alternative would include the construction of the drilling and production facilities within a 25-acre site, and installation of approximately 10 miles of emulsion and gas pipelines and 6 miles of overhead 69 kV transmission line and associated substation. In addition, a pipeline tie-in station and associated power line and substation would be required. These facilities would be operating for approximately 30 years. The air quality impacts associated with this alternative are described below.
Impact Air.1 – Construction Emissions: Construction impacts would cause substantial quantities of additional air emissions for the alternative drilling and production facilities, pipelines, tie-in station, and transmission power lines, and substations. Construction of the VAFB Onshore Alternative facilities would involve site and right-of-way grading, activity on dirt roads and disturbed areas, equipment transport, worker transport, and use of heavy equipment. Emissions from offshore construction under the proposed project would not occur. However, LOGP modifications would still occur. It is assumed that construction of the VAFB Onshore Alternative facilities would generate similar emissions as original construction of the LOGP facility and pipelines. As described for the Casmalia East Oil Field Processing Alternative, construction of the Lompoc HS&P facility and pipelines caused emissions that warranted implementation of feasible mitigation measures for NOx and ROC. PM10 emissions could be mitigated by using the available dust controls in Mitigation Measure Air-1. Because the construction activities would be short-term, it is expected that construction of the drilling and production facility, pipelines, and transmission line would have adverse but not significant air quality impacts (Class III).
In accordance with County AQAP policies, the following mitigation measures are recommended to mitigate Impact Air.1 to the maximum extent feasible.
Mitigation Measures Mitigation Measure Air-1 would apply, in addition to the following mitigation measures:
Air-3 PXP shall implement the following SBC NOx reduction emissions measures: - Engines and emission systems shall be maintained, - High pressure fuel injectors shall be installed, and - Reformulated diesel fuel shall be used.
The documentation supporting the implementation of the NOx reduction measures shall be submitted to the SBC P&D and the SBCAPCD prior to land use clearance. No operations shall occur until the applicable project Permits to Operate are modified.
Air-4 PXP shall provide emission mitigations for the construction activities consistent with SBCAPCD Rules and Regulations. The documentation supporting the available emission mitigations for construction shall be submitted to the SBCAPCD and SBC P&D prior to land use clearance. No operations shall occur until the applicable project Permits to Operate are modified.
Residual Impact The residual impacts of this alternative would be considered to be adverse but not significant (Class III).
5.8 Air Quality
April 2008 5.8-26 Final EIR
Impact Air.2 – Operational Emissions: Operation of the drilling and production facility would involve fuel consumption and the associated combustion emissions for drilling wells, oil and gas production and transport, produced water handling, and other utility functions. Similar to drilling equipment emissions shown for the proposed project (Table 5.8.8) and current emissions from LOGP and Platform Irene (Table 5.8.9a), peak daily emissions of the VAFB Onshore Alternative drilling and production facility would exceed the significance threshold and trigger the need for offsets under SBCAPCD rules. Fugitive emissions would also occur with the wells. Operational emissions at Platform Irene under this alternative would be less than under the proposed project because drilling activity, helicopter and boat emissions would not be necessary. Although some emissions of the proposed project would not occur under this alternative, the emissions for this alternative would still be expected to exceed the significance threshold due to the new sources related to onshore drilling and production. The SBCAPCD would require permits and mitigation for new stationary source emissions associated with the alternative drilling and production facility. Therefore, the operational emissions would still be considered significant but mitigable (Class II). Mitigation Measure Air-2 would apply.
Impact Air.3 – Health Risk: This impact as it relates to alternative operations would be similar to that which would occur under the proposed project, since the alternative drilling and production facility would be surrounded by unpopulated portions of the military base. Because health risk impacts are based on the population that is continuously exposed to the emissions of HAPs or air toxics, and no permanent population would be continuously exposed to the HAPs, the health risks from the VAFB Onshore Alternative site would be adverse but not significant. Accidental release of HAPs from the onshore drilling and production facility would be subject to SBCAPCD permitting requirements, which may require additional analysis of health risks. The current risk estimates for LOGP are below the criteria of the SBCAPCD, and will continue to be below significance levels beyond the projected Point Pedernales Project lifetime, therefore the health risks from the VAFB Onshore Alternative, including modifications to LOGP, are adverse but not significant (Class III).
The federal Installation Restoration Program (IRP) is implemented at DOD facilities to identify, characterize, and restore hazardous substance release sites. There are currently 136 IRP sites throughout VAFB. The IRP sites are remediated through the Federal Facilities Site Remediation Agreement (FFSRA), a working agreement between the USAF, the RWQCB – Central Region, and the Department of Toxic Substances Control. In addition to IRP sites, there are areas identified as Areas of Concern (AOCs), where potential hazardous material releases are suspected; and Areas of Interest (AOIs), defined as areas with the potential for use and/or presence of a hazardous substance. Activities associated with the installation of an onshore drilling operation and associated pipeline may encounter contaminated soils or sites in at least two locations (Ryan, August 28, 2006). Disturbance of these locations during construction could pose potential health risks to construction personnel. With implementation of Mitigation Measure OWR-12, this impact is considered significant but mitigable (Class II).
5.8.5.3 Casmalia East Oil Field Processing Location If this alternative is selected, a more detailed air quality impacts evaluation would be necessary. Impacts Air.1, Air.2, and Air.3 would change as described below.
Impact Air.1 - Construction Emissions: It is assumed that construction of the new facility at Casmalia East site would generate similar emissions as construction of the LOGP facility.
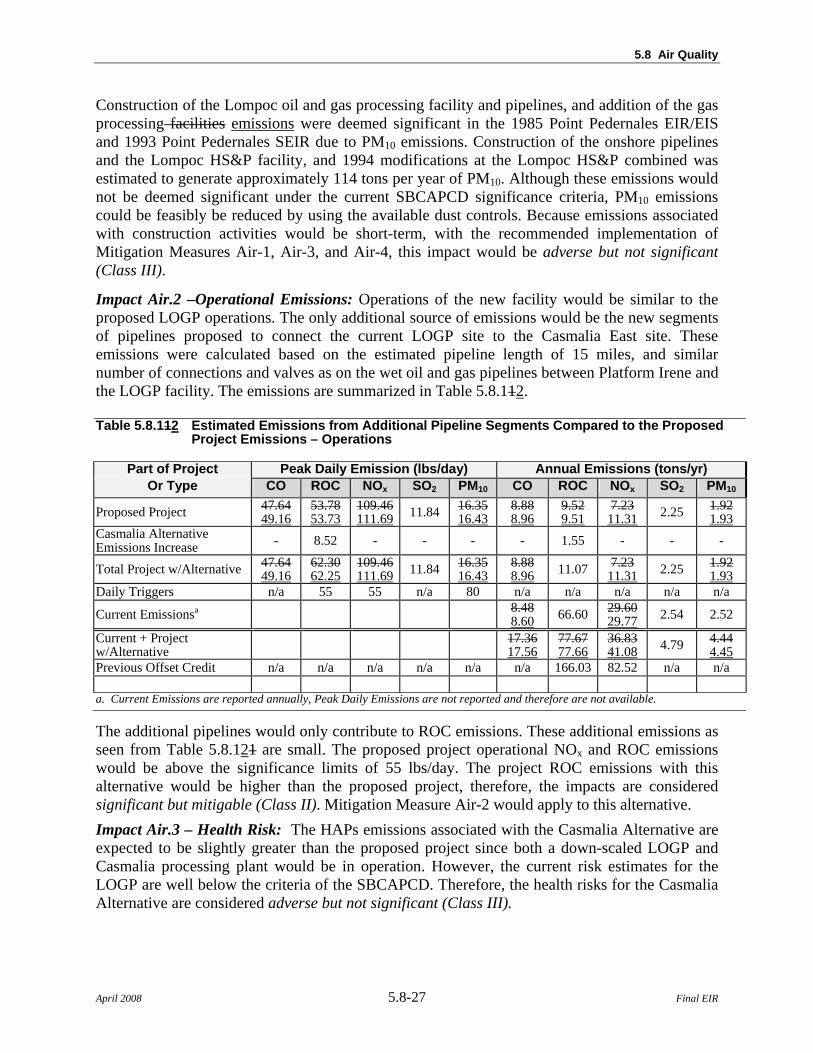
5.8 Air Quality
April 2008 5.8-27 Final EIR
Construction of the Lompoc oil and gas processing facility and pipelines, and addition of the gas processing facilities emissions were deemed significant in the 1985 Point Pedernales EIR/EIS and 1993 Point Pedernales SEIR due to PM10 emissions. Construction of the onshore pipelines and the Lompoc HS&P facility, and 1994 modifications at the Lompoc HS&P combined was estimated to generate approximately 114 tons per year of PM10. Although these emissions would not be deemed significant under the current SBCAPCD significance criteria, PM10 emissions could be feasibly be reduced by using the available dust controls. Because emissions associated with construction activities would be short-term, with the recommended implementation of Mitigation Measures Air-1, Air-3, and Air-4, this impact would be adverse but not significant (Class III).
Impact Air.2 –Operational Emissions: Operations of the new facility would be similar to the proposed LOGP operations. The only additional source of emissions would be the new segments of pipelines proposed to connect the current LOGP site to the Casmalia East site. These emissions were calculated based on the estimated pipeline length of 15 miles, and similar number of connections and valves as on the wet oil and gas pipelines between Platform Irene and the LOGP facility. The emissions are summarized in Table 5.8.112. Table 5.8.112 Estimated Emissions from Additional Pipeline Segments Compared to the Proposed
Project Emissions – Operations
Part of Project Peak Daily Emission (lbs/day) Annual Emissions (tons/yr) Or Type CO ROC NOx SO2 PM10 CO ROC NOx SO2 PM10
Proposed Project 47.64 49.16
53.7853.73
109.46111.69 11.84 16.35
16.43 8.88 8.96
9.52 9.51
7.23 11.31 2.25 1.92
1.93 Casmalia Alternative Emissions Increase - 8.52 - - - - 1.55 - - -
Total Project w/Alternative 47.64 49.16
62.3062.25
109.46111.69 11.84 16.35
16.43 8.88 8.96 11.07 7.23
11.31 2.25 1.92 1.93
Daily Triggers n/a 55 55 n/a 80 n/a n/a n/a n/a n/a
Current Emissionsa 8.48 8.60 66.60 29.60
29.77 2.54 2.52
Current + Project w/Alternative 17.36
17.56 77.67 77.66
36.83 41.08 4.79 4.44
4.45 Previous Offset Credit n/a n/a n/a n/a n/a n/a 166.03 82.52 n/a n/a a. Current Emissions are reported annually, Peak Daily Emissions are not reported and therefore are not available.
The additional pipelines would only contribute to ROC emissions. These additional emissions as seen from Table 5.8.121 are small. The proposed project operational NOx and ROC emissions would be above the significance limits of 55 lbs/day. The project ROC emissions with this alternative would be higher than the proposed project, therefore, the impacts are considered significant but mitigable (Class II). Mitigation Measure Air-2 would apply to this alternative. Impact Air.3 – Health Risk: The HAPs emissions associated with the Casmalia Alternative are expected to be slightly greater than the proposed project since both a down-scaled LOGP and Casmalia processing plant would be in operation. However, the current risk estimates for the LOGP are well below the criteria of the SBCAPCD. Therefore, the health risks for the Casmalia Alternative are considered adverse but not significant (Class III).

5.8 Air Quality
April 2008 5.8-28 Final EIR
5.8.5.4 Alternative Power Line Routes to Valve Site #2 Impacts Air.2 and Air.3 would be the same as the proposed project for all alternative power line routes. Impact Air.1 would change as described below.
Alternative Power Line Route – Option 2a Impact Air.1 – Construction Emissions: Air emissions associated with constructing the power line according to this alternative route are expected to be very similar to the proposed project (see Table 5.8.7). Although the power line would originate from a different point, the length of the route is similar in length to the proposed power line. Therefore, the number of poles to be installed and the number and types of equipment would be the same. The trenching equipment emissions and fugitive dust emissions would be slightly reduced because this alternative does not involve trenching to underground small portions of the power line to avoid interference with the VAFB power lines. Because air emissions due to construction would be less than for the proposed project, due to less trenching, these emissions would also be adverse but not significant; therefore, Impact Air.1 would be not significant (Class III), which is the same as the proposed project. Mitigation Measure Air-1 would apply to this alternative.
Alternative Power Line Route – Option 2b Impact Air.1 – Construction Emissions: This alternative uses the same route as Option 2a except the crossing of the Santa Ynez River would be via an underground bore. Table 5.8.132 presents a summary of construction air emissions for this alternative. It is assumed that in addition to the other construction equipment there would also be a boring rig and a mud-handling pump. The additional equipment is needed to make a boring under the Santa Ynez River. The construction emissions would be slightly higher than for the proposed project due to the boring operations. Table 5.8.132 Summary of Project with Alternative Route Option 2b Emissions – Construction
Location and Total (Annual) Emissions (tons/yr) Construction Activity – Route Option 2b CO ROC NOx SO2 PM10
Proposed Project 11.84 4.79
2.29 0.67
22.10 6.04
2.07 0.46
1.74 0.44
Alternative Route 2b 0.05 0.01 0.06 0.01 0.00 Proposed Project with Alternative 11.89
4.84 2.30 0.68
22.16 6.10
2.07 0.47
1.74 0.44
The construction emissions associated with this alternative would be short-term; therefore, Impact Air.1 is considered adverse but not significant (Class III), which is the same as the proposed project. Mitigation Measure Air-1 would apply to this alternative.
Underground Power Line along Terra Road Impact Air.1 – Construction Emissions: Table 5.8.143 presents a summary of the construction air emissions for this alternative. It is assumed that in addition to the other construction equipment there would also be two backhoes or trenchers, one cable lay crane and two dump trucks, which would contribute to onsite equipment emissions.

5.8 Air Quality
April 2008 5.8-29 Final EIR
The construction emissions associated with this alternative would be short-term; therefore, Impact Air.1 is considered adverse but not significant (Class III), which is the same as the proposed project. Mitigation Measure Air-1 would apply to this alternative. Table 5.8.143 Summary of Proposed Project with Underground Power Line Alternative
Emissions – Construction
Location and Total (Annual) Emissions (tons/yr) Construction Activity – Underground Route CO ROC NOx SO2 PM10
Proposed Project 11.84 4.79
2.29 0.67
22.10 6.04
2.07 0.46
1.74 0.44
Power Line Alternative – Underground, Emissions Increase 0.31 0.08 0.83 0.08 0.19 Total: Proposed Project with Power Line Alternative 12.15
5.10 2.37 0.75
22.93 6.87
2.15 0.54
1.93 0.63
5.8.5.5 Replacement of Oil Emulsion Pipeline from Platform Irene to LOGP Impacts Air.2 and Air.3 would remain the same as for the proposed project. Impact Air.1 would change as discussed below.
Impact Air.1 - Construction Emissions: Emissions would increase due to additional air emissions associated with construction of the replacement pipeline.
Additional air emissions are expected due to removal of the existing emulsion pipeline and construction of the replacement pipeline. The new emulsion pipeline operational air impacts are assumed to be the same as the emissions from the existing pipeline.
The following emissions would be generated during construction of the replacement pipeline: 1. Offshore construction equipment emissions 2. Onshore construction equipment emissions 3. Fugitive dust emissions - onshore only (excavation, stockpiling, travel on unpaved roads) 4. Emissions due to offsite travel
Table 5.8.154 presents a summary of the estimated construction (short-term) air emissions if this alternative is selected. See Appendix C for detailed calculations.
Construction emissions are short-term. To feasibly reduce construction emissions Mitigation Measure Air-1, dust control methods; Mitigation Measure Air-3, NOx reduction measures; and Mitigation Measure Air-4, emission reductions for construction would be recommended. The residual impacts associated with construction emissions are considered adverse but not significant (Class III).
5.8.5.6 Alternative Drill Muds and Cuttings Disposal Impacts Air.1 and Air.3 would be the same as for the proposed project. Impact Air.2 would change as discussed below.
Inject Drill Muds and Cuttings into Reservoir Impact Air.2 – Operational Emissions: This alternative would require a diesel slurry pump and piping connections to an injection well head, modifications that would occur at the platform. Air

5.8 Air Quality
April 2008 5.8-30 Final EIR
emissions would increase due to the need to operate the slurry pump at Platform Irene under this alternative. Emissions due to exhaust vapors from mud-gas separator and mud degasser would still remain the same as in the proposed project. Table 5.8.165 compares the total project emissions from drilling for this alternative. Table 5.8.154 Summary of Emissions due to Replacement of Emulsion Pipeline – Construction
Location and Total Emissions (tons per year) Construction Activity CO ROC NOx SO2 PM10
Onshore Equipment 2.34 0.60 5.65 0.55 0.59 Offshore Equipment 12.49 2.53 28.23 2.34 1.95 Fugitive Dust (onshore only) 0.00 0.00 0.00 0.00 2.01 Offsite – onshore and offshore 2.22 0.56
0.39 3.44 3.32
0.20 0.28 0.25
Total Emissions – from Alternative only 17.05 3.68 3.52
37.32 37.20
3.08 4.82 4.79
Total Emissions – from Proposed Projecta 11.84 4.79
2.29 0.67
22.10 6.04
2.07 0.46
1.74 0.44
Total Emissions – Project with Alternative 28.89 21.85
5.98 4.19
59.42 43.23
5.15 3.54
6.56 5.23
a. See Table 5.8.7. Table 5.8.165 Comparison of Current Emissions to Total Project Emissions with Mud and Cutting
Injection Alternative – Operation
Part of Project Peak Daily Emissions, lbs/day Annual Emissions, tons/yr or Type CO ROC NOx SO2 PM10 CO ROC NOx SO2 PM10
Proposed Project 47.649.2
53.853.7
109.5111.7 11.8 16.3
16.4 8.888.96
9.529.51
7.23 11.31 2.25 1.92
1.93 Mud Injection Alternative 53.4 20.1 148.2 3.7 17.6 5.88 2.21 16.30 0.41 2.65 Total Project w/Mud Injection Alternative
101.1102.6
73.973.8
257.6259.8 15.5 34.0
34.1 14.7614.83 11.73 23.53
27.60 2.66 4.57
Significance Triggers n/a 55 55 n/a 80 n/a n/a n/a n/a n/a
Current Emissionsa 8.488.60 66.60 29.60
29.77 2.54 2.52
Current + Project w/Alt 23.2423.44 78.32 53.13
57.38 5.20 7.09 7.10
Previous Offset Credit n/a n/a n/a n/a n/a n/a 166.03 82.52 n/a n/a a. Current Emissions are reported annually, Peak Daily Emissions are not reported and therefore are not available.
With this alternative, NOx and ROC emissions are expected to be higher than the daily triggers of 55 lbs/day. GHG emissions would be slightly increased as well. Application of Mitigation Measure Air-2 would reduce the emissions to below the significance criteria. Therefore, this impact is considered significant but mitigable (Class II).
Transport Drill Muds and Cuttings to Shore for Disposal Impact Air.2 – Operational Emissions: This section addresses the impacts on air quality due to pollutant emissions associated with transporting of muds and cuttings to shore for disposal. The muds and cuttings would be kept in containers on the platform. The supply boat that delivers materials to Platform Irene would transport these containers back to shore on the return trip.
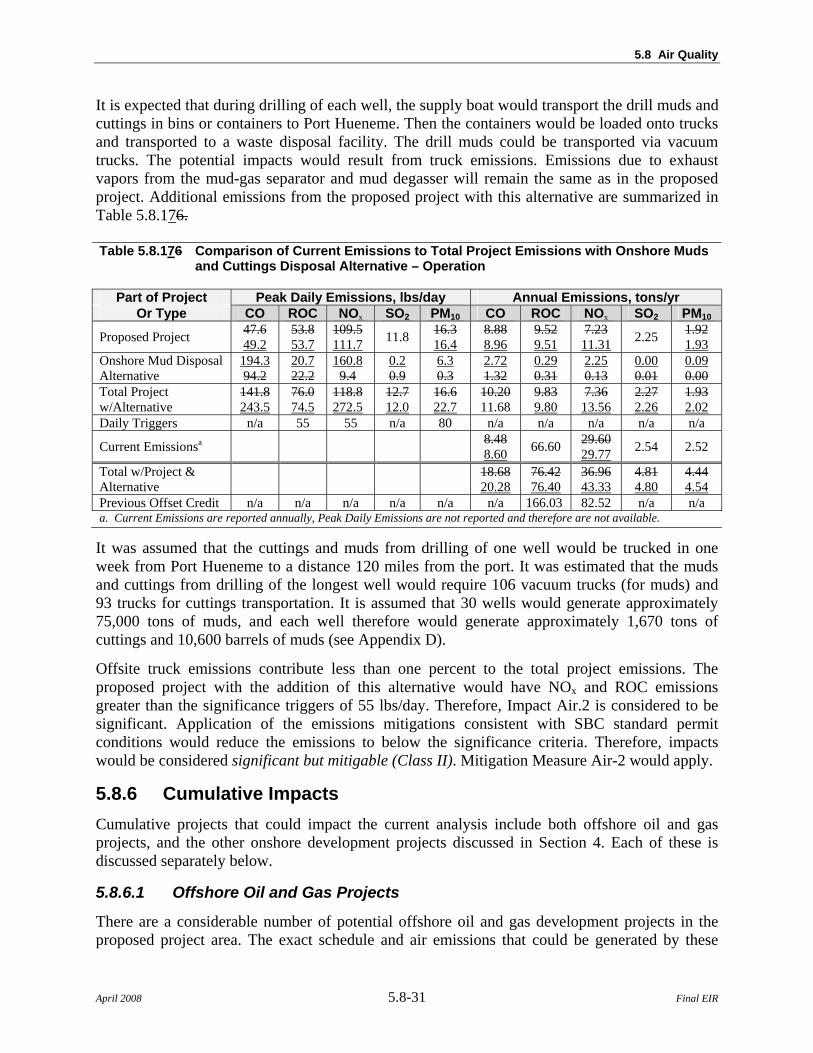
5.8 Air Quality
April 2008 5.8-31 Final EIR
It is expected that during drilling of each well, the supply boat would transport the drill muds and cuttings in bins or containers to Port Hueneme. Then the containers would be loaded onto trucks and transported to a waste disposal facility. The drill muds could be transported via vacuum trucks. The potential impacts would result from truck emissions. Emissions due to exhaust vapors from the mud-gas separator and mud degasser will remain the same as in the proposed project. Additional emissions from the proposed project with this alternative are summarized in Table 5.8.176. Table 5.8.176 Comparison of Current Emissions to Total Project Emissions with Onshore Muds
and Cuttings Disposal Alternative – Operation
Part of Project Peak Daily Emissions, lbs/day Annual Emissions, tons/yr Or Type CO ROC NOx SO2 PM10 CO ROC NOx SO2 PM10
Proposed Project 47.6 49.2
53.8 53.7
109.5111.7 11.8 16.3
16.4 8.88 8.96
9.52 9.51
7.23 11.31 2.25 1.92
1.93 Onshore Mud Disposal Alternative
194.3 94.2
20.7 22.2
160.89.4
0.2 0.9
6.3 0.3
2.72 1.32
0.29 0.31
2.25 0.13
0.00 0.01
0.09 0.00
Total Project w/Alternative
141.8 243.5
76.0 74.5
118.8 272.5
12.712.0
16.6 22.7
10.20 11.68
9.83 9.80
7.36 13.56
2.27 2.26
1.93 2.02
Daily Triggers n/a 55 55 n/a 80 n/a n/a n/a n/a n/a
Current Emissionsa 8.48 8.60 66.60 29.60
29.77 2.54 2.52
Total w/Project & Alternative 18.68
20.28 76.4276.40
36.96 43.33
4.81 4.80
4.44 4.54
Previous Offset Credit n/a n/a n/a n/a n/a n/a 166.03 82.52 n/a n/a a. Current Emissions are reported annually, Peak Daily Emissions are not reported and therefore are not available.
It was assumed that the cuttings and muds from drilling of one well would be trucked in one week from Port Hueneme to a distance 120 miles from the port. It was estimated that the muds and cuttings from drilling of the longest well would require 106 vacuum trucks (for muds) and 93 trucks for cuttings transportation. It is assumed that 30 wells would generate approximately 75,000 tons of muds, and each well therefore would generate approximately 1,670 tons of cuttings and 10,600 barrels of muds (see Appendix D).
Offsite truck emissions contribute less than one percent to the total project emissions. The proposed project with the addition of this alternative would have NOx and ROC emissions greater than the significance triggers of 55 lbs/day. Therefore, Impact Air.2 is considered to be significant. Application of the emissions mitigations consistent with SBC standard permit conditions would reduce the emissions to below the significance criteria. Therefore, impacts would be considered significant but mitigable (Class II). Mitigation Measure Air-2 would apply.
5.8.6 Cumulative Impacts Cumulative projects that could impact the current analysis include both offshore oil and gas projects, and the other onshore development projects discussed in Section 4. Each of these is discussed separately below.
5.8.6.1 Offshore Oil and Gas Projects
There are a considerable number of potential offshore oil and gas development projects in the proposed project area. The exact schedule and air emissions that could be generated by these
5.8 Air Quality
April 2008 5.8-32 Final EIR
projects are uncertain at this time. All of the activities for the potential offshore oil and gas development projects outlined in Sections 4.2 and 4.3 of this document would occur in the same air basin as the Tranquillon Ridge Field development. The majority of air emission impacts would be associated with the installation and operation of new platforms, pipelines, and onshore processing facilities. Construction of the new onshore facilities that may be required for the new offshore oil and gas projects are likely to have short-term air quality impacts. Mitigation measures consistent with County policies such as emission reductions for dust control would be applied, and the cumulative construction emissions would be considered less than significant. The proposed project’s contribution to these cumulative effects would be nominal because of the limited construction proposed.
It is assumed that the operational emissions associated with the potential future offshore oil and gas development projects would be similar to the proposed project’s Platform Irene emissions, as well as its corresponding air emissions at the LOGP. The operation of the cumulative effect of these potential projects would represent a substantial increase in emissions within the air basin. However, in order to obtain a Permit to Operate (PTO) from SBCAPCD, new facilities would be required to offset new emissions increases. If the facilities do not have the required offsets that cover their respective operational emissions, these facilities would not be allowed to operate. However, given the limited available emission reductions in SBC, it may be difficult to permit this level of new emissions. The biggest source of NOx emissions on offshore platforms that generate their own electrical power is associated with turbines used for power generation. Using grid power on the platforms, as is done on Platform Irene, could reduce these emissions. Therefore, cumulative operational emissions, including those associated with the incremental contribution of the proposed project, would not be considered significant if grid power is used.
The proposed project would not be a significant contributor to the cumulative effects on air quality, given the low level of new emissions and the fact that previous offset credits are in place and new offsets will be required for these emissions increases.
Following Executive Order S-3-05 in June 2005, which declared California’s particular vulnerability to climate change, AB 32 was signed by Governor Arnold Schwarzenegger on September 27, 2006. In passing the bill, the California Legislature found that “Global warming poses a serious threat to the economic well-being, public health, natural resources, and the environment of California. The potential adverse impacts of global warming include the exacerbation of air quality problems, a reduction in the quality and supply of water to the state from the Sierra snowpack, a rise in sea levels resulting in the displacement of thousands of coastal businesses and residences, damage to marine ecosystems and the natural environment, and an increase in the incidences of infectious diseases, asthma, and other human health-related problems” (California Health & Safety Code, Division 25.5, Part 1). It is assumed that the GHG emissions associated with the potential future offshore oil and gas development projects would be similar to the proposed project’s Platform Irene emissions, as well as its corresponding GHG emissions at the LOGP and project transportation (trucks, helicopters, and boats). As presented in Table 5.8.9c, the U.S. GHG emissions for all energy related activities in 2004 was 6,430 million tons (5,835 Tg) of CO2 and 11.3 million tons (10.3 Tg) of methane. The proposed project’s contribution during peak production to the U.S. GHG inventory for CO2 would be 0.0002 percent and 0.0003 percent for methane. The California GHG inventory for oil and gas extraction activities in 2004 for CO2 was 14.5 million tons (13.2 Tg). The proposed project’s contribution to the California CO2 emissions would be 0.11 percent. Assuming that GHG

5.8 Air Quality
April 2008 5.8-33 Final EIR
emissions from potential future offshore oil and gas development projects would be similar to the proposed project’s, their corresponding contribution to the U.S. and California GHG inventories would be comparable.
5.8.6.2 Onshore Projects
Construction of the onshore development projects outlined in Section 4.4 would generate air emissions, some of which would be mitigated by project-specific mitigation measures. Construction of many of these projects would be expected to be consistent with adopted County policies, such as emission reductions for dust control, which would ensure that cumulative construction air quality impacts would not be significant. Additionally, the operational emissions of these onshore projects would not be considered significant since each individual project would not be allowed to operate without a PTO.
Proposed cumulative development and its associated air emissions have been accounted for in the 2004 Clean Air Plan and subsequent updates. Therefore, the onshore cumulative projects would be consistent with the air quality planning document used to bring the region into attainment with ambient air quality standards, and would be expected to produce long-term air quality impacts that are not significant. Therefore, cumulative air quality impacts, including the proposed project’s incremental contribution to them, would not be considered significant.
5.8.7 Mitigation Monitoring Plan
Mitigation Measure Mitigation Requirements and Timing
Method of Verification
Timing of Verification
Party Responsible
For Verification
Air-1 PXP shall prepare and submit Dust Control and Reduction Plan to SBCAPCD prior to land use clearance. PXP shall implement dust reduction measures during construction. The following APCD Standard Dust Mitigation Measures shall be implemented: 1. Dust generated by the development activities shall be retained onsite and kept to a minimum by following the dust control measures listed below. Reclaimed water shall be used whenever possible. a. During clearing, grading, earth moving or excavation, water trucks or sprinkler systems are to be used in sufficient quantities to prevent dust from leaving the site and to create a crust, after each day's activities cease. b. After clearing, grading, earth moving or excavation is completed, the disturbed area must be treated by watering, or revegetating; or by spreading soil binders until the area is paved or otherwise developed so that dust generation would not occur. c. During construction, water trucks or sprinkler systems shall be used to keep all areas of vehicle movement damp enough to prevent dust from leaving the site. At a minimum, this would include wetting down such areas in the late morning and after work is completed for the day. Increased watering frequency
Review and approval of the Dust Control
Plan.
Compliance with the Plan
shall be verified by
construction site visits.
Prior to land use clearance
Periodically
during construction
SBCAPCD SBC P&D

5.8 Air Quality
April 2008 5.8-34 Final EIR
Mitigation Measure Mitigation Requirements and Timing
Method of Verification
Timing of Verification
Party Responsible
For Verification
will be required whenever the wind speed exceeds 15 mph. 2. Importation, exportation and stockpiling of fill material: a. Soil stockpiled for more than two days shall be covered, kept moist, or treated with soil binders to prevent dust generation. b. Trucks transporting fill material to and from the site shall be tarped from the point of origin. c. If the construction site is greater than five acres, gravel pads must be installed at all access points to minimize tracking of mud onto public roads. 3. Activation of increased dust control measures: a. The contractor or builder shall designate a person or persons to monitor the dust control program and to order increased watering, as necessary, to prevent transport of dust offsite. Their duties shall include holiday and weekend periods when work may not be in progress. The name and telephone number of such persons shall be provided to the APCD.
Air-2 PXP shall ensure that emission reductions are provided to fully mitigate increases in operational criteria pollutant emissions associated with the proposed project consistent with SBCAPCD Rules and Regulations. The documentation supporting the available emission mitigations for operations shall be submitted to the SBCAPCD prior to land use clearance. No operations shall occur until the applicable project Permits to Operate are modified.
Review of the supporting
documentation for the
mitigations
Prior to land use clearance
SBCAPCD SBC P&D
Air-3 (VAFB
Onshore, Casmalia,
and Emulsion Pipeline
Replacement Alternatives
only)
PXP shall implement the following SBC NOx reduction emissions measures: - Engines and emission systems shall be maintained, - High pressure fuel injectors shall be installed, and - Reformulated diesel fuel shall be used. The documentation supporting the implementation of the NOx reduction measures shall be submitted to the SBC P&D and the SBCAPCD prior to land use clearance. No operations shall occur until the applicable project Permits to Operate are modified.
Review and approval of the documentation
. Compliance
with the measures shall be verified by construction
site visits
Prior to land use clearance
Periodically during
construction
SBCAPCD SBC P&D
Air-4 (VAFB
Onshore, Casmalia,
and Emulsion Pipeline
Replacement Alternatives
only)
PXP shall provide emission mitigations for the construction activities consistent with SBCAPCD Rules and Regulations. The documentation supporting the available emission mitigations for construction shall be submitted to the SBCAPCD and SBC P&D prior to land use clearance. No operations shall occur until the applicable project Permits to Operate are modified.
Review of the submitted
documentation.
Prior to land use clearance
SBCAPCD, SBC P&D

5.8 Air Quality
April 2008 5.8-35 Final EIR
5.8.8 References Arthur D. Little. 1985. Union Oil Project/Exxon Project Shamrock and Central Santa Maria
Basin Area Study: Final EIS/EIR. Prepared for County of Santa Barbara, U.S. Mineral Management Service, California State Lands Commission, California Coastal Commission, and California Office of Offshore Development. Technical Appendix B Volume 1 and 2.
California Air Resources Board website. http://www.arb.ca.gov/homepage.htm
____. 2006. AB 32 Fact Sheets, California Global Warming Solutions Act of 2006 and Timeline. www.arb.ca.gov/cc/cc.htm. September.
California Climate Action Registry (CCAR). 2007. General Reporting Protocol, Table III.8.1 and Table C.5, Version 2.2. March.
California Energy Commission (CEC). 2006. Inventory of California Greenhouse Gas Emissions and Sinks: 1990 to 2004, Staff Final Report, Table A-4. December.
California Environmental Protection Agency (CalEPA). 2006. Climate Action Team Report to Governor Schwarzenegger and the Legislature. March.
Office of Environmental Health Hazard Assessment. 1999. California EPA, Air Toxics Hot Spot Program Risk Assessment Guidelines.
Ryan, Dina M. 2006. Civ 30 CES/CEV, VAFB, Email to Vida Strong, Aspen Environmental Group. August 28.
Santa Barbara County, Air Pollution Control District. Technology and Environmental Assessment Division. March 2006. Scope and Content of Air Quality Sections in Environmental Documents, Updated.
____. 2003. Permit to Operate 6708 and Part 70 Operating Permit 6708. December.
____. 2003. Permit to Operate 9106. December.
____. 1999. Rules and Regulations.
____. 1998. Clean Air Plan.
Santa Barbara County, Air Pollution Control District and Santa Barbara County Association of Governments. 20042007. 2004 2007 Clean Air Plan (Maintenance Plan – Federal 8-hour Ozone Standard and Three Year Update to the 2001 2004 Clean Air Plan – State 1-hour Ozone Standard). Adopted December 16August.
Santa Barbara County, Planning and Development Department. January 2000. North County Oil and Gas Facility Siting and Planning Analysis.
____. 2006. Environmental Thresholds and Guidelines Manual, Interim Revision to Air Quality Sub-Sections. October.
____. Standard Conditions of Approval and Standard Mitigation Measures.
U.S. EPA 1995. Compilation of Air Pollution Emission Factors Volume I Stationary Point and Area Sources. Fifth Edition; Part 3 of 3. January 1995. #AP-42. U.S. Dept. of Commerce

5.8 Air Quality
April 2008 5.8-36 Final EIR
reproduction. Available from National Technical Information Service (NTIS), Springfield, Virginia.
____. 2006. Inventory of U.S. Greenhouse Gases Emissions and Sinks: 1990-2004, April.
____. 2007. Inventory of U.S. Greenhouse Gas Emissions and Sinks: 1990-2005, Annex 2, Methodology and Data for Estimating CO2 Emissions from Fossil Fuel Combustion. April.

5.8-37
AspenEnvironmental Group
PR
EP
AR
ED
BY
Typical Regional Wind Patterns
April 2008
5.8 Air Quality
Figure 5.8-1
Final EIR
Source: MRS, 2002.
Summer Night Summer Day
Winter Night Winter Day
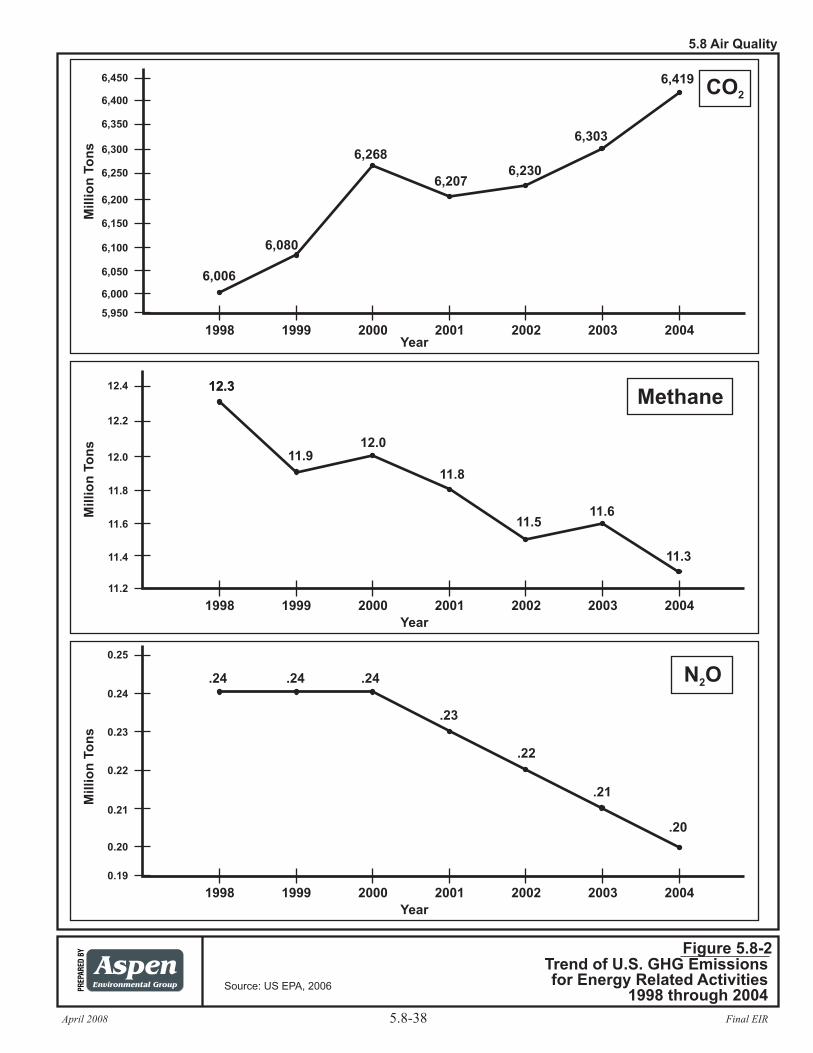
April 2008 Final EIR
AspenEnvironmental Group
PR
EP
AR
ED
BY
Trend of U.S. GHG Emissionsfor Energy Related Activities
1998 through 2004
Figure 5.8-2
5.8-38
5.8 Air Quality
Source: US EPA, 2006
1998 1999 2000 2001 2002 2003 2004
0.21
0.22
0.23
0.24
0.25
Millio
nTo
ns
Year
0.20
N O2
1998 1999 2000 2001 2002 2003 2004
11.4
11.6
11.8
12.0
12.2
Millio
nTo
ns
Year
11.2
Methane
1998 1999 2000 2001 2002 2003 2004
6,050
6,100
6,150
6,200
6,250
Millio
nTo
ns
Year
6,000
CO2
12.4
6,300
6,350
6,400
6,450
.24 .24 .24
.23
.22
.21
.20
12.3
11.912.0
12.3
11.8
11.511.6
11.3
6,006
6,080
6,268
6,2076,230
6,303
6,419
0.19
5,950