5.3: determination of the polar anchoring energy by electrical measurement
TRANSCRIPT
5.3 / A. Muravsky
5.3: Determination of the Polar Anchoring Energy by Electrical Measurement Alexander Muravsky
Belarussian State University, Minsk, Belarus
Vladimir Chigrinov Hong Kong University of Science & Technology, Clear Water Bay, Kowloon, Hong Kong
Anatoli Murauski Institute of Applied Physics Problems, Minsk, Belarus
Abstract We propose a simple method for determination of polar anchoring coefficient by electrical measurements. The basic idea of this method is a two-channel scheme for capacitance measurements. The first channel uses one cell with planar alignment LC, the second channel uses the cell with vertical alignment (VA). Such method gives a possibility to investigate anchoring properties of planar and vertical alignment materials. Measurements of two cells at one time give possibility to compensate all volume effects in LC cell and investigate only surface effects. The method can be used for the cells, which do not have uniform planar or VA orientation. We applied this method to investigate the polar anchoring properties of photoaligning material before and after illumination.
1. Introduction The new photoaligning technology, which allows a precise control of the anchoring properties of aligning layers, new electrooptical effects, which use a high pretilt angle, stimulates the development of the new methods for anchoring energy measurements, especially for the low values of the anchoring, when the LC alignment is not uniform or when liquid crystal has high pretilt angle on surface alignment layers [1,2]. The high voltage measurements of the phase retardation usually require a high quality antiparallel orientation in LC cell [3-5]. Optical methods have certain problems in polar (zenithal) anchoring energy determination for vertical aligned LC cells [6-8]. In this case a capacitance method can be used [9]. We propose to use an additional LC cell with perpendicular director orientation (planar or homeotropic) for the determination of the saturation level of the capacitance in this method and for exclusion volume effects, such as a variation of the LC order parameter under high field application [10,11]. Our technique can be successfully applied to both planar and vertical aligned LC materials. The calculation of anchoring coefficient for materials with small pretilt angle can be done without additional information on the parameters of LC mixture (elastic and dielectric constants).
2. Physical Background of the Method 2.1 Basic Theory The cell capacity is determined by cell gap d, area of electrodes S and dielectric permittivity of LC ε, which is a function of the applied electric field. For the high voltage thVV 6> the change of the capacity of the LC cell can be written in the following way [4,5]
−=
VV
QdS
C 1||0εε
(1)
where S is the electrodes overlapping square, d is the cell thickness, and ||ε , ⊥ε is the LC dielectric constant parallel and perpendicular
to the LC director,
and tha VV||ε
εα= , ⊥−= εεε ||a , a
thKVεε
π0
1= ,
dyyy
ky
py∫ +
++=1
)1()1)(1(1
γγ
πα ,
⊥
⊥−=
εεε
γ)( ||
,
11
1133
KKKk −
= , θ2sin=y , ppy θ2sin= ,
pθ – pretilt angle; K11, K33 – Frank elastic constants.
)1()1)(1(21 1
p
pp
yyky
WdKQ
γγ
+−+
−= (2)
For the small pretilt angle θp we have
WdKQ 121 γ
−= (2’)
From (2’) we can find the polar anchoring strength W. Measuring the value of capacity Cinf at high voltage limit V → ∞ and the value of the threshold voltage Vth we get:
inf||
2||
2
2 11)(2
CCCCC
SVW th
−−
=⊥
⊥
π
(3)
where C⊥ is capacity of LC cell for uniform planar orientation of liquid crystal , C|| is capacity for vertical alignment LC. It is basic formula for capacity method.
The value C⊥ is measured for a planar LC cell at the voltage V<Vth. We can also measure Cinf in limit of high voltages V → ∞. But the value of C|| can be measured by applying a very high voltage, which reoriented LC molecules in LC bulk including the molecules on the surface aligning layers.
2.2 Effect of LC Order Parameter The effect of the increase of nematic LC bulk order [11] and even a formation of a biaxial nematic by changing the order parameter in high electric [10] or magnetic fields [12] have been already discussed. The value of the electric fields ES, when such effects
ISSN/0005-0966X/05/3601-0006-$1.00+.00 © 2005 SID ISSN/0005-0966X/05/3601-0050-$1.00+.0050 • SID 05 DIGEST
ISSN/0005-0966X/05/3601-0006-$1.00+.00 © 2005 SID 54 • SID 05 DIGEST ISSN/0005-0966X/05/3601-0054-$1.00+.00

5.3 / A. Muravsky
become possible can be roughly estimated by comparing the electric
field coherence length ξE≈1/E a
Kεε0
1 with a characteristic
thickness of the order parameter variation from the bulk to the surface value, which is few molecular lengths ξs≈ 10-100 nm [13] . Comparing ξE≈ξs we get the typical values of ES ≈ 105-106 V/cm. If the capacitance method is applied directly, we may observe the above mentioned increase of the order parameter of LC cell due to the ordering of the surface layer under high voltage and consequently the variation of the LC cell capacitance. The effect of the capacitance increase can be observed, if we apply a high voltage to a homeotropic LC cell. The relative change of the capacitance (or LC dielectric constant) is shown in Fig.1. As followed from Fig.5, the order parameter induced change of the capacitance is about 2%, while for the accurate definition of the polar anchoring energy we need to measure the capacitance with the accuracy of 0.1%. As a result of the order parameter variation, the saturation of the capacitance for the planar LC cell may not be observed at high electric field and the ratio C||/Cinf cannot be obtained from the experiment.
2.3 Relative Capacity Measurements To simplify the procedure of the measurement and to avoid parasitic effects, which take place in liquid crystal under high electric field, we propose to measure the relative capacity for planar and homeotropic cells simultaneously. The principal scheme of such measurement is shown in Fig.2.
AC voltage from a function generator is applied for the two channels at the same time. Cell 1 has a planar LC orientation and cell 2 has vertical LC alignment. If we use LC with a positive dielectric anisotropy, cell 1 will switch in electric field. Cell 2 will be used as a reference channel. Resistors R1 and R2 are used to measure the current at every channel. Resistor R1 is high performance
variable resistor. It is used for equalization of two channels for empty cells. Expression (1) for the scheme shown in Fig.2 can be written in the form
−=
VV
QCC
RR
UU
1102
01
1
2
2
1 (4)
where 01
02
2
1
|| CC
CC
CC = , 0
2
01
1
11
1CC
RVUCC
ω== ,
2
2||02||
1RV
Ud
SCC
ωεε
=== , ω=2πf,
f – frequency of applied voltage, 01C .и 0
2C – empty cells capacitance, U1,U2 – the voltages on resistors R1 and R2 (Fig.1).
The value of the resistor R1 is defined as 11
202
01 =
RR
CC
for the
empty cells. After such calibration formula (4) has the simplest form.
−=VV
QUU 11
2
1 (5)
0.99
1.00
1.01
1.02
1.03
1.04
1.05
0.00 0.10 0.20 0.30 0.40 0.50
1/V (V-1)
CVA
/C0 VA
Figure 1. Relative change of the capacity VA LC cell CVA/C0VA in a high
electric field. The cell was filled with MLC 5700-000, having a positive dielectric anisotropy. The cell thickness was 11µµµµ. The PI aligning agent
JALC-2021 was used to provide a homeotropic LC alignment.
SID 05 DIGEST • 51SID 05 DIGEST • 55
5.3 / A. Muravsky
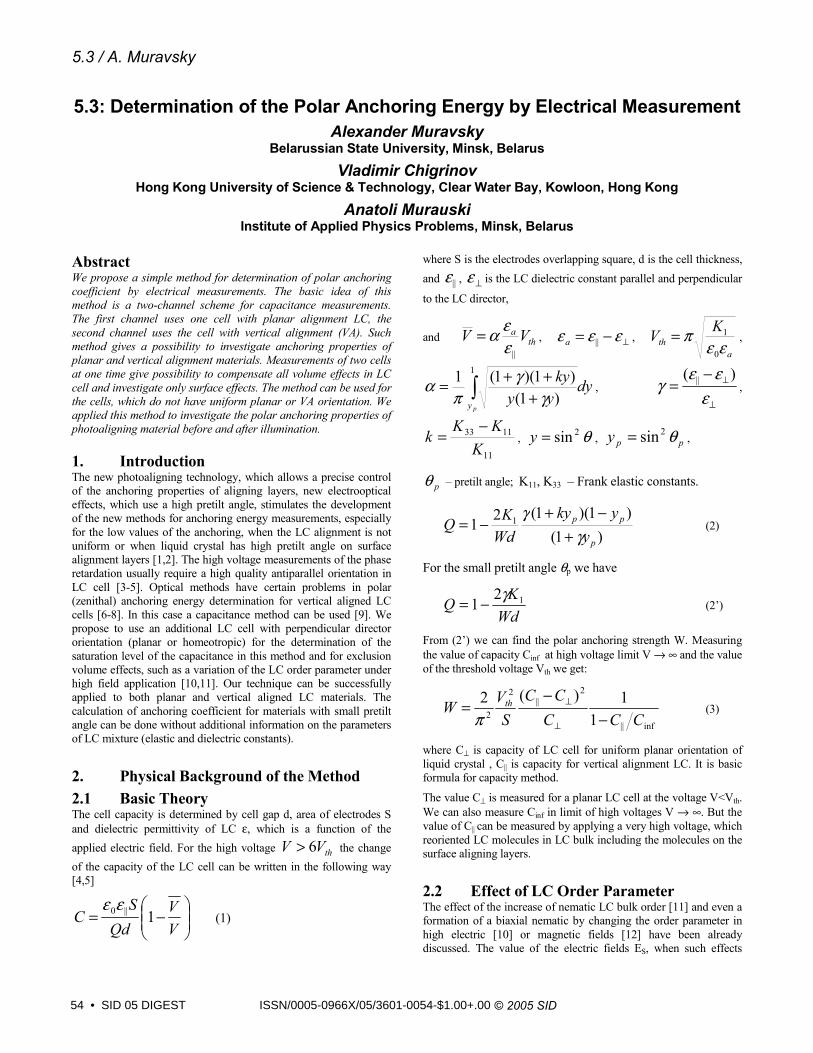
Expression (5) provides a simple way for the determination of the polar anchoring coefficient W. We must measure the dependence of
21 UU on the applied voltage. Formula (5) is valid for V>6Vth and V<Vmax.. Here Vmax is the maximal voltage, when linear approximation for the function ( )21 UU is possible. It corresponds to the condition, when the LC pretilt angle at the substrate is small enough [4,5]. The limit of the linear approximation of the relation ( )21 UU at ∞→V can be used for the calculation of the anchoring coefficient W.
( )
−
−
=
−
=
∞→
⊥⊥
∞→ V
th
V UU
CCCVS
dUU
KW
2
1
2||
2
2
1
1
1
2
1
2π
γ
,
(6)
where C|| and C⊥ can be calculated from the experimental data,
ω2
2||
1RV
UC = for any applied voltage,
ω11 1
RVUC =⊥ for V<Vth,
3 LC Cells and Experimental Set-Up The increase of measuring quality was achieved owing to the relative measurement of two equal cells with opposite orientation. The thickness of these cells must be stable and have no change in the LC filling process. Thus the LC cells size has to be small and
the glass substrates must be thick enough. We used the cells with the size 13x13 mm, width patch area 2mm, thickness of glass substrate was 1.1 mm, electrode area was 5x5 mm, cell gap was 11.5 µm. The cells were pressed additionally with a force about 1 kg/cm2. As applied voltage source the function generator AVTECH AV-151B-C, which had maximal amplitude of output signal 200V, was used. For voltage measuring on resistors R1 and R2 I/O board PCI-MIO-16E-4 from Texas Instruments was used. The value of resistors R1 and R2 was 10 kΩm. The frequency of the applied signal was 1kHz.
4 Results and Discussions The method was used to investigate the modification of anchoring properties of azodye photoalignment materials (mixture of SD1 and SDA2) [14] in dependence on exposed radiation energy dose. Fig.3 shows the ratio U1/U2 in empty cells and the cells filled with LC. For our cells Vth = 0.8V. And we found that
optimal voltage range for linear approximation was Vmin = 5V and Vmax = 20V. We received W1 = 3.81·10-4 J/m2 for polar anchoring coefficient before the exposure and W2 = 3.44·10-4 J/m2 after the exposed dose of 0.8 W/cm2. This result means that photoalignment material SDA2+SD1 do not exhibit any change of polar anchoring energy versus exposure time. We tested our method for the high voltage 120V with the aim to receive the saturation value of U1/U2. The saturation value is very close to our estimation (5).
5 Conclusion We propose a modification of the capacitance method for the LC polar anchoring energy measurements. The proposed method is simple and increases the accuracy of the capacity method for the determination of the polar anchoring energy, especially for non-uniform LC alignment. This technique can be used for the investigation of both planar and vertical aligned LC materials without any change in the experimental scheme. The polar anchoring coefficient in case of small pretilt angle can be defined without using the LC materials parameters (elastic and dielectric constants). The polar anchoring energy of photoaligned azodye layers was found to be 1.9·10-4 J/m2 almost independent on the UV exposure energy.
6. Acknowledgements This research was partially supported by ITF grant ITS/111/03 and RGC grant HKUST6102/03E.
7. References [1] D. Subacius, V.M. Pergamenshchik, and O.D. Lavrentovich,
Appl. Phys. Lett. 67, 214 (1995).
[2] R.W. Fitas and S.P. Patel, Appl. Phys. Lett., 50, 1426 (1987).
Figure. 3 Dependence of U1/U2 for LC cells with planar (cell 1, alignment material was SDA2 + SD1) and vertical (cell 2, alignment material was JALC
2021) on applied voltage V. Liquid crystal was MLC 5700-000. Thickness of the cells was 11.5 µm.
0.86
0.88
0.9
0.92
0.94
0.96
0.98
1
1.02
0.00 0.05 0.10 0.15 0.20 0.25 0.301/V, V
U1/U
2
Empty cells
Filled cells
VminVmax
52 • SID 05 DIGEST56 • SID 05 DIGEST
5.3 / A. Muravsky
[3] H.Yokoyama and H.A. van Sprang, J. Appl. Phys., 57, 4520 (1985).
[4] Yu. A. Nastishin, R. D. Polak, S. V. Shiyanovskii, V. H. Bodnar, and O. D. Lavrentovich, J. Appl. Phys., 86, 4199 (1999).
[5] Yu. A. Nastishin, R. D. Polak, and S. V. Shiyanovskii, O. D. Lavrentovich, Appl. Phys. Lett., 75, 202 (1999).
[6] J.G. Fonseca, Y. Galerne, Phys. Rev. E 61, 1550 (2000).
[7] M. Vilfan, and M. Copic, Phys. Rev. E 68, 031704 (2003).
[8] H. Yokoyama, and R. Sun, Jpn.J. Appl. Phys., 39, L45 (2000).
[9] Y. Toko and T. Akahane, Mol. Cryst. Liq. Cryst, 368, 469 (2001).
[10] P. Martinot-Lagarde, H. Dreyfus-Lambez, I. Dozov , Phys. Rev. E 67, 51710 (2003).
[11] I. Lelidis, M. Nobili, and G. Durand, Phys. Rev. E 48, 3818 (1993).
[12] B. Malraison, Y. Poggi, and E. Guyon, Phys. Rev. A 21, 1012 (1980).
[13] P. Sheng, B.Z. Li, M. Zhou, T. Moses , and Y.R. Shen, Phys. Rev. A 46, 946 (1992).
[14] H.Takada, H. Akiyama, H. Takatsu, V. Chigrinov, E. Prudnikova, V. Kozenkov, H.S. Kwok, SID’03 Digest, 620 (2003).
SID 05 DIGEST • 53SID 05 DIGEST • 57