5.2 detection & monitoring of pollution. sub-subtopics 5.2.1 describe two direct methods of...
TRANSCRIPT
5.2 Detection & Monitoring of Pollution

Sub-subtopics
5.2.1 Describe two direct methods of monitoring pollution.5.2.2 Define the term biochemical oxygen demand (BOD) and explain
how this indirect method is used to assess pollution levels in water.5.2.3 Describe and explain an indirect method of measuring pollution
levels using a biotic index.

5.2.1 Methods of MonitoringWhere to start?
AIR
WATER
LAND
Retirieved on 01-11-2013 from: http://www.sciencekids.co.nz/images/pictures/health/pollutionhealtheffects.jpg
What to do?
DIRECT
INDIRECT
CHANGES
GradientsTime periods
Transects
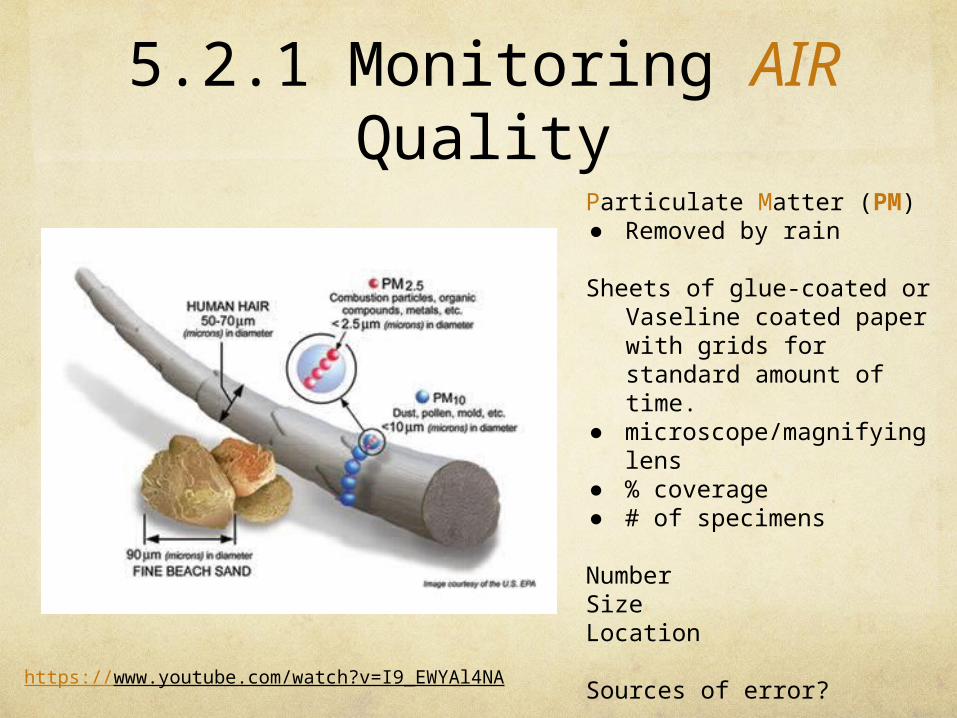
Particulate Matter (PM)● Removed by rain
Sheets of glue-coated or Vaseline coated paper with grids for standard amount of time.
● microscope/magnifying lens● % coverage● # of specimens
NumberSizeLocation
Sources of error?
5.2.1 Monitoring AIR Quality
https://www.youtube.com/watch?v=I9_EWYAl4NA

Secondary Data Sources:● Czech Republic - ČHMI● EU - AirMonTech● U.S. - EPA● China - AQICN ● India - CPCB● Brazil - MMA● Australia - AGDE● South Africa - SAAQIS● Egypt - EEAA-EIMP● Bangladesh - CASE
What they measure:● sulfur dioxide● oxides of nitrogen● ozone● VOC’s● particulate matter (sizes)
5.2.1 Monitoring AIR Quality
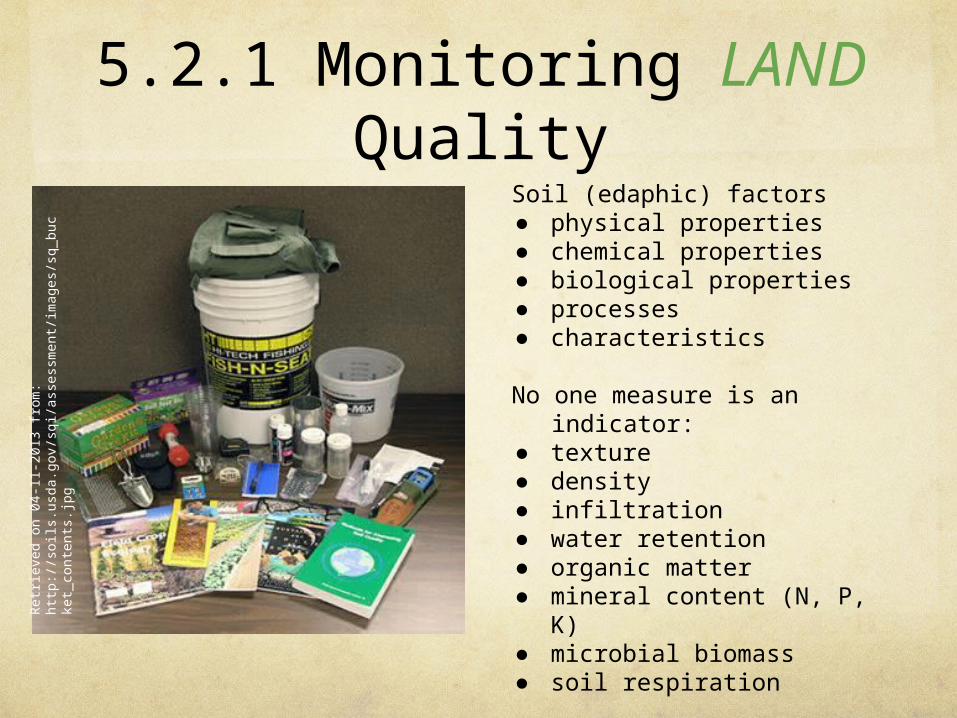
Soil (edaphic) factors● physical properties● chemical properties● biological properties● processes● characteristics
No one measure is an indicator:● texture● density● infiltration● water retention● organic matter● mineral content (N, P, K)● microbial biomass● soil respiration
5.2.1 Monitoring LAND QualityR
etrie
ved
on 0
4-11
-201
3 fr
om:
http
://so
ils.u
sda.
gov/
sqi/a
sses
smen
t/im
ages
/sq_
buck
et_c
onte
nts.
jpg

5.2.1 Monitoring SOIL Quality
Secondary Data Sources:● World - HWSD and ISRIC● Czech Republic - ČPS● EU - JRC’s LUCAS● U.S. - NRCS● China - MLR ● India - IISS (for soil types)● Russia - VINITI● Australia - GRDC and
soilquality.org● South Africa - ARC-ISCW● Bangladesh
What they measure:● same as last slide● degradation/aggradation
Retrieved on 01-11-2103 from: http://soilquality.org/images/dynamic_graph.gif
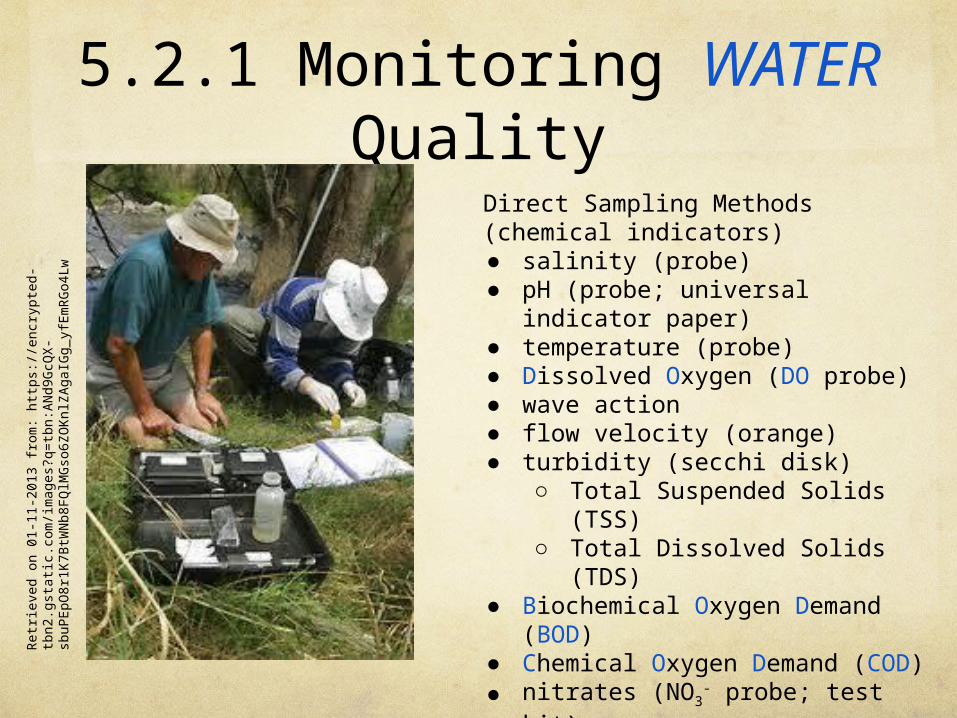
Direct Sampling Methods(chemical indicators)● salinity (probe)● pH (probe; universal indicator paper)● temperature (probe)● Dissolved Oxygen (DO probe)● wave action● flow velocity (orange)● turbidity (secchi disk)
○ Total Suspended Solids (TSS)○ Total Dissolved Solids (TDS)
● Biochemical Oxygen Demand (BOD)● Chemical Oxygen Demand (COD)● nitrates (NO3
- probe; test kit)● ammonia (NH3 probe; test kit)● phosphate (probe; test kit)● conductivity (probe)
5.2.1 Monitoring WATER Quality
Ret
rieve
d on
01-
11-2
013
from
: http
s://e
ncry
pted
-tbn
2.gs
tatic
.com
/imag
es?
q=tb
n:A
Nd9
GcQ
X-
sbuP
EpO
8r1K
7BtW
Nb8
FQ
lMG
so6Z
OK
nlZ
Aga
IGg_
yfE
mR
Go4
Lw

5.2.1 Monitoring WATER Quality
Secondary Data Sources:● Czech Republic - ČHMI● EU - WISE● U.S. - NWQMC● China - IPE ● India - CPCB’s NWMP● Russia - VINITI● Brazil - ANA● Australia - NWQMS● South Africa - WMS● Egypt - EMWIS-EG● Bangladesh- BWDB
What they measure:● same as last slide● hardness● potability
Retrieved on 01-11-2013 from: http://ks.water.usgs.gov/pubs/reports/wrir.00-4126.cov.ill.jpeg

5.2.2 B.O.D.Biological Oxygen Demand (BOD5)● First done in England 1912● measures organic pollution in H2O (aerobic bacteria & fungus)● units: mg (O2 consumed)/L● usually 5 days incubation at 20 ºC
○ 68% of BOD exerted after this time● tests vary 10-20%● Indirect method
Chemical Oxygen Demand
Retrieed on 04-11-2013 from: http://www.bre.umd.edu/agtopics/pict/bodpict.gif

5.2.2 B.O.D.
Steps for measuring Biological Oxygen Demand (BOD5)
1. Sample H2O of measured volume
2. Measure the O2 level (probe)3. Place sample in a dark, 20 ºC
place for 5 daysa. Why in the dark?
4. After 5 days, remeasure O2
5. BOD5 = (Step 2 - Step 4) / L
Retrieved on 04-11-2013 from: http://www.globalw.com/images/products/OxiTop.jpg
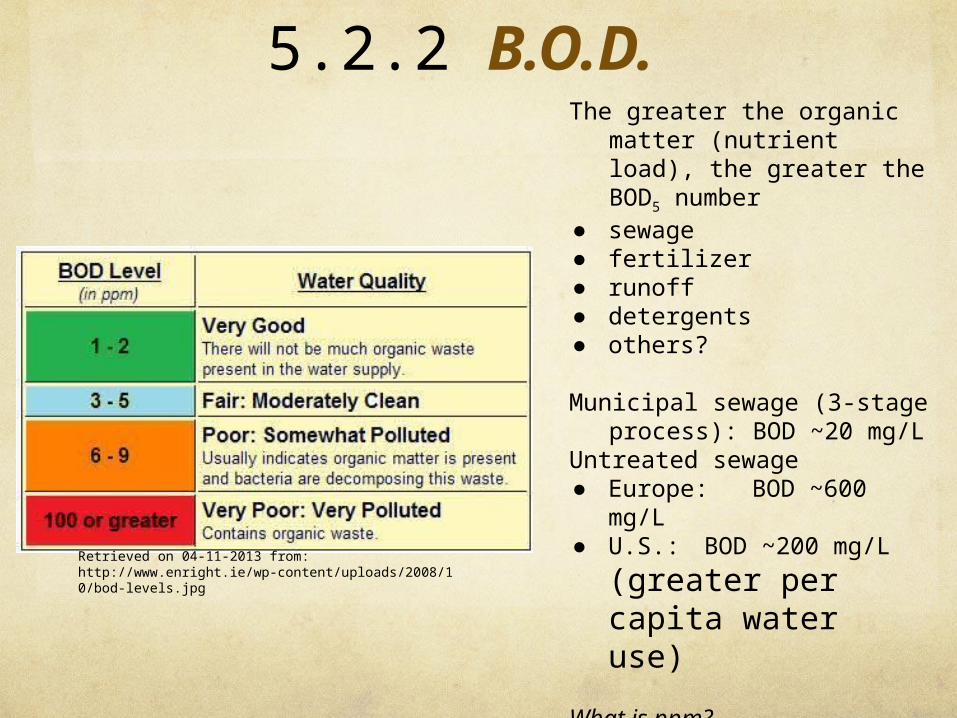
The greater the organic matter (nutrient load), the greater the BOD5 number
● sewage● fertilizer● runoff● detergents● others?
Municipal sewage (3-stage process): BOD ~20 mg/L
Untreated sewage● Europe: BOD ~600 mg/L● U.S.: BOD ~200 mg/L
(greater per capita water use)
What is ppm?
5.2.2 B.O.D.
Retrieved on 04-11-2013 from: http://www.enright.ie/wp-content/uploads/2008/10/bod-levels.jpg

Eastern European Sewers
Retrieved on 04-11-2013 from: http://wwws4.eea.europa.eu/data-and-maps/figures/changes-in-wastewater-treatment-in-countries-of-europe-between-1980s-and-2005-east-3/csi24_fig5_291008.xls/image_large
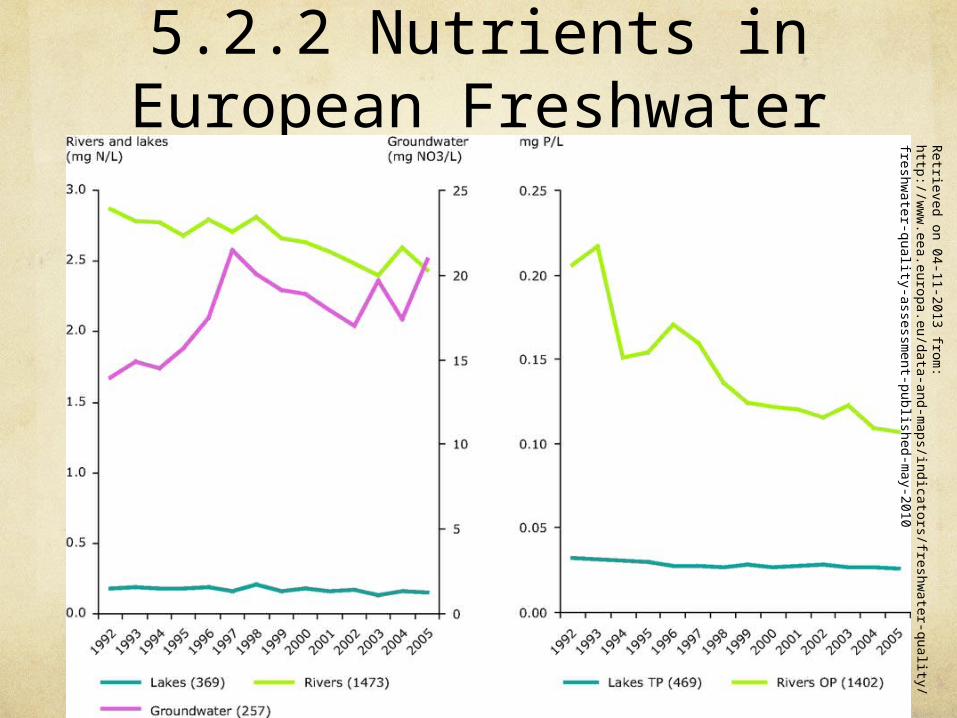
5.2.2 Nutrients in European Freshwater
The greater the organic matter (nutrient load), the greater the BOD5 number
● sewage● fertilizer● runoff● detergents● others?
Retrieved on 04-11-2013 from
: http://ww
w.eea.europa.eu/data-and-m
aps/indicators/freshwater-
quality/freshwater-quality-assessm
ent-published-may-2010

5.2.3 Biotic IndicatorsAnother indirect method: Indicator Species● tolerant of organic pollution and/or low O2 levels● intolerant of organic pollution and/or low O2 levels
● More dangerous in summer○ solubility of O2 as temperature○ warm organic pollutants do the same
● Tubifex vs. mayfly nymph?● Others: fish, underwater plant life, algae (diatoms), bacteria (fecal
coli)
Retrieved on 04-11-2013 from: http://www.ib.bioninja.com.au/_Media/indicator_species.jpeg
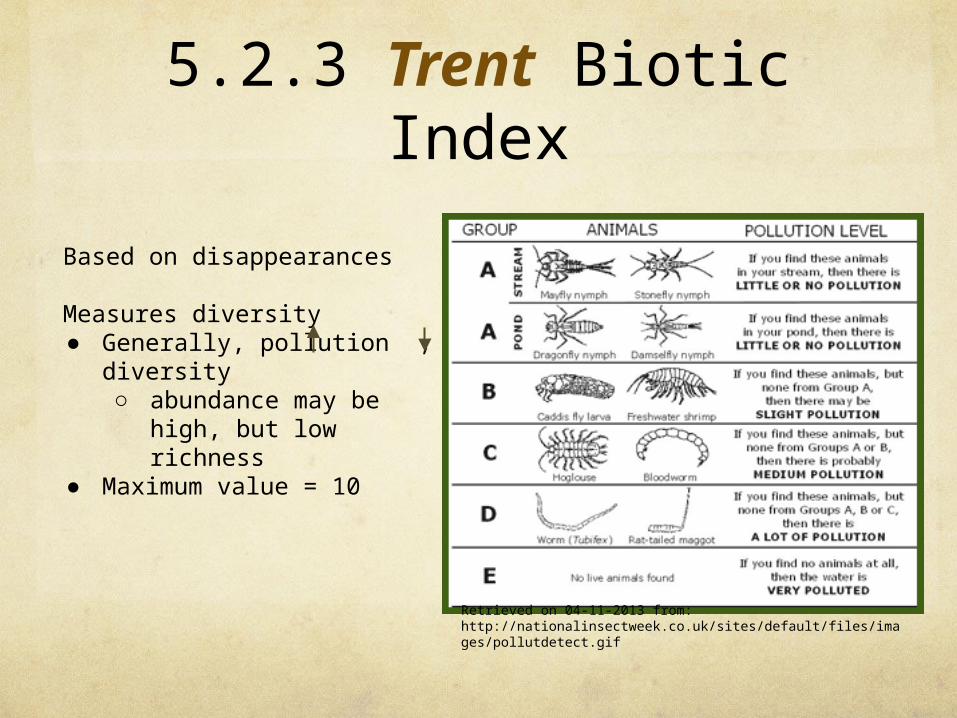
5.2.3 Trent Biotic Index
Based on disappearances
Measures diversity● Generally, pollution , diversity
○ abundance may be high, but low richness
● Maximum value = 10
Retrieved on 04-11-2013 from: http://nationalinsectweek.co.uk/sites/default/files/images/pollutdetect.gif

5.2.3 Trent Biotic Index
Retrieved on 04-11-2013 from: http://click4biology.info/c4b/D/G4.htm