50 largest companies- 2000-2005 shareholder value creation in latin america
TRANSCRIPT

7/25/2019 50 Largest Companies- 2000-2005 Shareholder Value Creation in Latin America
http://slidepdf.com/reader/full/50-largest-companies-2000-2005-shareholder-value-creation-in-latin-america 1/9
J . Aznarez, O. Carbonell, P. Fernández and JM. Carabias, Shareholder value creation in Latin AmericaESE Business School, IPADE and IESE 50 largest companies: 2000-2005
1
50 largest companies: 2000-2005Shareholder value creation in Latin America
Julio Aznarez L.* Profesor of Corporate Finance
ESE Business School (Universidad de los Andes) Av. Plaza 1905 · San Carlos de Apoquindo · Las Condes · Santiago Chile
Telephone (56 2) 412 9510.E-mail: [email protected]
Óscar E. Carbonell López*Profesor of Corporate Finance
IPADE Business School (Universidad Panamericana)Floresta 20, Col. Clavería
Delegación Azcapotzalco 02080, MexicoTelephone (52) 55 53 990083. E-mail: [email protected]
Pablo FernándezPricewaterhouseCoopers Professor of Corporate Finance
IESE Business SchoolCamino del Cerro del Águila 3. 28023 Madrid, Spain
Telephone 34-91-357 08 09. E-mail: [email protected]
José María CarabiasResearch Associate
IESE Business SchoolCamino del Cerro del Águila 3. 28023 Madrid, Spain
Telephone 34-91-357 08 09. E-mail: [email protected]
June 26, 2006
JEL Classification: G12, G31, M21
Keywords: shareholder value creation, created shareholder value, shareholder value added, shareholderreturn, required return to equity.
The authors acknowledge the support from Javier Hurtado and Miguel Garnier, research assistants fromIPADE.
*Corresponding author
7/25/2019 50 Largest Companies- 2000-2005 Shareholder Value Creation in Latin America
http://slidepdf.com/reader/full/50-largest-companies-2000-2005-shareholder-value-creation-in-latin-america 2/9
J . Aznarez, O. Carbonell, P. Fernández and JM. Carabias, Shareholder value creation in Latin AmericaESE Business School, IPADE and IESE 50 largest companies: 2000-2005
2
50 largest companies: 2000-2005Shareholder value creation in Latin America
April 13, 2006
ABSTRACT
We calculated the shareholder value creation for the 50 largest Latin American companies in 2005
in terms of market capitalization and also for the 39 largest companies in terms of market capitalization
for the period 2000-2005.
2005 was a year in which 46 out of the 50 largest companies in Latin America created shareholder
value: US$ 156.606 million. The top three companies that created more value were América Móvil (US$
16.852 million, MX), Bradesco (US$ 14.957 million, BR) and Petrobras (US$ 14.504 million), while the
three companies that destroyed more value were Souza Cruz (US$ -585 million, BR), Antarchile (US$ -
281 million, CH) and Cmpc (US$ -98 million, CH). The market value of the 50 companies reported wasUS$ 644.286 million in 2005.
The created shareholder value of a subsample of 39 companies for the period 2000-2005 shows that
Petrobras (US$ 67.253 million, BR) was the top shareholder value creator and Embraer (US$ -1.265
million, BR) the top shareholder value destroyer for the period.
JEL Classification: G12, G31, M21
Keywords: shareholder value creation, created shareholder value, shareholder value added, shareholderreturn, required return to equity.

7/25/2019 50 Largest Companies- 2000-2005 Shareholder Value Creation in Latin America
http://slidepdf.com/reader/full/50-largest-companies-2000-2005-shareholder-value-creation-in-latin-america 3/9
J . Aznarez, O. Carbonell, P. Fernández and JM. Carabias, Shareholder value creation in Latin AmericaESE Business School, IPADE and IESE 50 largest companies: 2000-2005
3
We apply the methodology used by Fernandez (2002, chapter 1) to calculate the shareholder value
creation for the 50 largest companies in terms of market capitalization in Latin America1 for 2005 and for
the 39 largest companies in terms of market capitalization for the periods 2000-2005, 2001-2005, 2002-
2005, 2003-2005, 2004-2005. The top shareholder value creator in 2005 was America Móvil from
Mexico and the top shareholder value destroyer in 2005 was Souza Cruz from Brazil.
In section 1 we define created shareholder value. Section 2 has the ranking of created and
destroyed shareholder value and return for the companies in 2005. Section 3 shows Shareholder Value
Creation and Shareholder Return by country. Section 4 shows the relation between return and size.
Section 5 has the ranking of created shareholder value and return from the previous years for a subsample
of 39 companies. Section 6 shows the relation between return and size for the previous years for a
subsample of 39 companies.
1. Definition of created shareholder value
We define shareholder value created following Fernandez (2002, chapter 1). To obtain the createdshareholder value, we must first define the increase of equity market value, the shareholder value added,
the shareholder return, and the required return to equity.
The equity market value of a listed company is the company's market value, that is, each share's
price multiplied by the number of shares. The increase of equity market value in one year is the equity
market value at the end of that year less the equity market value at the end of the previous year.
Shareholder value added is the term used for the difference between the wealth held by the
shareholders at the end of a given year and the wealth they held the previous year.
The shareholder value added is calculated as follows:
Shareholder value added =
Increase of equity market value+ Dividends paid during the year
- Outlays for capital increases+ Other payments to shareholders (discounts on par value, share buy-backs....)
- Conversion of convertible debentures
The shareholder return is the shareholder value added in one year, divided by the equity
market value at the beginning of the year.
Shareholder return = Shareholder value added / Equity market value
The required return to equity is the sum of the interest rate of long-term Treasury bonds plus a
quantity that is usually called the company's risk premium and which depends on its risk.
Required return to equity = return of long-term treasury bonds + risk premium
1 Although the following companies should be included as part of the 50 largest companies in terms of marketcapitalization as of 05/12/31, they were not included in the sample due to lack of information: Tenaris SA (AR),Axtel SA (MX), CPFL Energia (BR), Gol (BR), Cencosud (CL), Natura (BR), Ideal (MX), Tam (BR), Santander(MX).
7/25/2019 50 Largest Companies- 2000-2005 Shareholder Value Creation in Latin America
http://slidepdf.com/reader/full/50-largest-companies-2000-2005-shareholder-value-creation-in-latin-america 4/9
J . Aznarez, O. Carbonell, P. Fernández and JM. Carabias, Shareholder value creation in Latin AmericaESE Business School, IPADE and IESE 50 largest companies: 2000-2005
4
We calculate the risk premium based on the Downside Risk approach (DCapm). This methodology
only considers the returns of the asset that are below its average return when the return of the market is
below its average return. It has been observed that for emerging markets the CAPM shows returns that
are small vis-a-vis the associated risk, while DCapm’s results are more appropriate for these kind of
markets (Carbonell López, Oscar; Hurtado Gracía, Francisco Javier and Pérez Tenorio, César Manuel,
2005; Estrada Javier, 2001). A company creates value for the shareholders when the shareholder returnexceeds the required return to equity.
The created shareholder value is quantified as follows:
Created shareholder value = Equity market value x (Shareholder return - Ke)
As we already saw that the shareholder return is equal to the shareholder value added divided by
the equity market value, the created value can also be calculated as follows:
Created shareholder value = Shareholder value added - (Equity market value x Ke)
Consequently, the value created is the shareholder value added above expectations, which are
reflected in the required return to equity.
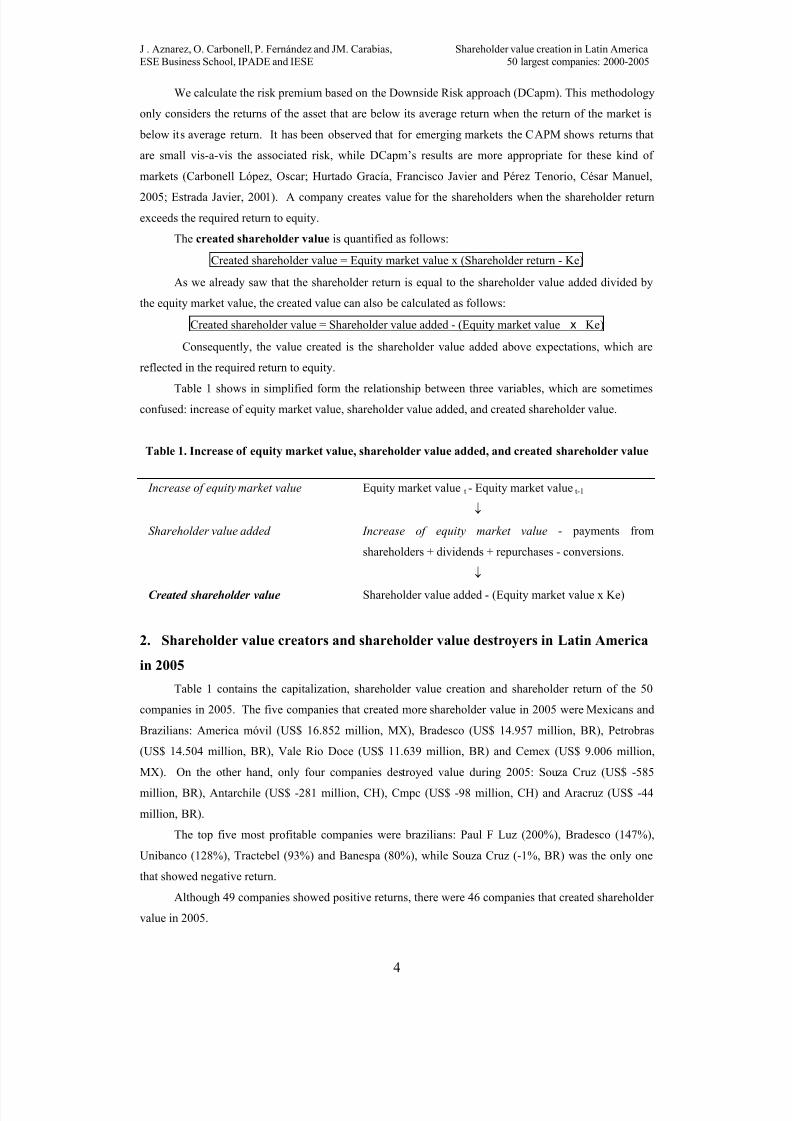
Table 1 shows in simplified form the relationship between three variables, which are sometimesconfused: increase of equity market value, shareholder value added, and created shareholder value.
Table 1. Increase of equity market value, shareholder value added, and created shareholder value
Increase of equity market value Equity market value t - Equity market value t-1
↓
Shareholder value added Increase of equity market value - payments from
shareholders + dividends + repurchases - conversions.
↓
Created shareholder value Shareholder value added - (Equity market value x Ke)
2. Shareholder value creators and shareholder value destroyers in Latin America
in 2005
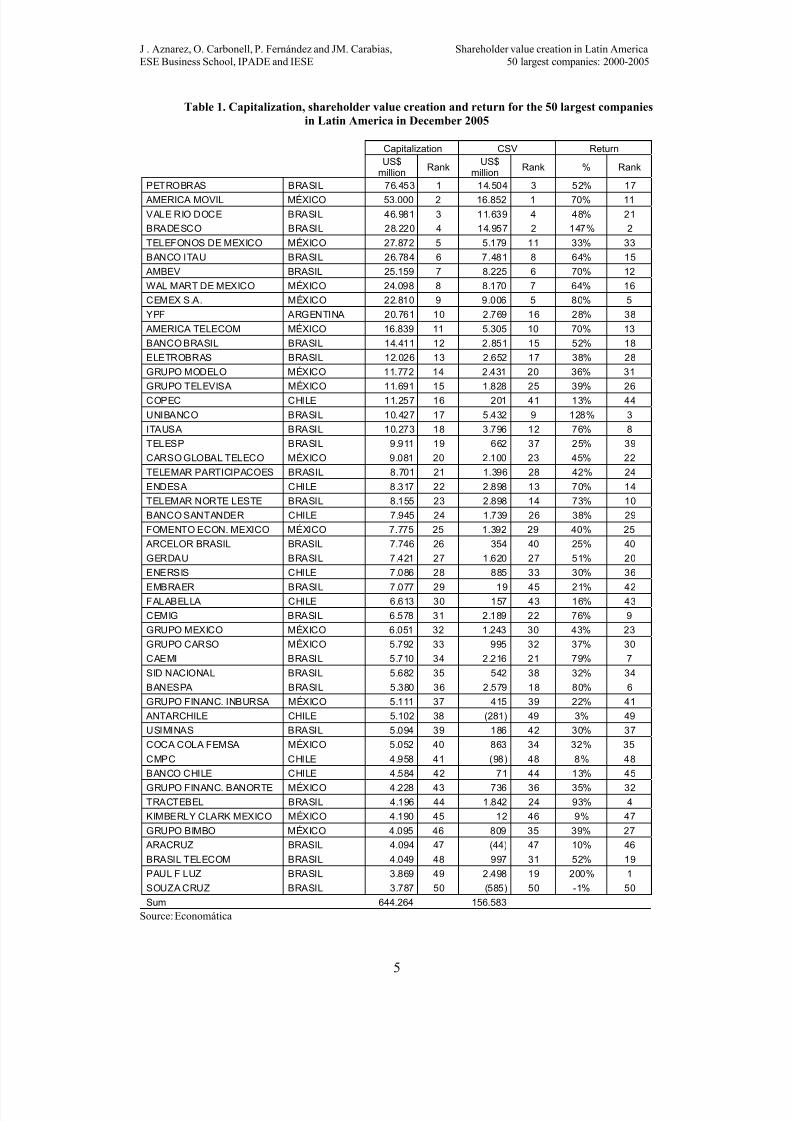
Table 1 contains the capitalization, shareholder value creation and shareholder return of the 50
companies in 2005. The five companies that created more shareholder value in 2005 were Mexicans and
Brazilians: America móvil (US$ 16.852 million, MX), Bradesco (US$ 14.957 million, BR), Petrobras
(US$ 14.504 million, BR), Vale Rio Doce (US$ 11.639 million, BR) and Cemex (US$ 9.006 million,
MX). On the other hand, only four companies destroyed value during 2005: Souza Cruz (US$ -585
million, BR), Antarchile (US$ -281 million, CH), Cmpc (US$ -98 million, CH) and Aracruz (US$ -44
million, BR).
The top five most profitable companies were brazilians: Paul F Luz (200%), Bradesco (147%),
Unibanco (128%), Tractebel (93%) and Banespa (80%), while Souza Cruz (-1%, BR) was the only one
that showed negative return.
Although 49 companies showed positive returns, there were 46 companies that created shareholder
value in 2005.
7/25/2019 50 Largest Companies- 2000-2005 Shareholder Value Creation in Latin America
http://slidepdf.com/reader/full/50-largest-companies-2000-2005-shareholder-value-creation-in-latin-america 5/9
J . Aznarez, O. Carbonell, P. Fernández and JM. Carabias, Shareholder value creation in Latin AmericaESE Business School, IPADE and IESE 50 largest companies: 2000-2005
5
Table 1. Capitalization, shareholder value creation and return for the 50 largest companies
in Latin America in December 2005
Capitalization CSV ReturnUS$
millionRank
US$million
Rank % Rank
PETROBRAS BRASIL 76.453 1 14.504 3 52% 17
AMERICA MOVIL MÉXICO 53.000 2 16.852 1 70% 11VALE RIO DOCE BRASIL 46.981 3 11.639 4 48% 21
BRADESCO BRASIL 28.220 4 14.957 2 147% 2
TELEFONOS DE MEXICO MÉXICO 27.872 5 5.179 11 33% 33
BANCO ITAU BRASIL 26.784 6 7.481 8 64% 15
AMBEV BRASIL 25.159 7 8.225 6 70% 12
WAL MART DE MEXICO MÉXICO 24.098 8 8.170 7 64% 16
CEMEX S.A. MÉXICO 22.810 9 9.006 5 80% 5
YPF ARGENTINA 20.761 10 2.769 16 28% 38
AMERICA TELECOM MÉXICO 16.839 11 5.305 10 70% 13
BANCO BRASIL BRASIL 14.411 12 2.851 15 52% 18
ELETROBRAS BRASIL 12.026 13 2.652 17 38% 28
GRUPO MODELO MÉXICO 11.772 14 2.431 20 36% 31
GRUPO TELEVISA MÉXICO 11.691 15 1.828 25 39% 26
COPEC CHILE 11.257 16 201 41 13% 44
UNIBANCO BRASIL 10.427 17 5.432 9 128% 3
ITAUSA BRASIL 10.273 18 3.796 12 76% 8
TELESP BRASIL 9.911 19 662 37 25% 39
CARSO GLOBAL TELECO MÉXICO 9.081 20 2.100 23 45% 22
TELEMAR PARTICIPACOES BRASIL 8.701 21 1.396 28 42% 24
ENDESA CHILE 8.317 22 2.898 13 70% 14
TELEMAR NORTE LESTE BRASIL 8.155 23 2.898 14 73% 10
BANCO SANTANDER CHILE 7.945 24 1.739 26 38% 29
FOMENTO ECON. MEXICO MÉXICO 7.775 25 1.392 29 40% 25
ARCELOR BRASIL BRASIL 7.746 26 354 40 25% 40
GERDAU BRASIL 7.421 27 1.620 27 51% 20
ENERSIS CHILE 7.086 28 885 33 30% 36
EMBRAER BRASIL 7.077 29 19 45 21% 42FALABELLA CHILE 6.613 30 157 43 16% 43
CEMIG BRASIL 6.578 31 2.189 22 76% 9
GRUPO MEXICO MÉXICO 6.051 32 1.243 30 43% 23
GRUPO CARSO MÉXICO 5.792 33 995 32 37% 30
CAEMI BRASIL 5.710 34 2.216 21 79% 7
SID NACIONAL BRASIL 5.682 35 542 38 32% 34
BANESPA BRASIL 5.380 36 2.579 18 80% 6
GRUPO FINANC. INBURSA MÉXICO 5.111 37 415 39 22% 41
ANTARCHILE CHILE 5.102 38 (281) 49 3% 49
USIMINAS BRASIL 5.094 39 186 42 30% 37
COCA COLA FEMSA MÉXICO 5.052 40 863 34 32% 35
CMPC CHILE 4.958 41 (98) 48 8% 48
BANCO CHILE CHILE 4.584 42 71 44 13% 45
GRUPO FINANC. BANORTE MÉXICO 4.228 43 736 36 35% 32TRACTEBEL BRASIL 4.196 44 1.842 24 93% 4
KIMBERLY CLARK MEXICO MÉXICO 4.190 45 12 46 9% 47
GRUPO BIMBO MÉXICO 4.095 46 809 35 39% 27
ARACRUZ BRASIL 4.094 47 (44) 47 10% 46
BRASIL TELECOM BRASIL 4.049 48 997 31 52% 19
PAUL F LUZ BRASIL 3.869 49 2.498 19 200% 1
SOUZA CRUZ BRASIL 3.787 50 (585) 50 -1% 50
Sum 644.264 156.583
Source: Economática
7/25/2019 50 Largest Companies- 2000-2005 Shareholder Value Creation in Latin America
http://slidepdf.com/reader/full/50-largest-companies-2000-2005-shareholder-value-creation-in-latin-america 6/9
J . Aznarez, O. Carbonell, P. Fernández and JM. Carabias, Shareholder value creation in Latin AmericaESE Business School, IPADE and IESE 50 largest companies: 2000-2005
6
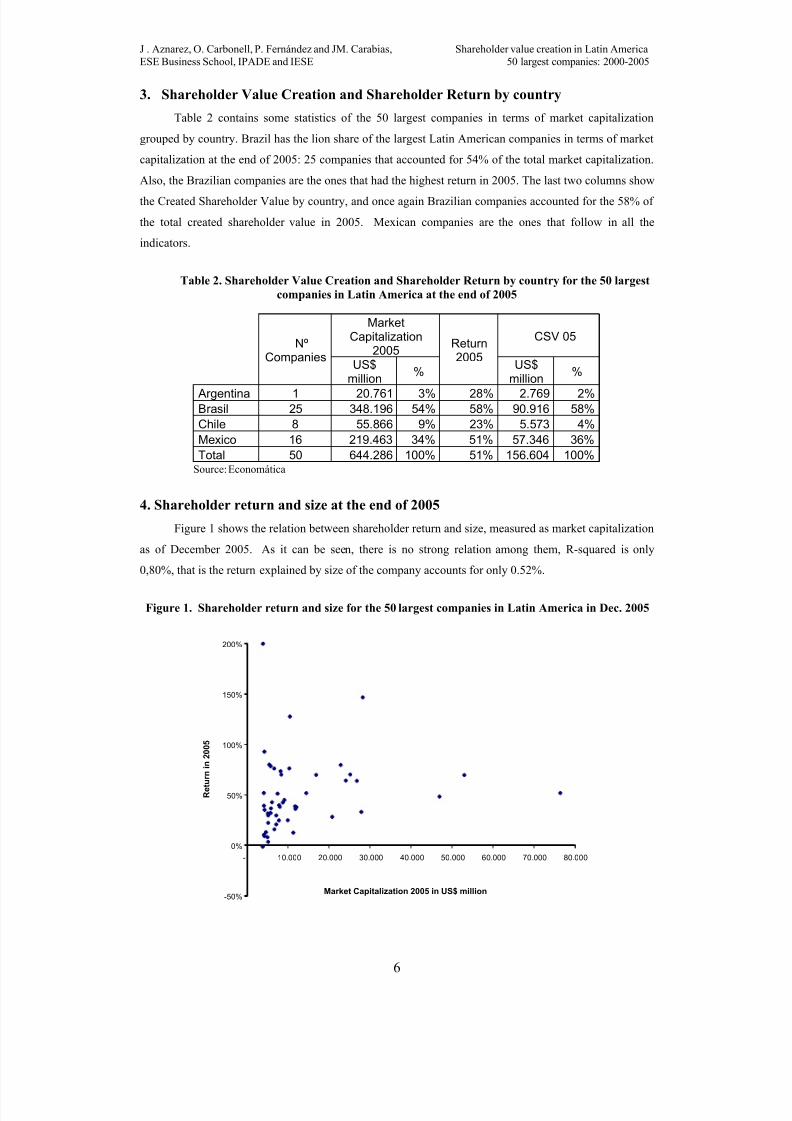
3. Shareholder Value Creation and Shareholder Return by country
Table 2 contains some statistics of the 50 largest companies in terms of market capitalization
grouped by country. Brazil has the lion share of the largest Latin American companies in terms of market
capitalization at the end of 2005: 25 companies that accounted for 54% of the total market capitalization.
Also, the Brazilian companies are the ones that had the highest return in 2005. The last two columns show
the Created Shareholder Value by country, and once again Brazilian companies accounted for the 58% of
the total created shareholder value in 2005. Mexican companies are the ones that follow in all the
indicators.
Table 2. Shareholder Value Creation and Shareholder Return by country for the 50 largestcompanies in Latin America at the end of 2005
MarketCapitalization
2005CSV 05
NºCompanies
US$million
%
Return2005
US$million
%
Argentina 1 20.761 3% 28% 2.769 2%Brasil 25 348.196 54% 58% 90.916 58%Chile 8 55.866 9% 23% 5.573 4%Mexico 16 219.463 34% 51% 57.346 36%Total 50 644.286 100% 51% 156.604 100%
Source: Economática
4. Shareholder return and size at the end of 2005
Figure 1 shows the relation between shareholder return and size, measured as market capitalization
as of December 2005. As it can be seen, there is no strong relation among them, R-squared is only
0,80%, that is the return explained by size of the company accounts for only 0.52%.
Figure 1. Shareholder return and size for the 50 largest companies in Latin America in Dec. 2005
-50%
0%
50%
100%
150%
200%
- 10.000 20.000 30.000 40.000 50.000 60.000 70.000 80.000
R e t u r n i n 2 0 0 5
Market Capitalization 2005 in US$ million

7/25/2019 50 Largest Companies- 2000-2005 Shareholder Value Creation in Latin America
http://slidepdf.com/reader/full/50-largest-companies-2000-2005-shareholder-value-creation-in-latin-america 7/9
J . Aznarez, O. Carbonell, P. Fernández and JM. Carabias, Shareholder value creation in Latin AmericaESE Business School, IPADE and IESE 50 largest companies: 2000-2005
7
5. Shareholder value creators, value destroyers and return in the previous years
for 39 companies
Table 3 contains the shareholder value creation of 39 companies2 in Latin America during the
four-year period 2000-2005. The top five companies that created shareholder value were Petrobras (US$
67.253 million, BR), Cemex (US$ 17.875 million, MX), Bradesco (US$ 15.201 million, BR), YPF (US$
14.741 million, AR), and Banco Brasil (US$ 14.183 million, BR), while the four companies that
destroyed shareholder value in the period were Embraer (US$ -1.265 million, BR), Carso Global Teleco
(US$ -917 million, MX), Brasil Telecom (US$ -390 million) and Enersis (US$ -70 million, CH). The
percentage of the companies that created value were 38%, 10%, 92%, 90% and 92% in 2001, 2002, 2003,
2004 and 2005 respectively.
Table 3. Shareholder value creation for 39 companies in Latin America in 2000-2005 and otherperiods
2000 - 2005 2001 – 2005 2002 - 2005 2003 - 2005 2004 - 2005US$
millionRank
US$million
RankUS$
millionRank
US$million
RankUS$
millionRank
PETROBRAS 67.253 1 58.246 1 72.209 1 39.430 1 26.967 1CEMEX S.A. 17.875 2 15.325 5 17.170 5 16.131 4 12.569 3
BRADESCO 15.201 3 18.344 2 22.845 2 19.738 2 17.347 2
YPF 14.741 4 15.489 4 19.992 4 9.231 7 6.000 9
BANCO BRASIL 14.183 5 9.771 6 11.439 7 7.341 11 5.096 11
WAL MART DE MEXICO 12.620 6 9.727 7 13.109 6 11.530 5 9.850 5
ITAUSA 7.656 7 6.675 10 8.575 9 7.644 8 5.720 10
GERDAU 7.130 8 7.304 9 7.365 13 5.375 15 3.498 17
BANCO SANTANDER 6.871 9 5 .974 14 6.400 17 5.432 14 3.585 16
BANCO ITAU 6.104 10 16.958 3 21.389 3 16.328 3 11.905 4
CAEMI 5.813 11 6.189 11 6.117 19 5.057 17 3.636 15
SID NACIONAL 5.678 12 6.021 13 6.286 18 2.900 28 1.721 27
TELEFONOS DE MEXICO 5.677 13 4.679 20 8.372 10 9.266 6 7.223 7
TELESP 5.521 14 6.082 12 8.352 11 4.239 19 2.451 22
AMBEV 5.518 15 8.085 8 11.150 8 7.590 9 7.908 6COPEC 5.100 16 5.078 18 5.078 23 627 36 414 35
ARCELOR BRASIL 4.685 17 5.220 17 4.959 24 4.236 20 2.295 24
SOUZA CRUZ 4.336 18 2.631 32 2.939 32 1.040 33 227 37
GRUPO CARSO 4.309 19 3.075 28 4.113 27 3.446 24 2.221 25
GRUPO FINANC. BANORTE 4.034 20 3.712 23 3.635 28 3.264 25 2.000 26
ENDESA 3.962 21 5.694 16 6.763 15 5.775 13 4.336 12
USIMINAS 3.926 22 4.980 19 5.283 21 3.077 26 1.631 28
TRACTEBEL 3.745 23 3.614 25 4.201 26 2.911 27 2.376 23
CEMIG 3.168 24 3.729 22 5.147 22 3.549 23 2.869 20
ANTARCHILE 3.065 25 3.031 29 2.651 33 520 37 119 38
FOMENTO ECON. MEXICO 2.985 26 3.167 27 3.396 30 3.636 22 2.514 21
BANCO CHILE 2.941 27 2.975 30 3.607 29 2.310 29 1.191 30
CMPC 2.366 28 2.800 31 3.003 31 848 34 375 36
GRUPO TELEVISA 2.133 29 4.502 21 7.923 12 6.710 12 4 .269 13UNIBANCO 2.011 30 3.416 26 6.880 14 7.581 10 6.507 8
TELEMAR NORTE LESTE 1.979 31 3.617 24 6.418 16 5.258 16 4.078 14
GRUPO BIMBO 1.971 32 1.448 33 2.269 34 2.016 31 1.413 29
GRUPO MEXICO 1.787 33 5.881 15 5.881 20 4.909 18 3.076 18
KIMBERLY CLARK MEXICO 1.465 34 1.331 34 2.183 35 2.098 30 1.055 32
2 For this study, we did not include the following companies in the sample due to lack of data: America Movil (MX),America Telecom (MX), Grupo Modelo (MX), G rupo Financ. Inbursa (MX), Vale Rio Doce (BR), Eletrobras (BR),Banespa (BR), Paul F Luz (BR), Telemar Tele NL (BR), Aracruz (BR), Falabella (CL).

7/25/2019 50 Largest Companies- 2000-2005 Shareholder Value Creation in Latin America
http://slidepdf.com/reader/full/50-largest-companies-2000-2005-shareholder-value-creation-in-latin-america 8/9
J . Aznarez, O. Carbonell, P. Fernández and JM. Carabias, Shareholder value creation in Latin AmericaESE Business School, IPADE and IESE 50 largest companies: 2000-2005
8
COCA COLA FEMSA 46 35 212 35 880 38 693 35 778 33
ENERSIS -70 36 92 36 1.922 36 1.258 32 1.071 31
BRASIL TELECOM -390 37 12 37 1.099 37 35 38 516 34
CARSO GLOBAL TELECO -917 38 -793 39 4.298 25 3.785 21 2.943 19
EMBRAER -1.265 39 -740 38 419 39 -2.641 39 -1.310 39
Sum 255.213 263.553 335.717 234.173 172.440
Source: Economática
Table 4 contains the historic shareholder return. In the periods 2000-2005, 2001-2005 and 2004-
2005, 38 companies had positive shareholder returns. In the periods 2002-2005 and 2003-2005 the 39
companies studied had positive shareholder returns.
Table 4. Shareholder return for 39 companies in Latin America in 2000-2005 and other periods
2000 – 2005 2001 – 2005 2002 - 2005 2003 - 2005 2004 – 2005
% Rank % Rank % Rank % Rank % Rank
CAEMI 1238% 1 1242% 1 932% 2 249% 2 79% 5
ARCELOR BRASIL 1049% 2 1121% 2 573% 10 208% 4 25% 31
GERDAU 940% 3 861% 4 742% 5 174% 8 51% 16
SID NACIONAL 759% 4 758% 5 794% 3 100% 23 32% 26BANCO BRASIL 669% 5 396% 8 666% 6 139% 15 52% 13
PETROBRAS 669% 6 396% 9 666% 7 139% 16 52% 14
USIMINAS 617% 7 979% 3 1478% 1 133% 17 30% 28
GRUPO FINANC. BANORTE 581% 8 343% 10 258% 17 150% 14 35% 24
TRACTEBEL 572% 9 441% 7 777% 4 179% 7 93% 3
SOUZA CRUZ 426% 10 212% 17 226% 21 38% 35 -1% 39
CEMEX S.A. 355% 11 213% 16 246% 19 171% 9 80% 4
ANTARCHILE 292% 12 233% 15 153% 33 22% 38 3% 38
CEMIG 266% 13 264% 13 534% 11 152% 13 76% 7
ITAUSA 231% 15 170% 22 302% 16 182% 5 76% 6
GRUPO CARSO 231% 14 146% 25 207% 24 112% 19 37% 23
YPF 229% 16 234% 14 442% 13 70% 28 28% 30
BRADESCO 226% 17 311% 11 594% 9 263% 1 147% 1
COPEC 222% 18 188% 20 161% 31 27% 37 13% 35BANCO SANTANDER 221% 19 156% 23 187% 28 109% 20 38% 22
BANCO ITAU 203% 20 267% 12 457% 12 160% 11 64% 11
WAL MART DE MEXICO 203% 21 115% 30 157% 32 103% 21 64% 12
TELESP 194% 22 186% 21 253% 18 75% 27 25% 32
CMPC 191% 23 197% 19 204% 25 31% 36 8% 37
ENDESA 190% 24 205% 18 316% 14 163% 10 70% 9
FOMENTO ECON. MEXICO 169% 25 134% 27 112% 36 101% 22 40% 19
GRUPO BIMBO 163% 26 85% 33 143% 34 93% 24 39% 21
GRUPO MEXICO 162% 27 686% 6 594% 8 180% 6 43% 18
BANCO CHILE 137% 28 120% 29 198% 27 64% 29 13% 34
TELEMAR NORTE LESTE 128% 29 141% 26 316% 15 157% 12 73% 8
AMBEV 118% 30 154% 24 234% 20 90% 25 70% 10
TELEFONOS DE MEXICO 103% 31 63% 35 70% 39 60% 30 33% 25
GRUPO TELEVISA 101% 32 113% 31 225% 22 121% 18 39% 20KIMBERLY CLARK MEXICO 97% 33 51% 37 79% 37 59% 31 9% 36
UNIBANCO 51% 34 84% 34 204% 26 224% 3 128% 2
EMBRAER 45% 35 125% 28 170% 30 18% 39 21% 33
COCA COLA FEMSA 43% 36 55% 36 71% 38 44% 34 32% 27
CARSO GLOBAL TELECO 35% 37 19% 38 130% 35 85% 26 45% 17
BRASIL TELECOM 28% 38 109% 32 178% 29 54% 32 52% 15
ENERSIS -26% 39 -4% 39 215% 23 50% 33 30% 29
Source: Economática

7/25/2019 50 Largest Companies- 2000-2005 Shareholder Value Creation in Latin America
http://slidepdf.com/reader/full/50-largest-companies-2000-2005-shareholder-value-creation-in-latin-america 9/9
J . Aznarez, O. Carbonell, P. Fernández and JM. Carabias, Shareholder value creation in Latin AmericaESE Business School, IPADE and IESE 50 largest companies: 2000-2005
9
6. Shareholder return and size for 39 companies in Latin America in the previous
years
Figure 2 shows the relation between shareholder return and size, measured as market capitalization
for the period 2000-2005. There is no significant relation among them, R-squared is 0,43%, that is the
difference in size only explains 0.43% of the return.
Figure 2. Shareholder return and size for the 50 largest companies in Latin America in 2000-2005
-200%
0%
200%
400%
600%
800%
1000%
1200%
1400%
- 1 0. 00 0 2 0. 00 0 3 0. 00 0 4 0. 00 0 5 0. 00 0 6 0. 00 0 7 0. 00 0 8 0. 00 0 9 0. 00 0
R e t
u r n i n 2 0 0 5
Market Capitalization 2005 in US$ million
REFERENCES
Carbonell López, Oscar; Hurtado Gracía, Francisco Javier and Pérez Tenorio, César Manuel (2005) DCAPM en Mexico: Un modelo alternativo para estimar el costo de capital , Working paper.
Estrada, Javier (2000), The Cost of Equity in Emerging Markets: A Downside Risk Approach , EmergingMarkets Quarterly, Fall, 19-30.
Estrada, Javier (2001), The Cost of Equity in Emerging Markets: A Downside Risk Approach (II) ,Emerging Markets Quarterly, Spring, 63-72.
Fernandez, Pablo (2002), Valuation and Shareholder Value Creation, Academic Press. San Diego, CA.