50 års jubilæum - dorsnet.dk · 2 19 leder redaktion : ansv. sanne wøhlk (sw) tor fog justesen...
TRANSCRIPT
Tilbageblik • Tutorial on smart markets • Sustainable Course • Optimering for Transrail Sweden AB
Sep
tem
ber 2
012
orbi t # 19
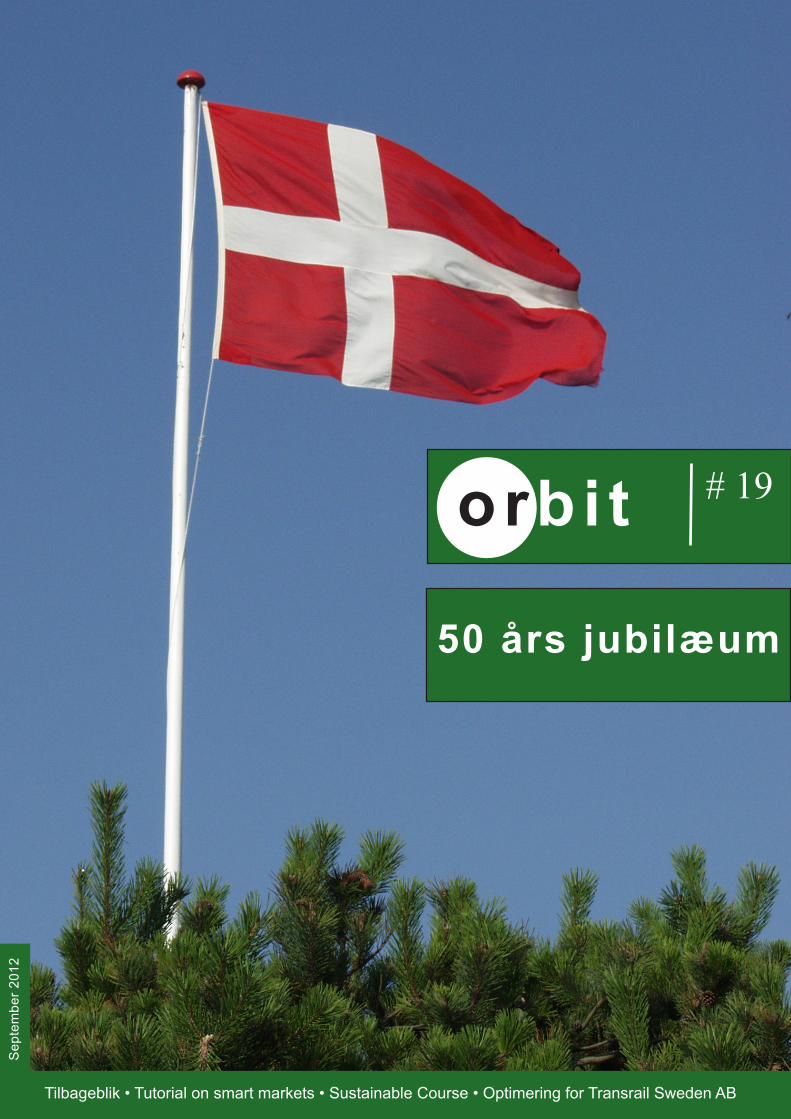
50 års jubilæum

2 ORbit 19
leder
Redaktion:Ansv. Sanne Wøhlk (sw)Tor Fog Justesen (tfj)Jesper Larsen, DORS (jla)Tomas Gustafsson, SOAF (tg)
DORSDTU Management, bygn. 424Danmarkt Tekniske UniversitetDK-2800 Kgs. LyngbyTelefon: +45 4525 3385Fax: +45 4588 2673E-mail: [email protected]
Næste deadline:1. Marts 2013
Tryk: Print Provider Aps
Oplag: 370ISSN 1601-8893
Forside: colourbox.com
Aktuelt om DORS
ORbit medlemsblad for Dansk Selskab for OperationsanalyseogSvenska Operationsanalys-föreningen
SekretariatDORSDTU ManagementBygning 424Danmarks Tekniske Universitet,2800 Kgs. Lyngbye-mail: [email protected]: www.dorsnet.dk
MedlemsskabKontingentsatser for 2012
Personlige medlemmer(incl. ph.d.-studerende): 270 kr./årStuderende: 60 kr./årFirmamedlemmer: 3200 kr./årInstitutmedlemmer: 1800 kr./år
Den 29. Maj 2012 modtog jeg en mail fra DORS formanden Tor Justesen, hvori
and anmodede mig om at varetage posten som chefredaktør for ORbit. Jeg er
meget beæret over den tillid bestyrelsen herved viste mig, og tog men glæde
imod udfordringen.
ORbit er et fantastisk blad. Det bringer populærvidenskabelige artikler om OR
fra dan danske forskningsfront og fra erhvervslivet og bringer nyheder fra det
store udland. Den tidligere redaktion har gjort et kæmpe arbejde med at samle
materiale og få udgivet bladet. Det skal lyde en stor tak til Jesper Larsen, og i de
seneste år, Natalia Rezanova, for deres store indsats for ORbit.
Hvad er så min vision med ORbit? ORbit skal fortsat være et medie for formidling af OR relateret stof i et
letfordøjeligt sprog. Det er mit håb at de der arbejder med OR i hverdagen, hvad enten det drejer sig om
akademisk forskning eller gennem en mere praktisk tilgang i erhvervslivet, vil genfinde lysten til både at
læse og bidrage til ORbit.
Var det det? Nej. ORbit er et medlemsblad. Derfor er det af yderste vigtighed, at vi kan bruge bladet til at
annoncere både foreningernes egne arrangementer og andre arrangementer, som er af generel interesse
for foreningens medlemmer. For at sikre dette, er det målet at ORbit fremadrettet skal udkomme: fast midt i
foråret og midt i efteråret. Så krydser jeg fingre for at skrivelysten bland medlemmerne er tilstrækkelig stor
til at vi alle kan få et lækkert blad at læse.
Det første blad er færdigt. ORbits klassiske røde design er udskiftet med et grønt, og dette jubilæumsek-
semplar bugner af spændende artikler. Oli B.G. Madsen fortøæller om sin introduktin til operationsanalyse
i 1964 og John F. Raffensperger giver en introduktion til smart markets. I bladet findes også to DORSpris
artikler og meget meget mere. God læselyst!
Sanne Wøhlk
Ansvarshavende redaktør
Leder
3 ORbit 19
Redaktøren har ordet 2
SOAF 2012 3
Tillykke fra DORS formanden 4
Dantzigs besøg 1976 5
Those were the days 6
Beslutningsstøtte ved container-fragt
SOAF Exjobbspris
DORS prisen
A tutorial on smart markets
9
12
13
14
Om AOO 2012 20
A sustainable course? 22
Optimering for Transrail 24
EURO summer institute 26
Strategic balanced scorecard simulation 29
Om optimal tildeling af KBU-forløb 34
High school planning 38
indhold
Indhold
Aktuellt om SOAF
SOAF Medlemsavgifter 2012:
• Individuella medlemmar (inkl. ORbit): 150 kr• Juniormedlem (exkl. ORbit): 75 kr• Akademiska institutioner (3 ORbit): 1500 kr• Företag med 1-5 intressenter (2 ORbit): 1500 kr• Företag med 6-10 intressenter (4 ORbit): 3000 kr• Företag med fler än 10 intressenter (6 ORbit): 4500 kr
Betala in på postgiro: 19 94 48-2 (Svenska Operationsanalysförenin-gen)
e-mail: [email protected]
Internet: www.soaf.se
Företagsmedlemmar:• Blekinge Tekniska Högskola• Cambio Healthcare Systems AB• FOI• Green Cargo• Högskolan i Skövde• Industrial Optimizers• Jeppesen• Kungliga Tekniska Högskolan• Linköpings Universitet• Optimal Solutions AB• Preference
• Riiplan• Scania• SICS• SJ• Systecon• Trafikverket• Transrail Sweden AB• Uppsala Universitet• Vattenfall• Vectura• Volvo Aero
Hösten närmar sig så smått, och med den börjar aktiviteterna i SOAF komma
igång igen efter sommaruppehållet. När jag tänker tillbaka på halvåret som har
gått så känns det som att aktivitetsnivån i SOAF för närvarande är hög, och
att väldigt mycket har hänt! Under våren har SOAF bland annat startat två nya
intressegrupper: Underhållsgruppen, som leds av Michael Patriksson, hade
sitt första möte den 6 mars på Volvo Aero i Trollhättan, och hälso- och sjuk-
vårdsgruppen (ledd av Marie Persson) träffades den 16:e januari på Karolinska
Institutet i Stockholm. SOAF har också haft årsmöte den 13 mars i Karlskrona,
då undertecknad valdes till ordförande efter Martin Joborn, som glädjande nog
stannar kvar i styrelsen tills vidare. Glädjande var också att Ximena Karlsson på MTR valdes in som ny
adjungerad styrelsemedlem. På årsmötet föreslogs det också att vi ska fortsätta fokusera på intressegrup-
per, OR-utbildning samt eventuellt öka vårt internationella arbete genom EURO och IFORS. Vinnare av
exjobbspriset 2011 är Ferran Mach med examensarbetet »Optimization analysis of the number and location
of holding control stops - A simulation-based evaluation of line number 1, Stockholm”.
Den 9 maj anordnade SOAF, tillsammans med SICS och Trafikverket, en järnvägskonferens på SICS i
Kista. Arrangemanget var mycket uppskattat av deltagarna och kommer få en efterföljare under hösten!
SOAF har också under sommaren varit representerat vid EURO-konferensen i Vilnius. I dag samlas mycket
stora datamängder in i närmast alla branscher och sektorer, och detta innebär stora möjligheter, men också
utmaningar, för operationsanalysen. Då jag i sommar också kunnat besöka AAAI, en av de stora konfe-
renserna inom AI-området, så är det tydligt att det också där finns ett stort intresse för ”analytics”, d.v.s.
identifiering av mönster i datamängder, samt att rekommendera beslut utifrån dessa. Styrelsen kommer att
fortsätta diskutera denna trend under hösten. SOAF har också uppdaterat webbsidan under året, och vi
kommer under hösten gå igenom och uppdatera informationsmaterialet på denna.
Jag ser fram emot en aktiv höst med mycket nya och spännande aktiviteter!
Markus Bohlin
Ordförande SOAF
Bästa SOAF-medlemmar!
4 ORbit 19
Ifølge vedtægterne er selskabets formål er at fremme den operationsanalytiske forskning og anvendelse af operationsanaly-tiske metoder i Danmark samt at formidle kontakten med tilsvarende foreninger og organisationer, ved i videst mulige omfang at etablere forbindelse med andre landes operationsanalytiske forskere, organisationer og sammenslutninger, og ved at foran-stalte medlemmernes deltagelse i møder, kongresser, seminarer og lignende om operationsanalytiske spørgsmål.
For at alle disse gode hensigter skal kunne føres ud i livet er der behov for hænder. Selskabet er drevet udelukkende ved frivillig arbejdskraft, og foreningens har kun kunnet overleve i alle disse år, takket være utallige personers lyst og overskud til at bruge utallige timer og aftener på at arrangere seminarer, workshops, virksomhedsbesøg, indkræve kontingent, opdatere medlemsdatabase, opsætte og tilrette ORbit, osv. Der skal således lyde en stor TAK til alle tidligere bestyrelser og øvrige per-soner der alle har arbejdet aktivt for selskabet, hvad enten det har drejet sig om at hjælpe til med det praktiske i forbindelse med et arrangement, eller det har drejet sig om en omlægning af klubbens medlemsdatabase og -håndtering.
DORS er til for sine medlemmer, men omvendt ville DORS ikke eksistere, hvis ikke det netop var for medlemmerne; jeres støtte af foreningen er uvurderlig! Uden at jeg kan sige hvordan fremtiden bliver, så vil jeg love, at både den nuværende bestyrelse og de kommende bestyrelser vil gør alt hvad de kan for at sikre, at DORS forbliver kilden til et godt netværk for operationsanalytikere.
Med disse ord vil jeg med stolthed ønske DORS et kæmpe stort TILLYKKE med de 50 år. Og så vil jeg glæde mig til de næste mange år, som forhåbentlig vil byde på endnu flere spændende OR-relaterede oplevelser!
Tor Fog JustesenFormand for DORS
Hip hip hurra
Dansk Selskab for Operationsanalyse blev stiftet 21. august 1962 og kan således i år fejre sit 50 års jubilæum.
DORS’ firma- og institutmedlemmerInstitutmedlemmer• Afdeling for Anvendt Matatematik og Statis-tik, Københavns Universitet
• Afdelingen for Operationsanalyse, Aarhus Universitet
• Center for Research in the Foundations of Electronic Markets
• CORAL, Handelshøjskolen, Aarhus Uni-versitet
• Datalogisk Institut, Københavns Universitet • Institut for Virksomhedsledelse og Økonomi, SDU
• Institut for Planlægning, Innovation og Ledelse (DTU Management), Danmarks Tekniske Universitet
• Institut for Transport (DTU Transport), Danmarks Tekniske Universitet
Firmamedlemmer• Ange Optimization• A.P. Møller – Mærsk• DONG Energy• DSB• DSB S-tog• Jeppesen• Københavns Lufthavne• MOSEK• Novo Nordisk (CMC Clinical Supplies)• Rapidis• TransvisionHermes Traffic Intelligence

5 ORbit 19
Denne artikel af William Cauchi blev først publiceret i Politiken 8. September 1976. Artiklen er gentrykt her med tilladelse. Redaktionen takker Politiken for deres velvillighed.

6 ORbit 19
artikel
Efter studentereksamen begyndte jeg på elektroingeniørstudiet på DTU den 1. september 1961. Det foregik i DTU’s gamle lokaler på Sølvtorvet, men alle-rede i 1962 flyttede undervisningen til Lyngby, hvor vi sammen med årgang 1962 som de første tog de nye bygnin-ger på den nuværende DTU campus i brug. Elektroingeniørstudiet valgte jeg nok primært, fordi det var et civilinge-niørstudium, og fordi man lige havde omlagt hele studiet og havde lagt mere matematik ind i studieplanen. Endvidere var det nye studium det sværeste at komme ind på i 1961, og man skulle til Lyngby til en helt ny campus. Der var en masse pionerånd over det.
Studieplanerne var dengang helt faste. Man skulle som svagstrømsingeni-ørstuderende tage nogle bestemte fag i bestemte semestre, og eksaminerne skulle bestås samlet. Studiet bestod af en treårig første del opdelt i 3 årsprøver, en etårig forprøve og en halvanden årig slutprøve, i alt 5 ½ år. Hvis man ikke bestod, så skulle alle fag hørende til den pågældende prøve tages om.
Jeg fandt hurtigt ud af, at de elektrotek-niske fag ikke kunne bringe mit blod i kog, men fysik og især matematik var inspirerende. Heldigvis fandt jeg efter
at have bestået første del sommeren 1964 ud af, at jeg kunne ”specialisere” mig i anvendt matematik. Det forgik på den måde, at man kunne læse nogle ekstra fag mod at droppe ét elektrofag. Det var lige noget for mig, selvom det gav et ekstra pres på studiet. Blandt de ekstra fag var numerisk analyse, funktionalanalyse, Markoffprocesser, videregående matematisk statistik, vide-regående kompleks funktionsteori samt operationsanalyse fag.
Mit første møde med operationsanaly-sen fandt sted foråret 1964 ved en elek-tronikforelæsning, hvor en af mine med-studerende sad og bladede i en bog. Jeg spurgte om, hvad han læste. Det
viste sig at være bogen »Introduc-tion to Operations Research« af Churchman, Ackoff og Arnoff. Jeg
bladede i bogen og fandt ud af, at det så meget spændende ud. Det var min introduktion til operationsanalyse, og det påvirkede ret drastisk min fremtid.
Operationsanalyseundervisningen forgik på det i 1963 oprettede Institut for Mate-matisk Statistik og Operationsanalyse (i 1967 opfandt min daværende kollega Flemming Rasmussen og jeg det kortere navn IMSOR). Instituttet var udsprunget af Laboratoriet for Anvendt Matematik,
som var ledet af den navnkundige pro-fessor Richard Petersen (1894-1969), i populær omtale kaldet lille p. IMSOR var ledet af professor Arne Jensen (1920-2008). Han var oprindelig aktu-aruddannet i 1944 og var meget opta-get af Erlangs køteoretiske arbejder; noget ret naturligt da Arne Jensen var knyttet til KTAS, Københavns Telefon Aktie Selskab. Han var tillige knyttet til Københavns Universitet (KU) i perioden 1946-1963 og blev i 1954 dr.phil. på en afhandling om stokastiske processer. Derudover var han tidligt opmærksom på operationsanalysens betydning efter et ophold i USA som Rockefeller stipen-diat. Han underviste i 1950erne i lineær programmering (LP) på KU, og blev i 1962 lektor på DTU, hvor han året efter blev professor.
Foruden på DTU var der også andre steder i Danmark, hvor man interesse-rede sig for OR. På Økonomisk Institut på KU underviste professor Sven Danø (1922-1998) i OR. Danø udgav bogen »Linear Programming in Industry – Theory and Applications« i 1960. Han var en af de få danskere, som George B. Dantzig kendte til. Jeg husker, at Dantzig fortalte mig om Danø’s cases fra en iscreme fabrik. På Århus Universi-tet underviste professor i driftsøkonomi Svend Fredens i lineær programmering, simulation, lagerteori og køteori. På Handelshøjskolen i København (HHK)
Those were the days - erindringer fra min OR debut
Af Oli B.G. Madsen
»Det var min introduktion til operationsanalyse, og det påvirkede ret drastisk min fremtid.«
I anledning af DORS’s 50 års jubilæum har redaktionen bedt professor Oli B.G. Madsen fra DTU dele mine minder fra operationasnalysens spæde ungdom i Danmark. Oli fortæller:

7 ORbit 19
artikel
underviste Erik Johnsen (f. 1928) i OR. Han havde opholdt sig på Princeton i 1955/56. Blev derefter knyttet til HHK og blev professor der i 1969. Han var tillige på det tidspunkt knyttet til IMSOR som ekstern underviser. Johnsen udgav i 1962 bogen »Introduktion til Opera-tionsanalyse«. På den første danske it-virksomhed Regne-centralen stiftet i 1955 og producent af de første danske compu-tere DASK (1958) og GIER (1961) var der også et blomstrende OR-miljø. Der arbej-dede man bl.a. med anvendelsen af OR i produkti-onsplanlægning. Jeg arbejdede 1965-1967 på Regnecentralen for at tjene til studierne og var meget betaget af den inspirerende atmosfære, der var der.
Undervisningen i OR i 1964-1967 var noget anderledes end i dag. Vi havde f.eks. to semestre med dynamisk pro-grammering (med Peter Mark Pruzan som underviser). Derimod lærte vi om lineær programmering som en biting i faget investeringsplanlægning (med Inge Thygesen som underviser). Pruzan (f. 1936) kom fra USA, hvor han var uddannet på Harvard, Princeton og Case-Western Reserve University. Thygesen (f. 1935) var ligesom Arne Jensen aktuaruddannet og havde bl.a. opholdt sig et år på Massachusetts Institute of Technology i Boston, USA. Både Jensen, Pruzan og Thygesen var således velbevandrede i den nyeste udvikling inden for OR fra deres tid i USA. Arne Jensen selv underviste ikke meget.
Mit speciale, som jeg arbejdede på april-oktober 1966, handlede om et kom-bineret produktionsplanlægnings- og transportproblem baseret på en virkelig problemstilling i et korn- og foderstof-kompagni. Problemet kunne under visse
forudsætninger formuleres som et LP problem, men med 4090 restriktioner og 45056 variable. Da den mest effektive LP løser i Danmark på dette tidspunkt, LP/90, kun kunne håndtere op til 1023 restriktioner og én million koefficienter forskellig fra nul, måtte der foretages en aggregering af modellen. LP/90 kørte
på Danmarks dengang største computer en IBM 7090 mainframe, som stod på DTU, og som var en gave fra IBM i 1965. IBM 7090 havde en ordlængde på 36 bit og et lager på 32 K. Den kostede i 1960 som ny
2.898.000 US$ svarende til omkring 21-22 millioner danske kroner (til sammen-ligning var startlønnen i 1960 for en civil-ingeniør omkring 1900 kr. om måneden før skat). På dette tidspunkt fandtes der ikke noget modelleringssprog som f.eks. GAMS eller OPL, så man hurtigt kunne generere en for computeren læsbar model. Jeg måtte selv konstruere en relativt generel modelgenera-tor som en del af specialet. Program-koden blev programmeret i FORTRAN IV, og program og grunddata blev fodret ind i computeren via hulkort. Da beregningstiden (Blot for at finde opti-mum eksklusive følsomhedsanalyser) var temmelig lang, kunne jeg kun køre programmet i weekenderne, hvor det var muligt at reservere computeren udeluk-kende til eget brug. Som eksempler på beregningstider kan nævnes 140 min for en 512x5632 LP model, 133 min for 512x3616 og 99 min for 318x1640. Man fodrede computeren med stabler af hulkort. Så stod den og læste den inverse basis frem og tilbage mellem to magnettapebåndstationer. En runde for hver iteration. Det var især det, der tog
tid. Til sidst kom der en høj stabel papir ud af printeren. Der var ingen, der rigtig kendte til hvordan man anvendte LP/90, så det måtte man selv finde ud af.
Det var en meget spændende periode, hvor mange emner var i sin vorden. Dantzig og Ramser havde skrevet om ’The Truck Dispatching Problem’ i 1960. Dantzig og Wolfe havde præsenteret deres dekompositionsmetode i 1960, men den blev ikke rigtig brugt til noget bortset fra Gilmore og Gomory’s løsning af ’The Cutting Stock Problem’ i 1961-1963. Land og Doig ’opfandt’ branch-and-bound (BB) i 1960. BB blev anvendt på the travelling salesman problem (TSP) af Little, Murty, Sweeney og Karel i 1963, men var kun kendt af nogle få i Danmark. Clarke og Wright’s Savings algoritme var lige præsenteret i 1964 og heltalsprogrammering var i sin spæde vorden. Gomory’s cutting planes fra 1950erne var kendt, men de fungerede i
1964 endnu ikke i praksis.
Problemet med at løse større LP problemer fascinerede mig
så meget, at jeg valgte dette som emne for mit ph.d.-studium, som startede lige efter, at jeg var blevet civilingeniør den 1. februar 1967. Det hed dengang et licentiatstudium. Emnet var dekomposi-tion og matematisk programmering.
Under ph.d.-studiet deltog jeg i en række internationale konferencer, hvor der blev opbygget gode kontakter til internatio-nalt kendte forskere. Eksempelvis deltog jeg sommeren 1969 i NATO Advanced Institute on Integer and Nonlinear Pro-gramming. Konferencen foregik på Île de Bendor, en lille ø, der ligger ud for Frankrigs middelhavskyst mellem Mar-seilles og Toulon. Det var en rigtig øjen-åbner med deltagelse af mange af tidens store kanoner, f.eks. George Dantzig,
»IBM 7090 havde en ordlængde på 36 bit og et lager på 32 K. Den kostede i 1960 som ny 2.898.000 US$ svarende til omkring 21-22 milli-oner danske kroner«
»Dantzig og Wolfe havde præ-senteret deres dekompositions-metode i 1960, men den blev ikke rigtig brugt til noget bort-set fra...«
8 ORbit 19
artikel
Philip Wolfe, R. Fletcher, M.J.D. Powell, Martin Beale, Richard Cottle, David Gale, Ralph Gomory, Fred Glover, Egon Balas, G.W. Graves, Claude Berge, samt lovende yngre forskere som John Tomlin, Gautam Mitra og Hans Jürgen Zimmerman. Jeg fik lært nogle af dem godt at kende på de 12 dage, som konferen-cen varede og fik samtidig en fin opdatering af state-of-the-art inden for området.
Året efter deltog jeg i den internationale konference ’Optimisation Methods’, som foregik på Hotel Marienlyst i Helsingør. Her var en del af ovennævnte personer til stede foruden Arthur Geoffrion, Peter Hammer, Michael Held, Ellis L. Johnson, Leon Lasdon, Allan Manne, William Orhard-Hays og Harvey Wagner. Jeg
skulle her holde et foredrag om dekom-position og var godt nervøs ved at have Dantzig og Wolfe som tilhørere. Det gik dog over al forventning.
NATO’s research foundation var den gang sponsor for mange videnskabe-
lige møder, som ikke nødvendigvis havde noget med krig at gøre. For-
uden ovennævnte møde på Île de Bendor, deltog jeg også i 1972 i et 12 dages møde i Cambridge omhandlende ’Decomposition of Large Scale Systems’ og i 1974 i et 12 dages møde i Versailles om ’Combinatorial Optimisation’. Disse ret lange møder på mindre steder var meget værdifulde, da man virkelig fik tid til at lære folk at kende.
DORS, som jo var blevet stiftet i 1962, var i denne periode også et aktivt forum for OR interesserede. Der blev bl.a. hvert år arrangeret et meget fornøje-ligt og inspirerende weekendmøde, hvor OR interesserede fra hele landet mødtes. Jeg husker møder i Holstebro, Svendborg og Nordborg, som var meget succesfulde.
Siden da er der sket utrolig meget både med hensyn til undervisning, computere, modeller, algoritmer og anvendelser, en udvikling, der bestemt ikke er slut, men som accelererer mere og mere.
Oli B.G. Madsen professor, dr.techn., er ansat ved Institut for Transport på DTU.
»DORS, som jo var blevet stif-tet i 1962, var i denne periode også et aktivt forum for OR interesserede.«
DTU Management annoncerer følgende foredrag:
• Thursday 6/9 Jørgen Haahr “Heuristic Planning of Shared Backup Path Protection”.
• Thursday 20/9 Margret Otterstedt “Statistics and OR (CART & SP) for New Mortgage Refinancing Strategies”
• Thursday 4/10 Joakim Juhl “An ethnography on mathe matical models - Producing science and technology”
• Thursday 1/11 Trine Krogh Boomsma “TBA”
• Thursday 15/11 Michael Pascal Simonsen Nielsen “TBA”
• Thursday 29/11 Thomas Stidsen “TBA” Line Blander Reinhardt “Liner shipping”
• Thursday 6/12 Tor Justesen “Aircraft Stand Allocation with Asso ciated Resource Scheduling”
• Thursday 20/12 Agnieszka Konicz “TBA” Jonas Christen sen, Karen Arntoft “Patient Admission Scheduling”
Se DTU Management’s hjemmeside for detaljer.
Arc Routing Workshop
CORAL, Aarhus university is responsible for organizing a workshop on arc routing.
Venue: Hotel Scandic Copenhagen
Date: 22-24 May 2013
Organizing committee:• Ángel Corberan, Universidad de Valencia, Spain• Bruce Golden, University of Maryland, US• Geir Hasle, SINTEF, Norway• Richard Eglese, Lancaster University Management School, UK• Sanne Wøhlk, Aarhus University, Denmark
More information will follow on Aarhus Universities webpage.
9 ORbit 19
DORS pris
Motivation for at håndtere forsinkelser
Skibstransport af containere er den mest brugte og energief-fektive metode til fragt af store mængder gods på tværs af kloden. Eksempelvis foregår en væsentlig del af verdens samlede transport via de utallige ruter fra fabrikkerne i Øst-asien til forbrugerne i Nordamerika og Europa. Den enkelte container håndteres typisk af et liner shipping firma. Firmaet
opererer et netværk af skibe, som sejler med regelmæssige afgange efter et fastlagt skema. Det er shippingfirmaet, der beslutter, hvordan den enkelte container transporteres fra oprindelsen til destinationen. For at få fyldte skibe og opnå economies-of-scale vælger liner shipping firmaer oftest et netværksdesign, som medfører, at den enkelte container skal skifte skib en eller flere gange.
Et firma som Mærsk Line, der opererer mere end 600 containerskibe og hver dag flytter millioner af containere, oplever konstante forstyrrelser af deres globale transport net-værk. Ifølge et studie oplever 70-80 % af alle containerskibe forsinkelser i minimum én havn igennem en rundtur. De typiske årsager er dårlige vejrforhold, køer i vigtige passager eller ekstraordinære ventetider i havne, men også pirateri, medarbejderstrejker og politisk ustabilitet kan påvirke sejladserne.
De mange forsinkelser af sejladserne påvir-ker direkte pålideligheden, men medfører også store økonomiske tab for liner shipping firmaerne. En forsinkelse af et enkelt skib kan betyde, at flere tusinder containere bliver forsinkede og i værste fald misser forbindel-
Beslutningsstøtte til håndtering af forsinkelser icontainerfragt
Af Jakob Dirksen
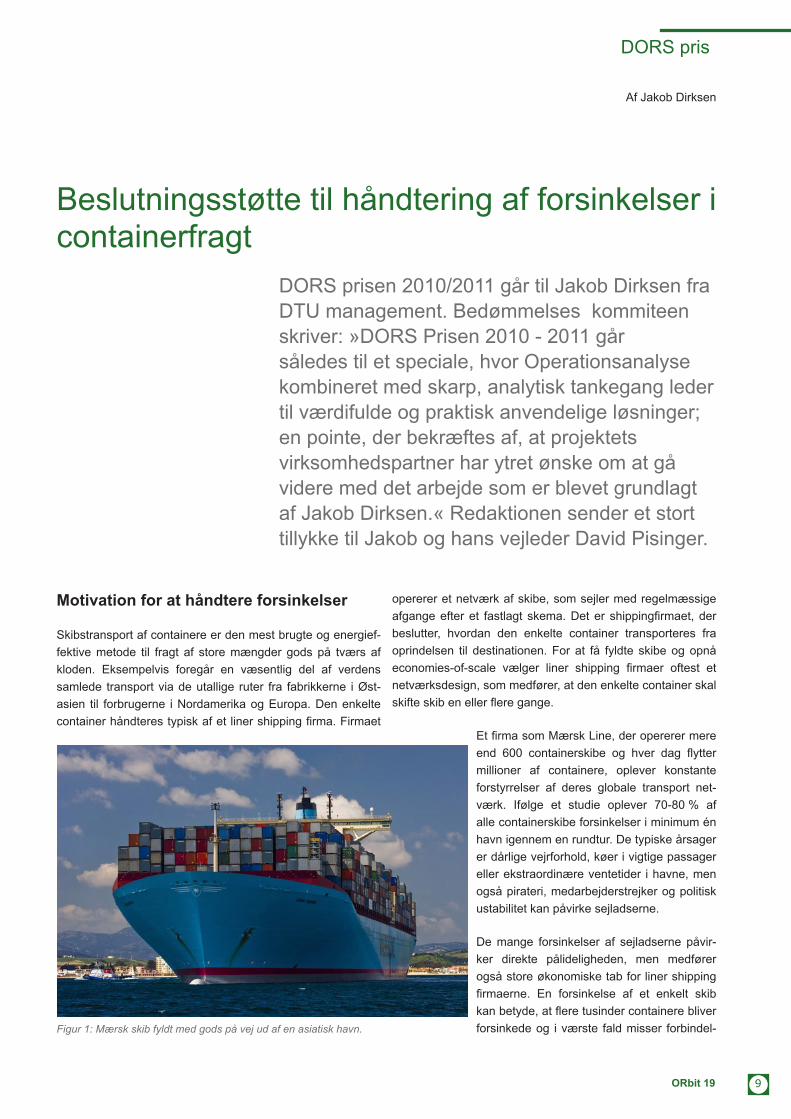
Figur 1: Mærsk skib fyldt med gods på vej ud af en asiatisk havn.
DORS prisen 2010/2011 går til Jakob Dirksen fra DTU management. Bedømmelses kommiteen skriver: »DORS Prisen 2010 - 2011 går således til et speciale, hvor Operationsanalyse kombineret med skarp, analytisk tankegang leder til værdifulde og praktisk anvendelige løsninger; en pointe, der bekræftes af, at projektets virksomhedspartner har ytret ønske om at gå videre med det arbejde som er blevet grundlagt af Jakob Dirksen.« Redaktionen sender et stort tillykke til Jakob og hans vejleder David Pisinger.

10 ORbit 19
DORS pris
ser med andre skibe. Ekstra omkostninger opstår ved dette, idet containerne ikke følger, den optimale plan, men derimod bruger ekstra tid på land og måske optager pladsen på det næste skib fra andre containere. Kunderne oplever ofte også tab ved forsinkelser, og liner shipping firmaerne risikerer derfor, at kunderne vælger en konkurrent ved næste fragt. Det er derfor utrolig vigtigt for liner shipping firmaerne at håndtere forsinkelser bedst muligt.
En konkret case fra Mærsk Line (1 af 2)
På grund af en stor storm i Østasien blev stillehavs-krydseren Mærsk Sarnia forsinket i alt 39 timer på vej ud af Kwangyang (Syd-korea). Skibet var plansat til at stoppe i Yokohama (Japan) og derfra fortsætte fuld af containere fra Asien til Mellemamerika (se figur 2). Ved ankomst til den store havn i Balboa (Panama) skulle største-delen af containerne skifte til andre skibe, som ville transportere godset det sidste stykke til aftagerene langs Amerikas østkyst. Forsinkelsen betød, at en stor del af containerne ville misse deres forbindelser. Der var derfor travlhed på Esplanaden, hvor det
skulle besluttes, hvordan skibet bedst fortsatte.
De to løsninger der blev overvejet, var at indhente forsinkelsen ved at øge hastigheden over Stillehavet eller ved at sejle udenom Yoko-hama. En øget fart ville betyde, at omkostningerne til brandstof steg voldsomt1, imens det at springe Yokohama over ville betyde, at en række containere fra en vigtig kunde blev forsinkede en fuld uge2. Beslut-ningen blev støttet af ad hoc udreg-ninger i et regneark, men afgørelsen
blev i sidste ende truffet på baggrund af intuition opbygget igennem mange års erfaring.
Mærsk valgte at sejle til Yokohama, krydse Stillehavet med let øget fart, og først rigtig indhente forsinkelsen på tilbageturen over Stillehavet. Beslutningen endte som et politisk kompro-mis, hvor der blev lagt vægt på dels at medtage containerne fra den vigtige kunde men samtidig begrænse stigningen i brændstofudgifterne. Den valgte sejlads for Mærsk Sarnia medførte desværre at en betydelig del af containerne missede forbindelser og derved blev forsinket en fuld uge.
Figur 2: Ruten for stillehavskrydseren Mærsk Sarnia.
S1
Port3
Port2
Port1
S2
0 20 40 60 80 100 120 140
Spa
ce [p
orts
]
Time [hours]
Time Space network
Mother vesselFeeder vessel
Delayed vessel
Figur 3: Eksempel på graf for simpelt problem. Problemet dækker 3 skibe, som alle tillades at sejle med justeret hastighed. Det forsinkede skib tillades endvidere at justere rækkefølgen for havnekald og springe havn 2 over.
11 ORbit 19
DORS pris
Matematisk model til beslutningsstøtte
Forsinkelserne i containerfragten har en klar parallel i luftfart-sindustrien. Flyselskaber oplever konstant forsinkelser og er nødsaget til hurtigt at træffe beslutninger om, hvordan driften bedst muligt genoprettes. Matematisk modellering danner fundamentet for disse beslutninger, da avanceret software bygget på operationsanalyse straks kan give operatørerne overblik over et bredt udvalg af mulige håndteringer, samt hvilke konsekvenser og omkostninger hver enkelt vil med-føre.
I projektet blev den grundlæggende model til håndtering af forsinkelser i luftfartsindustrien tilpasset situationen i liner shipping3. Modellen er baseret på et time-space netværk, hvor hver knude svarer til et havnekald på et givet tidspunkt, og hver kant er en mulig sejlads i mellem to havne med en given fart. Startende med skibenes udgangsposition kan det fulde løsningsrum udspændes (se figur 3). I grafen inkluderes de forskellige måder at håndtere en forsinkelse, herunder justere sejlfarten imellem havne, ændre sekvensen af havne, der besøges og lade containernes forbindelse vente.
På baggrund af grafen defineres en heltals flow-model. Begrænsningerne sikrer, at skibene starter korrekt, at de gennemløber en lovlig sejlads, og at containere gennemfører en lovlig rejse. Størrelsen af problemer afgrænses ved kun at lade en delmængde skibe justere deres sejlads og ved at ignorere re-flowing af containere der ikke kommer frem. Mål-funktionen bliver at minimere sejlomkostninger samt en stra-tegisk straf for containere, der henholdsvis bliver forsinkede eller misser en forbindelse. Ved test af fire faktiske problemer fra Mærsk er observeret gode køretider og løsninger.
En konkret case fra Mærsk Line (2 af 2)
Håndteringen af Mærsk Sarnias forsinkelse i Sydkorea kan simpelt modelleres med den beskrevne metodik. Det sam-lede problem, udspændt i grafen med løsningsrummet, har 7106 variable og 1706 begrænsninger. Målfunktionen for problemet er baseret på Mærsk Lines reelle og strategiske omkostninger. Heltals-problemet kan løses på dette virkelige data i CPLEX i løbet af sekunder. Den resulterende optimale løsning er at sejle udenom Yokohama. På trods af en straf for at ignorere de vigtige containere, er den samlede omkostnin-gen for Mærsks faktiske håndtering er 24 % højere end for denne løsning. Løsningen er efterfølgende blevet verificeret med Mærsk Line, som på baggrund af de tilgængelig informa-tioner i udregningerne er enige i, at det ville have været bedre at springe Yokohama over.
Jakob Dirksen er civilingeniør fra DTU. Han har specialiseret sig i operationsanalyse, men arbejder nu som managementkonsulent for McKinsey&Company i København.
Videre arbejde
Der forestår fortsat meget arbejde før Mærsk Line, og andre liner shipping firmaer, har adgang til et real-time beslutnings-system, som løbende kan håndtere deres forsinkelser. Bereg-ninger viser dog tydeligt, at emnet har et stort potentiale, og at det med relativt simple modeller er muligt at finde stærke løsninger. Liner shipping systemet er så komplekst, at en tilstrækkelig grundig manuel vurdering af hver løsningsmu-lighed simpelthen ikke kan foretages. Grundlæggende bør udviklingen på området gå i to parallelle spor, hvor den ene er akademisk forskning i udbygning af den foreslåede model, og den anden er en praktisk implementering og yderligere test af den foreslåede model.
Referencer
• Disruption Management in Liner Shipping af Jakob Dirksen
• The Vessel Schedule Recovery Problem (VSRP) - a MIP model for handling disruptions in liner shipping af Berit D. Brouer, Jakob Dirksen, David Pisinger, Christian E. M. Plum, og Bo Vaaben (ikke publiceret endnu)
Arbejdet ville ikke have været mulig uden støtte fra Mærsk Line (ML) og Danmarks Tekniske Universitet (DTU). Der skal således gå en stor tak til Daniel Bruun (ML), Mikkel M. Sigurd (ML), Steffen Conradsen (ML), Berit D. Brouer (DTU), David Pisinger (DTU), Christian E.M. Plum (DTU) og Bo Vaaben (DTU).
Noter
1 Friktionen i vand er et tredje grads polynomium af hastigheden2 På ruten over Stillehavet har Mærsk Line en ugentlig afgang3 Luftfart og liner shipping har mange ligheder, men også
forskelligheder. Forskellighederne inkluderer, at containerskibe sejler i døgndrift, at farten kan justeres betydelig mere, at det næste aldrig er effektivt at bytte et forsinket skib ud med et andet og at gods i gennemsnit skifter skib mere end 2 gange. Forskellene er med til at øge kompleksiteten
12 ORbit 19
nyhed
Svenska Operationsanalysföreningen(SOAF)
OA-föreningens Exjobbspris i Operationsanalys 2012
SOAF’s årliga exjobbspris i Operationsanalys instiftades 2010 för att uppmuntra studenter inom området och hjälpa till att sprida högkvalitativa uppsatser.
För att kunna deltaga ställs två krav:
1. En lyckad tillämpning på ett praktiskt problem (hos ett företag, myndighet e.d.).
Lyckad innebär att studien har gjort nytta, d.v.s. att företaget (eller motsv.) har fått ett beslutsunderlag av värde.
2. Att man har använt en vetenskapligt sund metod, utan krav på att den ska vara metodmässigt revolutionerande.
Priset kommer i formen av ett diplom och en premie på 3000 kr per exjobb.
Pristagarna förväntas vidare presentera sitt exjobb på ett SOAF-seminarium.
För att delta i tävlingen ska exjobbet vara godkänt under perioden från 1 november 2011 till 1 november 2012. Exjobbet skall sändas i elektronisk form samt som en papperskopia. Det ska åtföljas av ett brev från handledaren eller examina-torn där det motiveras varför just detta exjobb ska få priset.
Deadline för insändande av exjobb för 2012 års pris är 15 november.
Kontakt:
Michael Patriksson (ordf.) P O Lindberg
styrelseledamot SOAF styrelseledamot SOAF

13 ORbit 19
nyhed
DORS pris 2012
DORS - Dansk Selskab for Operationsanalyse - beder hermed om indstillinger til Danmarks bedste speciale i operationsanalyse 2012.
Et speciale indstilles af vejlederen, og vi skriver til dig, fordi det måske er dine studerende, der har skrevet det allerbedste projekt i perioden. Invitationen er åben, så send den endelig videre til de vejledere, vi måtte have glemt.
Et speciale kan indstilles hvis: - Specialet er skrevet ved et dansk universitet og involverer operationsanalyse. - Specialet er på dansk eller engelsk. - Specialet er afleveret i 2012. - Specialet er forsvaret i 2012, eller skal forsvares i januar 2013.
(I sidstnævnte tilfælde eftersendes specialkarakteren til [email protected] inden udgang af januar.)
Ved uddeling af DORS-prisen lægges vægten på analyse og løsning af praktiske problemer. Et speciale indstilles til DORS prisen ved at vejlederen senest 31. december 2012 sender en email til [email protected] (Tor Justesen,formand for DORS) med følgende indhold: - Specialet. Vedhæftes som PDF. - Begrundelse for, at specialet bør vinde prisen. Max. 1 side. Skrives af vejlederen. Vedhæftes som PDF. - Karakteren for specialet (med undtagelse af specialer forsvaret i januar 2013, se ovenfor). - Email-adresser og telefonnumre på alle specialets forfattere og på vejlederen. DORS-prisen uddeles ved generalforsamlingen for DORS til april 2013. Prisen er på 5000 kroner til deling mellem spe-cialets forfattere. Det er en forudsætning for udbetalingen, at der laves en kort artikel til ORbit om specialet.
Skriv til [email protected] hvis I har spørgsmål.
Dansk operationsanalyseselskab(DORS)

14 ORbit 19
tutorial
Introduction. First example: transportation markets
I used to work for the US Postal Service. They move par-cels and mail between hubs via trucks and airplanes. How should USPS purchase its transportation services? USPS could solve an optimization problem to minimize the cost of transportation, with constraints to ensure that the transpor-tation satisfied demand for material flow between hubs. The optimization model needs the cost data, so USPS has to ask the carrier companies for it. »How much would you charge to move 10 truckloads from Chicago to Peoria this Thursday afternoon?«
We can think of this problem as an auction. USPS could set up a web page where carrier companies enter bids, »I will charge $500/truckload to ship from Chicago to Peoria…« Then USPS would have the data to solve the optimization, and the results of the optimization would tell USPS which bids to accept. USPS could even do a little better if they posted provisional results, and let the carriers change their bids. They could do better still if they let the carriers put in multiple complex bids, such as »I will charge $500/truckload to ship from Chicago to Peoria. But I will charge only $750 for the round trip«. Allowing bidders flexibility in how they bid can let the optimization take advantage of the bidder’s economies of scope and scale.
So batch procurement from a big buyer can be viewed as a one-sided reverse auction. When cleared with an optimization model, it’s a smart market. Simply sorting bids from lowest to highest wouldn’t solve the problem at all, any more than we could solve an integer program only by sorting the variables by their objective coefficients.
The problem could be turned around. A big carrier could be selling transportation to small companies. The big carrier could post a web page where the small companies would bid to buy services, »I will pay you $480 to move one truckload
from Chicago to Peoria on Thursday.« Then the giant carrier could solve an optimization problem to maximize its profit, and could post provisional results to let buyers change their bids. Batch sales from a big seller is a one-sided auction. When cleared with an optimization model, it’s a smart market.
What if many companies sell transportation services, and many companies need to buy such services? We could open a small office with a web page which invites combinations of bids, some from carriers and some from firms needing carrier services. The optimization model matches supply to demand, by truck type, route, and any other complication you can ima-gine. The solution to the optimization model would be a good way to move materials. What should be our objective? We should maximize the money we get from the buyers, minus the money we have to pay to the sellers. That would maxi-mize our profit. We would not accept a money-losing deal. The solution which maximizes our profit would also maximize benefit to the region, assuming a competitive market (lots of buyers and sellers). This two-sided auction, with many buyers and many sellers, is a smart market, too. The optimization model can find solutions that would be impossible if done manually, or if done only between pairs of people.
This isn’t a mere thought experiment – people are already making money with the idea – see for example Moore (1991), Brewer and Plott (2002), Ledyard et al. (2002), Andres Figlio-zzi et al. (2003), Caplice and Sheffi (2003), Song and Regan (2003), and Sheffi (2004).
Key characteristics of a smart market.
Definition
A smart market is an auction cleared by optimization.
• The smart market is operated by a market manager, who clears the market with an optimization model. EBay.com and
A tutorial on smart markets
By John F. Raffensperger
Over the past thirty years, governments and companies have implemented smart markets for a huge range of goods and services. This essay gives a brief tutorial in how they work.

15 ORbit 19
tutorial
Qxl.dk don’t need optimization models to clear their auctions, so those are not smart markets by this definition.
• Trades are not between pairs of people, but rather to or from the market manager. EBay.com and Qxl.dk match pairs of buyers and sellers, so those web sites are not smart markets by this definition either.
Advantages of a smart market.
The smart market simplifies trading complex goods and services. Buyers and sellers know where to go to find each other, and are usually assured of competitive prices. The market manager can set and enforce rules on who is allowed to trade, so traders can be more confident that the trade will actually happen. So the market is orderly and transparent. When something goes wrong, rules are in place to resolve the problem (McCabe, Rassenti & Smith 1991).
Smart markets are now possible due to the combination of optimization and the internet. Increased computation power lets the market manager solve problems that before would have been impossible. The internet lets traders bid easily.
Most of us can accept the idea of a big company using an auction to purchase services like transportation from other businesses. Some of us do not like the idea of using markets for services such as fresh water (which I’ll discuss below). As operations researchers, we specia-lize in finding good allocations of resour-ces. Well-regulated honest markets allocate resources extremely well! Smart markets tend to be highly regulated, as they are centralized, and the market manager usually pays a lot of attention to the behaviour of participants.
A general formulation
This formulation assumes that the market has both buyers and sellers.
Each trader i can have multiple bids,
modeling a piecewise linear demand function (the idea that one piece of cake is great, a second piece of cake is okay, and I don’t really need the third piece of cake).
Indices: i traders, b bids.
Data:
BuyPricei,b = bid price of trader i for step b. BuyStepi,b = additional quantity that trader i would buy at price BuyPricei,b. SellPricei,b = offer price of trader i for step b. SellStepi,b = additional quantity that trader i would sell at price SellPricei,b. Initiali = starting quantity for trader i. (A, d) = general technology matrix.
You can think of BuyPricei,b as the value per serving, and BuyStepi,b as the serving size.
If the price is BuyPricei,1 = $1, I will buy up to BuyStepi,1 = 5 units. If the price is BuyPricei,2 = $0.76, I will buy an additional BuyStepi,2 = 3 units. If the price is BuyPricei,3 = $0.50, I will buy an additional BuyStepi,3 = 2 units.
Model SM
1. Maximize net benefit: ∑i∑b BuyPricei,bbuyqtyi,b – ∑i∑b SellPricei,bsellqtyi,b,
subject to
2. Calculate net trades: Initiali + ∑b buyqtyi,b – ∑b sellqtyi,b = finalqtyi, for all i.
3. Bids are piecewise linear: buyqtyi,b ≤ BuyStepi,b, for all i, b,
4. Technology constraints: A∙finalqty ≤ d,
5. Non-negativity, integrality: buyqtyi,b ≥0, sellqtyi,b ≥ 0, possibly integral.
6. Avoid degeneracy: finalqtyi free, possibly integral.
Why is this a maximization? Imagine if you were the market manager. Buyers pay you, and you pay sellers. To maximize your profit, you would want to take the high bids from the buyers, but pay out only the small bids to the sellers.
For the transportation problem mentioned above, the (A, d) matrix cor-responds to demand for transport across the transportation network, possibly with conservation of flow constraints, truck capacity constraints, and so on. The bid subscripts b could be from-to pairs of hubs rather than serving quantities.

16 ORbit 19
tutorial
Model SM is written as a net pool market, in which the model has the initial rights as an input, and calculates all the buying and selling. Surprisingly, perhaps, we can usually write a simpler formulation for model SM, in which we pretend that everyone is a buyer (a gross pool market). Then we just calculate trades based on the initial positions after we know the final allocation. We have to assume that participants are willing to trade sufficient quantities to allow feasibility. The gross pool market will tend to be mathematically feasible, but could have an unacceptably high cost in the optimal objective value, should buy bids be too low compared to sell bids. The difference between these two formulations is usually only algebraic, as the two market formulations are economically equivalent by the Coase theorem (that the final optimal allocation doesn’t usually depend on the initial rights).
Pricing
Given the primal result to model SM, at what price should we charge or pay trader i? We have some options, depending on the problem.
Most obviously, we can charge them their price as bid. Trader i offered to buy up to 5 units at $1/unit, and the optimal solution is to give her 4 units, so we can reasonably charge her $4. In this case, trader i will be nervous about bidding. She will be tempted to bid a little lower than her true reservation price, hoping to save some money, in which case she may not get as much as she really wants. She will also be tempted to sneak around the other bidders, trying to find out what they would bid. This problem has been studied thoroughly in the auction literature.
Many smart markets allocate divisible goods such as electricity and natural gas, and can be cleared with ordinary linear programming. If our smart market model SM is a linear program, we can use the dual prices pi on constraint 2 to charge or pay trader i the amount pi(∑b buyqtyi,b – ∑b sellqtyi,b). If trader i buys more than she sells then she pays; otherwise she gains. (We need finalqtyi to be free to avoid degeneracy, to make sure pi is correct.) This marginal cost pricing pro-vides many nice economic results due to the LP optimality conditions. For example, facing price pi, trader i will be satis-fied with finalqtyi. Trader i is assured that she will be given a truly market price, which everyone faces. So she is more likely to feel comfortable bidding her true reservation price. Every seller is guaranteed to receive at least as much as was bid and possibly more. Every buyer is guaranteed to pay no more than was offered, and possibly less. We also get useful resource prices from the technology constraints (A, d), such
as the value of additional capacity.
A combinatorial auction is a smart market in which goods are indivisible. Those markets must be cleared with integer programs. If model SM is an integer program, then we have the elementary problem that integer programs, like all non-convex models, do not give good dual price information. We could use the price-as-bid approach. Alternatively, Rassenti, Smith and Bulfin (1982) found ranges of good prices by sol-ving pseudo-dual models. O’Neill et al (2005) first solve the integer program, and then solve an auxiliary linear program to get good prices. Pricing in non-convexity will always be difficult, which helps keep operations researchers in business! An entire issue of Management Science (vol. 51, no. 3, March 2005) was devoted to this topic. See also Pekec and Rothkopf (2003).
Initial rights
Model SM above has the parameter Initiali. To have a market, traders need to know who owns the right at the start of the auction. For a company buying transport services, of course the carrier firms own the rights, and the buyer has to pay for the service. That makes complete sense. You could also ima-gine that the buyer pays the carrier for work to be done next month, and then the buyer changes her mind and sells that contract to someone else.
But initial ownership is not always clear. A few years ago, the U.S. government tried to implement a trading system for take-off and landing slots at Kennedy Airport in New York. Imple-mentation would have solved a lot of problems and made everyone better off! But as far as I can tell, they failed because they could not get agreement on the initial rights. The airlines said, »We’ve been taking off and landing all this time, so those rights are ours.« The Port Authority said, »We own the land, so we own the rights.« The Federal Aviation Administration said, »We actually give permission to take off and land, so we own the rights.« What a mess! The problem is even more complicated when the quantity available is uncertain, as with fresh water.
Financial trading
Most smart markets are spot markets, in which goods or ser-vices are traded and delivered immediately.
A spot market could be cleared by simple pair-wise trading (as for a grocery store). A spot market could be cleared by a simple many-to-many auction (as for some water markets in
17 ORbit 19
tutorial
Australia). A spot market could also be smart and multi-lateral (as for a modern electricity market).
A smart market could be run as a one-off for long-term rights, such as radio spectrum. I don’t think this would be conside-red a spot market, simply because it isn’t active enough. By contrast, modern smart markets for electricity are run as spot markets, with trades clearing every few minutes, and power generated and delivered immediately.
Much more interestingly, someone could observe a spot market operating for a while, and be fearful that the price may spike in the wrong direction. So this person could make a side deal, outside of the smart market, as insurance or hedging, based on the spot price sometime in the future. Of course, anyone can make a deal like this based on any market. Such deals are especially frequent in the electricity markets.
A big factory may worry that the price of power might go high, so the factory manager could make a deal with a generator to “buy” power at a fixed price. “Factory F will pay generator G a price of $0.50/megawatt for 7 megawatts of power on 1 Sep 2011.” Of course, the generator cannot really sell power directly to the factory, because G’s electrons scatter to all parts of the power grid as soon as G generates them, and because the spot trade must go through the smart market. But on 1 Sep 2011, factory F can demand 7 megawatts from the market manager, and pay the going price, say, $0.60/megawatt. To resolve the deal, G now has to pay F $0.10/megawatt for 7 megawatts. If in fact the spot price of power were only $0.55/megawatt, then G gets to keep $0.05/megawatt for the 7 megawatts. Consequently, G has an incentive to keep the spot price of power low, thus stabilizing prices. Meanwhile, the factory manager F got what she wanted – lower risk from more reliable prices.
More examples of smart markets
Radio frequency auctions
The spectrum auction is a one-sided smart market cleared by an integer program (McCabe et al 1991, Chakravorti et al 1995). Participants purchase radio spectrum licenses from government. These combinatorial auctions are cleared as bid, rather than at prices based on dual variables.
The problem is combinatorial due to radio spectrum interference. If I get the license for frequency 980MHz in Copenhagen, I don’t want the government to give someone else the license for 980MHz in nearby Lyngby. I want the
whole area around Copenhagen. So this could be a set packing problem, with the rows corresponding to regions: the sum of the accepted bids for Copenhagen must be less than or equal to 1.
Furthermore, I might offer the government a premium to get licenses in several big cities, and I might even want to put in some complicated and/or bids like, “I’ll bid X kroner for Copenhagen and Aarhus, or Y kroner for Copenhagen and Odense.« This is easily done with integer programming.
Electricity
High-voltage power, which goes across large regions, requires a lot of coordination to ensure that generation matches demand and that power flows do not exceed network line capacities. The security and reliability requirements are very high. This coordination can be done extremely well by linear programming. Before the smart market, this coordination was done with linear programming, but the line operator, generators, and distributors were usually part of a monopoly. With a smart market, these could be different parties, thus creating improvements through competition. The first market of this type was implemented in New Zealand in 1996 (Alvey et al 1998, Hogan et al 1996), and this design is now copied all over the world. These markets clear every few minutes, with a lot of money changing hands each time.
The modern electricity market is an important example of a two-sided smart market. Generators are the sellers, offering to supply power at a range of prices. Wholesale power firms (those that sell to homes) and big industrial firms are the buyers, who bid to buy power at a range of prices. To clear the market, the market manager solves a linear program in which the decision variables are how much power to accept from each generator, the flow of power on each line, and how much power to provide to each distributor.
The flow-on-the-power-line variables appear in constraints which ensure balance of flow at each power line connection (node), like ∑node i flowi,j – ∑node k flowj,k = 0 for each node j. Pic-ture one of those industrial-looking places with lots of transfor-mers and high tension wires – that is probably a node in this model. The dual price pj on this constraint is the nodal price at j. If a generator were willing to put in another megawatt of power there, the market manager should pay the generator pj. If a wholesaler or factory were to take another megawatt of power there, the market manager should charge them pj. By clearing the market based on the dual prices, participants are charged on marginal values, rather than as bid.
18 ORbit 19
tutorial
Natural gas
Natural gas, transported over cross-country pipe networks, is sometimes managed with a smart market (McCabe, Ras-senti & Smith 1990), as in Australia. The system operator serves as the market manager. The market manager has to match gas supply to demand, while ensuring that flows do not exceed pipe capacities. Gas suppliers offer to sell a range of quantities at a range of prices. Distributors bid to buy a range of quantities at a range of prices. To clear the market, the market manager solves a linear program in which the decision variables are the gas to accept from each supplier, the flow of gas on each pipe segment, and how much gas to provide to each distributor. As with electricity markets, after solution, the primal variables prescribe the optimal flows, and the dual variables provide the market clearing prices.
Airplane take-off and landing slots
The term smart market appears to have been first used by Rassenti, Smith, and Bulfin (1982), who proposed a combinatorial auction for airplane take-off and landing slots. (Asking a jumbo jet pilot low on fuel how much he’s willing to pay to land probably wouldn’t work too well!) The idea is that airlines would bid cj for a package, which means at a minimum a take-off at one airport and a landing at another airport. But a package can be more complicated than just a take-off and landing pair. An airline would want to route its planes out of its home hub and eventually back to its home hub. Constraints included capacity at each airport, and routing logic for each airline.
Is this a one-sided or two-sided auction? It would be one-sided if the government decided that it owned all the rights, like radio spectrum, and the airlines had to pay for every package. But the airlines would think that was too risky, and would want to buy contracts where they bought continued rights for a long time, say 5 years, or permanently. It could then be two-sided, because an airline could sell its right to another airline. See also Jaikumar (1980).
Heaps more.
The Chilean government uses a smart market to choose caterers for school meal programs (Epstein et al 2002). Their market rules included strict requirements for participating, which raised the professionalism and quality of the bidders.
The University of Chicago’s Booth School of Business uses a smart market for course registration (Graves, Sankaran &
Schrage 1993). The system ensures that the class seats go to those students who most want them, while ensuring that the number of students in each class stays within the room capacity.
Smart markets are now being proposed for environmental services, including water (Murphy et al. 2000, Raffensperger et al. 2009).
Conclusion
Smart markets are a hot area in operations research. I’ve left out a lot of applications! Often, the models are not particularly complicated, nor are their solution. Rather, the difficult bits are the market rules, defining what is actually traded, and making sure that the prices give the right incentives to participants. The process of determining the initial rights can be politically charged, and sometimes causes the whole project to fail. When implemented, however, society can enjoy enormous gains from much better allocation of complex resources.
Acknowledgement
Thanks to E. Grant Read who tutored me in smart markets.
References
I pinched some of this essay from the Wikipedia page on Smart Market, which I initially authored, http://en.wikipedia.org/wiki/Smart_market.
• Alvey T., Goodwin D., Xingwang M., Streiffert D. and Sun D. (1998), A security-constrained bid-clearing system for the NZ wholesale electricity market, IEEE Trans. Power Systems, 13(2), 340-346.• Figliozzi, Andres M., Mahmassani, H. S., and Jaillet, P. (2003). Framework for study of carrier strategies in auction-based transportation marketplace, Transportation Research Record: Journal of the Transportation Research Board, 1854(-1), 162-170.• Brewer, P. J., and Plott, C. R. (2002). A decentralized, smart market solution to a class of back-haul transportation problems: Concept and experimental test beds. Interfaces, 13-36.• Caplice, C., and Sheffi, Y. (2003). Optimization based procurement for transportation services. Journal of Business Logistics, 24(2), 109-128.• Chakravorti, B., W.W. Sharkey, Y. Spiegel and S. Wilkie (1995), Auctioning the Airwaves: The Contest for Broadband PCS Spectrum, J. Econ. & Mgt Strategy, 4(2), 267-343.
19 ORbit 19
tutorial
• Epstein, Rafael, Lysette Henriquez, Jaime Catalán, Gabriel Y. Weintraub, Cristián Martinez, A Combinatorial Auction Improves School Meals in Chile, Interfaces, 32(6), Nov-Dec 2002, pp. 1-14.• Graves, R.L., J. Sankaran, and L. Schrage (1993), An Auction Method for Course Registration, Interfaces, 23(5).• Groves, T. (1973), Incentives in Teams, Econometrica, pp. 617-631.• Hogan W.W, Read E.G and Ring B.J. (1996), Using Mathematical Programming for Electricity Spot Pricing, Int’l Trans. in Operations Research, 3, (3-4), 243-253.• Jackson, B.L. and J.M. Brown (1980), Using LP for Crude Oil Sales at Elk Hills: A Case Study, Interfaces, 10(3) June, pp. 65-70.• Jaikumar, R. (1980), Mathematical Programming Approaches to the Design of Auctions: A Study of the Auction of Landing Rights at Congested Airports, Economic Forum, 11, pp. 29-47.• Ledyard, J. O., Olson, M., Porter, D., Swanson, J. A., and Torma, D. P. (2002). The first use of a combined-value auction for transportation services, Interfaces, 4-12.• McCabe, Kevin, Stephen Rassenti, and Vernon Smith (1990), Auction Design for Composite Goods: The Natural Gas Industry, J. of Economic Behavior and Organization, Sep, 127-149.• McCabe, Kevin, Stephen Rassenti, and Vernon Smith (1991), Smart computer-assisted markets, Science, v254, 534-538.• Moore, E.W., J.M.Warmke, and L.R. Gorban (1991), The Indispensable Role of Management Science in Centralizing Freight Operations at Reynolds Metals Company, Interfaces, 21(1), Jan.-Feb., pp.107-129.• Murphy, J. J., Dinar, A., Howitt, R., Rassenti, S. J., and Smith, V. L. (2000). The Design of ‘Smart’ Water Market Institutions Using Laboratory Experiments, Env & Resource Economics, 17(4), 375-394.• O’Neill, R.P., P.M. Sotkiewicz, B.F. Hobbs, M.H. Rothkopf, W.R. Stewart (2005), Effective market-clearing prices in markets with non-convexities, European J of Operational Research, 164 269-285.• Pekec, Aleksandar and Michael H. Rothkopf (2003), Combinatorial Auction Design, Management Science, 49(11), Nov 2003, pp. 1485-1503.• Raffensperger, J. F., Milke, M. W., and Read, E. G. (2009). A deterministic smart market model for groundwater, Operations Research, 57(6), 1333-1346.• Rassenti, S.J., V.L. Smith, and R.L. Bulfin (1982), A Com-binatorial Auction Mechanism for Airport time Slot Allocation, Bell Journal of Economics, 13(2), pp. 402-417.
• Rothkopf, M.H., A. Pekec, and R.M. Harstad (1998), Compu-tationally Manageable Combinational Auctions, Management Science, 44(8) Aug, pp. 1131-1147.• Sheffi, Y. (2004). Combinatorial auctions in the procurement of transportation services. Interfaces, 245-252.• Song, J., and Regan, A. (2003). Combinatorial auctions for transportation service procurement: The carrier perspective, Transportation Research Record: J of the Transportation Research Board, 1833(-1), 40-46.
Dr. John F. Raffensperger
is currently Senior Lecturer in Management Science, Dept. of Management, Uni-versity of Canterbury, Chri-stchurch, New Zealand. He obtained his PhD from the University of Chicago’s Graduate School of Busi-ness. This article was writ-ten while he was at Den-mark Technical University on a IRSES/OptALI faculty exchange, funded by in part by the EU and the NZ Mini-stry of Research, Science and Technology.
ORbit redaktionen efterlyser
artikler og annonceringer til bladet.
Hjælp med at gøre ORbit til et godt blad ved selv at bedrage med relevant materiale.
Alt materiale sendes til [email protected]

20 ORbit 19
nyhed
Det årlige DORS arrangement Appli-cations of Optimisation blev i år afholdt den 30. maj på Axelborg i København. Arrangementet var det fjerde af sin art, hvor det første blev afviklet i 2008, og formålet med arrangementerne er pri-mært at skabe kontakt mellem dankske operationsanalytikere gennem en tema-dag med foredrag fra både industrien og forskningsinstitutioner. Arrangementet i år var det hidtil største med 59 registre-rede deltagere, hvilket overgik arrangø-rernes forventninger.
Som et nyt tiltag var de faglige indlæg i år opdelt i to særskilte temaer; et tema omkring anvendelsen af optimering i den finansielle sektor, og et tema omkring anvendt operationsanalyse og logistik.
Finansiel optimering
Finansiel optimering som disciplin er område, hvor der traditionelt anvendes både optimering, statistisk og operati-onsanalyse (og mere generelt anvendt matematik) i stort omfang, hvilket motiverede planlægningen af en prak-tisk orienteret foredragsrække, men foredrag omkring både teori og praktisk anvendelse.
Raphael Hauser fra Oxford universitet holdt et introducerende foredrag med titlen "Convex Optimisation in Finance and Quantitative Trading", der både introducerede grundlæggende begreber samt skitserede mere forskingsorien-terede ideer. Fra et praktisk synspunkt var en af hans vigtigste pointer at den grundlæggende teori bag Markowitz optimering (af aktieporteføljer) produ-cerer gode afkast i praksis under vise forbehold, hvilket ellers ofte anfægtes.
Dernæst præsenterede Kourosh M. Rasmussen med tilknytning til både danmarks tekniske universitet (DTU) og firmaet FinE Analytics ApS et web-baseret produkt til portefølje optimering udviklet med øje for selvstændige pri-vate investorer. Produktet har forskellige risikoprofiler, og fremadrettet arbejder firmaet på at udvikle heuristikker til at detektere og forudsige generelle trends på aktiemarkedet, så investorerne kan konsolidere sine investeringer i ned-gangsperioder.
Endelig afholdt Thomas Schmelzer et indlæg med titlen "Convex programming in quantitative hedgefund". Thomas Schmelzer har tidligere arbejdet for forskellige større engelske investerings-fonde, og har for nyligt stiftet et mindre
investeringsfima. Hans præsentation gav et både spændende og humoristisk indblik i de praktiske værktøjer en mate-matisk investeringsrådgiver bruger i sit daglige virke.
Anvendt operationsanalyse
Arrangement indeholdt også tre indlæg om mere traditionel operationsanalyse.
Wim Vandevelde fra Procter & Gamble holdt et spændende foredag "Distri-bution Network Optimization" omkring den globale planlægning af fabrikati-onsbeliggenheder og forsyningsruter, der foretages i Procter & Gamble med 5 til 10 års intervaller. Denne optimering foretages ved hjælp af firmaets egne specialudviklede algoritmer, hvilket er nødvendigt for at håndtere de store pro-blemdimensioner.
Applications of Optimisation 2012
Af Joachim Dahl
Figur 1: Raphael Hauser fra Oxford universitet forelæser om financiel optimering.
Figur 2: Jürgen Kohl fra ILOG Optimization, IBM Software Group.

21 ORbit 19
nyhed
Dernæst holdt Jürgen Kohl fra ILOG/IBM et indlæg "getting the price right and other applications of business opti-misation", hvor han diskuterede forskel-lige konsulentopgaver han har løst hos ILOG/IBM.
Afslutningsvist gav Rune Møller Jensen, IT universitet et foredrag "Stowing the right containers on container vessels". Det gav et spændende indblik i de problemstillinger og udfordringe besva-relser der er ved pakning af container-skibe. Han illustreredede hvordan en optimal pakning af containerskibe er et vanskeligt problem, der har potentialle for enorme besparelser.
Overrækkelse af DORS prisen
Som noget nyt blev vinderen DORS prisen for bedste speciale indenfor operationsanalyse udnævnt ved arran-gementet. Vinderen af prisen for bedste speciale 2010-2011 var Jakob Dirksen, med specialet "Disruption Management in Liner Shipping". Læs mere om spe-cialet på side 9.
Networking
En vigtig del af arrangement er net-working mellem deltagelerne; for flere deltagere er DORS arrangementet den eneste tilknytning til fagområdet og tidligere bekendte og kollegaer. Defor vil vi fra arrangørernes side tilstræbe at der fremover afsættes mere tid til networking.
Fremtidige arrangementer
Applications of optimisation er måske vores forenings vigtigste tilbageven-dende begivenhed, og vi forventer at afholde arrangement regelmæssigt hver sommer. De umiddelbare tilbagemel-dinger vi har modtaget fra deltagerne er at et opdelt tema med både klassisk operationsanalyse samt en introduktion til et måske mindre kendt fagområde er blevet vel modtaget. Til planlægningen af fremtidige arrangementer modtager DORS bestyrelsen meget gerne forslag til temaer eller foredragsholdere.
AOO 2012 blev arrangeret af Joa-chim Dahl og Mikkel Sigurd.
Joachim har en Ph.D. grad i signal-behandling fra Aalborg universitet. Han arbejder for MOSEK ApS med udvikling af algoritmer til konveks optimering.
Mikkel har en Ph.D. grad i operati-onsanalyse fra danmarks tekniske universitet. Han er ansvarlig for ope-rationsanalyse hos Mærsk Line A/S.
Begge er medlem af DORS besty-relsen.
Figur 3: Networking ved DORS arrangementet.
22 ORbit 19
undervisning
By Marcel Turkensteen
This note is about the experiences with an elective course that I am giving as part of the master program in Logistics & Supply Chain Management at Aarhus University, called Sustainable Supply Chain Management, or, to reduce the energy use in writing this article, SSCM.
But hey, why do we worry about sustainability, about reducing CO2 emissions, and about saving polar bears? Global war-ming was a hot issue only a few years ago. Not anymore. After the economical devastations of the financial crisis and now the euro crisis, sustainability is something we cannot afford. Our planet has to be saved at some other point of time.
This line of thinking misses a very important point. The word ’sustainable’ suggests a long term horizon. In recent manage-ment theory (for example Hart (1997) and more recently, Porter (2011)), the purpose of an organization is to add value to society in the long run; only then it continue to prosper. Value is not added with destructive practices, such as pollu-tion. In this vision, sustainability and reduction of environmen-tal impact is not a luxury. It should be a key component of an organization’s long term decision making.
So what does this imply for logistics, or for supply chain management? An intuitive logistics approach would be to minimize the CO2 emissions from transportation or, a bit more advanced, include them in a model with multiple objectives, where there is some theoretical cost α to each unit emission. I think this approach is too simple and narrow.
Firstly, the way of modeling suggests that reduction of the env-ironmental impact is a sacrifice. A manager can reduce emis-sions, but thereby reduces profits as well. Unless of course, one motivates it from ‘marketing’: if we cut our emissions from transport by X%, then customers will buy our products. However, this works if your entire organization and your entire product can be considered green, not just the transportation.
Secondly, it implies that transportation is the source of pollu-tion and so transportation should be tackled. However, it may not be smart to view transportation in isolation from the other components of the logistics process such as purchasing, warehousing and waste management. One of many examples where reducing transport can thus deteriorate CO2 emissions is the following. It can very well be that the collecting of valua-
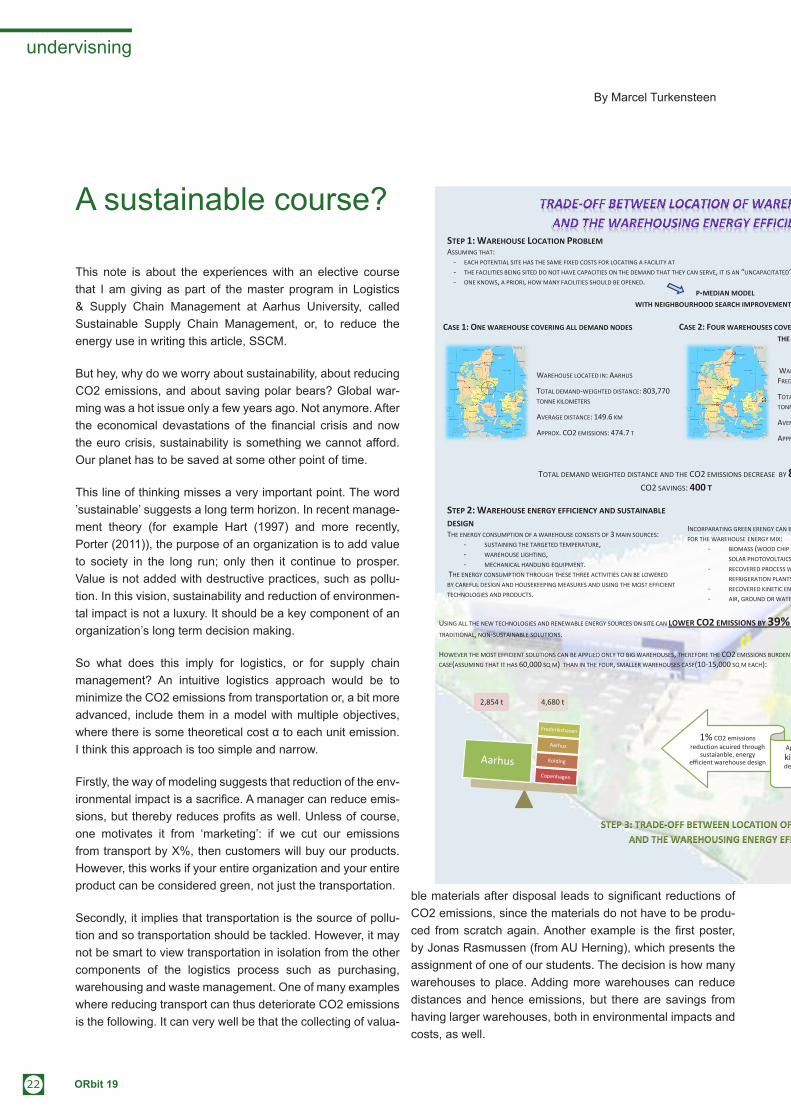
ble materials after disposal leads to significant reductions of CO2 emissions, since the materials do not have to be produ-ced from scratch again. Another example is the first poster, by Jonas Rasmussen (from AU Herning), which presents the assignment of one of our students. The decision is how many warehouses to place. Adding more warehouses can reduce distances and hence emissions, but there are savings from having larger warehouses, both in environmental impacts and costs, as well.
A sustainable course?
STEP 1: WAREHOUSE LOCATION PROBLEM ASSUMING THAT:
- EACH POTENTIAL SITE HAS THE SAME FIXED COSTS FOR LOCATING A FACILITY AT - THE FACILITIES BEING SITED DO NOT HAVE CAPACITIES ON THE DEMAND THAT THEY CAN SERVE, IT IS AN “UNCAPACITATED” - ONE KNOWS, A PRIORI, HOW MANY FACILITIES SHOULD BE OPENED.
P-MEDIAN MODEL WITH NEIGHBOURHOOD SEARCH IMPROVEMENT HEURISTIC
CASE 1: ONE WAREHOUSE COVERING ALL DEMAND NODES
WAREHOUSE LOCATED IN: AARHUS
TOTAL DEMAND-WEIGHTED DISTANCE: 803,770 TONNE KILOMETERS
AVERAGE DISTANCE: 149.6 KM
APPROX. CO2 EMISSIONS: 474.7 T
CASE 2: FOUR WAREHOUSES COVERING THE DEMAND NODES LOCATED THE CLOSEST TO THE FACILITIES
WAREHOUSES LOCATED IN: AARHUS, FREDERIKSHAVN, KOLDING, COPENHAGEN
TOTAL DEMAND-WEIGHTED DISTANCE: 124,470 TONNE KILOMETERS
AVERAGE DISTANCE: 23.2 KM
APPROX. CO2 EMISSIONS: 73.5 T
TOTAL DEMAND WEIGHTED DISTANCE AND THE CO2 EMISSIONS DECREASE BY 85%. CO2 SAVINGS: 400 T
STEP 2: WAREHOUSE ENERGY EFFICIENCY AND SUSTAINABLE DESIGN THE ENERGY CONSUMPTION OF A WAREHOUSE CONSISTS OF 3 MAIN SOURCES:
- SUSTAINING THE TARGETED TEMPERATURE, - WAREHOUSE LIGHTING, - MECHANICAL HANDLING EQUIPMENT.
THE ENERGY CONSUMPTION THROUGH THESE THREE ACTIVITIES CAN BE LOWERED BY CAREFUL DESIGN AND HOUSEKEEPING MEASURES AND USING THE MOST EFFICIENT TECHNOLOGIES AND PRODUCTS.
INCORPARATING GREEN ERENGY CAN BE DONE THROUGH USING RENEWABLE SOURCES FOR THE WAREHOUSE ENERGY MIX:
- BIOMASS (WOOD CHIP OR OTHER WASTE), WIND, SOLAR THERMAL, SOLAR PHOTOVOLTAICS,
- RECOVERED PROCESS WASTE ENERGY, SUCH AS HEAT FROM REFRIGERATION PLANTS OR AIR COMPRESSORS,
- RECOVERED KINETIC ENERGY, - AIR, GROUND OR WATER THERMAL-EXCHANGE UNITS.
USING ALL THE NEW TECHNOLOGIES AND RENEWABLE ENERGY SOURCES ON SITE CAN LOWER CO2 EMISSIONS BY 39% AND ENERGY USE BY 40% VERSUS
TRADITIONAL, NON-SUSTAINABLE SOLUTIONS. HOWEVER THE MOST EFFICIENT SOLUTIONS CAN BE APPLIED ONLY TO BIG WAREHOUSES, THEREFORE THE CO2 EMISSIONS BURDEN WILL BE LESS IN THE ONE, BIG WAREHOUSE CASE(ASSUMING THAT IT HAS 60,000 SQ M) THAN IN THE FOUR, SMALLER WAREHOUSES CASE(10-15,000 SQ M EACH):
2,854 t 4,680 t
1% CO2 emissions reduction acuired through
sustaianble, energy efficient warehouse design
Approx. 30,898 tonne kilometers reduction in demand-weighted distance
acuired by location optimalization
STEP 3: TRADE-OFF BETWEEN LOCATION OF WAREHOUSES AND THE WAREHOUSING ENERGY EFFICIENCY
23 ORbit 19
undervisning
STEP 1: WAREHOUSE LOCATION PROBLEM ASSUMING THAT:
- EACH POTENTIAL SITE HAS THE SAME FIXED COSTS FOR LOCATING A FACILITY AT - THE FACILITIES BEING SITED DO NOT HAVE CAPACITIES ON THE DEMAND THAT THEY CAN SERVE, IT IS AN “UNCAPACITATED” - ONE KNOWS, A PRIORI, HOW MANY FACILITIES SHOULD BE OPENED.
P-MEDIAN MODEL WITH NEIGHBOURHOOD SEARCH IMPROVEMENT HEURISTIC
CASE 1: ONE WAREHOUSE COVERING ALL DEMAND NODES
WAREHOUSE LOCATED IN: AARHUS
TOTAL DEMAND-WEIGHTED DISTANCE: 803,770 TONNE KILOMETERS
AVERAGE DISTANCE: 149.6 KM
APPROX. CO2 EMISSIONS: 474.7 T
CASE 2: FOUR WAREHOUSES COVERING THE DEMAND NODES LOCATED THE CLOSEST TO THE FACILITIES
WAREHOUSES LOCATED IN: AARHUS, FREDERIKSHAVN, KOLDING, COPENHAGEN
TOTAL DEMAND-WEIGHTED DISTANCE: 124,470 TONNE KILOMETERS
AVERAGE DISTANCE: 23.2 KM
APPROX. CO2 EMISSIONS: 73.5 T
TOTAL DEMAND WEIGHTED DISTANCE AND THE CO2 EMISSIONS DECREASE BY 85%. CO2 SAVINGS: 400 T
STEP 2: WAREHOUSE ENERGY EFFICIENCY AND SUSTAINABLE DESIGN THE ENERGY CONSUMPTION OF A WAREHOUSE CONSISTS OF 3 MAIN SOURCES:
- SUSTAINING THE TARGETED TEMPERATURE, - WAREHOUSE LIGHTING, - MECHANICAL HANDLING EQUIPMENT.
THE ENERGY CONSUMPTION THROUGH THESE THREE ACTIVITIES CAN BE LOWERED BY CAREFUL DESIGN AND HOUSEKEEPING MEASURES AND USING THE MOST EFFICIENT TECHNOLOGIES AND PRODUCTS.
INCORPARATING GREEN ERENGY CAN BE DONE THROUGH USING RENEWABLE SOURCES FOR THE WAREHOUSE ENERGY MIX:
- BIOMASS (WOOD CHIP OR OTHER WASTE), WIND, SOLAR THERMAL, SOLAR PHOTOVOLTAICS,
- RECOVERED PROCESS WASTE ENERGY, SUCH AS HEAT FROM REFRIGERATION PLANTS OR AIR COMPRESSORS,
- RECOVERED KINETIC ENERGY, - AIR, GROUND OR WATER THERMAL-EXCHANGE UNITS.
USING ALL THE NEW TECHNOLOGIES AND RENEWABLE ENERGY SOURCES ON SITE CAN LOWER CO2 EMISSIONS BY 39% AND ENERGY USE BY 40% VERSUS
TRADITIONAL, NON-SUSTAINABLE SOLUTIONS. HOWEVER THE MOST EFFICIENT SOLUTIONS CAN BE APPLIED ONLY TO BIG WAREHOUSES, THEREFORE THE CO2 EMISSIONS BURDEN WILL BE LESS IN THE ONE, BIG WAREHOUSE CASE(ASSUMING THAT IT HAS 60,000 SQ M) THAN IN THE FOUR, SMALLER WAREHOUSES CASE(10-15,000 SQ M EACH):
2,854 t 4,680 t
1% CO2 emissions reduction acuired through
sustaianble, energy efficient warehouse design
Approx. 30,898 tonne kilometers reduction in demand-weighted distance
acuired by location optimalization
STEP 3: TRADE-OFF BETWEEN LOCATION OF WAREHOUSES AND THE WAREHOUSING ENERGY EFFICIENCY
Thirdly, the measurement of the environ-mental impact of a product is actually quite a challenge and should be performed properly before informed decisions can be taken. This is the field of Life Cycle Analysis (or Assessment, abbreviated to LCA). Here, one measures the environmental impact of a product from some starting point, ideally the extraction of raw materials, to some ending point, which can be the customer, the usage or the disposal. Many exam papers in SSCM contain basic LCA for some competing alter-natives (e.g. stone paper versus wood-based paper, or electronic distribution of media files versus physical distribution).
Finally, green or sustainable logistics usu-ally means that the activities themselves are carried out in a green way. Alternatively,
one could view green logistics as the design of logistics net-works to enable activities that are good for society and the environment, such as the replacement of fossil fuels and the collection of waste. As another example, the second poster, by Stefan Maagaard Nielsen (from AU) discusses the problem of setting up battery stations for electric cars in Århus (after arguing how the use of these vehicles is environmentally
better than regular cars).
The course SSCM does not provide a standard, off-the-shelf, one-size-fits-all approach, but it provides a set of tools, some of them mathematical, some of them conceptual. The stu-dents work under supervision with their individually chosen projects. As the field of research is multi-disciplinary, it is very interesting to see what students from other fields, such as management, marketing, and innovation can contribute. This is challenging, but definitely rewarding.
Marcel Turkensteen
(the Netherlands, 1979) is a lecturer at CORAL (Center of Operations Research And Logistics) at the Aarhus University. His research interests include routing and network problems and in particular the influence of the environment on logistics decisions and vice versa.
24 ORbit 19
artikel
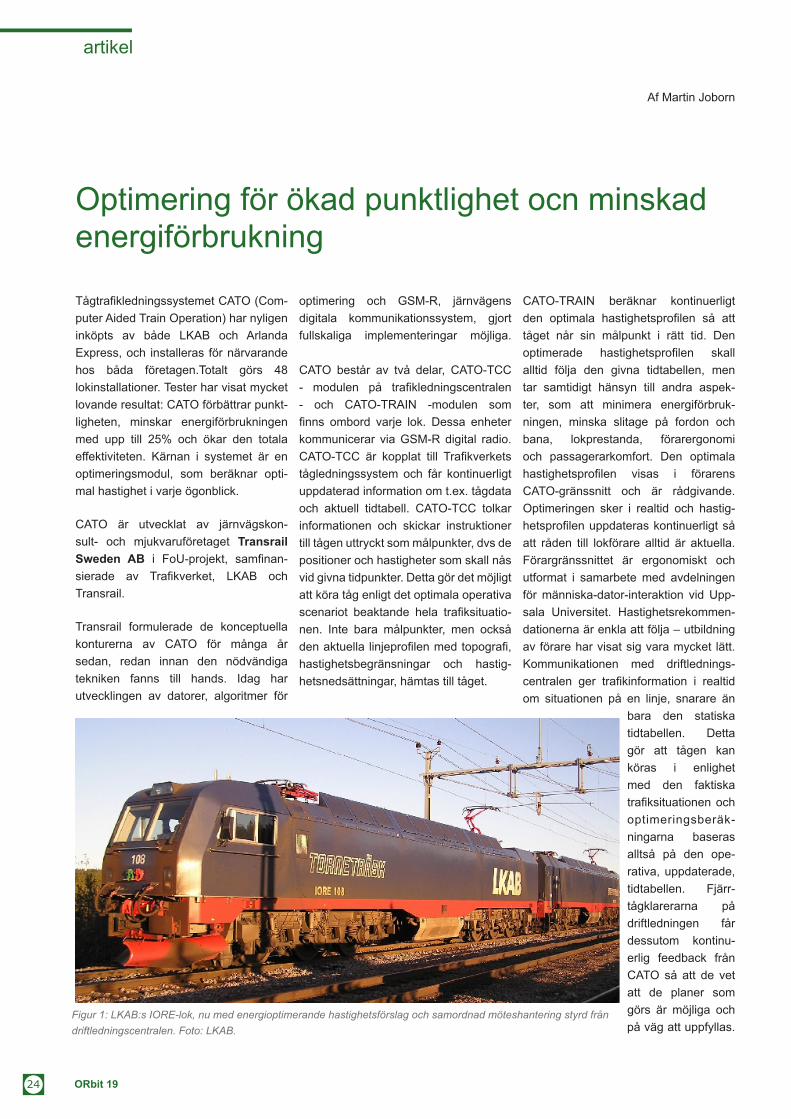
Tågtrafikledningssystemet CATO (Com-puter Aided Train Operation) har nyligen inköpts av både LKAB och Arlanda Express, och installeras för närvarande hos båda företagen.Totalt görs 48 lokinstallationer. Tester har visat mycket lovande resultat: CATO förbättrar punkt-ligheten, minskar energiförbrukningen med upp till 25% och ökar den totala effektiviteten. Kärnan i systemet är en optimeringsmodul, som beräknar opti-mal hastighet i varje ögonblick.
CATO är utvecklat av järnvägskon-sult- och mjukvaruföretaget Transrail Sweden AB i FoU-projekt, samfinan-sierade av Trafikverket, LKAB och Transrail.
Transrail formulerade de konceptuella konturerna av CATO för många år sedan, redan innan den nödvändiga tekniken fanns till hands. Idag har utvecklingen av datorer, algoritmer för
optimering och GSM-R, järnvägens digitala kommunikationssystem, gjort fullskaliga implementeringar möjliga. CATO består av två delar, CATO-TCC - modulen på trafikledningscentralen - och CATO-TRAIN -modulen som finns ombord varje lok. Dessa enheter kommunicerar via GSM-R digital radio. CATO-TCC är kopplat till Trafikverkets tågledningssystem och får kontinuerligt uppdaterad information om t.ex. tågdata och aktuell tidtabell. CATO-TCC tolkar informationen och skickar instruktioner till tågen uttryckt som målpunkter, dvs de positioner och hastigheter som skall nås vid givna tidpunkter. Detta gör det möjligt att köra tåg enligt det optimala operativa scenariot beaktande hela trafiksituatio-nen. Inte bara målpunkter, men också den aktuella linjeprofilen med topografi, hastighetsbegränsningar och hastig-hetsnedsättningar, hämtas till tåget.
CATO-TRAIN beräknar kontinuerligt den optimala hastighetsprofilen så att tåget når sin målpunkt i rätt tid. Den optimerade hastighetsprofilen skall alltid följa den givna tidtabellen, men tar samtidigt hänsyn till andra aspek-ter, som att minimera energiförbruk-ningen, minska slitage på fordon och bana, lokprestanda, förarergonomi och passagerarkomfort. Den optimala hastighetsprofilen visas i förarens CATO-gränssnitt och är rådgivande. Optimeringen sker i realtid och hastig-hetsprofilen uppdateras kontinuerligt så att råden till lokförare alltid är aktuella. Förargränssnittet är ergonomiskt och utformat i samarbete med avdelningen för människa-dator-interaktion vid Upp-sala Universitet. Hastighetsrekommen-dationerna är enkla att följa – utbildning av förare har visat sig vara mycket lätt. Kommunikationen med driftlednings-centralen ger trafikinformation i realtid om situationen på en linje, snarare än
bara den statiska tidtabellen. Detta gör att tågen kan köras i enlighet med den faktiska trafiksituationen och optimeringsberäk-ningarna baseras alltså på den ope-rativa, uppdaterade, tidtabellen. Fjärr-tågklarerarna på driftledningen får dessutom kontinu-erlig feedback från CATO så att de vet att de planer som görs är möjliga och på väg att uppfyllas.
Optimering för ökad punktlighet ocn minskadenergiförbrukning
Af Martin Joborn
Figur 1: LKAB:s IORE-lok, nu med energioptimerande hastighetsförslag och samordnad möteshantering styrd från driftledningscentralen. Foto: LKAB.

25 ORbit 19
artikel
CATO gör det möjligt för trafikledningen att kontrollera tågrörelserna vilket gör att både lokförare och fjärrtågklarerare kan lita på att tåget kommer fram till mål-punkten i tid och med önskad hastighet. Onödiga inbromsningar och stopp kan undvikas.
Den tillgängliga körtiden på en ban-sträcka kan ändras från dag till dag beroende på aktuell trafiksituation. Det gör att den optimala hastighetsprofilen också varierar mellan olika tåg och olika dagar. Den optimala hastighetsprofilen kan i själva verket vara mycket olik den hastighetsprofil som normalt väljs av föraren.
Storleken på energibesparingen som uppnås med CATO beror på ett antal faktorer, t.ex. den vertikala profilen på linjen, typ och vikt av tåget och tillgänglig körtid. Beräkningar och tester visar att CATO kan minska ener-giförbrukningen med så mycket som 20-25% även om tågen körs med en högre än normal medelhastighet. Optimeringen
är en fråga om att alltid använda den för stunden tillgängliga körtiden på ett optimalt sätt, utan att riskera försening. Även i den fasta tidtabellen finns det ett visst tids-slack, dvs för att uppnå robust-het är körtider i tidtabellen lite långsam-mare än om tågen skulle kört på absolut kortast möjliga tid.
CATO minskar driftskostnaderna, förbättrar punktligheten och ökar tra-fikkapaciteten i infrastrukturen. Möjlig-heten att hantera störningar i trafiken förbättras kraftigt. Lokföraren är alltid informerad om den aktuella trafikplanen och trafikledaren vet att tågen kommer att köras enligt den gällande planen. Minskade driftskostnader är inte bara en fråga om minimerad energiförbrukning, utan också t.ex. förbättrad punktlighet, minskat slitage på bromsar och bana, bättre utnyttjande av rullande materiel och personal, etc. Dessa är alla stora fördelar för järnvägssystemet i allmän-het, för operatörer, infrastrukturförvaltare och kunder. Kostsamma investeringar i infrastruktur kan undvikas eller minskas genom användning av CATO. CATO klarar en mycket hög grad av komplexi-tet vad avser typ av dragfordon, rullmot-stånd, linjeprofil, väderförhållanden etc. vilka alla kan hanteras av systemets optimeringsalgoritmer.
Marknadsutsikterna för system som CATO är mycket goda. Det finns en stän-dig press på järnvägarna för att minska driftskostnaderna och energiåtgången, samtidigt som robustheten i järnvägsnä-tet måste förbättras. Ökad järnvägstrafik och behovet av att använda infrastruktu-ren effektivt i kombination med stigande energikostnader och miljömedvetenhet kommer att driva efterfrågan på system som CATO.
Figur 3: Arlanda Express med CATO är både punktligt och energioptimalt. Foto: Patric Johansson
Figur 2: Lokförarens gränssnitt till CATO en bland annat hastighetsförslag och information om aktuell tidtabell.
Martin Joborn
har disputerat i optimeringslära vid Linköpings Universitet inom transportoptime-ring. Han arbe-tar på Transrail Sweden AB som senior konsult och optimeringsexpert. Han har även eget litet företag som utvecklar programvara för schemaläggning av sportevenemang. Martin är medlem i SOAF:s styrelse sedan 2003 och var ordförande 2008-2011.

26 ORbit 19
artikel
In October 2011 DORS nominated three applicants for participation in the EURO Summer Institute on Maritime Logistics (ESI2012). The applications were sent to EURO and the final selection of participants was made by a Scientific Committee on the basis of the submitted papers. From all over the world 23 early stage researchers were accepted for ESI2012 representing universities from Belgium, Denmark, France, Germany, Italy, the Netherlands, Norway, Switzer-land, Turkey, Ukraine, The United King-dom as well as Australia, Brazil, India, New Zealand and the United States. In January 2012 we were informed that all Danish applicants had been accepted.
The EURO summer institute 2012 was sponsored by EURO, the Gesellschaft
for Operations Research (GOR) and the organizing universities. Participation and accommodation was free for all par-ticipants. Additionally, the travel costs were covered by DORS and we are very grateful to all sponsors for giving us the opportunity to participate in the ESI 2012.
Two weeks on maritime logistics
The Summer Institute started on Sunday the 3rd of June with a welcome recep-tion at the Bremen youth hostel, which was the base camp of the ESI2012. The reception was an opportunity for the 23 participants to meet each other and the
The summer institutes
The series of EURO Summer and Winter Institutes (ESWIs) was launched in 1984 at the initiative of J.P. Brans. The idea is to gather a group of early stage resear-chers within a particular field of operati-ons research, by arranging a two week conference for them to present and discuss their research with each other and a selected group of invited senior experts in the field. EJOR has a special issue for the ESWIs for the research papers presented at the institute. The 2012 Summer Institute focused on Mari-time Logistics and was jointly organized by the Universities of Bremen and Halle-Wittenberg and was held in Bremen from June 3rd till June 15th 2012.
ESI 2012 EURO Summer Institute on Maritime LogisticsJune 3-15 2012, Bremen, Germany
By Karina H. Kjeldson, Berit D. Brouer, and Christian E.M. Plum
EURO organiserede i perioden 3. Juni – 15. juni, 2012 et såkaldt EURO Summer Institute (ESI) om Maritime Logistics i Bremen, Tyskland. EURO financierede deltagelsen og opholdet og DORS financierede transporten til og fra Bremen. Antallet af deltagere var begrænset til 17 personer, som skulle udvælges af EURO blandt alle indstillede kandidater fra de nationale OR-selskaber i EURO. DORS opstillede 3 kandidater (Karina Hjortshøj Kjeldsen, Berit Dangaard Brouer og Christian Edinger Munk Plum) og til stor glæde blev alle 3 kandidater fra DORS udvalgt! Virkelig flot, og noget DORS kan være stolt af, og der skal lyde et stort TILLYKKE til Karina, Berit og Christian. Læs om deres tur her.

27 ORbit 19
artikel
Figure 2: The ESI2012 participants at Bremen city hall.
two main organizers Prof. Dr. Christian Bierwirth (Halle-Wittenberg) and Dr. Frank Meisel (Halle-Wittenberg).
The scientific programme was based at the Bremen University Guest House and started Monday June 4th. During the course each participant was given 90 minutes for pre-senting a research paper followed by a group discussion with the aim of pre-paring the research paper for a publica-tion. The scientific programme was divided into five overall subjects: Seaside port ope-rations, Hinterland Tr a n s p o r t a t i o n , Yard Management, Maritime Ship Rou-ting and Maritime Network Design. The first two days we focused on seaside port ope-
rations. Six participants presented their work within the subject supplemented by a lecture by Prof. Dr. Christian Bierwirth on Seaside operations planning in con-tainer terminals and a discussion round on seaside port operations moderated by Dr. Frank Meisel, who both have extensive experience within the area.
On Monday afternoon a city tour of Bremen with native guide Prof. Dr. Chri-stian Bierwirth was organized. We were introduced to the City Hall of Bremen and the history of the Hanseatic cities, which gave a good introduction to the strength of maritime trade in this city.
Wednesday we visited the impres-sive semi-automatic container terminal Hamburg Altenwerder. The visit was guided by Prof. Stefan Voß, University of Hamburg, who has been involved in the design of the terminal, which makes extensive use of decision support and automation of the terminal handling operations. Afterwards, Prof. Stefan Voß gave a lecture on recent developments in seaport terminal management at the University of Hamburg. The day ended with an unforgettable, but rainy city tour of Hamburg.
Thursday and Friday the focus was on Hinterland Transportation. Five partici-pants presented their research within this field followed by a lecture and a discussion round by Prof. Rommert
Figure 1: From the left: Prof. Dr. Stefan Voß (University of Hamburg), prof. Dr. Christian Bierwirth (Martin-Luther-Universität Halle-Wittenberg), Dr. Frank meisel (Martin Luther-Universität Halle-Wittenberg) and Prof. Kjetil Fagerholt (NTNU), at Bremenports.

28 ORbit 19
artikel
Christian E.M. Plum
is a Industrial Ph.D. student at the Technical University of Denmark (DTU) and Network Expert at Maersk Line - Network Strategy. The Ph.D. thesis concerns liner shipping network design.
Berit D. Brouer
is a Ph.D. student at the Technical University of Denmark (DTU). The Ph.D. thesis concerns liner shipping network design and is part of the ENERPLAN project.
Karina Hjorts-høj Kjeldsen
holds a Ph.D. from Aarhus University. Karina pre-viously worked at CORAL at Aarhus University. Her research inte-rest is optimization in the liner ship-ping industry.
Dekker, Erasmus University Rotterdam. The presentations took place at the Bremen University Campus. We were invited on a campus tour, which included a visit to the fascinating drop tower at the Center of Applied Space Techno-logy and Microgravity. The campus tour made a final stop at a biergarten close to Campus.
The first subject of the second week was yard management. There were five pre-sentations by participants and a lecture by Prof. Iris Vis, University of Groningen, on Equipment selection and yard opera-tions in container terminals. The session on yard management was concluded with a discussion round moderated by Prof. Iris Vis assigning us into groups to discuss new research directions within the field. On Tuesday Prof. Hans-Diet-rich Haasis, University of Bremen gave a short presentation and introduced Prof. Mai Sha, Shanghai Maritime University, who talked about intermodal networks in China. Tuesday in the afternoon the session on Maritime Ship Routing and Scheduling was introduced with two participant presentations.
Wednesday we visited the city of Bre-merhaven. The morning was hosted by Bremen-ports and included a presenta-tion of the company. The presentation helped clarify the differences between a port company and a terminal operator. The morning ended with a very inte-resting presentation on maritime ship scheduling and inventory routing given by Prof. Kjetil Fagerholt, Norwegian Uni-versity of Science and Technology. After lunch at the National Maritime Museum we visited the automobile terminal Bremerhaven. The visit started with two presentations where the first gave a general presentation of the terminal and the second one focused on the terminal’s involvement in the wind mill industry in the Northern Sea, which was very impressive. After the presentations
we took a tour of the automobile terminal itself and it is safe to say that several of the participants were dreaming of beau-tiful cars on their way back to Bremen.
Thursday we continued the focus on maritime routing and inventory routing with two participant presentations and a discussion round moderated by Prof. Kjetil Fagerholt. The discussion round focused on best practice in scientific writing and publishing, of great value to all of us. The last day of the institute, Friday, focused on maritime network design and included three presentations by participants. The evening was set aside for the farewell barbecue, which was a great success.
Thank you for a great event
Before going to the ESI2012 we all felt that two weeks was a very long time to set aside for the summer school, but on the last day of the summer institute, when we were saying our goodbyes, it was obvious that we had made strong connections during our two weeks together. We had had the opportunity to discuss our research and life in the academic world with peer researchers and we had many laughs together. After the ESI2012 we are still in contact with some of the participants for personal and professional reasons. The ESI2012 was truly well organized with a great location, inspiring guest lectures, rele-vant excursions and great social events. We have gained insight into related research areas within maritime logistics and have larger insight into the maturity of the various research fields. We have also expanded our network within mari-time operations research, which is very valuable in this relatively small research field. We would like to thank the orga-nizers, sponsors, guest lecturers and participants of the ESI2012 for a great event.
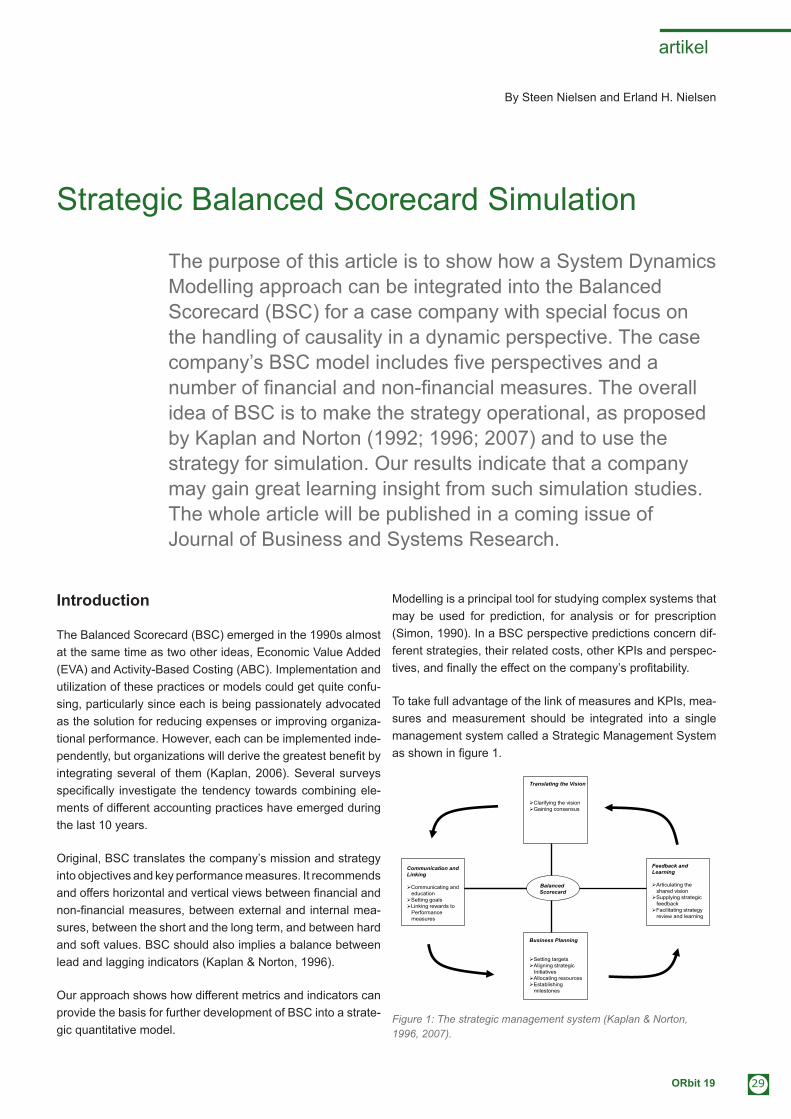
29 ORbit 19
artikel
Translating the Vision Clarifying the vision Gaining consensus
Communication and Linking
Communicating and education Setting goals Linking rewards to Performance measures
Feedback and Learning
Articulating the shared vision Supplying strategic feedback Facilitating strategy review and learning
Business Planning Setting targets Aligning strategic Initiatives Allocating resources Establishing milestones
Balanced Scorecard
Introduction
The Balanced Scorecard (BSC) emerged in the 1990s almost at the same time as two other ideas, Economic Value Added (EVA) and Activity-Based Costing (ABC). Implementation and utilization of these practices or models could get quite confu-sing, particularly since each is being passionately advocated as the solution for reducing expenses or improving organiza-tional performance. However, each can be implemented inde-pendently, but organizations will derive the greatest benefit by integrating several of them (Kaplan, 2006). Several surveys specifically investigate the tendency towards combining ele-ments of different accounting practices have emerged during the last 10 years.
Original, BSC translates the company’s mission and strategy into objectives and key performance measures. It recommends and offers horizontal and vertical views between financial and non-financial measures, between external and internal mea-sures, between the short and the long term, and between hard and soft values. BSC should also implies a balance between lead and lagging indicators (Kaplan & Norton, 1996).
Our approach shows how different metrics and indicators can provide the basis for further development of BSC into a strate-gic quantitative model.
Modelling is a principal tool for studying complex systems that may be used for prediction, for analysis or for prescription (Simon, 1990). In a BSC perspective predictions concern dif-ferent strategies, their related costs, other KPIs and perspec-tives, and finally the effect on the company’s profitability.
To take full advantage of the link of measures and KPIs, mea-sures and measurement should be integrated into a single management system called a Strategic Management System as shown in figure 1.
Strategic Balanced Scorecard Simulation
The purpose of this article is to show how a System Dynamics Modelling approach can be integrated into the Balanced Scorecard (BSC) for a case company with special focus on the handling of causality in a dynamic perspective. The case company’s BSC model includes five perspectives and a number of financial and non-financial measures. The overall idea of BSC is to make the strategy operational, as proposed by Kaplan and Norton (1992; 1996; 2007) and to use the strategy for simulation. Our results indicate that a company may gain great learning insight from such simulation studies. The whole article will be published in a coming issue of Journal of Business and Systems Research.
By Steen Nielsen and Erland H. Nielsen
Figure 1: The strategic management system (Kaplan & Norton, 1996, 2007).
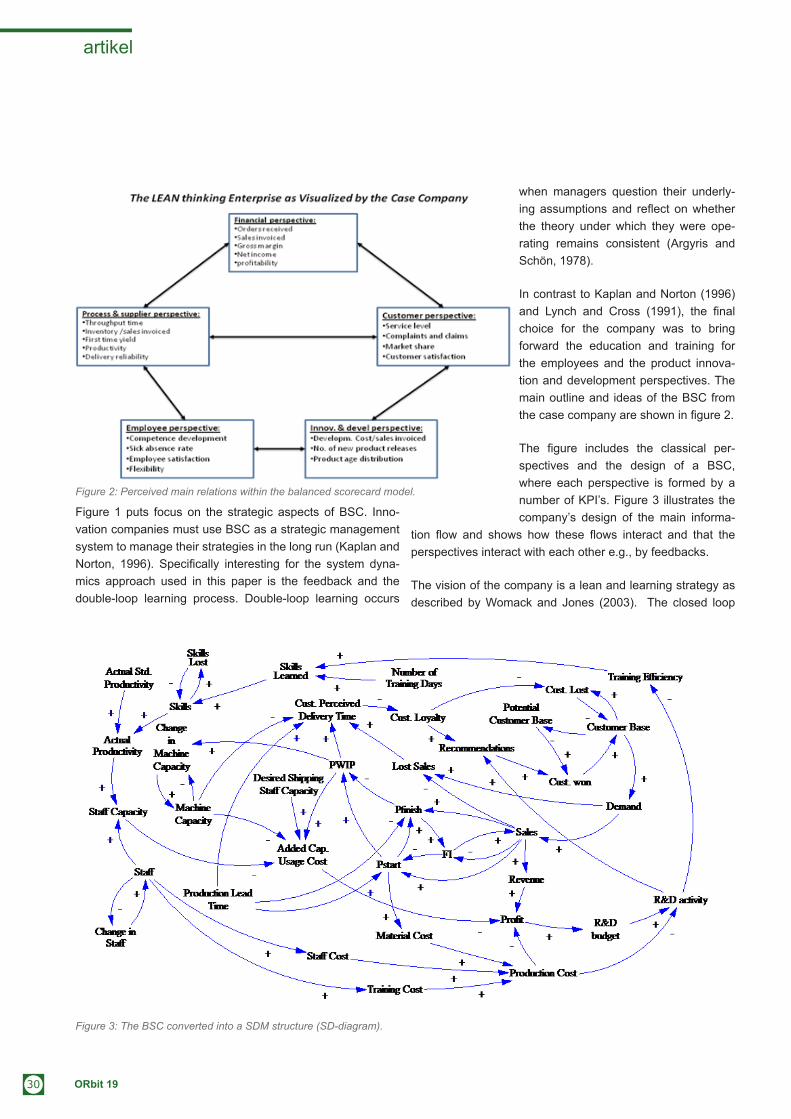
30 ORbit 19
artikel
Figure 1 puts focus on the strategic aspects of BSC. Inno-vation companies must use BSC as a strategic management system to manage their strategies in the long run (Kaplan and Norton, 1996). Specifically interesting for the system dyna-mics approach used in this paper is the feedback and the double-loop learning process. Double-loop learning occurs
when managers question their underly-ing assumptions and reflect on whether the theory under which they were ope-rating remains consistent (Argyris and Schön, 1978).
In contrast to Kaplan and Norton (1996) and Lynch and Cross (1991), the final choice for the company was to bring forward the education and training for the employees and the product innova-tion and development perspectives. The main outline and ideas of the BSC from the case company are shown in figure 2.
The figure includes the classical per-spectives and the design of a BSC, where each perspective is formed by a number of KPI’s. Figure 3 illustrates the company’s design of the main informa-
tion flow and shows how these flows interact and that the perspectives interact with each other e.g., by feedbacks.
The vision of the company is a lean and learning strategy as described by Womack and Jones (2003). The closed loop
Figure 2: Perceived main relations within the balanced scorecard model.
Figure 3: The BSC converted into a SDM structure (SD-diagram).

31 ORbit 19
artikel
causal reasoning described above fits directly into the system dynamics modelling tradition as it is used within VENSIM™, which by the way is the software used for this project. VENSIM™ has all the nice essential features for developing a complete system dynamics model, e.g., exploration, analysis and optimization of simulation models (Eberlein & Peterson, 1992). However, one of the basic problems is the problem of causality in general and in system dynamics specifically.
The system dynamic model approach
The separate parts above are linked to form a complete dynamic model. The dynamic and integrated construct makes it possible to do simulation and strategic learning and to do real-time research. Strategic learning consists of gathering feedback, testing the hypotheses on which the strategy was based and making the necessary adjustments. This is exactly what the scorecard should give managers ( Kaplan and Norton, 2007). If, for instance, a company’s employees have improved the performance in relation to some of the drivers (reduced lead times or increased capacity for example), then a failure to achieve the result that was to be expected based on the model (higher EVA for example) mostly likely signals that the model is not fully correct and adequately compre-hensive yet. The complete BSC model in the SDM layout is shown in figure 3.
However, it is important to keep focus on the purpose of the model and to continuously perform the necessary validation
in relation to this (Barlas, 1996). Below we have demonstrate two simulation scenarios by the use of system dynamics and the quantitative BSC model.
Simulation scenario 1
The model is formulated as a monthly model over a five-year period, and the base-run is set for a company with a ’Produc-tion Lead Time’ of six months. This is quite a lengthy produc-tion time span and though the model is a ’pull’ based logistics structure, the production lead time clearly disqualifies it from being lean at the outset. The outcome is shown in figure 4.
From the ’Customer Perspective’ we see that ’Customer Loyalty’ is constant over the entire period, and although the variable ’Recommendations’ oscillates, its average value does not decrease over time.
From the ’Process & Supply perspective’/’Lean perspective’ we note that the company is facing a growing market. The ’Demand’ increases from an initial value of 2,000 to slightly above 5,000 at the year five. We further notice that all activity variables are increasing on average with moderate oscillati-ons and no signs of alarm. However, a slight warning turns up when the ’Average Unit Throughput Cost’ is considered – it seems to show a non-decreasing path, which is not a good sign.
The ’Financial Perspective’, however, intensifies these worries even further. Though the ’Profit’ seems to increase over the five-year period, the EVA and RoCE mea-sures seem to indicate that business deterio-rates over the five-year period. Combined with the message given by ’Average Unit Through-put Cost’, the company is facing a difficult or even bad situation. Action is definitely required in order to improve the general business of the company.
Figure 4: Output and KPIs from the cockpit model.

32 ORbit 19
artikel
Simulation scenario 2
This scenario is characterized by a reduction of the ’Produ-ction Lead Time’ from six months to three months and an increase in the number of staff trainings from zero to five training days per month. Though the nature of the analysis has not – so far – been very general, some characteristically features do, however, become evident. The results are shown in figure 5.
Increasing the ’Number of Trainings’ clearly has a significant productivity effect as should be expected. From the ’Emplo-yees Perspective’ plot we note that the ’Staff’ curve is now lower than the ’Staff Capacity’ curve owing to the increase in productivity. However, it can also be noted that the general need for ’Staff Capacity’ has decreased in this scenario, the most probable reason being the decrease in the ’Production Lead Time’. It is a well-known fact that a decrease in the ’Pro-duction Lead Time’ has a very positive effect in pull systems as it increases the performance in all logistics aspects. Howe-ver, with regard to the financial measures, this well-behaving aspect seems to tell a somewhat different story. ’Profit’ is not the best measure to tell us much about the general healthi-ness of the business. In our scenarios it increases simply because the market is increasing, whereas both the ’EVA’ and the ’RoCE’ measures did show definitely warning signals when the ’Production Lead Time’ is at its high value. Lowering the ’Production Lead Time’ significantly turns ’EVA’ into a posi-tive financial signal, whereas the ’RoCE’ only after some time
shows a persistent posi-tive economic tendency – in our scenario setup this amounts to appro-ximately two years. Especially the drop in the RoCE measure after six months might be very worrying in order to maintain confidence in the decision to lower the ’Production Lead Time’. One could easily imagine the discussions that might arise between logistics people and controlling people in the company, especially if they do not have a full BSC ’cockpit’ at their disposal.
Conclusions
We have used the BSC theory as the basic research frame for developing and testing a holistic model with illustrations from different lean scenarios on the financial perspective. A major issue of senior executives is ‘How do I make sure that the organization is executing our strategy?’ The research idea was also motivated by the growing pressure on companies to introduce more holistic decision models for decision-making
Figure 5: Output and KPIs from the cockpit model.
Figure 6: The simulation framework.

33 ORbit 19
artikel
Steen Nielsenis currently Associate Professor at Department of Economics and Business, Business and Social Science, Aarhus University, Denmark. He received his Master’s degree in Accounting from Aarhus School of Business, and his PhD in Cost & Management Accounting from the Stockholm School of Economics. He is currently a member of Cluster for Operations Research and Logistics (CORAL), situated at the Department of Economics and Business, Aarhus University, Denmark.
Erland Hejn Nielsen is currently Associate Professor at at Department of Economics and Business, Business and Social Science, Aarhus University, Denmark. He received his MSc (Econ/Math) degree from University of Aarhus, Denmark. He is currently a member of Cluster for Operations Research and Logistics (CORAL), situated at the Department of Economics and Business, Aarhus University, Denmark.
(Otley 1999; Kaplan and Norton, 2007). The following figure 6 puts emphasize on the strategic feedback learning process, where system dynamics simulation models play an important role. The company can, therefore, use the model in their active planning for determining when to change or revise the strategy.
As pointed out by Kaplan and Norton (1996, 2007), it is vital that the company is able to evaluate different strategies on the financial result before, during, and after they are executed. Our model gives this opportunity to get what Kaplan and Norton (2007) call ‘strategic learning’.
As pointed out by Sterman (2000) and Simon (1990), the use of SDM may be seen as a natural development for complex situations. Converting and testing more factual and compli-cated models are important. An advantage for such a model approach is that a company can make risk-free experiments by changing some parts of the model, a strategy or a variable. It may also be the basis for further discussion of the financial benefits for both a short and a long run perspective.
References
• Argyris, C. and Schön, D. A. (1978) ‘Organizational Lea-rning: A Theory of Action Perspective’, Addison Wesley Company, USA.• Barlas, Y. (1996) ‘Formal Aspects of Model Validity and Validation in System Dynamics’, System Dynamics Review, Vol. 12, No. 3 Fall, pp. 183-210.• Eberlein, R. K., Peterson, D. W. (1992) ‘Understanding Models with Vensim’, European Journal of Operational Research, Vol. 59, 216-219. • Kaplan, R. S. (2006) ‘The Competitive Advance of Manage-ment Accounting’, Journal of Management Accounting Research, Vol. 18, pp. 127-135. • Kaplan, R. S. and Norton, D. P. (1992) The Balanced Sco-recard – Measures that Drive Performance, Harvard Business Review, No. 1, pp. 71-79. • Kaplan, R. S. and Norton, D. P. (1996) The Balanced Sco-recard – Translating Strategy into Action, Harvard Business School Press, Boston, USA.• Kaplan, R. S. and Norton, D. P. (2007) ‘Using the Balanced Scorecard as a Strategic Management System’, Harvard Business Review, July-August, pp. 150-161. • Lynch, R. and Cross, K. E. (1991) Measure Up! Yardstick for Continuous Improvement, Cambridge, Mass., Basil Black-well. • Nielsen, S., and Nielsen, E.H. (2012). Transcribing the Balanced Scorecard into System Dynamics: From Idea to
Design, forthcoming, in International Journal of Business and Systems Research. • Otley, D. (1999) ‘Performance Management: A Framework for Management Control Systems Research’, Management Accounting Research, Vol. 10 (4), pp. 363-382. • Simon, H. A. (1991) ‘Bounded Rationality and Organizational Learning’, Organization Science, Vol. 2 No. 1, pp. 125-134.• Sterman, J. D. (2000) Business Dynamics. System Thinking and Modelling for a Complex World, McGraw-Hill Higher Edu-cation, Boston USA.

34 ORbit 19
artikel
Af Anders Skajaa og Gitte Øskov Skajaa
Introduktion
Efter færdiggørrelsen af kandidatgraden i medicin fra et af landets universiteter, skal de danske læger, som næste skridt i deres læge-uddannelse, gennemføre den såkaldte kliniske basisuddannelse (KBU), der i 2008 erstattede turnus-uddan-nelsen. Et KBU-forløb består af to halvårlige stillinger, begge i den samme region i landet. Uanset hvorfra den nye læge er uddannet, besættes disse stillinger alene ved lodtrækning. Denne proces forløber ved, at landets i alt N kandidater ved lodtrækning tildeles tal mellem 1 og N . Fra et givet tidspunkt har kandidaten med nummer 1 så ti minutter til frit at vælge blandt de N tilgængelige forløb over hele landet. Derefter vælger nummer 2 blandt de resterende 1−N forløb osv. For tiden har vi ca. 400=N .
Denne seance er ofte til stor debat og frustration blandt medicinstuderende fordi der er stor forskel på populariteten af forløb. Variationen i popularitet skyldes dels den geografi-ske placering såvel som de stillinger det enkelte KBH-forløb indeholder. Tildelingsmetoden resulterer ofte i, at personer der bor, har læst, har venner og eventuelt familie i én region, bliver tvunget til en helt anden region af landet. Dette er natur-ligvis til stor skade for denne person og dennes familie og frygten for at dette sker, har gjort tildelingsmetoden upopulær.
Om optimal tildeling af KBU-forløb
Vi viser i denne artikel hvorfor Sundhedsstyrelsens nuværende lodtrækningsmetode til fordeling af KBU-forløb (tidligere kaldet turnus) er fundamentalt defekt og i matematisk forstand suboptimal. Ved hjælp af simple eksempler anskueliggøres problemet og vi foreslår som erstatning en optimal metode, som bygger på kendte idéer fra matematisk optimering. Vi demonstrerer, at en kandidat med denne optimale tildelingsmetode i gennemsnit kan forvente at blive tildelt et KBU-forløb der ligger to-tre gange højere på kandidatens prioriteringsliste. Endelig diskuteres hvordan denne metode kan implementeres i praksis og hvordan man kan opnå yderligere forbedringer med advancerede moderne matematiske metoder.
Men hvordan kan KBU-forløbene tildeles på en mere rimelig og hensigtsmæssig måde?
I denne artikel vises hvorfor den nuværende procedure fra et matematisk synspunkt er ugunstig og beviseligt subopti-mal. Desuden gives et forslag til hvordan man med allerede kendte matematiske metoder kan fordele KBU-forløbene så flere studerende bliver tilfredse - og lige så vigtigt: færre bliver utilfredse.
Et illustrerende eksempel
Lad os benævne de N nye kandidater som NKKK ,,, 21 . Tilsvarende findes N KBU-forløb NFFF ,,, 21 .
I det følgende illustrerende eksempel antager vi 4=N . Vi skal altså fordele 321 ,, KKK og 4K på de 4 forløb 321 ,, FFF og 4F . Hver kandidat prioriterer nogle forløb fremfor andre, og vi antager, at alle kandidaterne kan nedskrive en prioriteret liste med alle forløbene. For eksempel således:
4132341234213241
4
3
2
1
4321
KKKK
FFFF

35 ORbit 19
artikel
Tabellen forstås sådan, at hver række viser en kandidats prio-riterede rækkefølge af forløbene.
Sundhedsstyrelsens procedure er at trække lod. Hver kandi-dat tildeles et nummer fra 1 til 4. Lad os sige at lodtrækningen faldt ud sådan at 2K vælger først, efterfulgt at 1K , 4K og til sidst 3K . Hvis alle kandidater vælger dét tilgængelige forløb, der står højest i deres prioriteringsliste, vil 2K først vælge 1F. Dernæst vælges 3F af 1K , 4K vælger 2F og til sidst er 2K tvunget til at vælge 4F . Således:
Vores problem har følgende egenskaber:
1. I hver række af tabellen optræder tallene 1, 2, 3, 4 præcis én gang hver.
2. Summen af tallene i en søjle kan fortolkes som et mål for den generelle popularitet af et forløb. Jo mindre sum, jo mere populært.
3. En bestemt sammensætning af kandidater og forløb svarer i tabellen til at lave én cirkel i hver række sådan at der også kun er én cirkel i hver søjle.
4. Gennemsnittet af prioriteterne for de realiserede parringer kan fortolkes som et mål for kvaliteten af den samlede sam-mensætning af kandidater og forløb.
Kvaliteten af en sammensætning
Vi kan definere et kvalitetsmål Q som summen af de udvalgte prioriteter divideret med N . For en bestemt sam-mensætning er Q altså gennemsnittet af de realiserede prioriteringer. For vores specifikke lodtrækning har vi Q
2.25=3)/432(1= +++ . Men se nu følgende to sam-mensætninger, lavet over samme tabel:
Disse to sammensætninger er tydeligt bedre, hvilket kvalitete-smålet Q også viser.
Lad Qopt være den bedst mulige (eller optimale) værdi af Q for en given tabel. Den værdi af Q, der i gennemsnit opnås med lodtrækning kalder vi Qlod.
Det er klart, at det er nemt at bestemme sådan en optimal sammensætning når 4=N . Vi kan bare betragte tabellen et øjeblik og bestemme den. Men prøv nu at gøre det samme i denne tabel:
19102873546935817246103879102165487194236510438561971021245310798627891435106265104891738467110352921098643751
10
9
8
7
6
5
4
3
2
1
10987654321
KKKKKKKKKK
FFFFFFFFFF
I tabellen ovenfor er N blot lig 10 og det er allerede et uover-skueligt problem.
Man vil opdage, at et valg foretaget tidligt for en bestemt kandidat har konsekvenser for senere kandidater og netop dette gør problemet kompliceret. For eksempel: En kandi-dat, der egentlig er ligeglad om han får forløb 1F , 2F eller 3F, vælger bare ét af dem, lad os sige 2F . Den næste kandidat ville meget hellere have 2F end 1F og 3F , men er nu tvunget til at vælge 1F eller 3F . Han vælger 1F . Den næste kandidat ville allerhelst have 1F , men skal nu vælge 3F . Altså bliver to ud af tre kandidater utilfredse, og dét på trods af, at alle kunne have været tilfredse.
Dette eksempel blotlægger den helt fundamentale defekt ved lodtrækningsmetoden. I lodtrækningsmetoden gennemløbes en tabel som dén ovenfor række for række (kandidat for kan-didat). Men i hvert skridt bruges kun den information, som er indeholdt i dén ene række. Dette tildelingsproblem er imidler-tid af en sådan karaktér, at det kun kan løses optimalt, hvis man i løsningsproceduren simultant bruger al den information, som tabellen indeholder.
Den Matematiske Løsning
Når 400=N er det umuligt for mennesker at løse dette pro-blem optimalt indenfor overskuelig tid. Men fra matematikken

36 ORbit 19
artikel
findes systematiske procedurer (algoritmer) til at bestemme en optimal sammensætning for en given tabel. Vi behøver ikke forstå detaljerne i, hvordan en sådan virker, men bare vide, at den bestemmer en optimal sammensætning.
Hvis kandidaternes prioritering af forløbene er uniformt fordelt, er det matematisk bevist1, at Q )(lnlod N≈ . Det er også bevist, at ≤1.51 Q 2opt≤ . Altså: Hvis populariteten af forløbene var uniformt fordelt og man bruger Sundhedsty-relsens lodtrækningsmetode, kan man ca. forvente at få sin sjette prioritet opfyldt (da 6(400)ln ≈ ). Med den optimale sammensætning i stedet, kan hver kandidat ca. forvente at få sin anden prioritet opfyldt. Selvom populariteten af alle forløb bestemt ikke er lige stor, fortæller disse resultater noget om egenskaberne ved de to tildelingsmetoder - altså om hvor gode de er i forhold til hinanden.
Når populariteten af forløbene er fordelt mere skævt, kan vi opnå indsigt i hvor meget bedre den optimale tildeling er end lodtrækningsmetoden ved at udføre numeriske eksperimenter i en computer.
Numeriske eksperimenter
I dette afsnit undersøges via eksperimenter hvor meget bedre sammensætningen af kandidater og forløb kunne blive, hvis man bestemt den optimale sammensætning ved at bruge en optimeringsalgoritme. For at udføre disse eksperimenter, følger vi denne procedure:
1. For hver af de 400=N kandidater genereres en tilfæl-dig prioriteringsliste - dog sådan at populariteten af forløb er fordelt på en bestemt måde (se nedenfor). Vi danner altså en tabel som dem vist ovenfor.
2. Algoritmen bruges så til at finde den optimale sammensæt-ning af kandidater og forløb.
3. Nu genereres tilfældigt 100 lodtrækninger og det bestem-mes hvilken sammensætning hver af disse giver. Hver kan-didat vælger blot sit højest placerede forløb som stadig er tilgængeligt (som i virkeligheden). Vi beregner endelig det gennemsnitlige Q for disse 100 tildelinger, resultatet kaldes Qlod.
4. Endelig kan vi så udregne R = Q /opt /Q lod. Hvis fx R = 0.50 var vores metode ca. dobbelt så god som lodtrækningsmeto-den.
Da visse områder og forløb er specielt eftertragede blandt kandidaterne - særligt de store byer og specielt forløb der
inkluderer ophold i intern medicin - vil fordelingen af populariteter af forløb være af en type som dén der er vist i figur 1.
Hvis vi genere-rer en fordeling som denne og derpå udfører vores ekspe-riment som beskrevet ovenfor finder vi ca. Q 9.98=lod og Q 4.23=opt , og derfor nu R 0.42≈ . Alså en markant bedre sammensætning ved brug af vores optime-ringsalgoritme.
Dette resultat kan belyses lidt bedre: Hvis man tæller antallet af kandidater der får deres første prioritet opfyldt, antallet der får deres anden prioritet opfyldt, deres tredje, deres fjerde og så videre, og derefter plotter disse antal med prioriteten ud ad x -aksen, får man et billede som det, der er vist i figur 2. Denne figur er dannet ved at generere en fordelingstype som den realitiske i figur 1, udregne sammensætninger for begge metoder og så optælle som beskrevet ovenfor. Alt dette er gjort 1000 gange og figur 2 viser gennemsnitsfordelingen over disse 1000 forsøg.
Vi ser tydeligt hvordan lodtrækningsmetoden er til ugunst for langt flere kandidater. Begge metoder har en klump sandsyn-lighedsmasse koncentreret til venstre. Men lodtrækningsme-todens klump er bredere – og den fortsætter langt ud i de kedelige numre. Man kan altså med den optimale metode i langt højere grad forhindre, at kandidater ufrivilligt bliver tvunget ud i forløb, de ikke ønsker og/eller er langt fra deres hjem.
Kan det så bruges i virkeligheden?
Ja. Men det er åbenlyst, at metoden skal tilpasses virkelighe-den en smule. Man kunne fx indvende følgende:
1. Kan man virkelig få alle cand.med’ere til at prioritere alle 400 forløb? Principielt ja, men i praksis er det nok svært. Hel-digvis er det ikke nødvendigt. Der findes metoder, hvor alle ikke behøver prioritere alle forløb, når bare alle forløb er på nogens prioriteringsliste. Men det er klart, at jo bedre og jo mere information man har (~ jo længere prioritetslisterne er), jo bedre bliver den optimale sammensætning.
Figure 1: Mest realitisk fordeling af populariteten af forløb.

37 ORbit 19
artikel
2. Er Q det bedste mål for kvaliteten af en bestemt sam-mensætning? Ikke nødvendigvis. Men man kan nemt bruge et andet kvalitetsmål ved fx at lade kandidaterne vægte deres prioriterede forløb med andre tal end N,1,2, . Fx kunne man beslutte, at hver kandidat skulle fordele et antal »point« ud over forløbene – flere forløb måtte gerne tildeles samme antal point, men der skulle være en øvre grænse for hvor mange point et forløb kunne tildeles.
3. Bliver dette ikke meget tidskrævende for kandidaterne og Sundhedsstyrelsen? Under det nuværende lodtræknings-system tager den samlede parring af kandidater og forløb ca. seks arbejdsdage to gange om året. For hver kandidat kulminerer det med ti minutter bag en computerskærm. Under det foreslåede system skal hver kandidat i løbet af en fast periode udarbejde en liste med prioriteter og evt svare på nogle spørgsmål. Vores gæt er, at kandidaterne er villige til at lægge denne smule arbejde, for derimod at få en meget højere sandsynlighed for at få et tilfredsstillende forløb.
4. Får man ikke bare en computer der sender folk ad pom-mern til? Husk nu: Det har man allerede! Forskellen er, at denne nye metode, imodsætning til den nuværende, udnyt-ter langt mere af den tilgængelige information til at træffe en intelligent beslutning. Se specielt figur 2: Sandsynligheden for at blive tilfreds og specielt for ikke at blive utilfreds vokser markant.
5. Kan det egentlig ikke gøres endnu bedre? Jo, sagtens. Den i denne artikel skitserede metode er næsten den simpleste og mest naive tilgang til denne type problem. Man kan gøre
udvælgelsen endnu bedre hvis man stiller kandidaterne spørgsmål, der afslører endnu mere information: Eksem-pel: Alle kandidater prioriterer de enkelte komponenter af et kbu -forløb såsom typen afdeling, speciale, område, startdato og gør dette uafgængigt af hinanden. Desuden vægtes disse faktorer. Man kan så bruge denne informa-tion i en slags interpolations-metode. Dette kan gøres på ret sofistikeret vis ved at løse det såkaldte Collaborative Filtering problem2. Det er med lignende metoder at store digitaliserede virksomheder (fx Amazon, Netflix, Face-book etc.) laver intelligente anbefalinger af produkter til forbrugere baseret på deres købe– og adfærdshistorie.
Afsluttende bemærkninger
Hvis rigtig mange kandidater alle foretrækker meget få forløb, bliver det sværere at stille mange tilfreds – også selvom man bruger denne optimale metode. Men bemærk at det bliver ligeså meget sværere for lodtræk-ningsmetoden. Altså vokser både Q opt og Q lod .
Det vigtige at forstå for den enkelte kandidat er, at man før lodtrækningen er kendt har større sandsynlighed for at få et forløb højt på sin liste ved den optimale metode end ved Sundhedsstyrelsens lodtrækningsmetode. Sandsynligheden for at ligge øverst i lodtrækningen er jo forsvindende lille. Dette er specielt tydeligt illustreret i figur 2.
Den foreslåede metode fjerner selvfølgelig ikke upopulære KBU-forløb. I stedet gives de til de kandidater, der bedst accepterer dem. Hvis ingen accepterer dem, svarende til, at alle prioriterer dem nederst, bliver Q opt højst lig Q lod, men aldrig højere. Altså kan den foreslåede metode ikke levere en sammensætning af kandidater og forløb der er ringere end lodtrækningsmetoden, kun bedre. Og i reglen, meget bedre.
Noter
1. Se fx Rainer E. Burkard, Mauro Dell’Amico, Silvano Martello: Assignment Problems. SIAM 2009.2. Se fx http://en.wikipedia.org/wiki/Collaborative_filtering
Figure 2:Fordeling af realiserede prioriteter for de to metoder. Bemærk logaritmisk skala på den vertikale akse.
Anders Skajaa er PhD-studerende i anvendt matematik på Danmarks Tekniske Universitet.
Gitte Ø skov Skajaa er nyuddannet læge fra Københavns Universitet.
38 ORbit 19
DORS pris
The planning jobs of a Danish high school are often many and complex; hiring teachers, planning parent-teacher consultations, choosing elective cour-ses, scheduling the time table. Of these, timetabling has the largest complexity, requires the most resources and has a high impact on the quality of the school’s primary product – the classes. The focus of our master thesis was to use meta-heuristics to solve two important parts of the timetabling - elective course plan-ning and the assignment of classes into timeslots, i.e. the actual timetabling. The thesis was carried out in cooperation
with the company Macom, which is the provider of the most popular high school administrative system, Lectio, and the produced algorithms were included in Lectio’s ’Class & subject’ module (DK: Time-fag modul).
Why metaheuristics?
When we started investigating the timetabling problem, a fellow computer science student said: Do not touch this subject, it is impossible to create soft-ware for timetabling that can take into account all special demands from tea-
chers and principals – many have tried and many have failed. It did also turn out to be a challenge just to formulate an adequate model for Danish high school timetabling.
We learned from interviews with Macom and high schools that the most popular planning tools on the market are GAS, which has a tool for assigning elective courses, and TPlan, which assists the timetabling. These software tools seemed to work using direct heuristics developed over many years in coopera-tion with the high schools. However, the most common method was still to do the elective course packing and the timetab-ling manually, spending several weeks during the summer period. There was definitely room for improvement.
The focus of our project was practical and we were not interested in doing a completely theoretical study of time-tabling of a general model that would have no use in practice. There were a few key factors to consider for practical appliance:
• The high school administrators are already using the Lectio web admini-strative system, and would be able to experiment with this without making a major new purchase.
Metaheuristics for High School Planning
DORS prisen for 2008/2009 gik til Sune Binzer og Sune Høj Kjeldsen fra DTU Management for deres speciale »Metaheuristics for High School Planning«. Redaktionen ønsker de to kandidater og deres vejleder Thomas Stidsen tillykke og er glade for her at kunne bringe et sammendrag af specialet.
By Sune Binzer
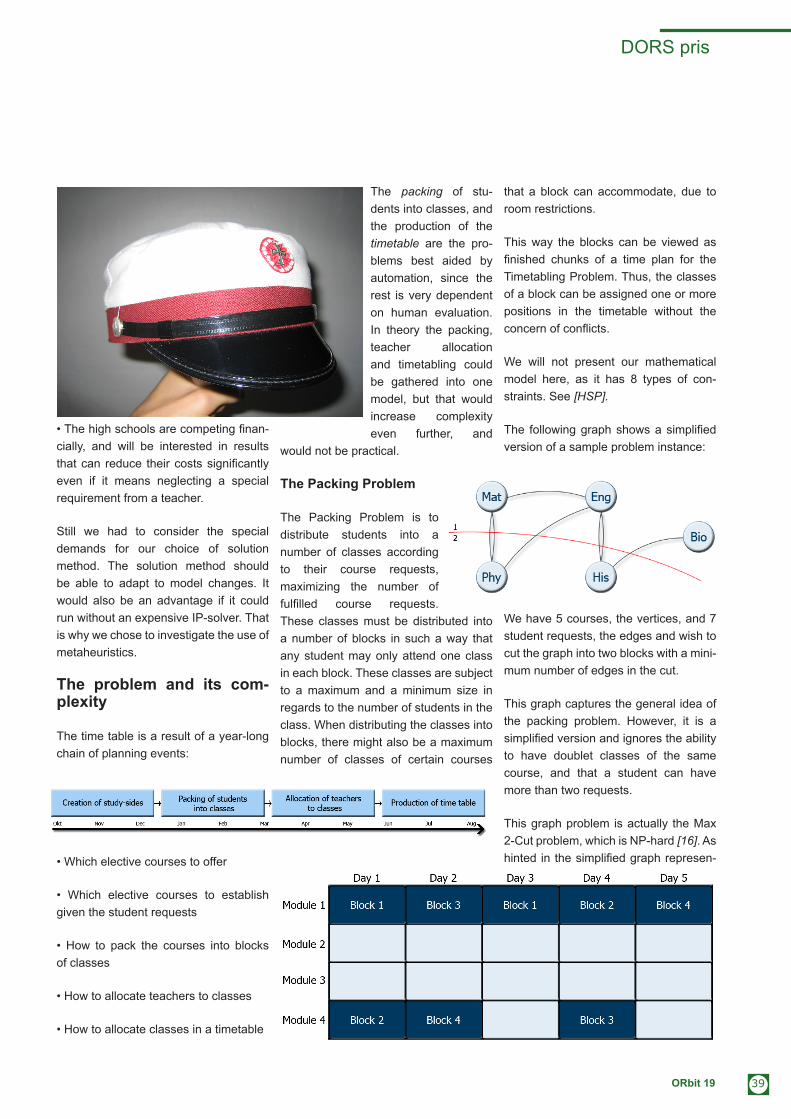
39 ORbit 19
DORS pris
• The high schools are competing finan-cially, and will be interested in results that can reduce their costs significantly even if it means neglecting a special requirement from a teacher.
Still we had to consider the special demands for our choice of solution method. The solution method should be able to adapt to model changes. It would also be an advantage if it could run without an expensive IP-solver. That is why we chose to investigate the use of metaheuristics.
The problem and its com-plexity
The time table is a result of a year-long chain of planning events:
• Which elective courses to offer
• Which elective courses to establish given the student requests
• How to pack the courses into blocks of classes
• How to allocate teachers to classes
• How to allocate classes in a timetable
The packing of stu-dents into classes, and the production of the timetable are the pro-blems best aided by automation, since the rest is very dependent on human evaluation. In theory the packing, teacher allocation and timetabling could be gathered into one model, but that would increase complexity even further, and
would not be practical.
The Packing Problem
The Packing Problem is to distribute students into a number of classes according to their course requests, maximizing the number of fulfilled course requests. These classes must be distributed into a number of blocks in such a way that any student may only attend one class in each block. These classes are subject to a maximum and a minimum size in regards to the number of students in the class. When distributing the classes into blocks, there might also be a maximum number of classes of certain courses
that a block can accommodate, due to room restrictions.
This way the blocks can be viewed as finished chunks of a time plan for the Timetabling Problem. Thus, the classes of a block can be assigned one or more positions in the timetable without the concern of conflicts.
We will not present our mathematical model here, as it has 8 types of con-straints. See [HSP].
The following graph shows a simplified version of a sample problem instance:
We have 5 courses, the vertices, and 7 student requests, the edges and wish to cut the graph into two blocks with a mini-mum number of edges in the cut.
This graph captures the general idea of the packing problem. However, it is a simplified version and ignores the ability to have doublet classes of the same course, and that a student can have more than two requests.
This graph problem is actually the Max 2-Cut problem, which is NP-hard [16]. As hinted in the simplified graph represen-

40 ORbit 19
DORS pris
tation of the packing problem, it is pos-sible to polynomially reduce the the Max K-Cut problem to the Packing Problem and prove it is also NP-hard [HSP].
Timetabling
The following is a general definition of timetabling:
The problem of allocating a set of events or tasks, each requiring a set of resour-ces, in time and space, subject to a number of constraints.
This definition captures the essence of timetabling, but of course there are numerous variants of the problem with additional constraints and types of objective functions. We have encounte-red several variants of timetabling in the literature. Most of them differ by the organization of the institutions; School, University, Hospital etc. For educational timetabling the most common problems are University Timetabling, Exam Time-tabling and School Timetabling.
The Danish high school timetabling is somewhat unique, lying somewhere between School and University Course Timetabling.
In our model, we assume a given set of time slot positions, p, rooms, o, and classes, c, with predefined resources, r, which are a combination of teachers, t, and students, s. Although rooms, students and students could all be con-sidered resources, they have different constraints and must be segregated.
We divide our constraints into the fol-lowing groups:
• Allocation and exclusion constraints. Classes must be allocated into exactly one room and position.
• Edge constraints. Classes that share a
resource or room cannot be allocated to the same position.
• Order constraints. Some classes must followed by another class, or have a class in parallel.
• Class-spread constraints. Some clas-ses must be on different days.
• Soft constraints \ Objective function:
• The cost of having class c in position p and room o. Students and teachers should not wait between classes.
• Teachers should work for a maximum number of days in the time table.
• Teachers should work a maximum number of classes each day.
• and more teacher related constraints.
The edge constraints are named such, because they may be represented as a similar graph problem, given the classes as the vertices, and the class resource conflicts as the edges. The following figure shows a sample graph in which the class vertices are coloured such that all vertices of the same colour may be in the same position.
A coloring of the graph can solve the edge constraints, and in fact, in some research, graph coloring algorithms have been tweaked to solve timetabling
constraints, e.g. to include room alloca-tion. We are able to use the graph colo-ring problem to show that our timetabling problem is NP-hard [HSP].
This gives an idea of the nature and complexity of the problem. Unfortuna-tely, the problem is even more complex as stated earlier, and we have to include the Order and Spread constraints and the many soft constraints, to have any chance of applying solutions to this pro-blem in practice.
Solution methods
The Packing Problem
In our thesis we briefly look at decom-position schemes and algorithms for similar problems, such as the Max K-Cut and The Chromatic Number of a graph. They do not solve the complete Packing Problem, would be hard to tweak to change in requirements, and more dif-ficult to apply in practice since it would require an IP-solver. However, the use of these could be further researched.
We have investigated two metaheu-ristics: GRASP (Greedy Randomized Adaptive Search Procedure) and Tabu Search.
The GRASP metaheuristic is likely to provide good solutions for this problem, since experiments showed that a greedy algorithm gave good initial results. The greedy construction of a solution:
1. Create elective course classes up to the maximum number of classes by greedily choosing the course subject that has the largest average class quo-tient.
2. Distribute student groups (students that have chosen same subjects) to classes minimizing conflicts between classes.
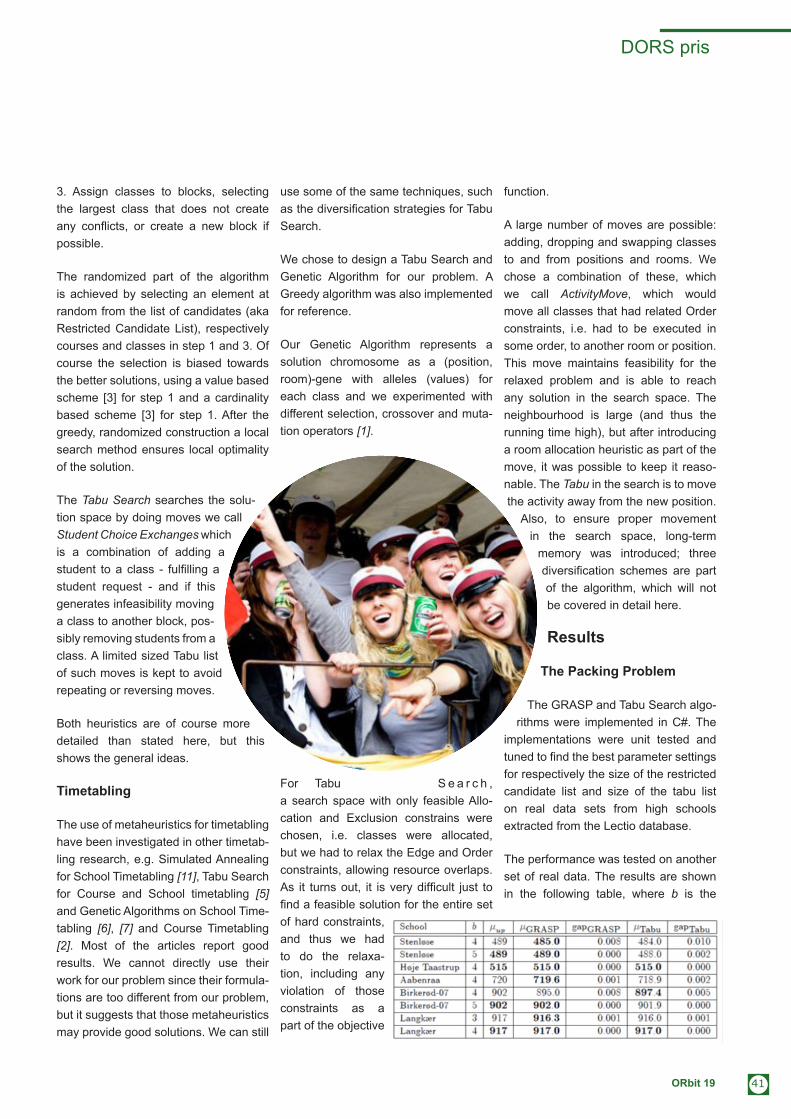
41 ORbit 19
DORS pris
3. Assign classes to blocks, selecting the largest class that does not create any conflicts, or create a new block if possible.
The randomized part of the algorithm is achieved by selecting an element at random from the list of candidates (aka Restricted Candidate List), respectively courses and classes in step 1 and 3. Of course the selection is biased towards the better solutions, using a value based scheme [3] for step 1 and a cardinality based scheme [3] for step 1. After the greedy, randomized construction a local search method ensures local optimality of the solution.
The Tabu Search searches the solu-tion space by doing moves we call Student Choice Exchanges which is a combination of adding a student to a class - fulfilling a student request - and if this generates infeasibility moving a class to another block, pos-sibly removing students from a class. A limited sized Tabu list of such moves is kept to avoid repeating or reversing moves.
Both heuristics are of course more detailed than stated here, but this shows the general ideas.
Timetabling
The use of metaheuristics for timetabling have been investigated in other timetab-ling research, e.g. Simulated Annealing for School Timetabling [11], Tabu Search for Course and School timetabling [5] and Genetic Algorithms on School Time-tabling [6], [7] and Course Timetabling [2]. Most of the articles report good results. We cannot directly use their work for our problem since their formula-tions are too different from our problem, but it suggests that those metaheuristics may provide good solutions. We can still
use some of the same techniques, such as the diversification strategies for Tabu Search.
We chose to design a Tabu Search and Genetic Algorithm for our problem. A Greedy algorithm was also implemented for reference.
Our Genetic Algorithm represents a solution chromosome as a (position, room)-gene with alleles (values) for each class and we experimented with different selection, crossover and muta-tion operators [1].
For Tabu S e a r c h , a search space with only feasible Allo-cation and Exclusion constrains were chosen, i.e. classes were allocated, but we had to relax the Edge and Order constraints, allowing resource overlaps. As it turns out, it is very difficult just to find a feasible solution for the entire set of hard constraints, and thus we had to do the relaxa-tion, including any violation of those constraints as a part of the objective
function.
A large number of moves are possible: adding, dropping and swapping classes to and from positions and rooms. We chose a combination of these, which we call ActivityMove, which would move all classes that had related Order constraints, i.e. had to be executed in some order, to another room or position. This move maintains feasibility for the relaxed problem and is able to reach any solution in the search space. The neighbourhood is large (and thus the running time high), but after introducing a room allocation heuristic as part of the move, it was possible to keep it reaso-nable. The Tabu in the search is to move the activity away from the new position.
Also, to ensure proper movement in the search space, long-term
memory was introduced; three diversification schemes are part of the algorithm, which will not be covered in detail here.
Results
The Packing Problem
The GRASP and Tabu Search algo-rithms were implemented in C#. The
implementations were unit tested and tuned to find the best parameter settings for respectively the size of the restricted candidate list and size of the tabu list on real data sets from high schools extracted from the Lectio database.
The performance was tested on another set of real data. The results are shown in the following table, where b is the

42 ORbit 19
DORS pris
An immediate observation from the results is that the only feasible timetable found is with Tabu Search for the Bornholm data set. It is not necessarily a bad result that such few feasi-ble solutions are found. The data was sampled from timetab-les which contained hundreds of violations. We had to tweak the data so that the current timetables were feasible and thus at least one feasible timetable existed for the problem. This does not mean that infeasibility should be tolerated, but that in practice, a human scheduler has more liberty to relax some of the hard constraint. E.g. assuming that the 2 violations of hard constraints in the Allerød data were two room clashes, which is effectively just one room clash. Then one of the classes that were allocated to that room could in practice probably use a room normally not be suited for that class, although the use of that particular room would be considered ‘infeasible’ accor-ding to the problem definition.
To summarize, Tabu Search seems to provide viable timetab-les for the given problems, and the other algorithms do not.
We will take a closer look at the values for two of the major soft constraints. The following table shows the average wai-ting hour per teacher, SWt, and student, SWs, for the real time-tables, μup,, and for a sample Tabu Search solution, Tabu μ.
As an example, in the given timetable of Bornholm High School, a teacher waits in average for 0.65 modules and a student waits in average 0.12 modules. For the same school, Tabu Search produces a timetable with an average of 0.13 waiting modules for teachers and 0.28 waiting modules for students in average. We used a penalty of 10 for a student waiting modules and 1 for teacher. Clearly, these weights of these soft constraints would be different for both Bornholm and Allerød, and it is likely to be different for every school. The point is that the results are not that far from the given timetables and the setting of the weights can be adjusted for every school.
Conclusion
Our experiments showed that the solution methods imple-mented for the Packing Problem - Tabu Search and GRASP - provided comparable results. For an average school, any of
number of blocks, μ the mean solution values and gap the gap to a simple dual bound. The average running times were all within 70 seconds.
Most schools do their Packing with four to five blocks, using the minimum number of classes, and produce solutions with a gap less than a few per mille to the dual bound. A solution to a problem instance with b = 4 where all student requests are granted, is widely regarded as a very good result. From the table above, such solutions are found for Høje Taastrup, Aabenraa and Langkær. For Stenløse and Birkerød for four blocks, the gap is about one percent which could very well be acceptable in practice. This gap is still small and could be due to a gap from the true optimal solution value to the found dual bound, since it is not a tight bound for all instances.
The number of blocks is important in connection with the Timetabling Problem. It can be directly translated into a number of positions in the timetable. If fewer blocks are used, then the probability of finding a feasible solution to the Time-tabling Problem is increased.
Timetabling
The Tabu Search and Genetic Algorithm were implemented in C# and tested. The Tabu Search implementation was tuned to find the size of the tabu list and the activation start of the diversifications. The Genetic Algorithm was tuned to find a good setting of the many parameters of a genetic algorithm, including which operators performed best.
The following table shows the mean, µ, the deviation, σ, the number of violations of the relaxed hard constraints, such as student conflicts and day conflicts between classes, for the Greedy Algorithm, Tabu Search and Genetic Algorithm.
It is no surprise that the best results were found for Bornholm. It has few classes and a low density, i.e. few conflicts bet-ween classes compared to both Allerød and Birkerød. If we compare the results of the algorithms, Tabu Search clearly outperforms both the Genetic and Greedy Algorithm. If we include the deviation of the results, Tabu Search is still better in the worst cases. Only for Bornholm the results are even close. We never did expect the greedy algorithm to provide good results.

43 ORbit 19
DORS pris
these methods should produce useful results. For the most difficult problem instances the Tabu Search performed slightly better than the GRASP and the running time was generally better. For these reasons we recommend the Tabu Search algorithm. All the experiments were performed on real data, and for almost every data set an optimal solution was found, or a solution with a gap of less than 0.1 percent to the given bound was found.
The solution methods implemented for the Timetabling Pro-blem - Tabu Search and Genetic Algorithm - provided results which were quite far apart. The Tabu Search clearly outper-formed the Genetic Algorithm in respect to both running time and solution value. Due to the popular research of genetic algorithms for timetabling, we had higher hopes for the GA, but it did not manage to provide reasonable results. Genetic algorithms are likely better suited for problems with an easier representation of a feasible solution.
The performance of the Tabu Search matched our expecta-tions to a solution method for this problem. From the sche-dulers we have interviewed, we have learned that finding a feasible timetable is a long iterative process. The Tabu Search algorithm was able to find solutions that were either feasible or very close to being feasible for all the tested data sets. Although the tests were performed on real data, the data was not sufficiently well-formed to label it as completely rea-listic. Also, a theoretically optimal solution is not necessarily the best solution in practice. Thus, when using the solution methods as tools, a number of iterations of adjusting the pro-blem and running the problem solver are inevitable. The best practical solutions are found this way. The running times of the implemented solutions should allow for a number of such iterations.
As expected, the use of the algorithms in the timetabling tools in Lectio required tweaking and was used primarily as a method to establish a starting solution and do local searchs in an iterative manner.
Futher Research
In 2010 DTU Management students Simon Kristiansen and Matias Sørensen researched the performance of exact solution methods on the Packing Problem [4], using Branch-and-Price w. Dantzig-Wolfe decomposition. Following that, they started a PhD in conjunction with Macom to research both problems further, using both exact solution methods and meta-heuristics.
Their article [3] shows that in some real instances of the Pack-ing Problem for Danish High Schools, their BnP algorithm found optimal solutions within an hour that improved solutions found by our Tabu Search heuristic. Any improvement could result in a large economical gain for the high schools. Howe-ver, it also proved, that in most cases our heuristic found opti-mal solutions. Of course the BnP requires a MIP solver which Lection does not yet have.
In a recent interview with S. Kristansen and M. Sørensen I learned that in recent years more and more Danish high schools started using the planning tools of the Lectio ‘Time-fag’ module and most have been happy with the results. In March 2012 Simon and Mathias implemented new ALNS heuristics (Adaptive Large Neighbourhood Search) in Lectio for both packing and timetabling.
References
References are numbered as in the reference list of the thesis where applicable.
[HSP]: Our thesis. S.P. Binzer and S.H. Kjeldsen, 2008, Metaheuri-stics for High School Planning.[1] E.K. Burke and G. Kendal, 2005, Search Methodologies, Springer[2] H. Fang, 1994, Genetic Algorithms in Timetabling and Schedu-ling.[3] L.F. Reis and E. Oliviera, A Language for Specifying Complete Timetabling Problems.[4] S. Kristiansen, M.Sørensen and T.R. Stidsen, Elective Course Planning, European Journal of Research. [5] G. Santos et al., An efficient Tabu Search Heuristic for the School Timetabling Problem.[6] G. Beligiannis et. al, 2006, Applying evolutionary computation to the school timetabling problem: The Greek Case, ScienceDirect.[7] C. Fernandez and M. Santos, 2003, A Non-standard Genetic Algo-rithm Approach to Solve Constrained School Timetabling Problems.[11] P. Dige and C. Lund, 1991, Skemalægning ved simuleret udglød-ning, IMSOR.
Sune Binzer
er konsulent hos Logis A/S der specialiserer sig i optimering og software til logistik og indkøb. Logis leverer bl.a.planlægnings- og disponeringssystemer til akut og planlagt ambulancekørsel i flere regioner i Danmark og udlandet.
