5 things every belt should learn - smartersolutions.com
TRANSCRIPT
5 Things
Every
Lean Six Sigma Belt
Should Learn
In Their Training
Forrest W. Breyfogle III [email protected]
Smarter Solutions, Inc. www.SmarterSolutions.com

Five Things Every Lean Six Sigma Belt Should Learn In Their Training
© Smarter Solutions, Inc. 2 www.SmarterSolutions.com
Lean Six Sigma training can impact how one looks at data and how an organization makes
improvements. However, there are differences between what is taught in various Lean Six Sigma
training offerings. Lean Six Sigma trainees benefit when the following are addressed in their training:
1. Recognizing how to baseline all processes When undertaking process improvement efforts, it is important to know how the process is performing
before making any process alterations. If a process baseline is not established, how will one be able to
know if there has been an improvement after completing any Lean Six Sigma project or kaizen event?
We find that most Lean Six Sigma students have been taught to baseline their processes as part of the
define or measure phases in a Lean Six Sigma Define-Measure-Analyze-Improve-Control (DMAIC)
project-execution roadmap. Practitioners tell us that they often skip this step because existing data
appear to be out-of-control or not in a form that is easily charted.
Typical Lean Six Sigma training involves Statistical Process Control (SPC) charting along with process
capability statements. With this instruction, the student is taught to test for process stability, and if the
process is stable, one is to report how the process is performing. For processes that have a continuous
response, the process capability is then to be reported in process capability indices such as Cp, Cpk, Pp,
and Ppk.
However, this approach can have issues that lead many students to skipping this step. For one thing,
process capability indices can be difficult to understand and explain to others. In addition, process
capability indices can be dependent upon how one selects to sample from the process. The other thing
that often occurs with process-metric reporting is that an x-bar and R chart, along with a p-chart, c-
chart, or u-chart, indicates that the process is not stable, when stability actually exists. Unlike an
individuals control chart, common SPC charts such as X-bar and R charts, p-charts, c-charts, and u-charts
do not consider variability between subgroups as a source of common-cause variability.
This charting difference is a big deal when establishing a process baseline, since between-subgroup
variability is typically a source of common-cause variability. The reason for making this statement is that
with baselining we are not really trying to ″control″ a process’ between-subgroup variability, which is a
primary objective for using x-bar and R charts, p-charts, c-charts, and u-charts.
An approach to overcome this traditional control-charting shortcoming is 30,000-foot-level reporting.
This approach to baseline reporting considers between-subgroup variability as a source of common-
cause variability. For a given process, an x-bar and R chart that shows an out-of-control condition

Five Things Every Lean Six Sigma Belt Should Learn In Their Training
© Smarter Solutions, Inc. 3 www.SmarterSolutions.com
because of between-subgroup variability often indicates stability with a 30,000-foot-level reporting
format. If the process is now reported as stable using a 30,000-foot-level reporting approach, a process
capability statement can legitimately be made. For a more lengthy discussion on this topic, see the “X-
bar and R Control Chart: Issues and Resolution” article, which is referenced below.
Another important aspect of 30,000-foot-level reporting is rather than a report using process capability
indices, which can be a function of the procedure for sampling a process, the estimated percent non-
conformance is reported, when the process is stable, in a format that can easily be understood.
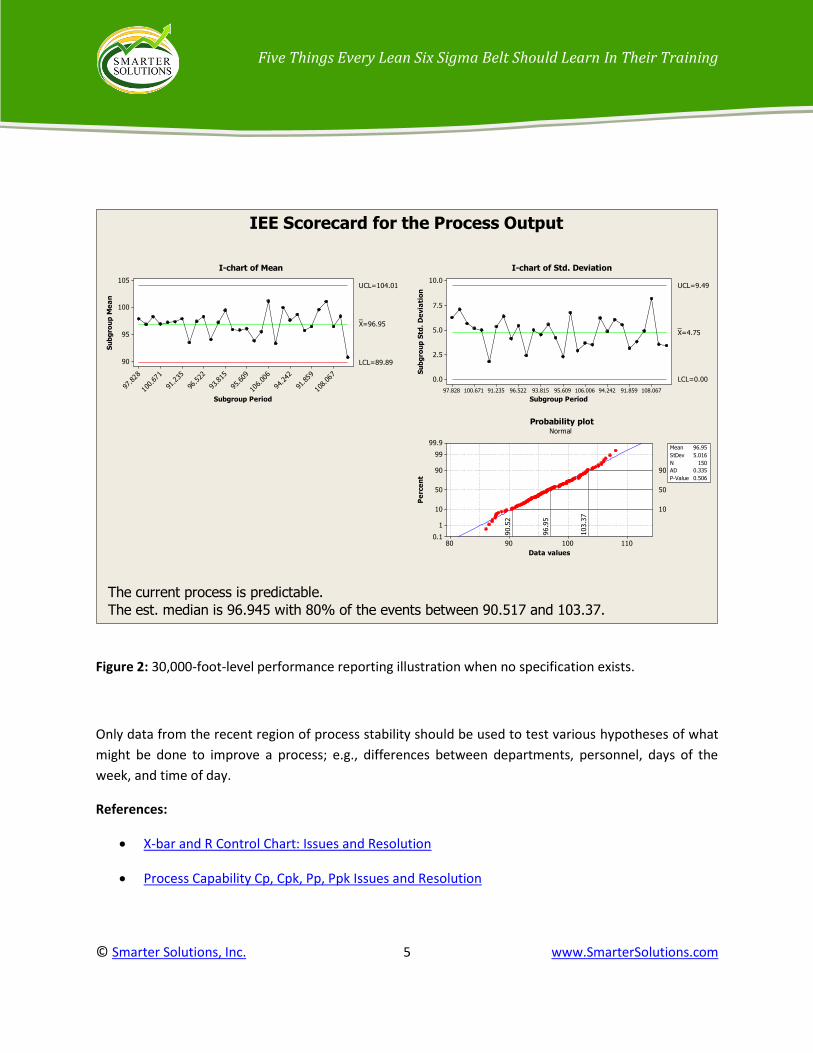
With 30,000-foot-level reporting, regions of process stability can be determined. When there is a recent
region of stability, one can state that the process is predictable. With this form of reporting, if the
process has a specification, then an estimated non-conformance rate can be reported, as illustrated in
Figure 1 where there are specification limits of 80 – 100. If there is no specification (e.g., lead time,
inventory, cycle time, and profit margins), then a median response can be reported with 80% frequency
of occurrence, as illustrated in Figure 2.

Five Things Every Lean Six Sigma Belt Should Learn In Their Training
© Smarter Solutions, Inc. 4 www.SmarterSolutions.com
Figure 1: 30,000-foot-level performance reporting illustration when a specification exists.
IEE Scorecard for the Process Output
The process is predictable.
The estimated non-conformance rate is 27.163%.
1101009080
99
90
50
10
1
0.01
Data values
Pe
rce
nt
0.03680
72.873
100
Mean 96.95
StDev 5.016
N 150
AD 0.335
P-Value 0.506
108.06
7
91.859
94.242
106.00
6
95.6
09
93.815
96.522
91.235
100.67
1
97.828
105
100
95
90
Subgroup Period
Su
bg
rou
p M
ea
n
_X=96.95
UCL=104.01
LCL=89.89
108.06791.85994.242106.00695.60993.81596.52291.235100.67197.828
10.0
7.5
5.0
2.5
0.0
Subgroup Period
Su
bg
rou
p S
td.
De
via
tio
n
_X=4.75
UCL=9.49
LCL=0.00
Probability plotNormal
I-chart of Mean I-chart of Std. Deviation
Five Things Every Lean Six Sigma Belt Should Learn In Their Training
© Smarter Solutions, Inc. 5 www.SmarterSolutions.com
Figure 2: 30,000-foot-level performance reporting illustration when no specification exists.
Only data from the recent region of process stability should be used to test various hypotheses of what
might be done to improve a process; e.g., differences between departments, personnel, days of the
week, and time of day.
References:
X-bar and R Control Chart: Issues and Resolution
Process Capability Cp, Cpk, Pp, Ppk Issues and Resolution
IEE Scorecard for the Process Output
The current process is predictable.
The est. median is 96.945 with 80% of the events between 90.517 and 103.37.
1101009080
99.9
99
90
50
10
1
0.1
Data values
Pe
rce
nt
103.3
7
90
96.9
5
50
90.5
210
Mean 96.95
StDev 5.016
N 150
AD 0.335
P-Value 0.506
108.06
7
91.859
94.242
106.00
6
95.6
09
93.815
96.522
91.235
100.67
1
97.828
105
100
95
90
Subgroup Period
Su
bg
rou
p M
ea
n
_X=96.95
UCL=104.01
LCL=89.89
108.06791.85994.242106.00695.60993.81596.52291.235100.67197.828
10.0
7.5
5.0
2.5
0.0
Subgroup Period
Su
bg
rou
p S
td.
De
via
tio
n
_X=4.75
UCL=9.49
LCL=0.00
Probability plotNormal
I-chart of Mean I-chart of Std. Deviation

Five Things Every Lean Six Sigma Belt Should Learn In Their Training
© Smarter Solutions, Inc. 6 www.SmarterSolutions.com
“30,000-foot-level Performance Metric Reporting,” Forrest W. Breyfogle III, Six Sigma Forum
Magazine, February 2014, pages 18—32.
Chapters 12 and 13: Integrated Enterprise Excellence, Volume III: Improvement Project
Execution, Forrest W. Breyfogle III, Citius Publishing, 2008.
2. Demonstrating the value of an improvement
Too often, students of Lean Six Sigma will see the benefits of a process improvement project as being so
obvious that they do not even attempt to measure the impact. However, for all projects, we should
statistically validate the change and estimate the amount of improvement. This can be done using a
simple two-sample t-test or a test of two proportions. The new performance could be demonstrated
using a control chart or even a time series plot to describe a change, but it is only with a hypothesis test
that you demonstrate whether the impact is significant and that the observed change is not the result of
a random period of good performance.
But too often, organizations might execute a kaizen event or some other total quality management
(TQM) improvement effort without the result of these efforts being reported with a true statistical
analysis. You may just see a report written with testimonials of the effort’s benefit. With all of the tools
we have been taught, why do many improvements finish with a qualitative assessment of the benefit
rather than a quantitative measure?
The best practices would be to monitor the process response over time to ensure that the improved
process performance remains at its improved level with a proper process control chart, such as the
30,000-foot-level method described above. When stability is observed, then a hypothesis test should be
performed to estimate the significance of the change. When I see a business improvement project avoid
these two steps, as a manager, I question if the improvement only feels good and does not actually
improve performance.
Figure 3’s response after a change could be compared to Figure 1’s response to visually represent the
change along with recognition that the new process performance is consistent and predictable. This
predictability assessment would allow a new capability assessment to be estimated and a hypothesis
test to be completed to show the significance of the change.

Five Things Every Lean Six Sigma Belt Should Learn In Their Training
© Smarter Solutions, Inc. 7 www.SmarterSolutions.com
Figure 3: Utilizing a 30,000-foot-level performance reporting to describe the impact of a process
improvement.
Reference:
Chapter 37: Integrated Enterprise Excellence, Volume III: Improvement Project Execution, Forrest W.
Breyfogle III, Citius Publishing, 2008
IEE Scorecard for the Process Output
The process is predictable.
The estimated non-conformance rate is 4.6457%.
10095908580
99
90
50
10
1
0.1
Data values in current stage
Pe
rce
nt
0.13480
95.488
100
Mean 92.79
StDev 4.258
N 50
AD 0.224
P-Value 0.816
37332925211713951
105
100
95
90
85
Subgroup Period
Su
bg
rou
p M
ea
n
_X=92.79
UCL=101.91
LCL=83.67
Before Change After Change
37332925211713951
10.0
7.5
5.0
2.5
0.0
Subgroup PeriodS
ub
gro
up
Std
. D
evia
tio
n
_X=3.83
UCL=8.81
LCL=-1.14
Before Change After Change
Probability plotNormal
I-chart of Mean I-chart of Std. Deviation

Five Things Every Lean Six Sigma Belt Should Learn In Their Training
© Smarter Solutions, Inc. 8 www.SmarterSolutions.com
3. Knowing how your project impacts the enterprise In Lean Six Sigma deployments improvement projects to undertake are often determined from a list of
projects that executives or others have determined could be beneficial. Or, someone might be starting
to undertake Lean Six Sigma training next week and a project needs to be found for his/her training.
I am sure you have seen many improvement projects about which no one seems to care if they are
completed successfully. Some organizations will allow non-important projects to be used for a training
project, but I consider it irresponsible to allow a business to execute an improvement effort that will not
provide a measurable impact on the enterprise. If an organization is going to assign resources to solve a
problem, there should be a management expectation that the cost of the effort is recovered at the
enterprise level.
Our preferred way to ensure that every improvement project is linked to an enterprise gain uses a form
of a fault-tree or a decision-tree diagram. In the Integrated Enterprise Excellence (IEE) Lean Six Sigma
system, we call this the Enterprise Improvement Plan (EIP), as illustrated in figure 4. This EIP diagram
demonstrates a clear linkage between the existing organizational goals and strategies to all
improvement effort, even non-six-sigma efforts. Using this tool to derive the needed improvement
efforts from the acknowledged business goals and aligned strategies leads to a unique condition where
the business measurement improvement needs “pulls” for improvement projects to meet these goals,
rather than the common situation where the improvement teams hunt for projects to work.

Five Things Every Lean Six Sigma Belt Should Learn In Their Training
© Smarter Solutions, Inc. 9 www.SmarterSolutions.com
Figure 4: An Enterprise Improvement Plan (EIP)
References:
Project Selection with Whole-enterprise Benefit
Chapter 12: Integrated Enterprise Excellence, Volume II: Business Deployment, Forrest W.
Breyfogle III, Citius Publishing, 2008.

Five Things Every Lean Six Sigma Belt Should Learn In Their Training
© Smarter Solutions, Inc. 10 www.SmarterSolutions.com
Figure 9.3: The Business Process Management Guidebook: An Integrated Enterprise Excellence
BPM System, Forrest W. Breyfogle III, Citius Publishing, 2013.
4. Using Design of Experiments (DOE) outside manufacturing
Design of Experiments (DOE) examples in Lean Six Sigma training typically involve processes with easily
measurable outputs and nicely controllable inputs which might be encountered in a manufacturing
environment. These examples allow the trainee to learn the mechanics of DOE, but he/she will not
learn the full power of the tools.
There are DOE uses that benefit data collection efforts. One simple use is to create a data collection
plan for a project that includes the potential causes as two-level factors. Each DOE observation
becomes a targeted data collection event. To accomplish this, one could modify operations to create
the set of conditions needed in the experiment or even adjust the work sequence in order to create the
experimental levels. With a fractional-factorial DOE, one could gain valuable insight about the effects of
up to 15 two-level factors in only 16 trials.
Another great use is what we call a historical DOE. The use of this technique is valuable when there is a
very large database to analyze and one wishes to simplify the analysis. One would create this DOE as in
the previous example and then utilize a data-base administrator to submit SQL queries that pull data
from the large data base that match the planned DOE observations.
The most common missing DOE concept in Lean Six Sigma training is that a DOE can be set up for
assessing an attribute or even a reliability response. Traditional DOE requires a continuous response,
but with a good understanding of DOE, the practitioner will find that he/she can use the DOE to define
the data collection and then analyze the data with any tool, such as logistic regression (for attribute
responses) and life regression (for reliability-type-censored data). He/she can even analyze the DOE
data with regression or ANOVA if desired.
References:
Data Collection Tools: Surveys, Infrequent Sampling, Design of Experiments (DOE)
Minimum Sample Size, is it relevant?
Chapters 29 – 34: Integrated Enterprise Excellence, Volume III: Improvement Project Execution,
Forrest W. Breyfogle III, Citius Publishing, 2008.

Five Things Every Lean Six Sigma Belt Should Learn In Their Training
© Smarter Solutions, Inc. 11 www.SmarterSolutions.com
5. Implementing a change against resistance Having a good answer is not significant to drive change. Too many good improvements have been
missed because the Lean Six Sigma belt could not sell the change to the organization. There are many
common reasons for this to occur that involve organizational resistance to change. This organizational
resistance develops when individuals believe that the risk or additional effort to implement the change
exceeds the benefits of the change. One should note that this statement deals with individuals, not the
entire organization, because the former is where resistance occurs.
Many Lean Six Sigma programs will rush their students through the improve phase talking primarily
about testing and design of experiments with an assumption that the organization will accept the
change. This is not beneficial to the students. In the early days of Six Sigma, before the GE roll-out, Six
Sigma Black Belts were to pick up their analysis and project management skills on their own, but they
were all required to take a one-week course in change management because that was recognized as the
weakest part of the Six Sigma model. It is too bad that many Lean Six Sigma programs have forgotten
this lesson.
Smarter Solutions recognizes that without focusing the students on change achievement, many students
will become frustrated and not achieve their goals. We believe that change needs to have a
demonstrated business significance that also has an emotional impact. We believe that every Lean Six
Sigma student should learn a traditional change management model. Kotter provides one of the best
models for the resistance to change. Kotter lists the following eight steps for change:
1. Establishing a sense of urgency
2. Forming a powerful guiding coalition
3. Creating a vision
4. Communicating the vision
5. Empowering others to act on the vision
6. Planning for and creating short-term wins
7. Consolidating improvements and producing still more change
8. Institutionalizing new approaches
By following these eight steps, nearly every Lean Six Sigma student can successfully implement changes.
In our Master Black Belt courses, we go even further to address the adoption of business changes
through the introduction of advocacy selling techniques, as described in John Daly’s book, Advocacy.

Five Things Every Lean Six Sigma Belt Should Learn In Their Training
© Smarter Solutions, Inc. 12 www.SmarterSolutions.com
We also find that there is not enough emphasis given in training on the use of pilot testing to assess the
impact of proposed changes.
References:
Leading Change, John P. Kotter, Harvard Business Review Press, 2012.
Advocacy: Championing Ideas and Influencing Others, John A. Daly, Yale University Press, 2011.
Summary Taking Lean Six Sigma training or obtaining certification as a Lean Six Sigma belt is not sufficient to be a
successful practitioner. Being able to effectively apply the above five topics will allow every trained Lean
Six Sigma practitioner to be successful not only in their improvement projects but also in other areas of
their job:
1. Baselining skills can be used at any time you want to understand how a process is performing.
2. Understanding how to demonstrate a change is a key tool to show the benefit from an
improvement. You may also find this skill valuable to evaluate changes that were not successful
in allowing the improvement effort to be implemented immediately, limiting the gains from the
process enhancement efforts.
3. Using the EIP to link an improvement project to the business goals and strategies may allow the
practitioner to gain more support to complete his/her projects, but it also may help him/her
understand what the business goals and strategies are intended to accomplish, which may lead
to a better selection of projects.
4. Using Design of Experiments concepts for data collection and to limit the size of existing data
sets may prove to be more valuable than traditional DOE uses.
5. Adoption of the Kotter 8-steps to manage change for Lean Six Sigma projects can expedite the
effectiveness of the improve phase. In addition, these steps can be useful in every type of
change environment, which could lead to the practitioner’s becoming a hero in his/her business.
Becoming proficient in the five areas that have been described will make the student not only a
better belt but also a better employee.

Five Things Every Lean Six Sigma Belt Should Learn In Their Training
© Smarter Solutions, Inc. 13 www.SmarterSolutions.com
References:
Lean Six Sigma Books: Project Execution Guide, Forrest W. Breyfogle III, Citius Publishing, 2010.
The Integrated Enterprise Excellence System: An Enhanced, Unified Approach to Balanced
Scorecards, Strategic Planning, and Business Improvement, Forrest W. Breyfogle III, Citius
Publishing, 2008.
About the Author In a professional career spanning over a quarter century, Forrest Breyfogle has
established himself as a leading edge thinker, a prolific author, an innovative consultant,
a world-class educator, and a successful business executive. He has authored or co-
authored over a dozen books. He recently published his fourteenth book, The Business
Process Management Guidebook: An Integrated Enterprise Excellence BPM System where
Breyfogle presents an executable method for managing and benefiting the bottom-line
of business. This methodology was introduced in the five-book set, Integrated Enterprise Excellence that
provides radical management advancements in the utilization and integration of scorecards, strategic
planning, and process improvement. Mr. Breyfogle was named Quality Professional of the Year for 2011
by Quality Magazine. He also received the prestigious Crosby Medal from the American Society for
Quality (ASQ) in 2004 for an earlier book, Implementing Six Sigma, 2nd ed. Forrest is currently located in
Austin, Texas where he founded Smarter Solutions, Inc. in 1992.
Connect with Forrest on LinkedIn, Twitter and Google+
For more free resources by Forrest Breyfogle, join the Online Resource Library today.