5 regional coordination meeting amman jordan, 2013 · 5th regional coordination meeting amman –...
TRANSCRIPT

5th Regional Coordination Meeting Amman – Jordan, 2013
Water Management Strategies and Impacts on Livelihoods in
(LEBANON) Randa MASSAAD & Ihab JOMAA
INSERT COUNTRY MAP SHOWING LOCATION OF
BENCHMARK SITE
Watershed location
1384 km2
El Qaa Village

El Qaa village FTF Indicator: Number of hectares under improved technologies or management practices as a result of USG assistance: (300 ha)
Benchmark site (17,000 ha) 36˚ 28’ 48” 34 ˚ 20’ 31”
Pilot area(s) for data collection(17,000 ha)
Cadastral Limit of El Qaa village
Target population 60 villages/Orontes Watershed
Benchmark = El Qaa village population 900 households 12000 total inhabitants 45 % adult male 55% adult female

WLI Goal and Intended Outputs
Please insert a picture that represents your work
Overall Goal: to improve the livelihoods of rural households and communities in areas where water scarcity, land degradation, and associated problems are prevalent. Intended Outputs: 1. Integrated water and land-use strategies for policy-making, tools for sustainable benchmark management and organizational mechanisms for community inclusion at the benchmark site. 2. Enhanced knowledge, skills and qualifications for key stakeholders in the benchmark sites. 3. Improved rural livelihoods of farmers in the benchmark sites through the adoption of sustainable land and water management practices and livelihood strategies. National water strategy in Lebanon:
Strategic objectives for the Lebanese water Sector The vision is: "Water: A right for every citizen, a resource for the whole country"

• Water quantity and quality
• Insure proper water supply • Quantities and quality of irrigation water • Water-saving irrigation techniques
• Wastewater collection and treatment
The MEW targets the infrastructure and the management of the water sector in Lebanon
Infrastructure
Management of water sector in Lebanon
1- Institutional and Organizational
2- Financial
3- Legal and Regulatory
4- Environmental Concerns
5- Awareness and Conservation
MoA strategy to reduce poverty - Good Agricultural Practices - Insure and distribute certified rootstocks - Subsidies some field crops - Irrigation water saving
techniques

Mechanisms for Community Inclusion
Site Advisory Group Members
National coordinator: Eng. Randa Massaad
Representative of civil society: Mr. Assaad el Tawm
Representative of the associated hub university: Dr. Hadi Jaafar
Representative of Farmer Association (FA): Mr. Assaad El Tawm
Representative of Farmer Interest Group (FIG): Basma Mattar
Representative of farmers cooperative for water management: Mr. Eid Mattar
• Please insert a picture here
Associations Benefitted (250-300 farmers at El Qa’a Village)
Farmers committee for drinking and irrigation water
President: Eid Mattar
Vice president for drinking water: Camille Chahoud
Vice president for irrigation land: Kozhaya Makhlouf
Treasurer: Mtanos Rezkallah
worker controler: Milad El Bitar
Secretary: Habib Gerges
Member: Youssef Nasrallah, Joseph Mattar, Toufic El Bitar, Wahib Wehbe, Louis Neeme, Akl Saed,Chaalan Rizk, Elias Awad, Awad Daher and Saad Aad.

Understanding Land & Water Management: System level
System Level Water Resource Availability
0
500
1000
1500
2000
2500
3000
3500
4000
March,2013
September,2013
Rass BaalbeckEl RayssiAlBejajehRass El MalEl FekhaEl WakifRass El MalIiranieyeSoughaEl Qaa2El Qaa1AinEmraadZaboudRweissZrabi/Matrifi
L/s
Cultivated area 5000 ha
Irrigated area 4600 ha
Annual Water Use
35 mm3/yr
Annual Water
50 mm3/yr
w.out impr. mgt with impr. mgt

Component1. Integrated water and land-use strategies
Activity 1. Investigation of water availability at the benchmark area, water distribution schemes analysis study
0
50
100
150
200
250
300
350
400
450
5000
7/0
1/2
…1
9/0
1/2
…2
7/0
1/2
…0
4/0
2/2
…0
9/0
2/2
…1
7/0
2/2
…2
4/0
2/2
…0
2/0
3/2
…1
6/0
3/2
…2
3/0
3/2
…1
8/0
5/2
…2
5/0
5/2
…0
1/0
6/2
…0
8/0
6/2
…1
5/0
6/2
…2
2/0
6/2
…2
9/0
6/2
…0
6/0
7/2
…1
3/0
7/2
…2
0/0
7/2
…2
7/0
7/2
…0
3/0
8/2
…1
0/0
8/2
…1
7/0
8/2
…2
4/0
8/2
…3
1/0
8/2
…0
7/0
9/2
…1
4/0
9/2
…
l/s
Source to Qaa Village
Source
Village
Difference

Najarims micro catchments
Activity2: Irrigation/rainfed (micro level harvesting water) at small scale
rainwater harvesting at farm level
Component1. Integrated water and land-use strategies

Semi-
circular
bunds

1984
130 ha
Change detection

1987
150 ha
Change detection

1992
600 ha
Change detection

2012
4000 ha
Change detection

Groundwater exploitations
Wells

Improving Land & Water Management: Pilot testing at Field-level
Development and Use of Technologies (FTF Indicators)
Technology Stage of Devt Land Area (ha) Users (m) Users (f)
Activity 1. Investigation of water availability at the benchmark area, water distribution schemes analysis study
2012-2013 Basin Level 250-300 2
Activity2: Irrigation/rainfed (micro level harvesting water) at small scale rainwater harvesting at farm level
First year 2013 Less than 1 0.5 du ≈ 400m2
(1ha=10du 1du=1000m2)
1 1
Activity 3: Conservation agriculture or no-tillage
First year 2013 Less than 1 0.5 ha ≈4000m2
1 1
Activity 4: Introducing the new variety of Cactus ( Opuntia-ficus-indica):
2012-2013 Less than 1 1du
1 -
Activity 5:Introducing a new variety of Grape Grape variety / Rootstock: Superior Seedless / 140 Ru
First Year Less than 1 - 1
Activity 5:Survey on plant pests and diseases, Integrated pest management in the El Qa'a region
two Seasons 2012-2013
25 ha 100 farmers*
-

Improving Land & Water Management: Pilot testing at Field-level
Development and Use of Technologies (FTF Indicators)
Technology Stage of Devt Land Area (ha) Users (m) Users (f)
Activity 6:Yield, water use efficiency of drip irrigated on eggplant
2012 Less than 1 - 1
Activity 7: comparison of local and imported
grapevine varieties in semi-arid region
2013 Less than 1
1 -
Activity 8: Intensive cultivation of early, late and industrial apricot varieties.
2013
Less than 1
- 1
Activity 9 NDVI and FOV temporal and spatial changes during the 21st century
2013 Basin Level - -
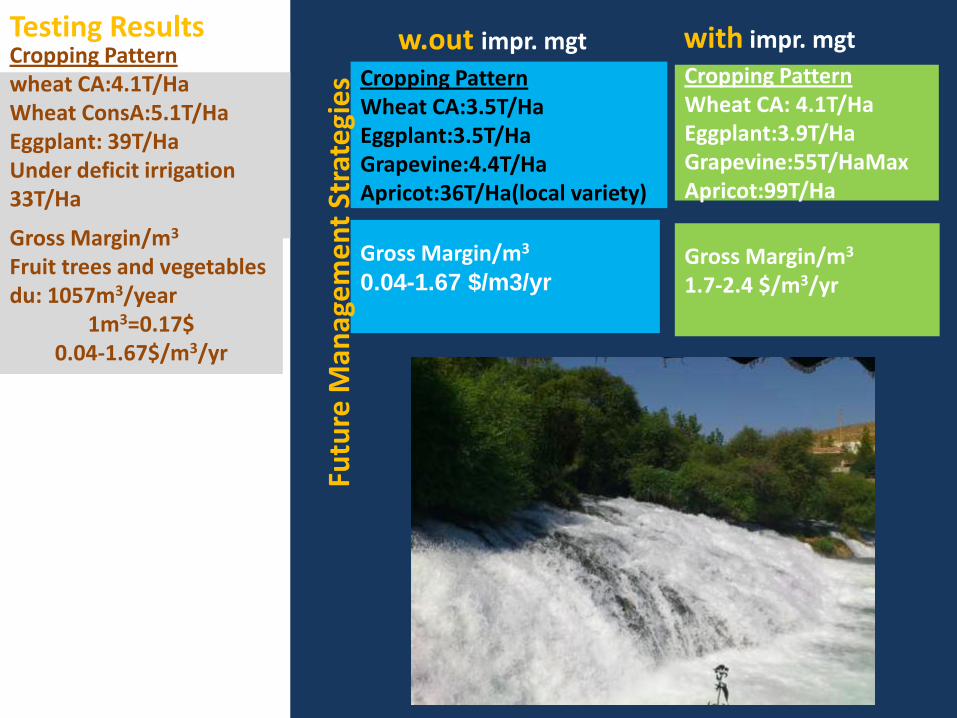
with impr. mgt Cropping Pattern wheat CA:4.1T/Ha Wheat ConsA:5.1T/Ha Eggplant: 39T/Ha Under deficit irrigation 33T/Ha Gross Margin/m3
Fruit trees and vegetables du: 1057m3/year
1m3=0.17$ 0.04-1.67$/m3/yr
Cropping Pattern Wheat CA: 4.1T/Ha Eggplant:3.9T/Ha Grapevine:55T/HaMax Apricot:99T/Ha
Gross Margin/m3
1.7-2.4 $/m3/yr
Cropping Pattern Wheat CA:3.5T/Ha Eggplant:3.5T/Ha Grapevine:4.4T/Ha Apricot:36T/Ha(local variety)
Gross Margin/m3
0.04-1.67 $/m3/yr
w.out impr. mgt
Futu
re M
anag
em
en
t St
rate
gie
s
Testing Results

Enhancing Knowledge, Skills and Qualifications
Student Research
In 2012: one student from the Lebanese University –Faculty of Agriculture, Master in Plant Protection
Preliminary survey of peach trees in El Qaa
Mostafa Chamas under the supervision of Dr.Elia Choueiri
In 2013: one student from the Lebanese University –Faculty of Agriculture,
Master in Plant Protection
Ahed Mouhi El Dine under the supervision of Dr.Elia Choueiri
Contribution to the studies of viral diseases and Integrated Pest Management on Peach in Qaa region
One student from the Lebanese University –Faculty of Agriculture
Socio-economic survey at El Qaa region.
Maher Fouany under the supervision of Dr.Salem Darwish
In Country Trainings 2012.
•Conservation Agriculture and supplement Irrigation
•New Variety of peach adopted in El Qaa
•The main pests and diseases on peach.
2013.
•Conservation Agriculture and supplement Irrigation
•Adoption of new varieties of wheat, barley and chickpea tolerant to climatic change

Publications by Research Team Posters • One on Introducing new varieties of cactus at the benchmark
• Second one on Extension at the benchmark through the WLI project
• Booklet on wheat varieties
Publications • Contribution to the studies of viral diseases and Integrated Pest
Management on Peach in Qaa region

Integrated Pest Management of main crops in Qaa region
• Good Agricultural Practices can be used in Qaa region order to increase the yield, decrease the cost of production (around 30%) and facilitate access to export markets (reduction of the number of treatments and the pesticide residues in fruit production).
ELISA results
02468
10121416
Orc
hard
1
Orc
hard
2
Orc
hard
3
Orc
hard
4
Orc
hard
5
Orc
hard
6
Orc
hard
7
Orc
hard
8
Orc
hard
9
Orc
hard
10
Orc
hard
11
Orc
hard
12
Orc
hard
13
Orc
hard
14
Orc
hard
15
Orc
hard
16
Orc
hard
17
Orc
hard
18
Orc
hard
19
Orc
hard
20
Orc
hard
21
Orc
hard
22
Orc
hard
23
Orc
hard
24
Orc
hard
25
Orc
hard
26
Orc
hard
27
Orc
hard
28
Orc
hard
29
Orc
hard
30
Orchards
Nb
of
infe
cted
sam
ple
s
PDV
ACLSV
ApMV
PNRSV
Surveying of 30 peach commercial orchards representing the different growing peach area of Qaa region (viral, fungal, bacterial diseases and insects

Understanding and Improving On-farm Income
Cabbage Eggplant Tomato Water melon
$/du $/du $/du $/du
27.5 20 40 40 Soil preparation
52 22 35-61.7 170-184 plants+plantation
26.5 26.5 Mulch
36.5 98 160 98-121 Fertilization
50 33 155 23.5 Protection
125 40 35-40 55 labor
195 350 250-275 180-200 irrigation
230 200 175 transport
115.5 0 plastic
30 407 125 0 harvest
118 20 commision & others
864 990 1142.5-1198.5 768-825 cost of production
5.5t/du 5-6t/du 5t/du production
350 785 320LL 250-500LL price/kg
1280 1750 1405 1090 price of the yield $/du
416 760 262-206.5 322-265 net profit
0%
20%
40%
60%
80%
100%
Water
melon
Tomato Eggplant Cabbage
vegetables
Max Net Profit
net profit
cost of production
0%
20%
40%
60%
80%
100%
Water
melon
Tomato Eggplant Cabbage
Vegetables
Min Net Profit
net profit
cost of production
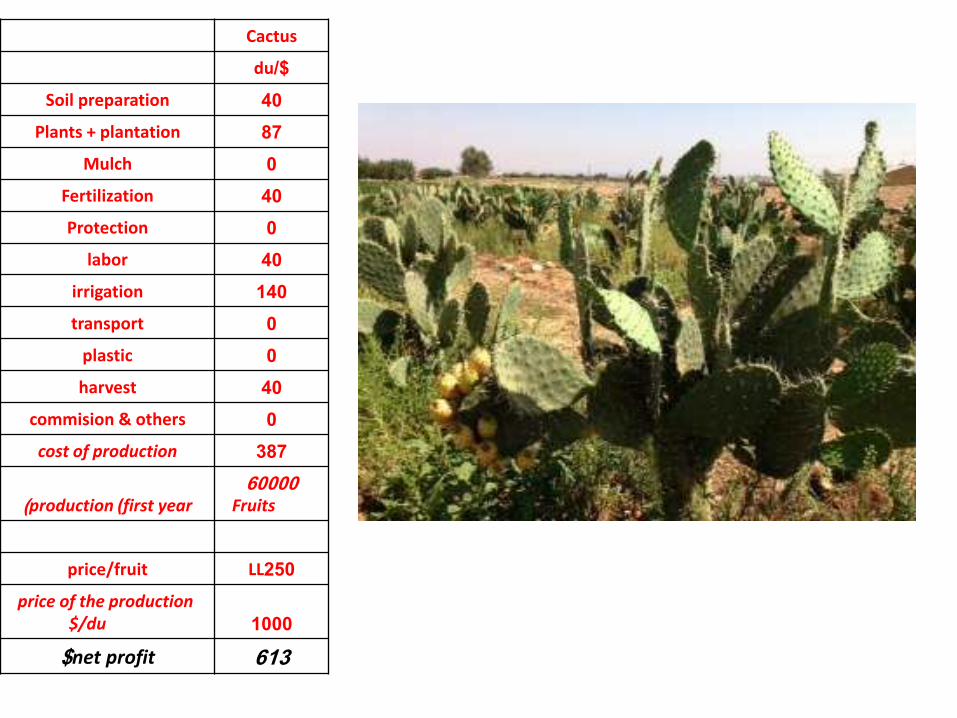
Cactus
$/du
40 Soil preparation
87 Plants + plantation
0 Mulch
40 Fertilization
0 Protection
40 labor
140 irrigation
0 transport
0 plastic
40 harvest
0 commision & others
387 cost of production
60000 Fruits production (first year)
250LL price/fruit
1000
price of the production $/du
613 net profit$

Understanding and Improving Household Income
Fruit trees
Max Min peach-nactarine-apricot and plum
$/du $/du cost of implementation
240 60 Soil preparation
90 60 plantation
480 180 price of plants
300 300 irrigation system
14000 12000 wells
15000 15000
Diezel moteur 170m3/hour (for farmer
around 15-20Ha)
2000 1800 iron pole
32110 29400 Total
$/ du Annual cost
120-150 Labor
28-50 protection
70-85 pruning
100-125 fertilization
150-185 irrigation
35-40 fertigation
100-150 harvest
80-100 post harvest
683-885 Cost of production
-20%
0%
20%
40%
60%
80%
100%
Min Net Profit
grape
Pulm
apple
apricot
Peach
0%
10%
20%
30%
40%
50%
60%
70%
80%
90%
100%
Max Net Profit
grape
Pulm
apple
apricot
Peach
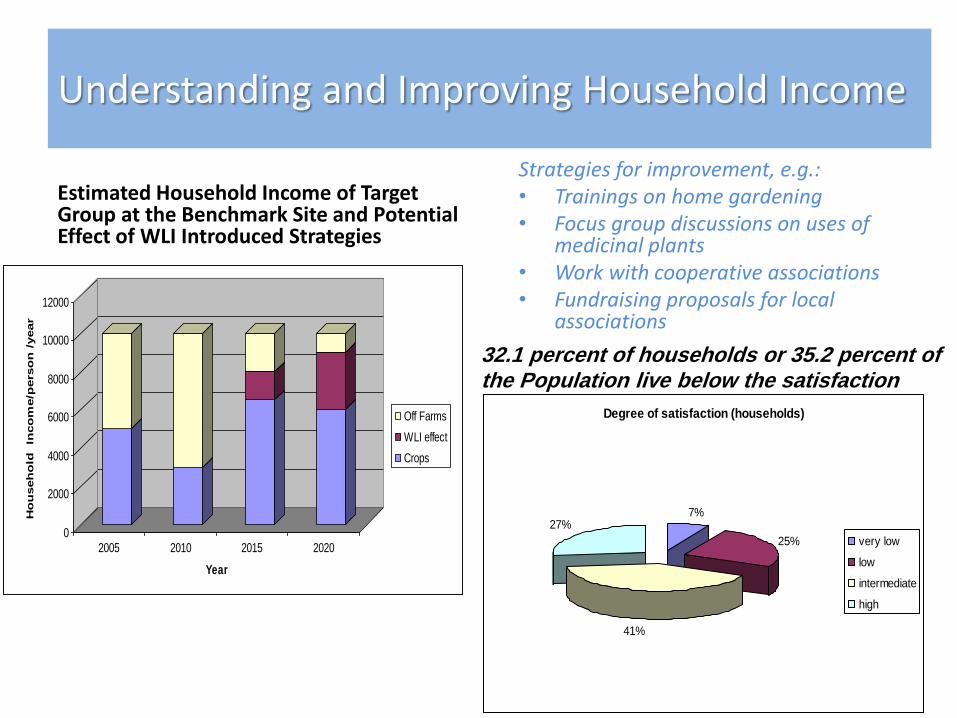
Understanding and Improving Household Income
Estimated Household Income of Target Group at the Benchmark Site and Potential Effect of WLI Introduced Strategies
32.1 percent of households or 35.2 percent of the Population live below the satisfaction threshold.
Strategies for improvement, e.g.: • Trainings on home gardening • Focus group discussions on uses of
medicinal plants • Work with cooperative associations • Fundraising proposals for local
associations
0
2000
4000
6000
8000
10000
12000
Ho
useh
old
In
co
me/p
erso
n /
year
2005 2010 2015 2020
Year
Off Farms
WLI effect
Crops
Degree of satisfaction (households)
7%
25%
41%
27%
very low
low
intermediate
high

Thank you Eng. Randa Massaad Msc in Irrigation. Coordinator, On field trial leader. Dr. Ihab Jomaa, Phd In Remote Sensing, Leader of Water Management Activities. Eng. Sleiman Skaff, Irrigation/rainfed (micro level harvesting water) at small scale
rainwater harvesting, at farm level. Eng. Chafic Estephan, leader of the CA activity. Eng. Charbel Hobeika, Machatel Loubnan. Consultant in fruits trees varieties. Dr.Elia Choueiri, Phd in crop protection-virology. Surveying of the El Qa'a region, IPM
,laboratory analysis and training for the farmers groups. Dr.Wassim Habib, Phd in crop protection- Bacteriology. Surveying of the El Qa'a region
and laboratory analysis. Eng.Ali Chehade, leader of the activity: comparison of local and imported grapevine
varieties in semi-arid region. Mr. Ahmed Bitar, leader of Intensive cultivation of early, late and industrial apricot
varieties in El Qa'a region. Mr. Fadi Naddaf socioeconomist, data collection.
Dr. Hadi Jaafar, PHD, FAFS AUB
Dr.Salem Darwish, Phd in socioeconomy, Data Analysis and Socioeconomy.

Opportunities & Needs for Research
Field Research & Data Collection
• Equipment: tensiometers, water sensors , leaf area meter, Loggers, sensors, Solar power systems, flow meters
Modeling Systems & Mgt Options
• Support of ICARDA team for choosing the better model to be applyied at El Qaa Benchmark

Needs for Training & Knowledge Exchange
Land & Water Users Needs
• Water harvesting at small level
• Choose the best varieties of wheat Barley and chickpea (supplement irrigation)
• Integrated pest management on fava bean, vegetables and fruits trees
Research Team Members Needs
• Training on modeling (ICARDA staff support)
• Training on molecular diagnosis of legumes and cereals viral diseases
• GIS

Resource Mobilization Plan for 2014: (Lebanon) Total (US$)
Additional Resource Needs Other Sources (K US$) WLI Seed Fund (US$)
Improve Water Mgt Strategies
(Item) $700 LARI 3000 -Activity1:Water availability at the benchmark area through the main open channels
(Item) $700 (LARI 3000 -Activity2: Small scale rainwater harvesting, at farm level
AUB 5000 Activity 3:Effect of compost as a mulch on water productivity of sprinkle-irrigated potatoes in till and no-till systems
AUB 6000 Activity 4:Simulating daily runoff from storms within the Orontes River Basin for Water Collection and Groundwater recharge
2000 (LARI) 12000 Activity5:Optimization of Sensor Use for irrigation scheduling
(Estimate: US$) $2400 (indicative): 39000 SUBTOTAL
Improve Livelihoods
(Item) 2700 LARI 3000 -Activity 1: A comparison of local and imported grapevine varieties in semi-arid region (North of Bekaa: El Qaa)
(Item) 2000 LARI 3000 -Activity 2: INTENSIVE CULTIVATION OF EARLY, LATE AND INDUSTRIAL APRICOT VARIETIES IN EL-QAA REGION
2000 2000 Activity 3. Conservation Agriculture or no-tillage (zero tillage)
2500 6000 Activity 4. On farm demonstration trial (Wheat, Barley and Chickpea)
(Item) $3500 LARI 3000 - Activity 5. Integrated Pest Management of main crops in Qaa region
(Estimate: US$) $12700 (indicative): 17,000) SUBTOTAL
$ Improve & Exchange Knowldge
(Item) $1500 (LARI 8000 -Effect of Syrian War on Lebanese Agriculture at the benchmark area
(Estimate: US$) $15600 (indicative): 8000 SUBTOTAL
22500 53, 000 (MAX.) GRAND TOTAL

Schedule for 2014
Schedule 2014 Schedule2013
12 11 10 9 8 7 6 5 4 3 2 1 12 11
Improve Water Mgt Strategies
-Water availability at the benchmark area
through the main open channels Small scale rainwater harvesting, at farm level
Effect of compost as a mulch on water productivity of sprinkle-irrigated potatoes in till and no-till systems
Simulating daily runoff from storms within the Orontes River Basin for Water Collection and Groundwater recharge
Optimization of Sensor Use for irrigation scheduling
Improve Livelihoods A comparison of local and imported grapevine varieties in semi-arid region (North
of Bekaa: El Qaa) INTENSIVE CULTIVATION OF EARLY, LATE AND INDUSTRIAL APRICOT VARIETIES IN EL-
QAA REGION Conservation Agriculture or no-tillage (zero
tillage) On farm demonstration trial (Wheat, Barley
and Chickpea) Integrated Pest Management of main crops in Qaa region
Exchange Knowledge
Effect of Syrian War on Lebanese Agriculture at the benchmark area
Quarterly & Annual Reporting
Monitoring WLI Indicators