5 powerful ways to analyze google forms data
TRANSCRIPT

1) Where Does My Data Go?
● Google Form now makes a response collecting spreadsheet automatically when you create a new
form.
● The response spreadsheet gets created in the root folder, i.e. My Drive, so you’ll need to move it
afterwards.
● Your Form is saved in the folder from which you created it (if any)
● To access your data from within the edit view of the form, click “View responses” from the toolbar.
● The response spreadsheet opens in a new tab, just like opening a new document. The responses
spreadsheet is aptly named “[Filename] (Responses)” making it easy to find.
● What I really like with the latest version of Google Forms is that the Form and the response
spreadsheet are no longer connected. You can (allegedly) edit data in the spreadsheet without fear of
your Form breaking. It’s still probably best practice to separate them anyway, and my advice, especially
if you’re still actively collecting data, is to make a copy of the data before manipulating it too much. A
quick way to do this is to duplicate the spreadsheet itself by using the tab menu at the bottom of the
sheet.
www.synergyse.com

Fig 1. - Viewing responses from the Form edit view is easy - just click on the toolbar button and your
responses open in a new tab as a spreadsheet.
www.synergyse.com
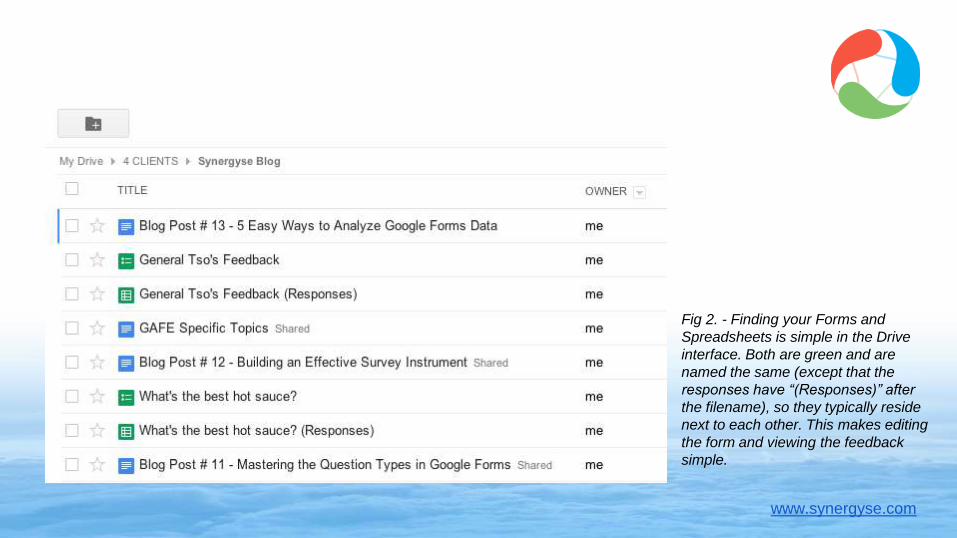
Fig 2. - Finding your Forms and
Spreadsheets is simple in the Drive
interface. Both are green and are
named the same (except that the
responses have “(Responses)” after
the filename), so they typically reside
next to each other. This makes editing
the form and viewing the feedback
simple.
www.synergyse.com
2) Basic Sorts & Filtering
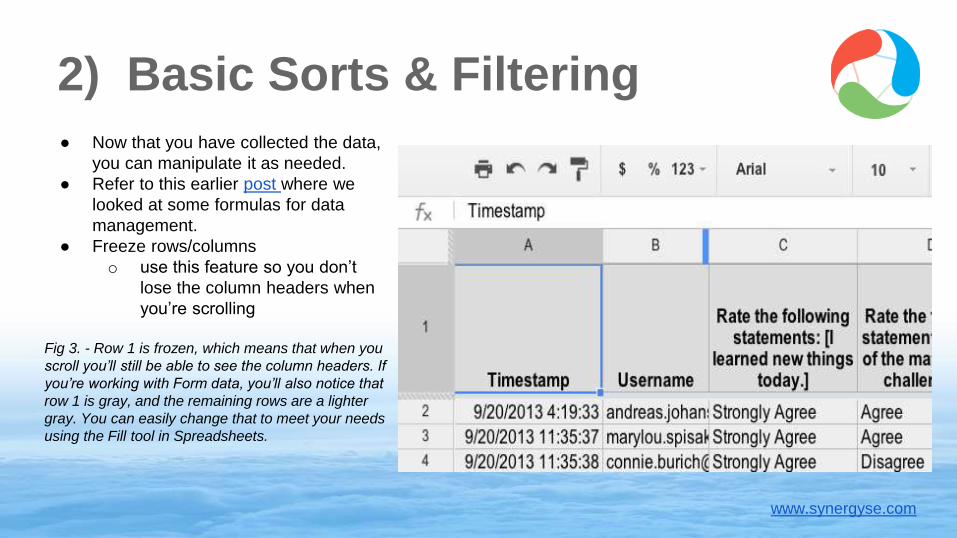
● Now that you have collected the data,
you can manipulate it as needed.
● Refer to this earlier post where we
looked at some formulas for data
management.
● Freeze rows/columns
o use this feature so you don’t
lose the column headers when
you’re scrolling
Fig 3. - Row 1 is frozen, which means that when you
scroll you’ll still be able to see the column headers. If
you’re working with Form data, you’ll also notice that
row 1 is gray, and the remaining rows are a lighter
gray. You can easily change that to meet your needs
using the Fill tool in Spreadsheets.
www.synergyse.com
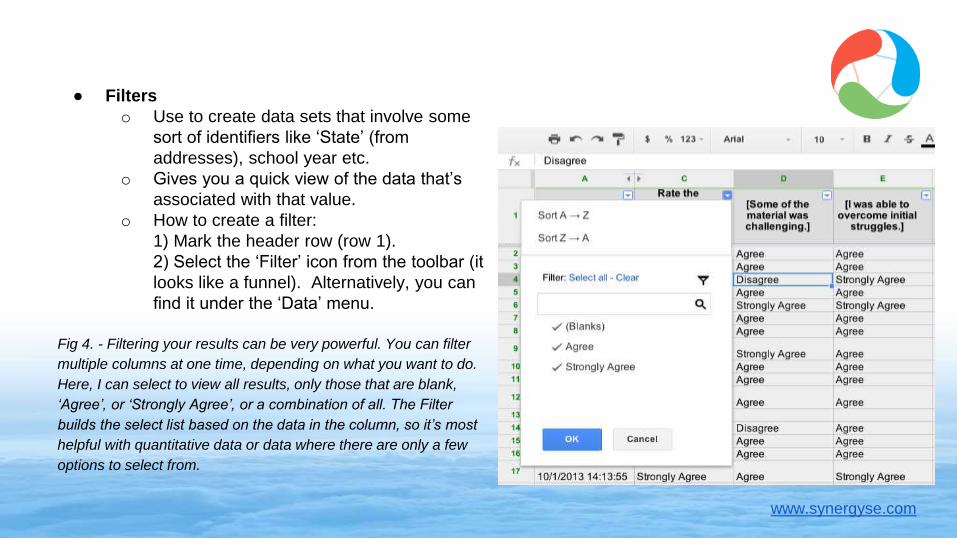
● Filters
o Use to create data sets that involve some
sort of identifiers like ‘State’ (from
addresses), school year etc.
o Gives you a quick view of the data that’s
associated with that value.
o How to create a filter:
1) Mark the header row (row 1).
2) Select the ‘Filter’ icon from the toolbar (it
looks like a funnel). Alternatively, you can
find it under the ‘Data’ menu.
Fig 4. - Filtering your results can be very powerful. You can filter
multiple columns at one time, depending on what you want to do.
Here, I can select to view all results, only those that are blank,
‘Agree’, or ‘Strongly Agree’, or a combination of all. The Filter
builds the select list based on the data in the column, so it’s most
helpful with quantitative data or data where there are only a few
options to select from.
www.synergyse.com
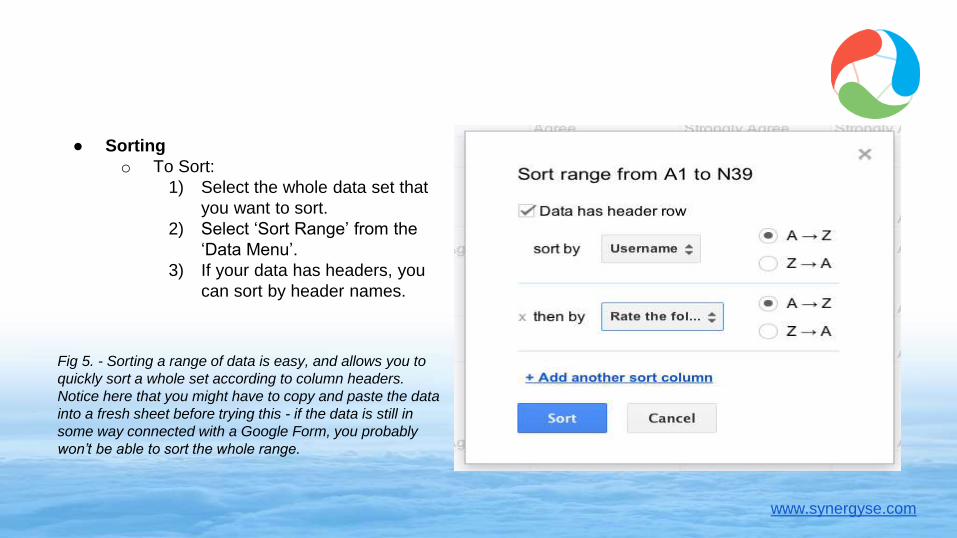
● Sorting
o To Sort:
1) Select the whole data set that
you want to sort.
2) Select ‘Sort Range’ from the
‘Data Menu’.
3) If your data has headers, you
can sort by header names.
Fig 5. - Sorting a range of data is easy, and allows you to
quickly sort a whole set according to column headers.
Notice here that you might have to copy and paste the data
into a fresh sheet before trying this - if the data is still in
some way connected with a Google Form, you probably
won’t be able to sort the whole range.
www.synergyse.com

3) Find and Replace● Depending on what kind of data you collect, it might be beneficial to turn qualitative data into
quantitative.
● For example, if you have a question like ““Rate how useful Google Forms is.” The answers to that
question might include, in a Grid Question, “Very Useful”, “Somewhat Useful”, and “Not Useful”. Well,
how do you get a good feel for that data? You turn those answers into numbers using “Find and
Replace.”
● To Find and Replace:
1) Select ‘Find and Replace’ from the ‘Edit’ menu.
2) Set the parameters (ie: find “Strongly Agree” and replace with “4”.
3) Click ‘Replace All’.
4) Google will automatically replace every instance of that parameter.
5) Then, run the ‘AVERAGE’ formula for that column and you should have a pretty solid idea of
how the statement fared, or how a question was rated (on average) on your scale. As long as
you remember your scale, and what it means, this is one of the quickest ways of taming
qualitative statements to make sense.
www.synergyse.com
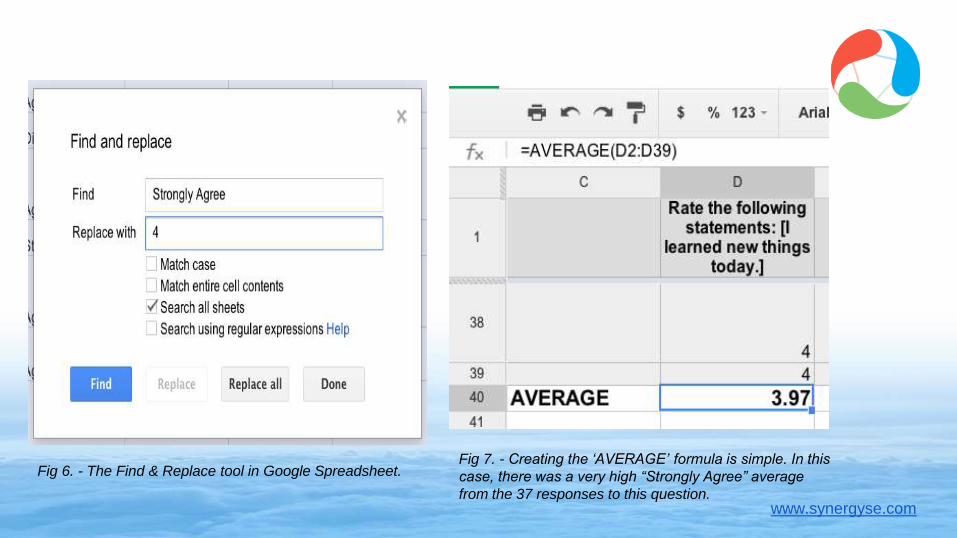
Fig 7. - Creating the ‘AVERAGE’ formula is simple. In this
case, there was a very high “Strongly Agree” average
from the 37 responses to this question.
Fig 6. - The Find & Replace tool in Google Spreadsheet.
www.synergyse.com
4) Dealing with Qualitative Data
● If you collect lots of qualitative data, such as statements or responses to questions like “Tell me how
you feel about…”, you’ll end up with a spreadsheet full of very full cells, which can be difficult to deal
with.
● The easiest way to deal with it is to download the data as an Excel file and use that with a merge
function in Excel. That way, you can easily break out your longer data and format it for easy reading, or
whatever else you plan on using the data for.
● Why Excel? Because there aren’t any great ways to do this in Google yet, and dealing with lots of
qualitative statements is not something I can recommend leaving to a script in Google Spreadsheet.
www.synergyse.com
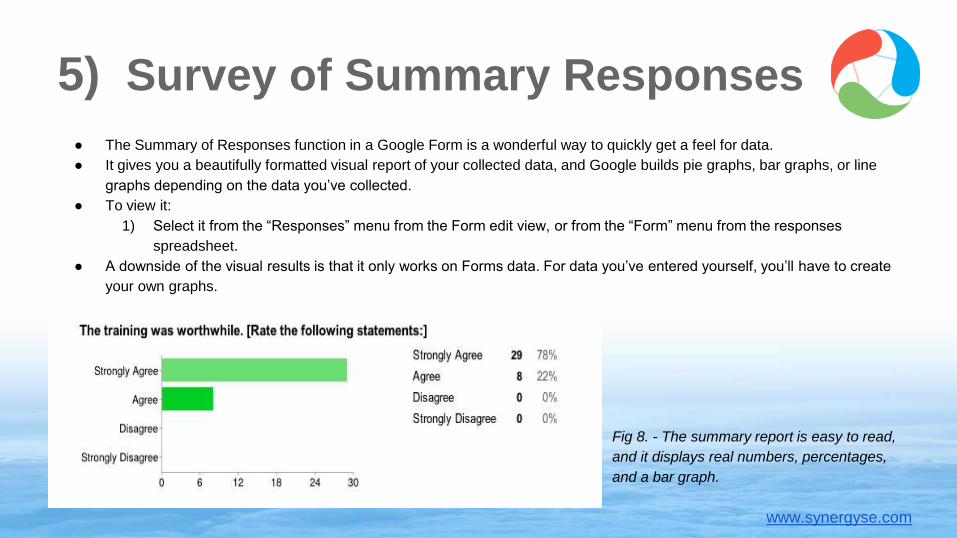
5) Survey of Summary Responses
● The Summary of Responses function in a Google Form is a wonderful way to quickly get a feel for data.
● It gives you a beautifully formatted visual report of your collected data, and Google builds pie graphs, bar graphs, or line
graphs depending on the data you’ve collected.
● To view it:
1) Select it from the “Responses” menu from the Form edit view, or from the “Form” menu from the responses
spreadsheet.
● A downside of the visual results is that it only works on Forms data. For data you’ve entered yourself, you’ll have to create
your own graphs.
Fig 8. - The summary report is easy to read,
and it displays real numbers, percentages,
and a bar graph.
www.synergyse.com