5 durability of grc with modified matrices and glass mesh · 1 5 durability of grc with modified...
TRANSCRIPT

1
5 Durability of GRC with Modified Matrices and Glass Mesh
Dr Yanfei Che University of Sheffield, UK
Abstract: It is well known that there is a loss of strength and ductility of GRC with time. In the
early 1980s Litherland et al investigated correlations between accelerated ageing regimes and
natural weathering using materials at the time and developed an empirical durability model. In
modern GRC, matrices are often modified with pozzolanic materials, polymers etc. and glass
reinforcement is also available in mesh and mat form. For some of these new materials, very
limited test data are available regarding ageing performance. It is not clear whether the
acceleration factors originally suggested for older GRC formulations are valid for these new
materials. Results from hot water ageing on GRC samples made with VCAS pozzolan and polymer
modified matrices and samples made with glass mesh reinforcement is presented and compared
with current ageing models. A durability model based on the study of FRP reinforcement in
concrete is adapted to GRC. By applying various ageing condition terms, data from accelerated
ageing tests can be correlated to the natural weathering condition and consequently to predict the
service life.
Keyword: GRC, VCAS pozzolan, acrylic polymer, glassfibre mesh, LOP, MOR, STF, durability model,
acceleration, retention
1. Introduction:
Early formulations of GRC made from ordinary Portland cement (OPC) and first generation alkali
resistant (AR) glassfibres are known to lose some of their strength over time particularly when they
are exposed in a hot and damp or wet environment (Majumdar and Laws, 1991). MOR and strain to
failure decline to a stable level with the MOR converging very close to the long term LOP, which
itself tends to rise slightly due to continuing cement hydration (Figure 1). For safety, strength loss
needs to be taken into account during design. Various approaches proposed to improve the ageing
performance of GRC have been reviewed by many authors (Bentur and Mindess 1990; Bijen 1993;
Hayashi et al. 1993; Purnell et al. 1999; Cheng et al. 2003; Cui et al. 2008). These generally fall
into two categories: 1) changing the chemical composition of glass fibres or their surface treatment
2) modifying the matrix.

2
Figure 1 Long term flexural strength declining
Materials being reported to improve GRC durability through modifying the matrix include calcium
sulphoaluminate (Cui et al. 2008), metakaolin (Thiery et al. 1991; Zhu and Bartos 1997),
microsilica (Marikunte et al. 1997) or acrylic polymer (Ball and Wackers 1995). The latest material
developments include VCAS, a ground E glass fibre pozzolan and AR glass fibre mesh, a structured
form of glass reinforcement.
The introduction of new materials requires the development of new knowledge on long term
strength retention under working conditions. This should be ideally obtained from exposure of test
samples at the expected working conditions over a lifetime, which often extends over many tens of
years. It is therefore necessary to develop some means of accelerating normal ageing and, hence,
the ability to predict long term strength.
An empirically derived durability model was developed by Litherland et al. (1981) from studies on
GRC in production at the time. This model gives a correlation between hot water accelerated
ageing and natural weathering. This model was presented in terms of acceleration factors, e.g. 50
°C for 84 days or 60 °C for 40 days are considered equivalent to 30 years of natural exposure in a
central European climate (Gartshore et al. 1991; Gartshore et al. 1998; Glinicki 1998).
The model was developed before new materials were available. It is not clear whether the
acceleration factors originally suggested for older GRC formulations are valid for these newer
materials. Hence, there is a need for verification and even the development of new approach. For
the new GRC raw materials, this paper focuses on VCAS pozzolan, acrylic polymer and glass fibre
mesh.
Fle
xura
l str
engt
h
time28 days
MOR
LOP

3
2. Materials and specimen preparation
2.1 VCAS pozzolan
Three 1.2×1.2m GRC boards were made by the hand-spray method. The mix design for the three
boards were,
Mix O: standard GRC mix (sand:cement:water=1:1:0.32, 1% Superplasticiser by weight of cement, 5%
fibre);
Mix V: same as Mix O, but with 25% replacement of OPC with VCAS pozzolan;
Mix P: same as mix V, but with additional 10% acrylic polymer emulsion on the combined weight of
Cement and VCAS pozzolan.
After 28 days each board was cut into 64 standard (EN1170-5, 1998) test coupons (Figure 2),
amongst which 8 were used as control coupons and 56 were placed in water baths at 60 °C (Figure
3). Bending tests were conducted according to EN1170-5 (1998) at various ageing times.
2.2 Glass fibre mesh
Premix GRC with 2.5% chopped strands at w/c ratio 0.32 was used to cast 1m×1m test board (Figure
4). Different types of glass fibre mesh were placed in the board either in one layer or two layers as
shown in Table 1. A GRC panel without net reinforcement was also cast as a control specimen.
Figure 3 60 °C hot water bath
Figure 2 Test coupons

4
Figure 4 Mould and test board casting
Table 1 Glass fibre mesh reinforcement and its position in the board
Board Mesh size
(mm)
Density (g/m2)
Layers
A Control sample
B 10×10 150 Double
C 5×5 160 double D 5×5 160 single E 6×6 270 single F 4×4 180 single
Position of glass fibre mesh in the board G 10×10 150 single
After 28 days, each board was cut into 36 test coupons, amongst which 4 were used as control
samples and 32 were immersed in a 60 °C hot water bath. Standard bending tests (EN1170-5:1998)
were conducted at various ageing times.
3. Results
3.1 VCAS pozzolan and acrylic polymer

5
Table 2 shows the ageing test results for the samples mentioned above. The time taken for a given
properties (MOR and strain to failure (STF)) to be reduced to half its original, unaged value (t50%) is
compared in Figure 5 . The t50% of MOR and STF for matrix V and matrix P GRC were about 4 times
and 2 to 3 times longer than for matrix O, respectively. This indicates that the VCAS pozzolan can
improve the durability and ductility of GRC effectively. The further addition of acrylic polymer
showed little effect. The results from these tests will be discussed further in the following sections.

6
Table 2 Ageing test results
Ageing time(day) 0 3 10 20 30 40 50 70 80 90
Mix O
MOR(MPa) 25.39 18.06 15.04 12.33 12.32 10.75 10.61 11.01 10.55 10.93
STF (%) 1.07 0.72 0.53 0.33 0.29 0.163 0.1234 0.106 0.089 0.09
Mix V
MOR(MPa) 19.92 16.89 15.99 14.75 14.29 13.76 11.91 10.28 9.9 9.93
STF (%) 1.34 0.97 0.88 0.62 0.48 0.395 0.257 0.15 0.09 0.12
Mix P
MOR(MPa) 23.42 19.96 18.46 15.94 15.57 15.09 13.22 12.71 11.72 11.58
STF (%) 1.02 0.95 0.78 0.85 0.42 0.31 0.20 0.13 0.10 0.12
Figure 5 Comparison of t50% values
3.2 Glass fibre mesh
Results of MOR and STF at different ageing time are shown in Table 3.
0
20
40
60
80
100
MOR STF
t 50%
(day
s)
Matrix O
Matrix V
Matrix P

7
Table 3 Ageing test results
Ageing time (day)
Properties Sample board
A B C D E F G
0 LOP (MPa) 7.45 8.46 8.26 8.70 8.41 9.92 8.82 MOR (MPa) 8.89 22.95 19.88 14.09 21.83 21.14 14.38 STF (%) 0.41 1.16 1.01 0.55 1.25 1.16 0.81
10
LOP (MPa) 7.02 7.69 8.43 8.41 7.60 8.92 8.22
MOR (MPa) 8.38 20.84 19.09 12.21 19.30 17.54 12.29
STF (%) 0.34 1.00 0.91 0.52 1.07 1.00 0.66
20
LOP (MPa) 6.84 7.70 7.81 7.70 6.84 7.34 6.93
MOR (MPa) 7.66 18.08 16.04 10.26 16.35 14.30 9.95
STF (%) 0.28 0.92 0.73 0.39 1.16 1.01 0.76
30 LOP (MPa) 7.05 7.08 7.71 7.85 7.65 8.33 7.62
MOR (MPa) 7.35 15.27 13.78 10.16 15.20 12.98 10.39 STF (%) 0.21 0.86 0.62 0.28 0.97 0.84 0.65
45
LOP (MPa) 6.74 6.99 8.36 8.68 7.90 8.73 7.78
MOR (MPa) 6.77 13.44 13.72 10.02 15.79 12.60 10.24
STF (%) 0.11 0.70 0.60 0.21 0.86 0.69 0.30
60
LOP (MPa) 6.88 7.24 7.84 7.78 7.77 8.62 7.09
MOR (MPa) 6.71 11.17 12.55 9.35 11.50 11.00 10.17
STF (%) 0.09 0.46 0.46 0.20 0.54 0.47 0.30
75 LOP (MPa) 7.14 7.46 7.67 8.66 7.65 8.87 8.52 MOR (MPa) 6.57 11.68 11.82 9.34 11.13 11.31 9.90 STF (%) 0.05 0.41 0.41 0.18 0.42 0.41 0.25
The MOR and STF, the retention of MOR and STF after the accelerated ageing period, as a
percentage of the unaged value, are plotted in Figure 6 and Figure 7.
Figure 6 Residue MOR after 75 days accelerated ageing
0
0.2
0.4
0.6
0.8
1
0
5
10
15
20
25
A B C D E F G
MO
R r
ete
nti
on
MO
R (
MP
a) Unaged MOR
75 days MOR
MOR retention
Samples as in Table 1

8
Figure 7 Residue STF after 75 days accelerated ageing
The initial strength and STF of GRC reinforced with glass mesh increases as compared with
unreinforced GRC. Whilst the addition of mesh increased the long-term ductility of GRC
substantially (with the STF retention between 20-40% after 75 days of ageing compared to 12% of
unreinforced GRC), the strength retention is a bit lower than pure GRC (50-70% to 73%).
Nevertheless, the residual MOR of mesh reinforced GRC is still higher than that of plain GRC (see
Table 3).
In general, higher reinforcement ratios result in higher initial MOR. However, a double layer of
reinforcement is not as efficient as a single layer in enhancing the initial ductility, possibly because
the failure of the bottom layer takes place first. Although there is significant difference among the
initial MOR and STF, the aged values all become comparable.
3.3 Normalised strength vs. logarithmic time
The basis of the Litherland et al. (1981) model is that up to the point where GRC degradation
stabilises, a plot of composite strength vs. logarithmic time will produce a straight line. Figure 8
and Figure 9 plot normalised strength vs. log [aging time]. The 60 °C strength data used in the
formulation of Litherland et al. model is also plotted for comparison. MOR data are normalised with
respect to their initial, unaged values.
0
0.2
0.4
0.6
0.8
1
0
0.2
0.4
0.6
0.8
1
A B C D E F G
STF
rete
nti
on
STF
(%)
Unaged STF
75 days STF
STF retention
Samples as in Table 1
9
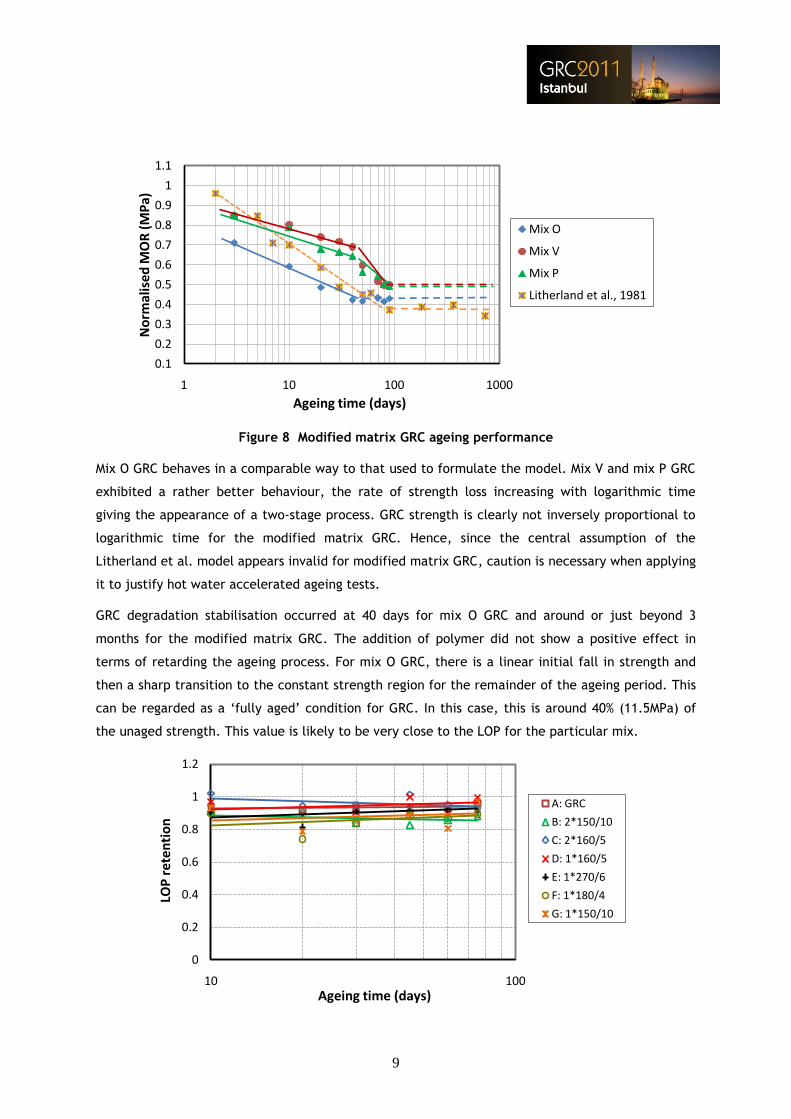
Figure 8 Modified matrix GRC ageing performance
Mix O GRC behaves in a comparable way to that used to formulate the model. Mix V and mix P GRC
exhibited a rather better behaviour, the rate of strength loss increasing with logarithmic time
giving the appearance of a two-stage process. GRC strength is clearly not inversely proportional to
logarithmic time for the modified matrix GRC. Hence, since the central assumption of the
Litherland et al. model appears invalid for modified matrix GRC, caution is necessary when applying
it to justify hot water accelerated ageing tests.
GRC degradation stabilisation occurred at 40 days for mix O GRC and around or just beyond 3
months for the modified matrix GRC. The addition of polymer did not show a positive effect in
terms of retarding the ageing process. For mix O GRC, there is a linear initial fall in strength and
then a sharp transition to the constant strength region for the remainder of the ageing period. This
can be regarded as a ‘fully aged’ condition for GRC. In this case, this is around 40% (11.5MPa) of
the unaged strength. This value is likely to be very close to the LOP for the particular mix.
0.1
0.2
0.3
0.4
0.5
0.6
0.7
0.8
0.9
1
1.1
1 10 100 1000
No
rmal
ised
MO
R (
MP
a)
Ageing time (days)
Mix O
Mix V
Mix P
Litherland et al., 1981
0
0.2
0.4
0.6
0.8
1
1.2
10 100
LOP
ret
en
tio
n
Ageing time (days)
A: GRC
B: 2*150/10
C: 2*160/5
D: 1*160/5
E: 1*270/6
F: 1*180/4
G: 1*150/10

10
Figure 9 Fibre mesh reinforced GRC ageing performance
The ageing values of LOP remain more or less constant at around 80-100% of the initial value for
both plain GRC and mesh reinforced GRC. This confirms that LOP is mainly related to the matrix
and matrix made with OPC is stable when exposure to the wet environment. MOR reduces linearly
with logarithmic time, so these samples deteriorate in a similar way as those used to formulate the
Litherland et al. model. However, all the MOR retention data are above the Litherland et al. model
data, which means the ageing process is slower. This may be due to the fact that glass fibre bundle
is protected by the polymer coating used to manufacture the mesh.
It is anticipated that the long-term strength of any GRC sample will tend to be the LOP value,
hence, the MOR retention should stabilise at the LOP/MOR ratio. This is as predicted by Figure 1
and as shown in Figure 8. Hence, a better way to examine GRC degradation is by looking at the
(MOR-LOP) retention. The normalised value of difference of MOR and LOP vs. log [aging time] is
plotted in Figure 10.
0
0.1
0.2
0.3
0.4
0.5
0.6
0.7
0.8
0.9
1
10 100
MO
R r
ete
nti
on
Ageing time (days)
A: 2*150/10
B: 2*160/5
C: 1*160/5
D: 1*270/6
E: 1*180/4
F: 1*150/10
Litherland et al.

11
Figure 10 Relation of (MOR-LOP) vs. ageing time
It clearly shows that the value of (MOR-LOP) is still inversely proportional to logarithmic time. The
intersection on the x-axis indicates the time it takes for GRC to be ‘fully aged’. The ‘fully aged’
time and reinforcement rate of each sample is shown in Table 4. It can be seen that a higher
reinforcement ratio generally leads to a prolonged ‘fully aged’ time.
Table 4 Reinforcement rate and ‘fully aged’ time
Sample A B C D E F G
Reinforcement ratio (g/m2)
0 300 320 160 170 180 150
‘Fully aged’ time (day) 42 146 220 128 163 101 56
It is evident that by applying old models to new formulations of GRC, can lead to over- (or under)
estimation in strength retention with potentially serious consequences. Further work needs to be
done to propose a durability model.
4 GRC fence panel after five years’ natural weathering
A premix GRC fence panel (Figure 11) was cast for a final year project by an undergraduate
student of the University of Sheffield and was stored in the mist room (20 ºC and 100% RH) for
standard curing. The basic mix design was cement:sand:water=1:1:0.35 with 2.5% glass fibre. After
five years, twelve test coupons (Figure 12) were cut from the panel and flexural strength was
tested.
0
0.1
0.2
0.3
0.4
0.5
0.6
0.7
0.8
0.9
1
10 100 1000
(MO
R-L
OP
) re
ten
tio
n
Ageing time (days)
A: GRC
B: 2*150/10
C: 2*160/5
D: 1*160/5
E: 1*270/6
F: 1*180/4
G: 1*150/10

12
The average MOR of 12 test coupons was examined to be 7.73 MPa, the original MOR
obtained from testing GRC coupon of the same mix design was 8.95 MPa (Kiratzis 1999). The
normalised strength vs. log [aging time] of this result together with the results of 60 °C hot water
ageing on premix GRC with a similar mix design (Table 3) is shown in Figure 13.
Figure 13 OPC GRC ageing performance
To correlate the above data, and more importantly, to predict GRC durability in the natural
environment, a durability model needs to be adopted.
5. Durability model
As GRC material degrades through its entire service life, it is necessary for design engineers to
choose the appropriate long-term strength as the design value. Due to the test time limits, such
strength can only be predicted by using durability models.
0.6
0.7
0.8
0.9
1
1.1
1 10 100 1000 10000
No
rmal
ise
d M
OR
Time (day)
Accelerating
Mist room
0.86
Figure 12 Bending test coupons
Figure 11 GRC fence panel

13
It is proposed that GRC is designed for durability on the basis of a simple design strength equation,
in which the characteristic bending strength is multiplied by a factor which is linked to various
environmental parameters and divided by a material safety factor as shown in Equation 1.
, , 0, /( )GRC d env t GRCf MOR (1)
where fGRC,d is the strength design value, MOR,0 is the original bending strength, κenv,t (=1/ ηenv,t) is
the environmental strength retention factor and is the ratio between long-term and original
strength, ηenv,t is the strength reduction factor, γGRC is the material safety factor.
A similar approach has also been adopted by the fib in Bulletin 40 (fib 2007) when dealing with FRP
as reinforcement in concrete.
5.1 Environmental strength retention factor (κenv,t)
This factor can be determined accurately if the 1000h strength ffk,1000h and the standard reduction
of strength per logarithmic decade due to environmental influence R10 is known (Figure 14). It is
expected that there is a shift of about three logarithmic decades from 1000h to 880,000h (100
years) or 2.7 logarithmic decades for 50 years life. The following power equation can be used to
calculate κenv,t (adapted from German Standard (DIN 1990)).
, 10 ,1000 ,0(1 ) ( / )n
env t fk h fkR f f (2)
where ffk,0 is the original strength, and for normal environmental and service conditions n equals 3.
Figure 14 Environmental strength retention factor and 1000 h strength for two different
GRC materials with different durability (adopted from fib bulletin 40)
0.1
1
100 1000 10000 100000 1000000
Stre
ngt
h r
ete
nti
on
Time (h)
GRC A
GRC B
1000hstrengthffk,1000h
Testable time section Extrapolation section
strength limitfor 100 years
R10
1 decade
ηenv,B
ηenv,A

14
If no long term retention factors are known, an estimation using the above approach can be used.
Therefore the 1000h value is determined from short term data of MOR and literature data on
strength retention. The following equation was adapted from Weber (2006),
2
, 10(1 )n
env t R (3)
where n is the sum of the different influence terms
T mo SLn n n n (4)
where nT is the term for temperature (Table 6), nmo is the term for moisture condition ( Table 7)
and nSL is the term for desired service life (nSL = log [time]+1, time in year) (DIN 1990; Weber 2006),
typical nSL values are shown in Table 5.
Table 5 Term for desired service life
Service life (year)
1 10 50 100
nSL 1 2 2.7 3
5.2 Terms for temperature (nT)
GRC material deterioration can be assumed to be substantially a chemical process even when the
cause of deterioration is the expansion of the hydration products penetrating into the fibre bundle
and the attack at the individual filaments due to alkalinity or stress due to lateral pressure.
Chemical reactions in general double their rate every 10 °C and that is why a linear relationship
can be found between the strength retention and logarithmic time. In stress corrosion tests (fib
2007) the reduction factor of 10 °C was observed to be higher, reaching value between 2.25 and
2.85 (Weber 2005). The fib Bulletin 40 (fib 2007) proposes a logarithmic shift of 0.5/10°C which
means that the acceleration factor of is obtained for each logarithmic decade as shown in
Table 6 and Figure 14 .
Table 6 Term for mean annual temperature (MAT)
MAT (°C)
<5 5-15 15-25 25-35
nT -0.5 0 0.5 1
5.3 Terms for moisture condition (nmo)
It is accepted that the rate of deterioration of GRC largely depends on the environmental humidity
(Proctor et al. 1982). This was demonstrated earlier in Chapter 3 when exposing the glass fibres in
simulated cement pore solution. Byars et al. (2001) proposed three humidity conditions:
1) Dry: Indoor condition, protected from rain with an average relative humidity of
approximately 50%.

15
2) Moist: Outdoor conditions, subjected to rain but not constantly in contact with water with
an average relative humidity of approximately 80%.
3) Saturated: Constantly in contact with water with average relative humidity close to 100%.
The accelerating effect of these conditions in logarithmic term is given in Table 7 and also shown
in Figure 15.
Table 7 Correction term for moisture condition of GRC
Condition (RH)
Dry (50%) Moist (80%) Saturated (100%)
nmo -1 0 1
Figure 15 Effect of the parameter of temperature and humidity on GRC flexural strength
retention curves (adopted from Weber (2006))
5.4 GRC long-term strength prediction
If we accept that the strength degradation in GRC is mainly due to the degradation of the glass
fibre, then the strength degradation should stabilise when it reaches the level of LOP. Hence, the
degradation behaviour in double logarithmic scale should be bi-linear with the second branch being
horizontal. The first branch is the one that provides the value of R10. R10 can be obtained by
conducting the following procedure: firstly the MOR retention vs. time (in hour) is plotted on a
double logarithmic scale, then a power trend line, which displays as a straight line on the double
logarithmic scale, is drawn against this plot. The absolute value of the exponent of the trend line is
taken as R10. R10 values are calculated for the GRC ageing samples as shown in Table 1. The results
for sample A and sample C are shown in Figure 16. A summary of the ratio of LOP and MOR, R10,
κenv,50, κenv,100, and tLOP are shown in Table 8. κenv,50 and κenv,100 are the strength retention after 50
0.1
1
1000 10000 100000 1000000
Stre
ngt
h r
ete
nti
on
Time (h)
dry 10°C MAT
strength limitfor 100 years
1 decade
shift due to moistureshift due to temp.
0.5 decademoist 20°C MAT
moist 10°C MAT
16
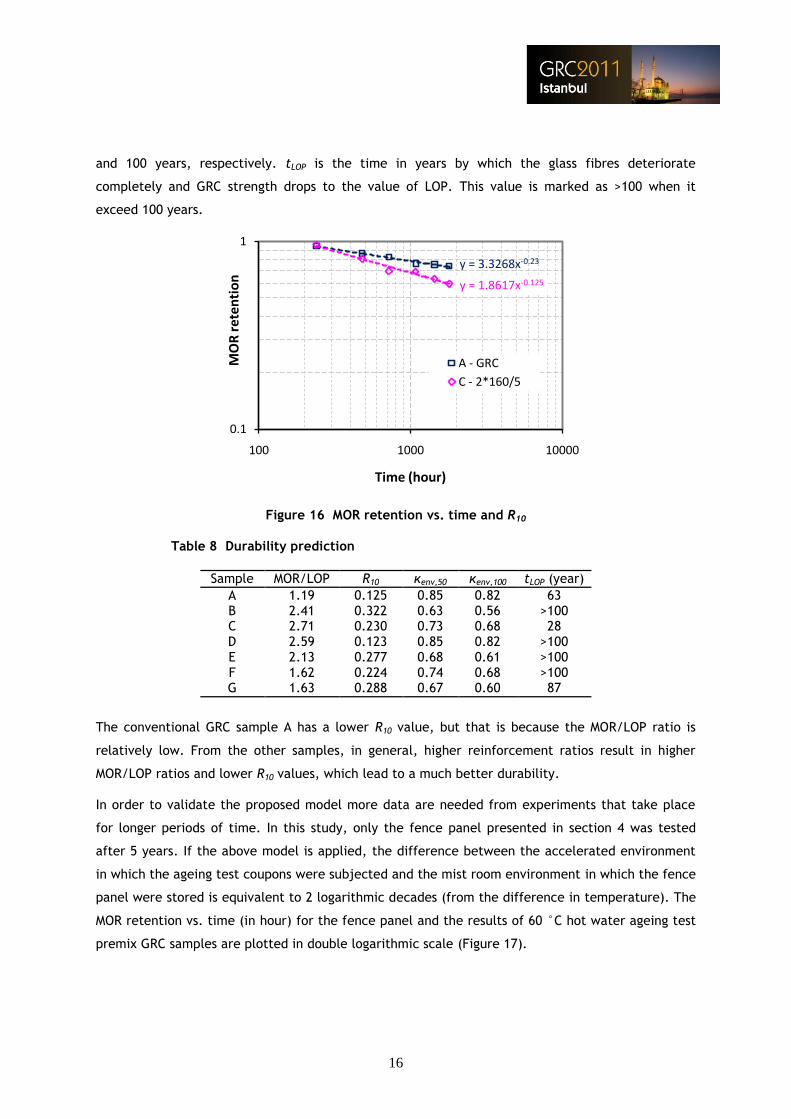
and 100 years, respectively. tLOP is the time in years by which the glass fibres deteriorate
completely and GRC strength drops to the value of LOP. This value is marked as >100 when it
exceed 100 years.
Figure 16 MOR retention vs. time and R10
Table 8 Durability prediction
Sample MOR/LOP R10 κenv,50 κenv,100 tLOP (year)
A 1.19 0.125 0.85 0.82 63 B 2.41 0.322 0.63 0.56 >100 C 2.71 0.230 0.73 0.68 28 D 2.59 0.123 0.85 0.82 >100 E 2.13 0.277 0.68 0.61 >100 F 1.62 0.224 0.74 0.68 >100 G 1.63 0.288 0.67 0.60 87
The conventional GRC sample A has a lower R10 value, but that is because the MOR/LOP ratio is
relatively low. From the other samples, in general, higher reinforcement ratios result in higher
MOR/LOP ratios and lower R10 values, which lead to a much better durability.
In order to validate the proposed model more data are needed from experiments that take place
for longer periods of time. In this study, only the fence panel presented in section 4 was tested
after 5 years. If the above model is applied, the difference between the accelerated environment
in which the ageing test coupons were subjected and the mist room environment in which the fence
panel were stored is equivalent to 2 logarithmic decades (from the difference in temperature). The
MOR retention vs. time (in hour) for the fence panel and the results of 60 °C hot water ageing test
premix GRC samples are plotted in double logarithmic scale (Figure 17).
y = 1.8617x-0.125
y = 3.3268x-0.23
0.1
1
100 1000 10000
MO
R r
ete
nti
on
Time (hour)
A - GRC
C - 2*160/5

17
Figure 17 OPC GRC ageing performance
As can be seen in Figure 17, the prediction of the model agrees very well with the test results from
the panel. The difference between the mist room condition and the natural environment in the UK
is 1.5 logarithmic decades (1 from the difference in moisture condition and 0.5 from temperature).
This means that if the panel was exposed to the UK environment it would have taken 173 years for
the strength to drop to the value of 0.86 of MOR.
6 Conclusion
By modifying the matrix with VCAS pozzolan, the GRC strength and ductility reduction was lessened.
The further addition of acrylic polymers showed only a marginal effect on the ageing process. The
glass mesh reinforced GRC showed good durability with the strength retention being above 50%
after 75 days of ageing. The ageing performance of GRC containing VCAS pozzolan or acrylic
polymer was found not to agree with the Litherland et al. ageing model well. Pure OPC premix GRC
or OPC premix GRC reinforced with glass fibre mesh deteriorate in a similar way as those used to
formulate the above model.
A durability model based on the study of FRP reinforcement in concrete was adapted. By applying
various ageing condition terms, data from accelerated ageing tests can be correlated to the natural
weathering condition and consequently to predict the service life. The limited test data from this
study fit in the model well. Clearly more tests need to be done to verify this model.
Reference:
Ball, H. P. and M. Wackers (1995). "Long term durability of GFRC composites containing polymer". 10th International GRCA Congress. Strasbourg: pp 1/2I-1/2XVII.
Bentur, A. and S. Mindess (1990). Fibre Reinforced Cementitious Composites, Elsevier Applied Science.
0.6
100 1000 10000 100000 1000000 10000000
Stre
ngt
h r
ete
nti
on
Time (h)
Accelerating
Mist room
2 decades 1.5 decades
1.0
173 years
0.9
0.8
0.7

18
Bijen, J. D. (1993). A survey of new developments in glass composition, coating and matrices to extend service lifetime of GFRC, ibid: pp 270-269.
Byars, E., P. Waldron, et al. (2001). "Durability of FRP in Concrete, Deterioration Mechanisms". Proceedings of FRP Composites in Civil Engineering, Hong Kong, Elsevier.
Cheng, J., W. Liang, et al. (2003). "Development of a new alkali resistant coating." Journal of Sol-Gel Science and Technology Vol 27(3): pp 309-313.
Cui, Y., Q. Cui, et al. (2008). "The influence of component change of raw materials on GRC durability". 15th International GRCA Congress Prague: pp 1/IV-10/IV.
DIN (1990). Extrapolation method for the prediction of the long term behaviour. Berlin, Beuth Verlag.
fib (2007). FRP reinforcement in RC structures, The International Federation for Structural Concrete.
Gartshore, G., E. Kempster, et al. (1991). "A New High Durability Cement for GRC products". The International Glassfibre Reinforced Concrete Association Congress, Maastricht, GRCA.
Glinicki, M. (1998). "Effects of Diatomite on Toughness of Premix Glass Fibre Reinforced Cement Composites". International Glassfibre Reinforced Concrete Association Congress, Cambridge, GRCA.
Hayashi, M., S. Sato, et al. (1993). Some ways to improve durability of GFRC, ibid: pp 270-284.
Kiratzis (1999). Use of FRC in thin structures. Third year project final report for BEng degree, University of Sheffield.
Litherland, K. L., D. R. Oakley, et al. (1981). "The use of accelerated ageing procedures to predict the long term strength of GRC composites." Cement and Concrete Research Vol 11: pp 455-466.
Marikunte, S., C. Aldea, et al. (1997). "Durability of glass fibre reinforced cement composites." Advanced Cement Based Materials(5): pp 100-108.
Proctor, B. A., D. R. Oakley, et al. (1982). "Developments in the assessment and performance of GRC over 10 years." Composites Vol 13: pp 173-179.
Purnell, P., N. R. Short, et al. (1999). "Accelerated Ageing Characteristics of Glass-fibre Reinforced Cement Made with New Cementitious Matrices." Composites A Vol 30: pp 1747-1753.
Thiery, J., A. Vautrin, et al. (1991). "High durability glass-fiber reinforced modified cementitious matrix". Proceedings of the Materials Research Society Symposium - Fiber Reinforced Cementitious Materials, Massachusetts.
Weber, A., Ed. (2005). GFK-Bewehrung - Bemessung und Anwendung. Faserverbundwerkstoffe Innovation im Bauwesen Bauwerk Verlag. Berlin.
Weber, A. (2006). "Durability approach for GFRP rebars". Proceedings of the Third International Conference on FRP Composites in Civil Engineering (CICE 2006), Miami, USA.
Zhu, W. and P. J. M. Bartos (1997). "Assessment of Interfacial Microstructure and Bond Properties in Aged GRC Using a Novel Microindentation Method." Cement and Concrete Research Vol 27: pp 1701-1711.