5, and - nasa...hcooch3 at 123.9 nm are shown in fig. l(a) and l(b), respectively. both spectra,...
TRANSCRIPT
February 5, 1988
Annual Report for Grant No. NAGW-319 Basic Covering the Period from 15 January 1987 to 15 January 1988
PHOTOABSORPTION AND PHOTODISSOCIATION OF MOLECULES IMPORTANT IN THE INTERSTELLAR MEDIUM
Submitted by:
Long C. Lee and Masako Suto Department of Electrical f Computer Engineering San Diego State Unlverelty San Diego, CA 92182
Prepared for:
NASA Headquarters Washington, D. C. 20546 Attention: Dr. Fred Gillett
Astronomy/Relatlvlty Branch Code E2
( $AS&-CR- 1824 35) E H O l C 1EICEE91C h A1D N88-100 17 €ECTOIDl5SGCJAPICE CF E C t E C U I k S I B E C B T A H X I& 9 t E l h l E P S l E L . L a t L E f l U L Ancual EEpoxt, 15 Jan, 19€7 - 1 5 Gan, 1580 (5ari Cieqc S t a t e Unclas Cc io . ) 32 F CSCL 03B G3/90 01i15E6
https://ntrs.nasa.gov/search.jsp?R=19880007234 2020-01-26T13:50:35+00:00Z
TABLE OF CONTENTS
I. Introduction ............................................. 3 11. Reeeerch Accomplished. ................................... 3
A. Photoabeorptlon and photodieeoclatlon of
H2S and DzS..... ..................................... 3 B. Photoabeorption and Pho~odieeoclatlon of
CH3C1, CH2C12. CH3C1 and CC14......... ............... 3 C. Photoabeorptlon and Photod~eeoclatlon of
HCOOH, HCOOCH3 and CH3COOH. .......................... 4
D. Photoexcitation of CH3 ............................... 4 E. Photoabsorption of 13C0 .............................. 5
111. Publicatfone and Preeentatione in Thle Reporting Period.. 6
IV. Appendicee P:-#V2 /d7-
f lL P?<>/M - A. Quantitative Photoabeorption and Fluoreecence - / , - C , ~ ’ J J L 0 Spectroecopy of H2S and D2S at 49-240 nm.
B. Fluorescence Ylelde from Photodissociative - ~ L - w P . Y ~ ~ ~ Excitation of Chloromethane8 by Vacuum Ultraviolet Radiation.
C. Fluoreecence Ylelde from Photodieeociatlve Excitation of HCOOH, HCOOCH3 and CH3COOH In Vacuum Ultraviolet.
D. CH(A-X, B-X) Emi88lOn8 from Photodieeociatlve Excitation of CH3.”
2
I. INTRODUCTION
Thie report describe8 the research result8 obtained in the
period from January 15, 1987 to January 15, 1988 for the research
program eupported by NASA under Grant No. NAGW-319. The Photo-
abeorption and photodiseociation cross sections of interstellar
molecules and radicals were measured in the 90-200 nm region
using eynchrotron radiation, F2 laser, exclmer lasers, and
discharge lamps ae light eources. These data are currently
needed for determining the formation and destruction rates of
molecules and radicals by the interstellar radiation field.
11. RESEARCH ACCOMPLISHED
The research results accompliehed in the period from January
15, 1987 to January 15, 1988 are summarized below:
A. Photoabeor~tion and PhotodeDosition of H7S and D2S_
H2S le quite abundant in the intersteller medium. The
photoabeorption and photodiesoclation croee eections of H2S and
D2S were meaeured, and the results were published in the Journal
of Chemical Phyelcs. A reprint of the paper is attached as
Appendix A.
B. Photoabsorptlon and Photodissociation of CHS1. CH2C17, CHC1. and CCl4
photodiesociation of chloromethanes (CHnCl4-n; n=1-3) may
produce CHn radicals that are important in the study of
interstellar photochemietry. The photodiesociation croes
sections of these molecules are the most fundamental information
needed to determine the concentratione of the CHn radicals; and
3
these data were measured in this reeearch program. All the
studied molecules show broad abeorption bande, indicating that
photoabsorption of these molecules lead to dieeociation. The
photoabsorption cross section is thue essentially equal to the
photodiesociation crose section. The results are described in
more detail in a paper attached as Appendix B.
C. PhotoabsorDtion and Photod~esociation of HCOOH. HCOOCH2L and CH2COOH
Formic acid (HCOOH) and acetic acid (CH3COOH) are abundant
in the interstellar medium. Their photoabsorption and
photodiseoclation croes sections are needed to determine their
lifetimes in the interetellar clouds, and they were meaeured in
the 105-250 nm region. Emissions from excited HCOO photofragment
were observed from photoexcitation of HCOOH and HCOOCH3, and
their fluorescence cross sections were measured. The result8 are
summarized In a paper attached as Appendix C.
D. Photoexcitation of CH2
CH3 is an important interstellar radical. The
Photoexcitation process of CH3 is of interest for the study of
the hydrocarbon cycle in the interetellar photochemistry. CH3
was produced by either photodieeociation of CH3C1 or by reactions
of CH4 with F and C1 atoms, which were produced by a microwave
diecharge of trace F 2 and C 1 2 in He. The C H ( A , B --> X) emleeione
were observed when CH3 wae excited by F 2 laser photons (157.5 nm)
by a eingle-photon proceee and by ArF laser photons (193 nm) by a
two-photon process. This emieeion is a useful means for the
detection of CH3. We will use the current result ae a base for
4
the measurement of CH3 photoabsorption cross section. The result
for the study of CH3 is summarized in a paper attached as
Appendix D.
E. Photoabsorption of 1 3 C O
CO is one of the most abundant interstellar molecules. The
photoabsorption cross sections of both 12CO and 1 3 C O are needed
for understanding the photochemistry of interstellar clouds. The
photoabsorption cross section of 12CO has been measured, but the
cross section for the absorption continua are still not certain.
We will continue the measurement in the next funding period.
The photoabsorption cross section of 13C0 has been mea8ured
in the current funding period. The preliminary result ehows that
the photoabsorption spectrum of 13CO is slightly different from
that of l 2 C 0 . The photoabsorption cross sections of 1 3 C 0 and
12CO will be analyzed in the next funding period.
5
1.
2.
3.
4.
5 .
111. Publication8 and Preeentatione in thie ReDortinu Period
L. C. Lee, X. Wang, and Pl. Suto, "Quantitative Photo- abeorption and Fluorescence Spectroecopy of H2S and D2S at 49-240 nm, J. Chem. Phye., 86. 4353 (1987).
L. C. Lee and Pl. Suto, "Fluoreecence Yields from Photo- di88OCiatlVe Excitation of Chloromethane8 by Vacuum Ultraviolet Radiation, " Chem. Phye. 114. 423 (1987).
M. Suto, C. Ye, C. T. Cheah, and L. C. Lee, nEmieeione from Photodieeociative Excitation of CH3 Radicals," preeented at the 1987 Pacific Conference on Chemistry and Spectroscopy, Orange County, Calif., Oct. 28-30, 1987.
M. Suto, X. Wang, and L. C. Lee, "Fluorescence Yields from Photodieeociative Excitation of HCOOH, HCOOCH3, and CH3COOH in Vacuum Ultraviolet, " submitted to J. Phys. Chem. (1987).
C. Ye, M. Suto, and L. C. Lee, "CH(A-X, B-X) Emieeions from Photodissociative Excitation of CH3," Submitted to J. Chem. Phys. ( 1987 1.
6
Appendix C
Fluoreecence Yield from Photodieeociative Excitation
of HCOOH, HCOOCH3, and CH3COOH in Vacuum Ultraviolet
Fluorescence Yields from Photodissociative Excitation
of HCOOH, HCOOCH3 and CH3COOH in the Vacuum Ultraviolet
. Masako Suto*, Xiuyan Wang, and L. C. Leea)
Department of Electrical 6 Computer Engineering
San Diego State University
San Diego, California 92182
ABSTRACT
The photoexcitation processes of HCOOH, HCOOCH3 and CH3COOH
were studied in the vacuum ultraviolet region using synchrotron
radiation and a pulsed discharge lamp as light sources. The
absorption and fluorescence cross sections of these molecule6
were measured in the 106-260 nm region. Fluorescences were
detected from photoexcitation of HCOOH and HCOOCH3, but not from
CH-JCOOH. Fluorescence produced at 123.9 nm was dispersed and
identified as the excited OH and HCOO radicals. Fluorescence
quantum yields of HCOOH and HCOOCH3 increase with decreasing
excitation wavelengths with maxima of 5% and 0.3% at 106 nm,
respectively.
a) Also, Department of Chemistry, San Diego State University
1
I. Introduction
Fluorescence8 from photodissociative excitation of HCOOX
(X=H, Me, and Et) were observed a long time ago by Style and
Ward. 1 The emitter was attributed to the excited HCOO
radical.1-3 However, the HC02 emission was not shown in the
fluorescence spectrum reported by Vinogradov and Vilesov,4 when
HCOOH was excited by vacuum ultraviolet ( V U V ) radiation. They
attributed the fluorescence to the OH(A-X) system, but not to
HCOO. It is of interest to elucidate this difference.
The photoabsorption of HCOOH has been extensively
investigated both in the VUV and UV regions.4'15 The Rydberg
series shown in the absorption spectrum were well assigned, but
the valence states were not identified.13 The photoabsorption of
HCOOCH3 is less extensively s t ~ d i e d 5 ~ 9 ~ 1 0 than that of HCOOH.
The absorption spectra of carboxyl compounds show similarity,
because the absorption is mainly induced by the active electrons
in the common C=O bond.
The photodissociative excitation processes of carboxyl
compounds are little studied. To the authors' knowledge, the
fluorescence yield of HCOOH given by Vinogradov and Vilesov4 is
the only study related to this subject. However, their
absorption spectrum is quite different from the published data5
and their fluorescence spectra are not consistent with other
observations.1 Thus, the cross sections for the production of
fluorescence from photodissociative excitation of HCOOH and
HCOOCH3 are essentially not known; and these data are reported in
2
this paper. In order to confirm the emitting species, the
photoexcitation process of CH3COOH was also studied, and the
result is included in this paper. The fluorescence yield of this
molecule is too small to observe. This result is again
different from the obsqrvation of Vinogradov and Vilesov4 who
reported a substantial fluorescence yield.
In addition to fundamental interest in understanding
photoexcitation processes, the current results are useful for the
study of photochemistry in the Earth’s upper atmosphere and the
interstellar medium. Formic and acetic acids are detected in the
upper troposphere and in rainwater.16‘19 The formation and
destruction mechanisms of these organic acids both in the gas and
liquid phases are needed for understanding their roles in the
formation process of acid rain.20,21 HCOOH and HCOOCH3 have been
detected in the interstellar diffuse clouds.22-25 Their
photodissociation cross sections are needed for calculation of
their photodissociation rates in the interstellar radiation
field. 26
11. EXPERIMENTAL
The experimental set-up for the synchrotron radiation
measurement has been described in a previous paper.27 In brief,
synchrotron radiation produced from the 1-GeV electron storage
ring at the University of Wisconsin was dispersed by a l-m vacuum
monochromator. The optical path length was 41.1 cm. Absorption
cross sections were measured according to Beer’s law. The linear
dependence of absorbance on pressure was observed, and the
3
photoabsorption cross section was determined from the slope. It
is noted that the measured absorption cross sections of a sharp
band depends on the monochromator slit width. The UV-visible
fluorescence was monitored by a cooled PMT (EM1 955888) sensitive
in the 180-800 nm region. The fluorescence was simultaneously
observed with the photoabsorption measurement in a direction
perpendicular to the incident photon beam.
For the fluorescence dispersion experiment, the sample gas
was irradiated by a N V line at 123.9 nm produced from a
capillary-condensed-discharge light source which was isolated by
a 1-m vacuum monochromator (McPherson 225). The fluorescence was
dispersed by a 0.3-m monochromator (McPherson 218) and detected
by a cooled PMT (EM1 9558QB). Signal from the PMT was processed
by a gated photon counter (EGGG ORTEC)
Samples of HCOOH (96.8% purity) and HCOOCH3 (99.8%) were
obtained from Sigma Chemical Co. CH3COOH was supplied by Fisher
with a purity of 99.7%. The sample gases were degassed at 97 K
prior to use for measurements. The major Impurity in HCOOH was
water. The gas cell was continuously pumped by a sorption pump
to maintain a constant pressure. This flow system minimized the
contamination by impurities produced from photodissociation of
sample gas and outgassing of walls. The pressure in the gas
cell was monitored by a MKS Baratron manometer.
Both HCOOH and CH3COOH form dimers in the gas phase. The
concentration ratio of dimer to monomer is negligibly small at
pressures lower than 50 mtorr.28*29 If high vapor pressure was
4
used, a small fraction of absorption is due to dimers. The
measurements were done at room temperature (22 OC).
111. RESULTS AND DISCUSSION
A. Fluorescence Spectra
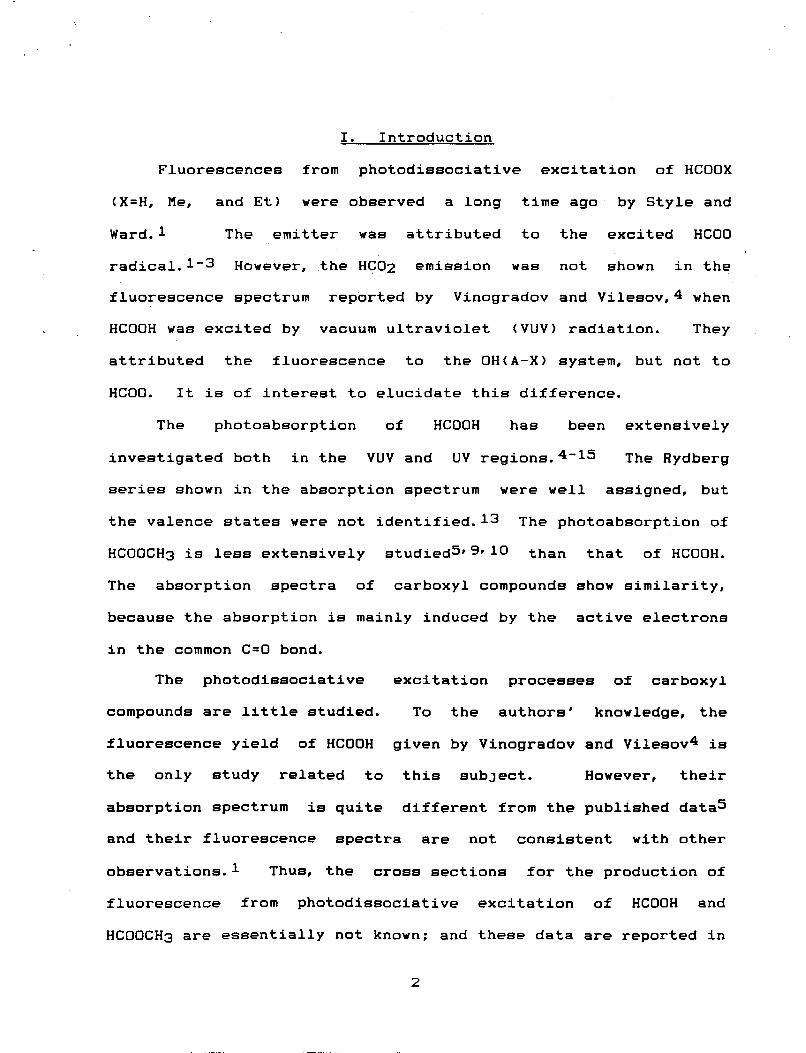
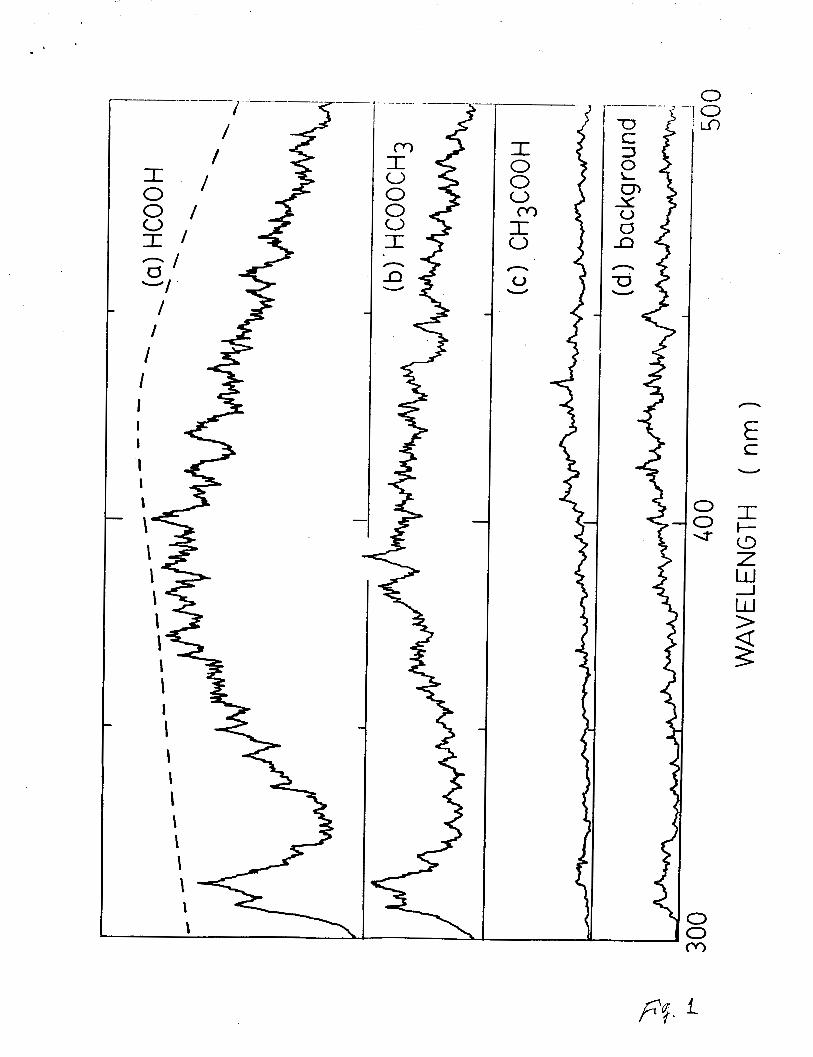
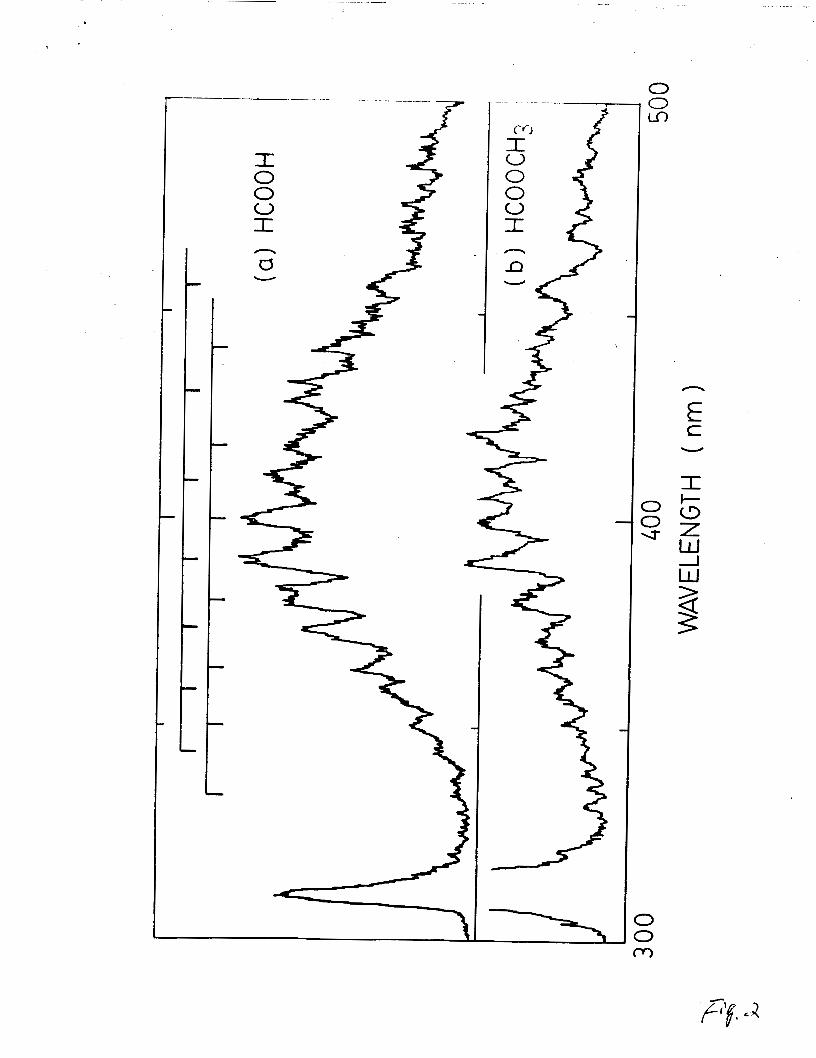
The fluorescence spectra from photoexcitation of HCOOH and
HCOOCH3 at 123.9 nm are shown in Fig. l(a) and l(b),
respectively. Both spectra, which consist of the OH(A-X) band at
310 nm and a broad continuum in the 330-500 nm region, are
similar. The emission spectrum from photoexcitation of CH3COOH
at 123.9 nm was also examed as shown in Fig. l(c). The emission
signal from this molecule does not differ from the background
shown in Fig. l(d), which was taken with no gas in the gas cell.
This result indicates that the emission from CH3COOH is not
detectable.
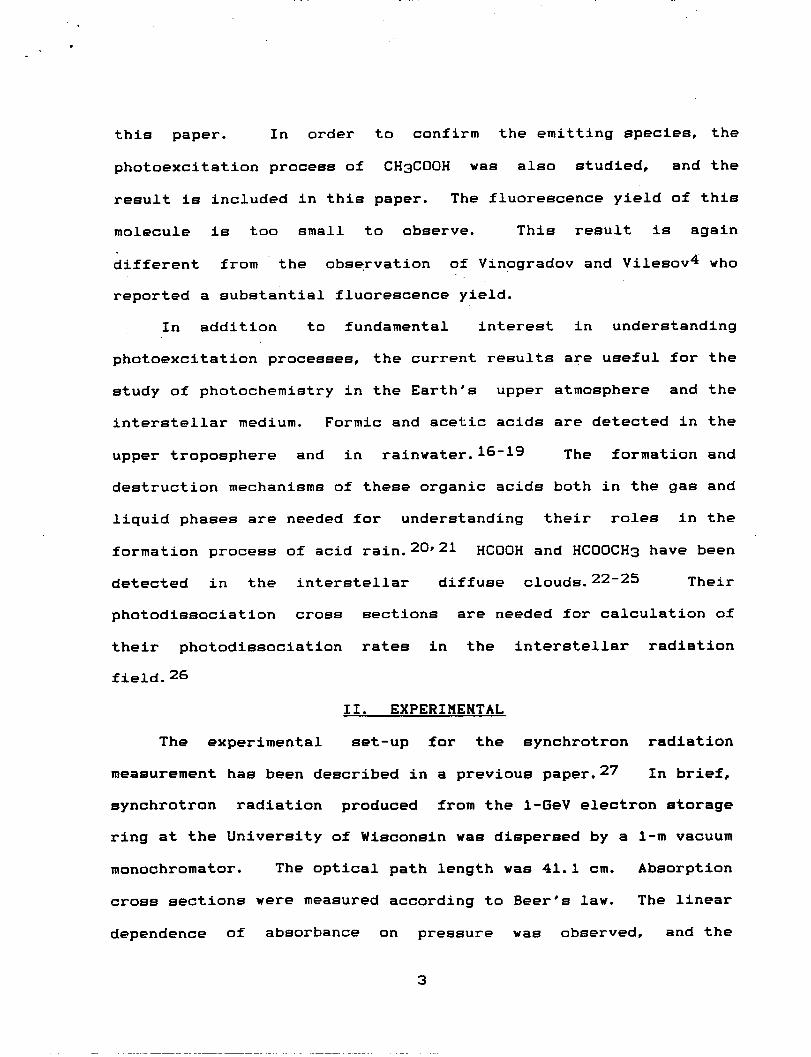
When one atmosphere of He was added to the gas cell,
vibrational bands of the emission from HCOOH and HCOOCH3
photolysis appear in the fluorescence spectra as shown in Fig. 2.
This is due to rotational and vibrational relaxation of the
excited state(s) to low vibrational level(s) by collision with
added helium. The vibrational structure is related to the
vibrational progression(s) of the lower state. The vibrational
bands are classified into two vibrational progreseions with an
average frequency spacing of 1195 cm-1. These progressions are
shifted to each other by about 690 cm-1. It is noted that the OH
emission bands also become sharper when He is added.
5
.
Style and Wardl have observed emissions from photoexcitation
of HCOOH, DCOOH, DCOOD, HCOOMe and HCOOEt. The emission spectra
are similar when hydrogen atoms were replaced by deuterium. The
fluorescence spectra from methyl and ethyl formates were very
similar to that of HCOOH except for broadening. . Thus, they
concluded that the emitting species responsible for this blue
fluorescence in the 330-500 nm region is the HCOO radical.
Later, Peacock et al.3 reexamined this emission system by
molecular orbital calculation and concluded that the fluorescence
is indeed due to HCOO. The blue emission was also observed from
the collisions of HCOOH with metastable Ar (3P2,o) atom.30 The
current results further confirm that the emitting species is the
HCOO radical, but not COOH.
For the HCOOH photolysis, the OH fluorescence intensity is
only about 8% of the HCOO emission as shown in Fig. l(a). This
is quite different from the result of Vinogradov and Vilesov who
did not report the HCOO emission.4 The OH emission may partly
originate from the photolysis of H20 which may exist as
impurities. However, the H20 contribution may not be
significant, because the H20 spectra do not appear in the
absorption and fluorescence excitation spectra of HCOOH as
discussed in the next section.
The fluorescence spectrum from the photolysis of HCOOCH3 in
the 300-350 nm region (see Fig. l(b)) is mainly due to the OH(A-
X) emission. It may possibly contain the CH30(A-X) system31.
The CH3O emission may be produced from photolysis of HCOOCH3.
c -
6
However, it is not certain whether the CH30 emission is present,
because characteristic vibrational strucure of the CH30
emission31 is not clear in Fig.l(b). The OH emission is likely
from the H20 impurities. Since the fluorescence cross section of
HCOOCH3 is relatively small (as discussed in the next section),
the OH emission shows up more distinctly in Figs. l(b) and 2(b).
B. Photoabsorption and Fluorescence Cross Sections
B . l HCOOH
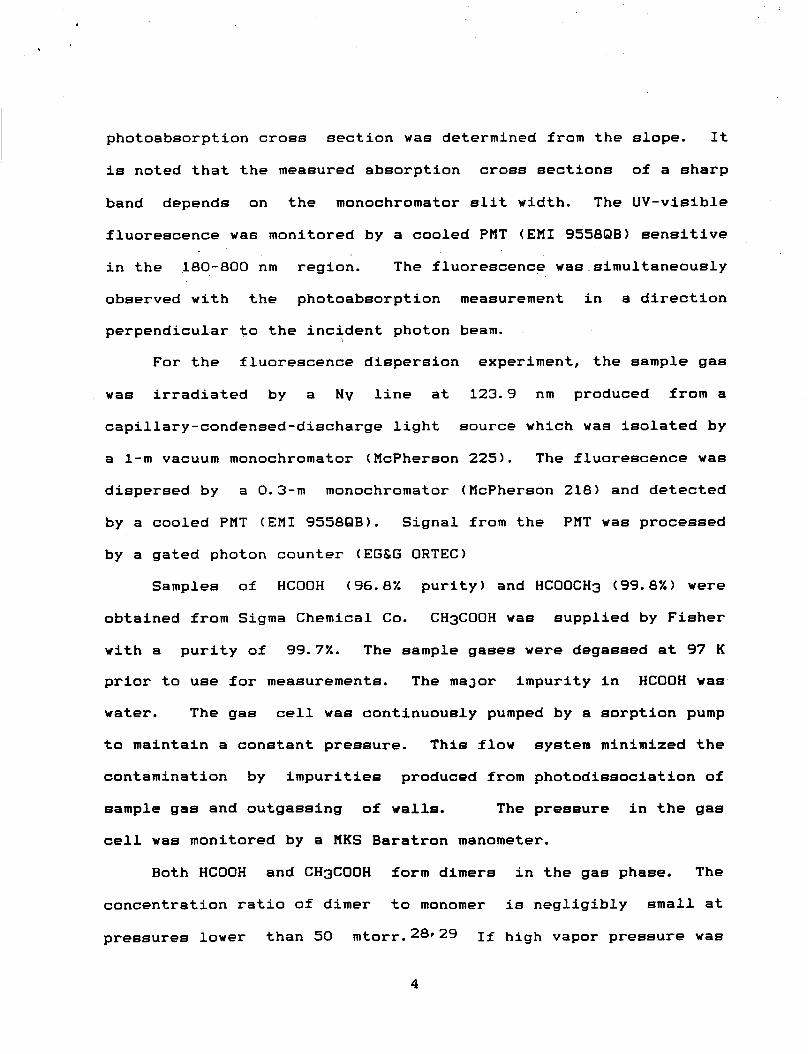
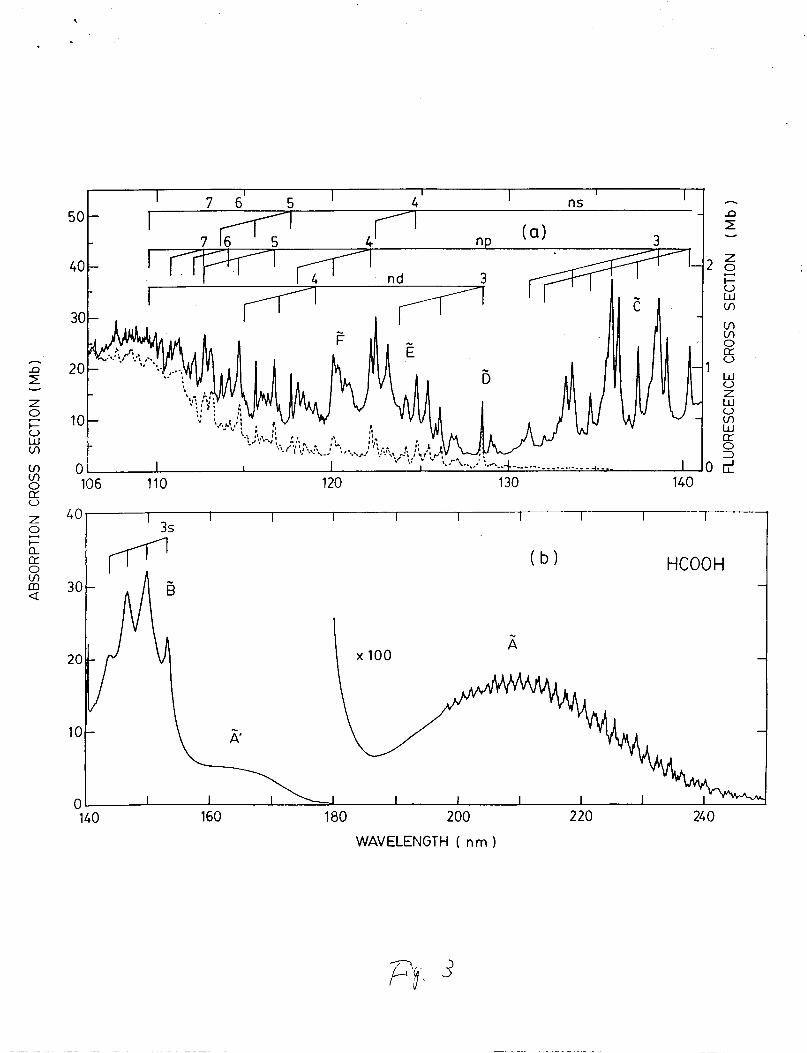
The absorption cross section of HCOOH was measured in the
106-250 nm region as shown in Figs. 3(a) an (b). In the 106-180
nm region, the absorption cross sections were measured at low gas
pressure so that the data were free from the interference of
dimers. The experimental uncertainties are estimated to be + 10%
of the given values. Present values agree well with those
measured by Barnes and Simpson,5 except that the current peak
cross sections are generally higher than theirs because of high
monochromator resolution in the current work. The data of
Nagakura et a1.9 are higher than the current ones.
Since the absorption cross section in the 180-250 nm region
is very small, relatively high pressures (up to 1 torr) were used
for the measurement. HCOOH tends to form dimers at high
pressure. For example, in 1 torr of HCOOH vapor, about 30% of
the molecules are dimers.28r29 The absorption cross sections of
HCOOH monomer and dimer have been extensively studied by
7
Singleton et al.15 The dimer effect is not corrected for the
absorption spectrum shown in Fig. 3(b).
The excited states of HCOOH have been studied by the
photographic absorption spectra8’10 and
spectrum.11,12 Three Rydberg series converging to the ionization .
the electron-energy-loss
limit at 109.41 nm (11.332 eV132-34 were classi€ied with quantum
defects of 0.85, 0.6 and 0.14 for the transitions of s, p and d
Rydberg orbitals, respectively. 8, 10 The early members of each
series have vibrational progressions with a vibrational frequency
of about 1500 cm-1. The vibrational frequency and the intensity
pattern are very similar to the photoelectron spectrum of the
ground state of the HCOOH ion.3Sr36
The ground state of the ion is planar and the vibrational
frequency of C=O stretching ( v 3 mode) is about 1500 cm-1, while
the ground state of neutral HCOOH is non planar and the v 3
vibrational frequency is 1770 cm-1. The Rydberg states assigned
by Bell et al.1° and the excited states classified by Herzberg37
are indicated in Fig. 3. Fridhll has reclassified the Rydberg
states into three p type Rydberg series (npa’a, npa’r and npa”).
The npa’a and npa’n series correspond to the ns and np series of
Bell et al.lO, respectively. The first mumber of npa” series
exists in the c“ state. The nd series of Bell et al.1° is
assigned to the nsa’ series with 6=1.14, in which the first
member at the D state is the 488’ state. N
k (r
The presence of valence states in the region of the C and B
states has been discussed by Robin.13 The no ----+ o * valence
8
e transition may exist around 138 nm (C state).13 The 6 state has been assigned to the no --3 3s Rydberg transition by Bell et
al.10, but it was assigned to the n 2 --3 n* valence transition by
Barnes and Simpson.5 The broad continuum in the 160-185 nm
region has been assigned to the v 2 --3 n* valence transition by
Bell et al.10 and Nagakura et al.9, but it was assigned to the
3sa’ Rydberg state by Fridh.11 The A state in the UV region is
assigned to the no --3 n* valence transition. The long
vibrational progression in the 225-260 nm region has a frequency
of 1080 cm-1 (v3, C=O stretching mode) associated with sub-bands
of 400 cm-1 ( V 7 , OCO bending mode), which has been investigated
by Ng and Bell.7
rr
Fluorescence was observed from the photolysis of HCOOH at
excitation wavelengths shorter than 140 nm. Emissions are due to
HCOO and OH radical8 as discussed above. At low gas pressure,
the fluorescence intensity is given by,
If = CFafIn (1)
where C is the geometrical constant, F is the detection
efficiency of the PMT, Of is the fluorescence cross section, I is
the intensity of dispersed synchrotron radiation , and n is the concentration of the sample gas. Equation (1) is valid only when
the loss of the excited fragments due to quenching can be
neglected. The detection efficiency of the PMT is considered to
be same for both emissions of OH at 310 nm and HCOO at 350-500
nm. Thus, CF in Equation (1) can be evaluated by measureing the
OH emission intensity from the photolysis of H20, of which
9
fluorescence cross section is known.Z7 The fluorescence
intensity from HCOOH photolysis was converted to the absolute
fluorescence cross section. The cross section for the production
of fluorescence in the 200-800 nm region is shown in Fig. 3(a).
The experimental uncertainty is about 30% of the given values.
The fluorescence cross section in the 130-140 nm region is very
small. The fluorescence excitation spectrum generally follows
the absorption spectrum, except for a small difference in the
120-130 nm region.
In the fluorescence cross section measurements, optical
filters were used to isolate the HCOO emission from the OH band.
The fraction of the OH emission in the total fluorescence cross
section shown in Fig.3(a) is estimated to be less than 10%.
This result is consistent with the fluorescence dispersion
experiment that the HCOO emission is dominant. The contamination
from water impurity is very small, because the characteristic
bands of H 2 0 do not show up in both the absorption and
fluorescence excitation spectra of Fig. 3(a).
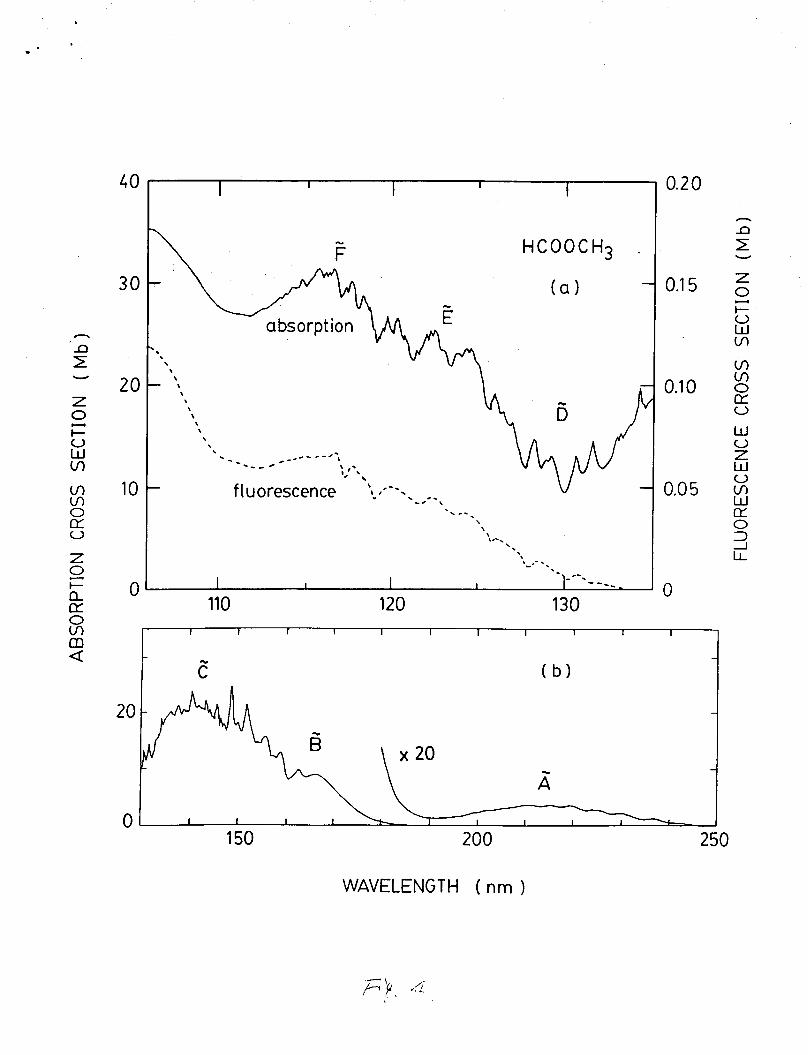
B. 2 HCOOCHn
The absorption cross section of HCOOCH3 was measured In the
106-250 nm region as shown in Figa. 4(a) and 4(b). The current
measurement agrees with the data of Barnes and Simpson in the
124-250 nm region.5 The absorption spectrum shows band structure
superimposing on continua. The absorption spectrum of HCOOCH3 is
similar to that of HCOOH. By analogy with HCOOH, the excited
states of HCOOCH3 are labelled as shown in Fig. 4. The A state *
10
.
is probably the no --3 T I * valence transition with a weak
vibrational band of frequency about 980 cm-1. The absorption
bands are likely the Rydberg states converging to the first
ionization potential at 10.815 eV (114.64 nml.33 Some of the
prominent peaks in the C.and D states are separated by about 1400 CI r,
cm-1, which is likely the C=O stretching vibration as observed in
HCOOH and CH3COOH. In the and states, there are a number of
weak vibrational subbands with frequencies of 200-400 cm'l,
Fluorescence from photoexcitation of HCOOCH3 appears at
excitation wavelengths shorter than 134 nm. The fluorescence
cross section is shown in Fig. 4(a). The fluorescence excitation
spectrum follows the absorption spectrum, except for fine
structure that is not apparent in the fluorescence excitation
spectrum. The fluorescence cross section of HCOOCH3 is about one
order of magnitude smaller than that of HCOOH, in contrast to the
absorption cross section being the same order of magnitude. The
contamination by water impurity is small, because the
characteristic bands of H20 do not appear in both absorption and
fluorescence excitation spectra.
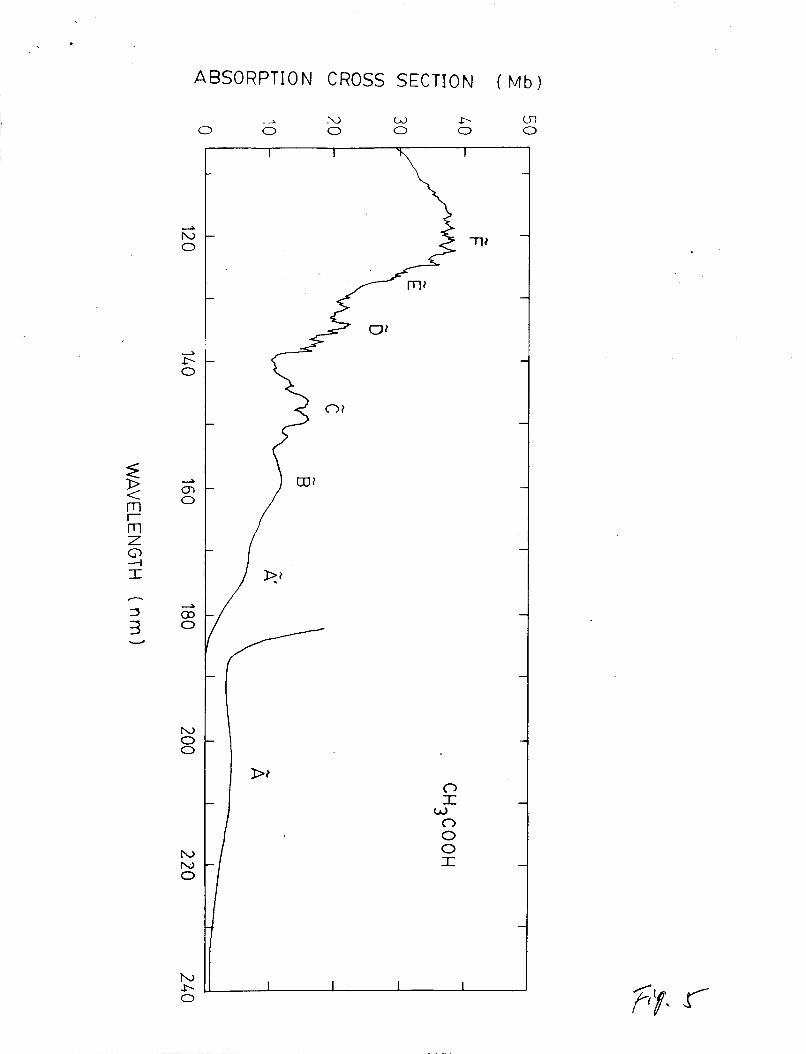
B. 3 CH3COOH
In order to conform the emitting species from HCOOH and
HCOOCH3, the photoabsorption and fluorescence cross sections of
CH3COOH were also investigated in this experiment. The
absorption Cross section in the region of 106-240 nm is shown in
Fig. 5. The absorption spectral envelope agreee generally with
those of Bell et a1.I0 and Barnes and Simpson.5 However, the
11
current absolute values are generally lower than those measured
by Barnes and Simpson in the 125-250 nm region5 and Nagakura et
a1.9 in the 155-190 nm region. The absorption cross sections at
wavelengths longer than 190 nm are small; thus, high gas
pressures (up to 0.7 torr) were used for the measurement. The
dimers may contribute to the measured absorption cross section,
for which the correction is not applied.
Absorption of CH3COOH consists of several broad bands
superimposing on continua. The excited states were labelled as
A, i*, E, C, etc., by Bell et al.10, in analogy with HCOOH. The
A ' state was not observed by Nagakura et al.9 The excited states
at wavelengths shorter than 155 nm are likely the Rydberg series
converging to the first ionization potentials at 10.35 eV32 or
10.644 eV.34 Vibrational structures appear in the E, 5, and E states. The vibrational frequency is about 1450 cm-1, which
corresponds to the C=O stretching frequency.10
c a -
d
No detectable fluorescence was observed from photoexcitation
of CH3COOH in the entire wavelength region studied. The
fluorescence cross section of CH3COOH is smaller than a detection
limit of 5x10'21 cm2. The result of the synchrotron radiation
experiment is consistent with the fluorescence dispersion
experiment shown in Fig.l(c) that the fluorescence signal I s not
detectable.
C. Fluorescence Yields
The fluorescence quantum yield l e defined as a ratio of
fluorescence cross section to absorption cross section. The
12
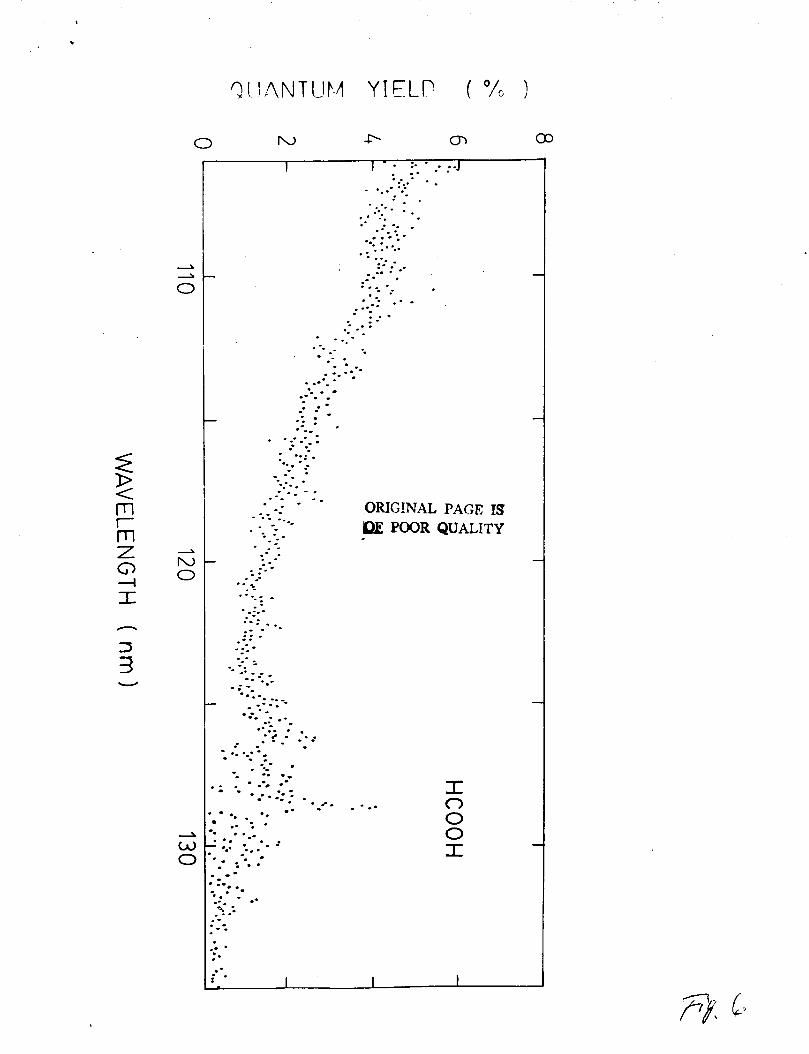
fluorescence yield of HCOOH is shown in Fig. 6. The yield
increases with decreasing wavelength with a value of about 5% at
106 nm. This trend is consistent with the result of Vinogradov
and Vilesov,4 although they attributed of the emission to the OH
system in contrast to the current study. .
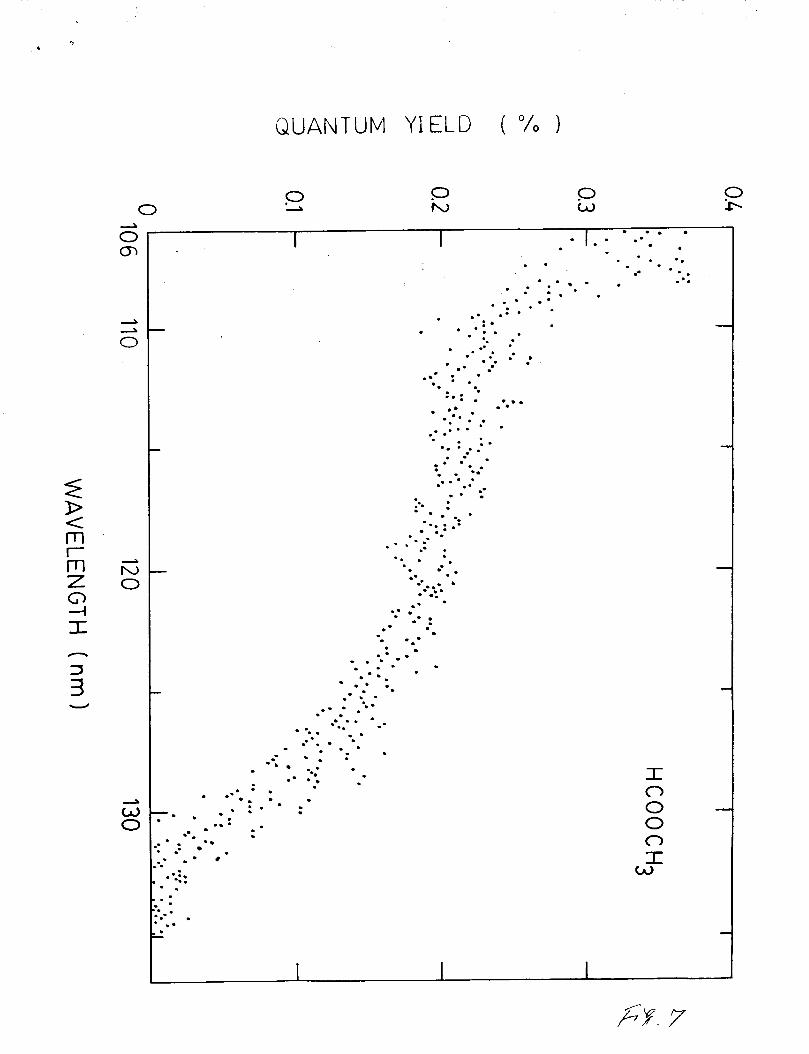
The quantum yield of fluorescence from the photolysis of
H C O O C H 3 is shown in Fig. 7. The fluorescence yield starts to
appear around 134 nm and increases with decreasing excitation
wavelength. The maximum yield is about 0.3% at 106 nm, which is
much smaller than that of HCOOH. This small yield may be caused
by the fact that H C O O C H 3 has higher degree of freedom than HCOOH
such that the probability for dissociation into the emission
channel is small. Similar trends are observed in many cases, for
example, H C N 3 8 versus C H 3 C N 3 9 and H 2 O 2 7 versus C H 3 0 H . 4 0
The quantum yields of emission from HCOOH and H C O O C H 3
photolysis are essentially a smooth function of the excitation
wavelength, except for HCOOH in the 125-135 nm region, where
structure is observed. The fluorescence yield is a measure of
the interaction strength between the initial excited state and
the dissociative states that produce the emitting species. The
smooth function of the quantum yield indicates that the
interaction strength is the same regardless the initial excited
state is a continuum or a discrete state.
The upper limit for the fluorescence yield from CH3COOH is
estimated to be 0.02%. This value is much smaller than the data
of Vinogradov and Vilesov4, who reported a significant
13
fluorescence yield at wavelengths shorter than 125 nm. Their
value at 106 nm is 0.2%.
D. Photodissociation Processes
The possible dissociative processes of HCOOH that produce
the emitting species are;
HCOOH -+ HCO + OH (2) - HCOO + H (3)
The enthalpy changes in processes ( 2 ) and (3) are 110.2 and 166.6
kcal/mol, respectively.41'42 The threshold wavelength to produce
OH*(A) by process ( 2 ) is 140.4 nm. Vinogradov and Vilesod
determined the threshold to be at (141 f 1) nm. However, the
current result of Fig. 3(a) does not show significant
fluorescence cross section at wavelengths longer than 135 nm.
The potential energy of the excited state of HCOO is not known.
Since HCOO emits at wavelengths longer than OH, the threshold
wavelength for producing the HCOO emission must be longer than
140 nm. The observed fluorescence threshold at 135 nm is shorter
than the expected value.
The possible dissociative processes of HCOOCH3 that produce
the emitting species are,
HCOOCH3 --9 HCO + C H ~ O (4)
--3 HCOO + CH3 (5)
The enthalpy changes in ( 4 ) and (5) are 97.5 and 82.42 kcal/mol,
The threshold to produce the HCOO emission
via process ( 5 ) is estimated at about 174 nm assuming that the
(0-0) transition of the HCOO emission is around 350 nm. The
14
observed threshold at 134 nm is much shorter than estimated. The
fluorescence intensity at the calculated threshold is too weak to
be detectable; this may be caused by the unfavorable Franck-
Condon factor for the production of the emitting species at the
threshold and/or by a potential barrier between the initial
excited state and the dissociative channel that produces the
emitting species.
The photodissociation processes of HCOOH in the UV region
have been studied recently. The quantum yield of process (2) is
about 1 at 222 nm.43 It is likely that process ( 2 ) is alao a
major channel in the VUV region, although no quantitative data
are available. Other channels such as HCOO+H, H2+C02, etc., are
possible at high excitation energy. Since the fluorescence
yields are so small, the photoexcitation of HCOOH in the VUV
region may mostly produce fragments in the electronic ground
states. In that case, large excess energy may be dissipated a8
kinetic, rotational and vibrational energies of fragments.
CONCLUDING REMARKS
Photoabsorption and fluorescence cross sections of HCOOH,
HCOOCH3, and CH3COOH were measured in the 106-260 nm region using
synchrotron radiation as a light source. The fluorescence
spectra were dispersed and identified as the OH(A-X) and HCOO
systema. The fluorescences were observed from HCOOH and HCOOCH3
at excitation wavelengths shorter than 140 and 134 nm,
respectively. The fluorescence yields increase with decreasing
15
wavelengths with maximum yields of 5% for HCOOH and 0.3% for
HCOOCH3 at 106 nm. No emissions was detected from VUV photolysis
of CH3COOH.
ACKNOWLEDGEMENT
The authors are grateful to the staff of the Synchrotron
Radiation Center (SRC) at the University of Wisconsin for
providing the VUV light source. The SRC facility is supported by
the NSF. This material is based on the work supported by the NSF
and the NASA.
16
1.
2.
3.
4.
5.
6.
7.
8.
9.
10.
11.
12.
13.
14.
15.
REFERENCES
Style, D. W. G. ; Ward, J. C., J. Chem. SOC. 1952, 2125.
Style, D. W. G.; Ward, J. C., Trans. Faraday SOC. 1953, 49.
999.
Peacock, T. E.; Rahman, R. -U. ; Sleeman, D. H.; Tuckley, E.
S. G., Disc. Faraday SOC. 1963, 35. 144.
Vinogradov, I. P.; Vilesov, F. I., Khlm. Vys. Energ. 1977,
li, 25.
Barnes, E. E. ; Slmpson, W. T., J. Chem. Phys. 1963, 39. 670.
Sugarman, B., Proc. Phys. SOC., 1943, 55, 429.
Ng, T. L. ; Bell, S., J. Mol. Spectrosc. 1974, 50. 166.
Price, W. C. ; Evans, W . M., Proc. R. SOC. London, 1937,
A 162, 110.
Nagakura, S.; Kaya, K.; Tsubomura, H., J. Mol. Spectrosc.
1964, 13, 1.
Bell, S. ; Ng, T. L. ; Walsh, A. D., J. Chem. SOC. Faraday 2,
1975, 71. 393.
Fridh, C., J. Chem. SOC. Faraday 2, 1978, 74, 190.
Ari, T; Hasted, J. B., Chem. Phys. Lett. 1982, 85. 153.
Robin, M. B., "Higher Excited States of Polyatomic
Molecules," Vol. 3, Academic, New York, 1985.
Wine, P. H.; Astalos, R. J.; Mauldin 111, R. L., J. Phys.
Chem. 1985, 89. 2620.
Singleton, D. L.; Paraskevopoulos, G.; Irwin, R. S. J.
Photochem., 1987, 37, 209.
17
16. Dawson, G. A.; Farmer, J. C.; Moyers, J. L., Geophys. Res.
Lett. 1980, 725.
17. Goldman, A.; Murcray, F. H.; Murcray, D. G.; Rinsland, c. P., Geophys. Res. Lett., 1984, 11, 307.
18. Galloway, J. N.; Linkins, G. E.; Keene, W. C.; Miller, J.
M., J. Geophys. Res. 1982, 87. 8771.
19. Keene, W. C. and Galloway, J. N., J. Geophys. Res. 1986, 91.
14,466.
20. Chameides, W. L.; Davis, D. D., Nature, 1983, 304. 427.
21. Chameides, W. L., J. Geophys. Res. 1984, 89, 4739.
22. Churchwell, E.; Nash, A . ; Rahe, J.; Walmsley, C. M.;
Lochner, 0.; Winnewisser, G., Astrophys. J. 1980, 241. L169.
23. Ellder, J.; Friberg, P. ; Hjalmarson, A.; Hoglund, B. ;
Irvine, W. M.; Johansson, L. E. B.; Olofsson, H.; Rydbeck,
G.; Rydbeck, 0. E. H.; Guelin, M., Astrophys. J. 1980, 242.
L 9 3 .
24. Dalgarno, A. ; Black, J. H., Rep. Prog. Phy-e., 1976, 39, 573.
25. Watson, W. D., Rev. Mod. Phys. 1976, 48. 513.
26. Lee, L. C., Aetrophys. J. 1984, 282. 172.
27. (a) Lee, L. C., J. Chem. Phys. 1980, 72. 4334 : (b)
Lee,L.C.; Suto, M., Chem. Phys. 1986, 110, 161
28. Halford, J. O., J. Chem. Phys. 1942, 10, 582.
29. Barton, J. R.; Heu, C. C., J. Chem. Eng. Data 1969, 14, 184.
30. Clyne, M. A. A. ; Coxon, J. A. ; Setser, D. W. ; Stedman, D.
H., Trans. Faraday SOC. 1969, 65, 1177.
31. Wantuck, P. J.; Oldenborg, R. C.; Baughcum, S. L.; Winn, K.
R., J. Phys. Chem. 1987, 91. 3253.
32. Watanabe, K., J. Chem. Phys. 1957, 26, 542.
33. Watanabe, K.; Nakayama, T.; Mottl, J., J. Quant. Spectrosc.
34.
35.
36.
37.
38.
39.
40.
41.
42.
43.
Radiat. Transfer.. 1962, & 369.
Knowles, D. J.; Nicholson, A. J. C., J. Chem. Phys. 1974,
60, 1180.
Brundle, C. R.; Turner, D. W.; Robin, M. B.; Basch, H.,
Chem. Phys. Lett. 1969, 3_1 292.
Watanabe, I.; Yokoyama, Y.; Ikeda, S., Chem. Phys. Lett.
1973, 19, 406.
Herzberg, G., "Electronic Spectra and Electronic Structure
of Polyatomic Molecules," Van Nostrand Reihold, New York
1966.
Lee, L. C., J. Chem. Phys. 1980, 72, 6414.
Suto, M. ; Lee, L. C., J. Geophys. Res. 1985, 90. 13037.
Nee, J. B. ; Suto, M. ; Lee, L. C., Chem. Phys. 1985, 98. 147.
Benson, S. W. "Thermochemical Kinetics, Wlley, New York
1976.
Chase Jr., M. W.; Davles, C. A.; Downey Jr., J. R.; Frurlp,
D. J.; McDonald, R. A. : Syverud, A. N., "JANAF
Thermochemical Table, " 3rd ed., J. Phys. Chem. Reference
Data, 1985, 14. Suppl. 1.
Jolly, G. S . ; Singleton, D. L.; Paraskevopoulos, G., J.
Phys. Chem. 1987, 91. 3463.
19
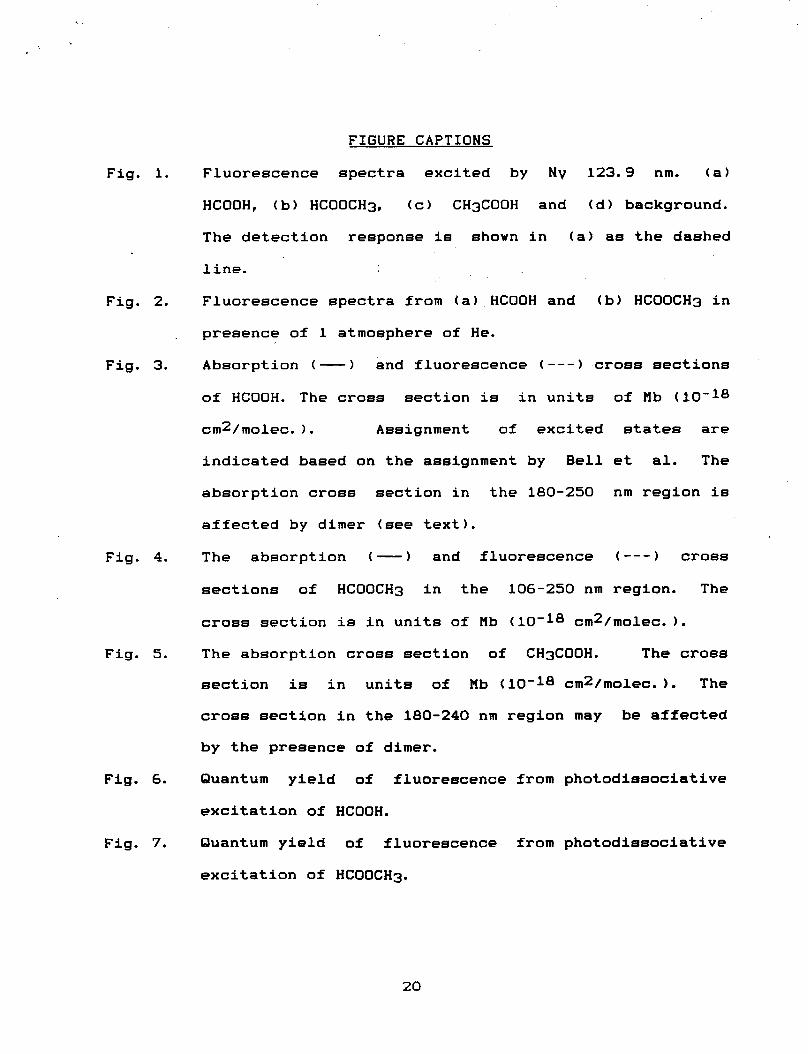
FIGURE CAPTIONS
Fig. 1. Fluorescence spectra excited by NV 123.9 nm. (a)
HCOOH, (b) HCOOCH3, (c) CH3COOH and (d) background.
The detection response is shown in (a) as the dashed
line.
Fig. 2. Fluorescence spectra from (a) HCOOH and (b) HCOOCH3 in
presence of 1 atmosphere of He.
Fig. 3. Absorption ( -1 and fluorescence ( - - - ) cross sections
of HCOOH. The cross section is in units of Mb (10-18
cm2/molec. 1. Assignment of excited states are
indicated based on the assignment by Bell et al. The
absorption cross section in the 180-250 nm region is
affected by dimer (see text).
Fig. 4. The absorption ( - ) and fluorescence ( - - - ) cross
sections of HCOOCH3 in the 106-250 nm region. The
cross section is in units of Mb (10-18 cm2/molec.).
Fig. 5. The absorption cross section of CH3COOH. The cross
section is in units of Mb (10-18 cm2/molec.). The
cross section in the 180-240 nm region may be affected
by the presence of dimer.
Fig. 6. Quantum yield of fluorescence from photodissociative
excitation of HCOOH.
Fig. 7. Quantum yield of fluorescence from photodissociative
excitation of HCOOCH3.
20
0 0 Ln
0 0
3 3 M
40
30
20
10
0
h
n 2
z k- 0 w v,
v, m 0 CK 0
W 0 z W 0 m W CK 0
v
2
2 106 110 120 130 140
140
I 3s I 1 r - I I I
( b
I I I
HCOOH
160 180 200
WAVELENGTH ( nm) 220 24 0
n
n z Z 0 I- O w v, m m 0 Ly 0
Z 0
[L [r 0 m
Y
-
c. t-
m a
40
30
20
10
0
I I I I I
5
F HCOOCH3 .
’ .-. fluorescence t-’ . . c.
110 120 130
0.20
0.1 5
0.1 0
0.0 5
0
150 200
WAVELENGTH ( nm )
250
h
13 z z 0 I- O W m I/) m 0 CK O
w O Z w O m W Ly 0 3
U
U
ii
ABSORPTION CROSS SECTION ( M b )
-3
0 0 0 W L-. 0 0
m Z 0
I -i
U
h, h, 0
h, .b 0
c, I 0 0 0 I
W
ORIG!NAL PAGE IS QZ POOR QUALITY
.. .' , . 9. . ..:e '. . . . .. -- . . - 5' =*. . - - -. .-- *
' -*: .- . . .= . - -
*. . .-. .* -*. : .-- .- . - -.
.- * 0 . .- : * I
. - .* r 0 0 0 I
QUANTUM YIELD ("10
0 p 2
P h,
0 W
0 -* I I . .. . - .-
* . . -. . . -.* ' - . .-. *: - . . . . .. -
* . * . = . e * .. .- -
*:a ., . . . ._ .
. .
0 . . **. . . . .- . .- ..
I 0 0 0 0 I w
I 1 I
Appendix D
CH(A-X, B-X) Emleeions from Photodissociative Excitation of CH3
,
CH(A-X, B-X) Emissions from Photodissociative Excitation
of CH3
Chao Ye, Masako Sutoa) and L. C. Leeb)
Department of Electrical and Computer Engineering San Diego State University San Diego, California 92182
ABSTRACT
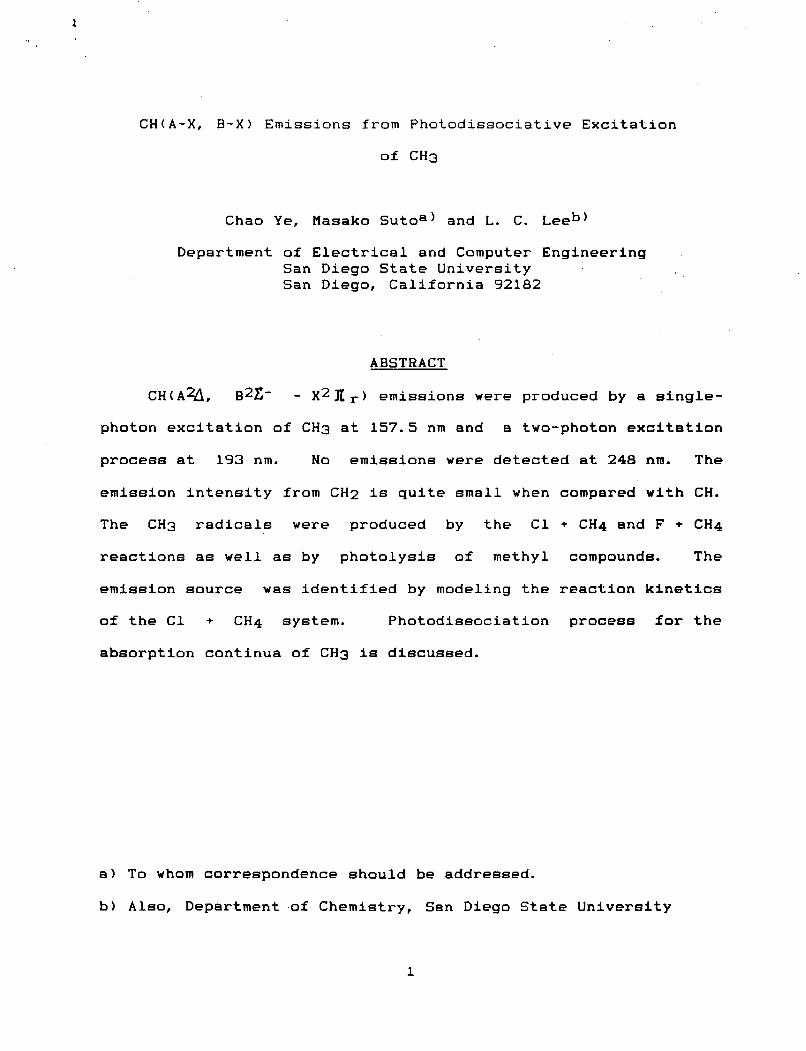
CH(Aq, B2Z- - X2gr) emissions were produced by a single-
photon excitation of CH3 at 157.5 nm and a two-photon excitation
process at 193 nm. No emissions were detected at 248 nm. The
emission intensity from CH2 is quite small when compared w i t h CH.
The CH3 radicals were produced by the C1 + CH4 and F + CH4
reactions as well as by photolysis of methyl compounds. The
emission source was identified by modeling the reaction kinetics
of the C1 + CH4 system. Photodissociation process for the
absorption continua of CH3 is discussed.
a) To whom correspondence should be addressed.
b) Also, Department .of Chemistry, San Diego State University
1
.
I. INTRODUCTION
Methyl radical is an active chemical species involved in
hydrocarbon combustion, atmospheric methane oxidation cyclel, and
interstellar molecule formatibn process2. Recently, it is also
found that CH3 radical could lead to formation of diamond film3.
The spectroscopic information of CH3 is of interest for these
applications and for the fundamental study of photodissociation
process as well.
CH3 has been extensively studied in vacuum ultraviolet (VUV)
and ultraviolet (UV) absorption4p 5, photoelectron spectra6p 7,
photoelectron detachmente, and infrared absorption9. Molecular
orbitals, excited states and molecular geometry of CH3 are
theoretically investigated by many authorslo-14. Excited states
that are optically-forbidden for a single-photon excitation were
recently revealed by a resonance-enhanced multiphoton-ionization
methodl5-21.
Up to now, the VUV spectroBcopic etudies of CH3 are limited
to Rydberg states22. The absorption continua that have a mixed
character of Rydberg and valence transitions23 are very little
studied. The existence of absorption continua is evident by the
fact that all absorption bands are diffuse4p5. Excitation to
absorption continua could lead to excited photofragments that
consequently emit. Theoretical aspect of the CH3 photochemistry
has been discussed by Yu et al.14; but experimental data are
2
clearly needed for a better understanding of the
photodissociation process.
Emissions from excited photofragments could be used as a
sensitive means for the detection of CH3. This photofragment
method has been demonstrated in the 'detection of the H02
r a d i ~ a l ~ ~ - ~ ~ . One of the possible applications is for the
measurement of reaction kinetics. The reaction kinetics of CH3
It
I s expected that better detection sensitivity and spatial
resolution will be achieved by the photofragment detection.
Since CH3 does not emit, it can not be detected by the laser-
Induced-fluorescence technique.
have been measured by the UVZ7 and VUV28 absorption methods.
11. EXPERIMENTAL
The experimental apparatus is shown in Fig. 1. A typical
discharge flow reactor24-26 was used to produce methyl radicals
by abstraction of hydrogen from CH4 by halogen atoms (F or Cl),
which were produced by microwave discharge of a trace of F2 In He
In an alumina tube or C12 in He In a glass tube. The flow
reactor was a Pyrex tube of 1 Inch O.D. and 30 cm long coated
with Teflon. CH4 in He was introduced through a movable Inlet.
Total pressure In the reactor was typically about 2 Torr, and the
flow velocity was set at 1000-1500 cm/s.
The gas cell was a six-way stalnlese steel cross of 4 Inch
O.D. with a MgF2 window placed in front of the excimer laser.
High purity nitrogen gas continuously flushed between the laser
3
and gas cell windows for the transmission of VUV light. Laser
power was monitored through a sapphire window in the rear side of
the gas cell. The window surfaces inside the gas cell were
constantly flushed by He to prevent deposition of CHx radicals on
the surfaces. The excimer laser (Lumonics TE860-4) was operated
at a repetition rate of 20 Hz (pulse duration of 6 ns). The
laser beam was not focused.
Fluorescence was observed through a fused quartz window in a
direction perpendicular to the laser beam. The fluorescence was
dispersed by an 0.25 m spectrometer (Jarrel-Ash) and detected by
a 1024 channel diode array (OMA 111, EG&G PARC). Sampling gates
opened 1 to 10 p after each laser pulse. Occasionally, the
fluorescence was dispersed by an 0.5 m monochromator (Acton) and
the output from a cooled photomultiplier tube (PMT, EMI9558QB)
was processed by a boxcar integrator (EGPG, PARC). Emission
spectra obtained by these different detection systems are all
similar. Emission spectra were taken at varied gas
concentrations, laser powers and reaction timee. A spectrum with
a good signal to noise ratio was typically obtained by an
accumulation of 2000 laser shots.
The ArF (193 nm) and KrF (248 nm) laser power was monitored
by a power meter (Scientech). The relative power of the F2 laeer
(157.5 nm) was monitored by measuring the fluorescence intensity
from photodissociation of C2F3C1. At 157.5 nm, C2F3C1
d i ~ s o c i a t e s ~ ~ into excited CFC1" which then emits. C2F3C1 flowed
slowly with a constant pressure of about 0.2 Torr in a gas cell
4
separated from the main chamber by a sapphire window. Both
C2F3C1 and CH3 simultaneously excited by the same laser beam.
The fluorescence from CFCl' was detected by a PMT (EM1 9635 QB)
with a band pass filter, and the signal was processed by a boxcar
integrator.
In the photolysis experiment, liquid sample of (CH312SO was
kept in a stainless container and degassed at liquid nitrogen
temperature. Sample of CH3C1, CH3Br or (CH3)zSO with He buffer
gas was continuously fed into the gas cell and pumped by a
mechanical pump with a cold trap. Pressure in the gas cell was
monitored by a capacitance manometer (MKS Baratron).
111. RESULTS
1. C& from the C1 + CH4 Reaction
CH3 can be produced by the reaction,
C1 + CH4 + CH3 + HC1 (1)
The reaction rate constant is about 1.0 x cm3 molec-ls-1 at
298 K30. Chemiluminescence was produced from t h e reaction. Some
chemiluminescence bands can be assigned to the CH, C12 and HC1
emissions; however, the source for the chemiluminescence is not
clear. Chemiluminescence intensity decreases rapidly with
increasing reaction time. The interference of the observed
fluorescence by chemiluminescence can be minimized by changing
the reaction time. The interference is further avoided by gating
the detection system. It is noted that the CH(A-X) band does not
appear in the chemiluminescence spectrum.
5
J
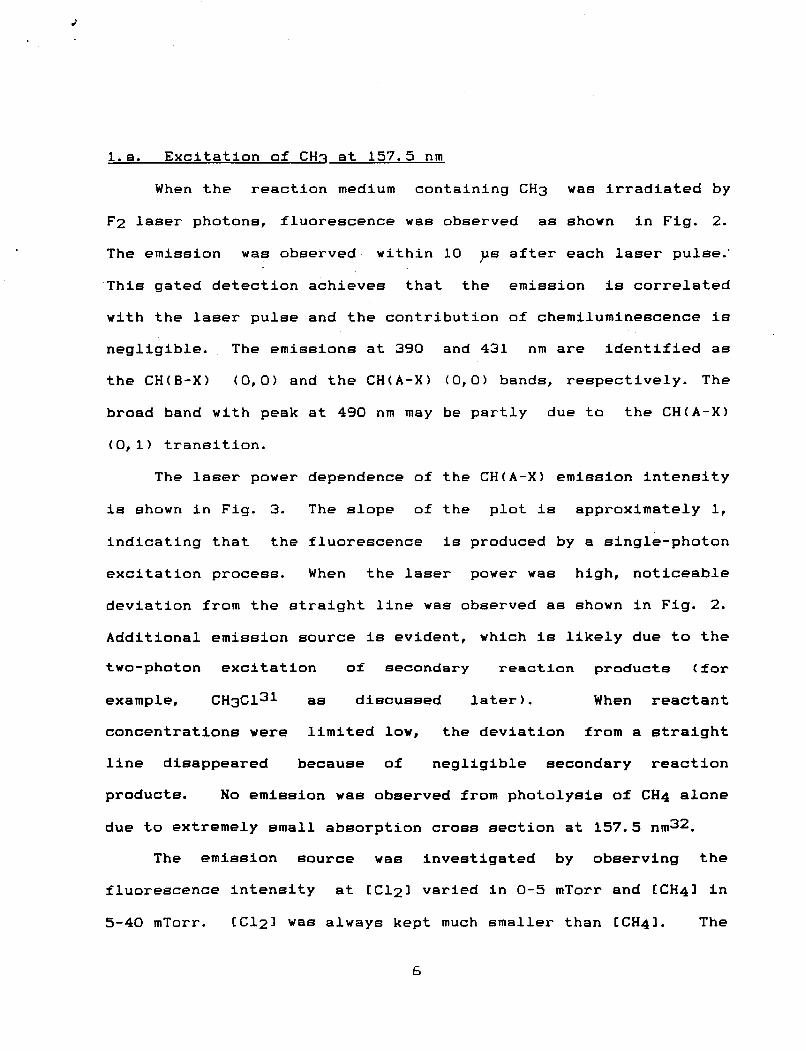
l.a. Excitation of CHn at 157.5 nm
When the reaction medium containing CH3 was irradiated by
F2 laser photons, fluorescence was observed as shown in Fig. 2.
The emission was observed within 10 ps after each laser pulse.'
This gated detection achieves that the emission is correlated
with the laser pulse and the contribution of chemiluminescence is
negligible. The emissions at 390 and 431 nm are identified as
the CH(B-X) ( 0 , O ) and the CH(A-X) (0,O) bands, respectively. The
broad band with peak at 490 nm may be partly due to the CH(A-X)
( 0 , l ) transition.
The laser power dependence of the CHtA-X) emission intensity
is shown in Fig. 3. The slope of the plot is approximately 1,
indicating that the fluorescence is produced by a single-photon
excitation process. When the laser power was high, noticeable
deviation from the straight line was observed as shown in Fig. 2.
Additional emission source is evident, which is likely due to the
two-photon excitation of secondary reaction products (for
example, C H Z C ~ ~ ~ as discussed later). When reactant
concentrations were limited low, the deviation from a straight
line disappeared because of negligible secondary reaction
products. No emission was observed from photolysis of CH4 alone
due to extremely small absorption cross section at 157.5 nm32.
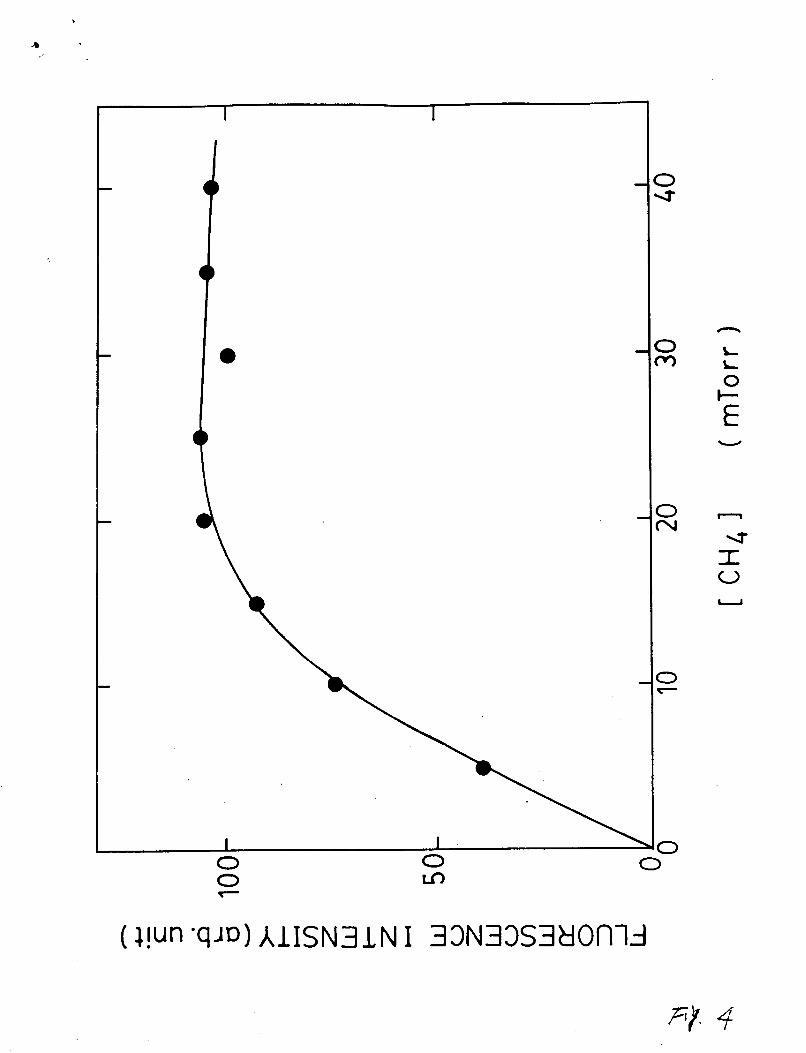
The emission source was investigated by observing the
fluorescence intensity at CC121 varied in 0-5 mTorr and CCH41 in
5-40 mTorr. CC121 was always kept much smaller than CCH41. The
6
dependence of fluorescence intensity on CCH41 is shown in Fig. 4.
The fluorescence intensity increases with low CCH41 and then
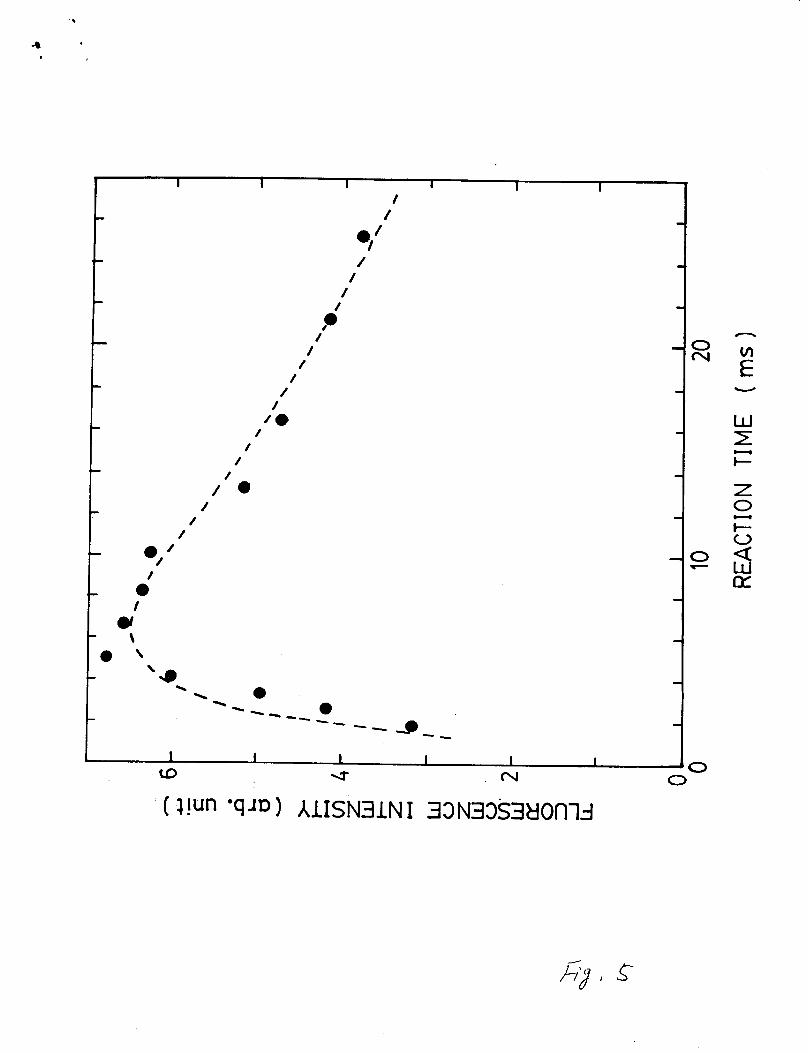
saturates at high CCH41. The dependence of fluorescence
intensity on reaction time is shown in Fig. 5. The fluorescence
intensity increases with increasing CC121 (or CC11). The
fluorescence intensity was normalized against the laser power
that decreased in the course of experiment. The fluorescence
intensity reaches a maximum within 3-6 m s and then decreases at
the long reaction time. This decrease indicates that
fluorescence arises from transient species (which is likely the
CH3 radical, a primary product of the Cl+CH4 reaction). The
other primary product, HC1, absorbs laser light with an
absorption cross section33 of 3.2 x cm2, but it dissociates
into H + C1 so that it does not fluoresce.
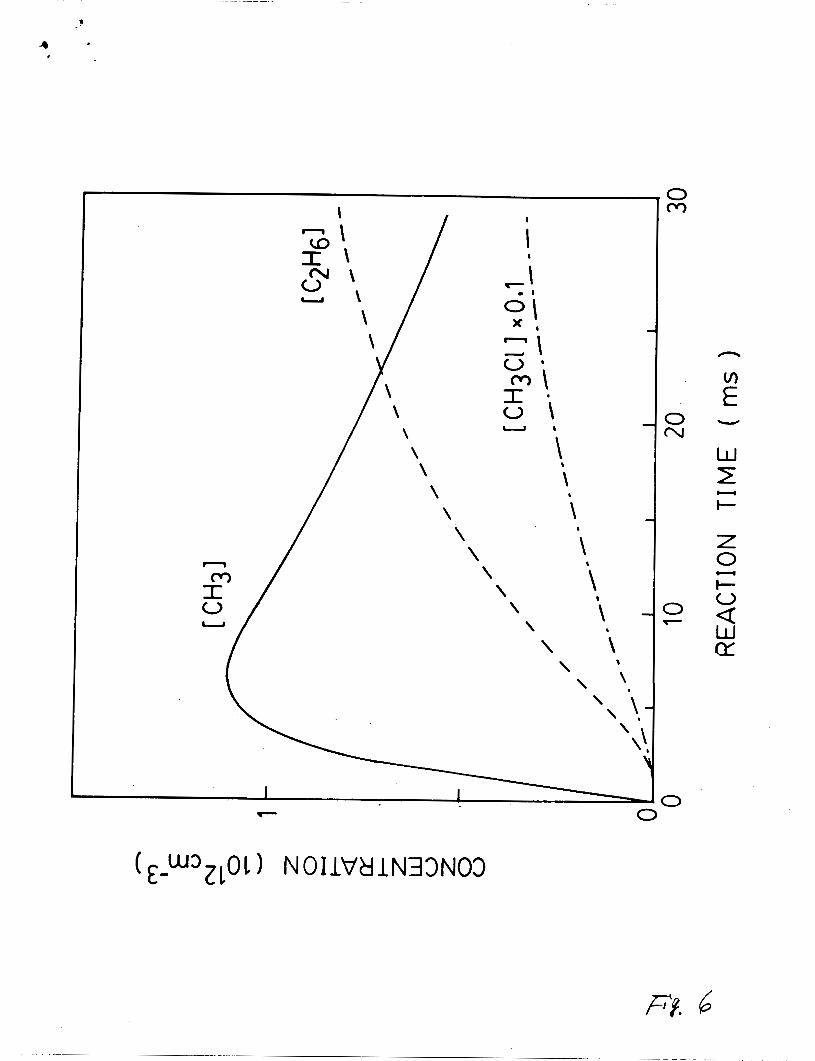
In order to check whether the CH3 radical is indeed the
emission source, the concentrations of reaction products were
simulated using a Gear routine that solves the simultaneous
reaction rate equationa34. The reactions involved in the
modeling are listed in Table I. The wall loss rate (Equation
(4) in Table I) was adjusted to best fit the observed
fluorescence data shown in Fig. 5. The reaction of C1 + CH3 +
CH2 + HC1 is not considered, because it is an endothermic process
such that this reaction does not occur. The loss of CH3 due to
reaction with CH4 is ignored, because the fluorescence intensity
was not reduced by adding CH4 as shown in Fig. 4. The calculated
profiles of CCH31, CCH3C11, and CC2H61 as a function of reaction
7
time are illustrated in Fig. 6. Both of CCH3C11 and CC2H61
increase monotonically with reaction time, but ECH31 decreases at
the long reaction time. These results corroborate with the
assertion that the CH3 radical is the source for the observed
fluorescence.
It is noted that CCH3ClI is high even at a short reaction
time, if CC121 and CCH41 are high. Thus, it is expected that the
CH(A, B-X) emissions from two-photon excitation of CH3C1 will
show up at high laser power. This explains the additional
fluorescence at high laser power as shown in Fig. 3. The
fluorescence produced by two-photon excitation of CH3C1 will be
further discussed later. Although CCH3C11 is higher than CCH31,
the probability of the two-photon excitation is expected to be
small at low laser power so that the observed fluorescence is
mainly from CH3 (see Fig. 3).
The fluorescence cross section can be estimated by comparing
the fluorescence intensity with that of C2F3C1, for which the
fluorescence cross sect ion is 6x10-18 cm2 at 157.5 nm29. If w e
assume that 10% of C12 l e dissociated by the microwave discharge,
then CC11 is in the order of 1013 cm-3, which could be mostly
converted into CCH31. With this assumption, the fluorescence
croes section of CH3 ie roughly estimated to be in the order of
10-18 cm2.
The branching ratio for the fluorescence cross sections of
CH(B-X) to CH(A-X) is about 8%. The CH2 (b-a) emission system
may exist in the continuum background shown in Fig. 2; however,
- r y
a
the identification of this emission system is difficult, because
the continuum may consist of other emission systems, for example,
the CH(A-X) ( 0 , l ) band. The branching ratio for the fluorescence
cross sections of CH2 to CH I s estimated to be less than lo%,
assuming that a half of the continuum background belongs to the
CH2 system. The CH2 system may in fact be negligibly small.
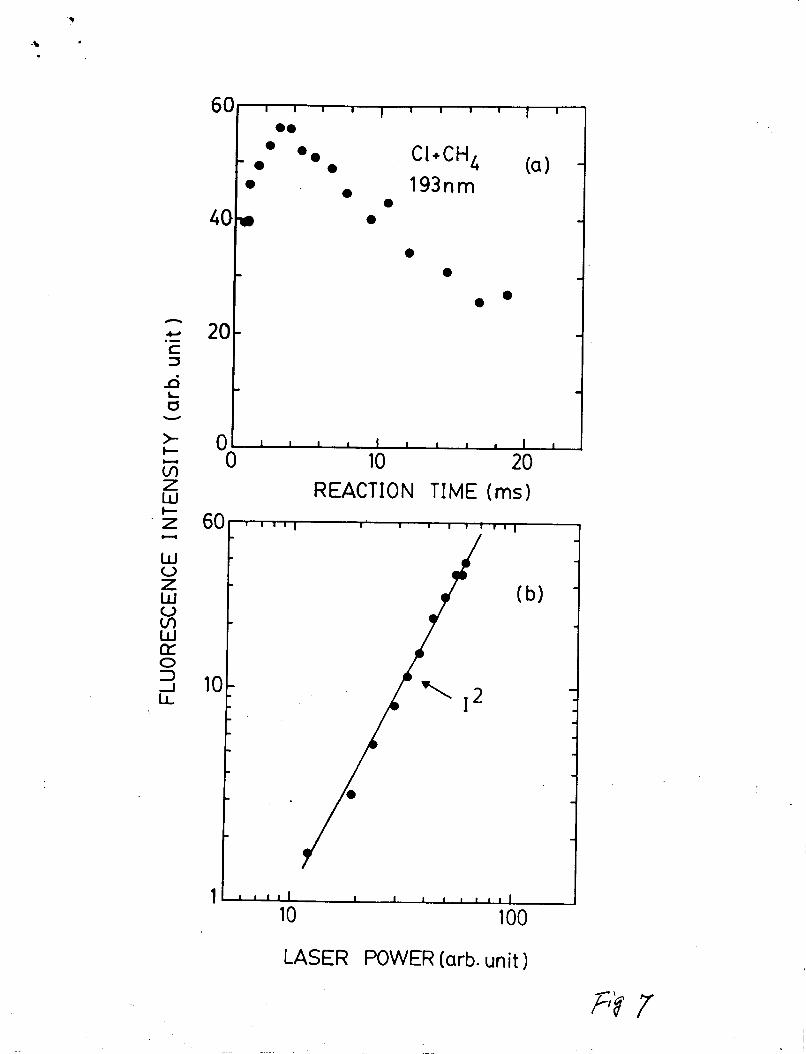
l . b . Excitation of CHn at 193 nm and 248 nm
When the C1 + CH4 reaction medium was irradiated by ArF
laser photons, CH(A, B-X) emissions were observed. The
fluorescence spectrum is very similar to that of F2 laser
excitation (Fig. 2). The dependencies of the CH(A-X)
fluorescence intensity on reaction time and laser power are shown
in Fig. 7 (a) and (b), respectively. The reaction time
dependencies are very similar to those observed In the 157.5 nm
excitation (Fig. 5); thus, it indicates that the CH emission
associates with CH3. The fluorescence intensity depends on the
square of the laser power (121, indicating that the CH(A, B-XI
emleelone are produced by two-photon excitation process.
Photofragment emission from the C1 + CH4 reaction medium was
also studied using an Xe resonance lamp (147 nm) and an KrF laser
(248 mn) as light sources. No emission was observed from
excitation of the reaction medium by KrF laser photons. When the
Xe lamp was used, the OMA was set in the CW mode. The observed
signal was too weak to distinguish from chemiluminescence. Thus,
the presence of photofragment emission at 147 nm is not certain.
9
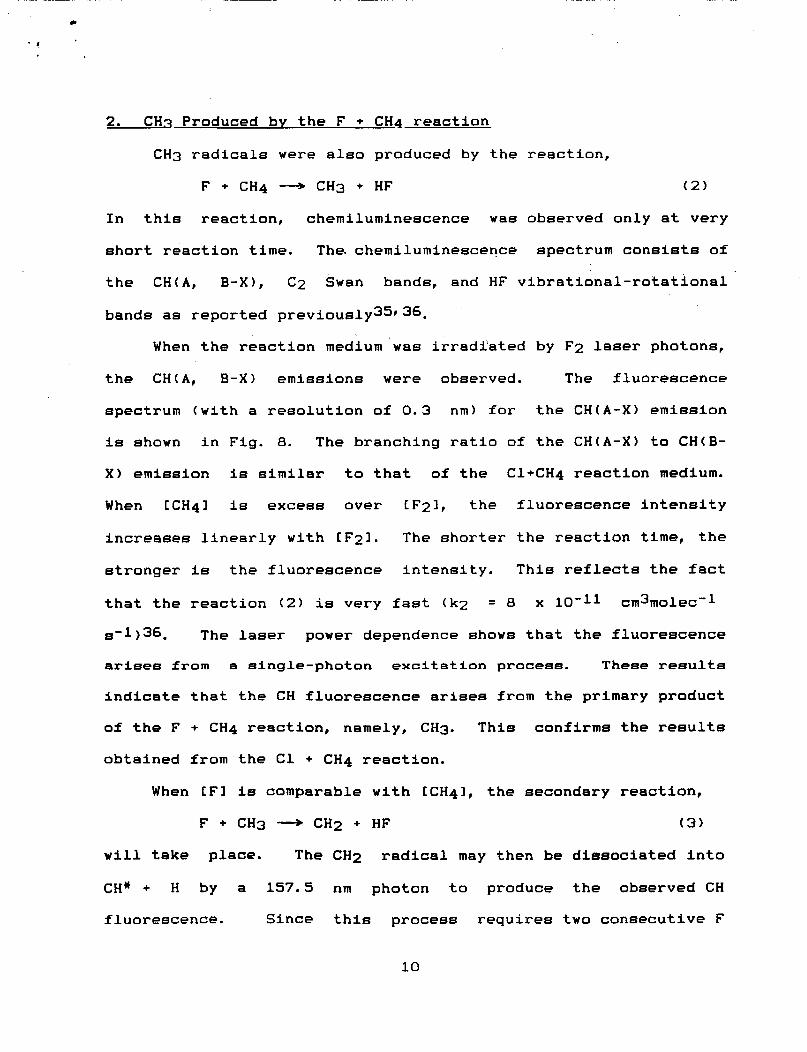
2. CHn Produced by the F + CH4 re ctia
CH3 radicals were also produced by the reaction,
F + CH4 + CH3 + HF (2)
In this reaction, chemiluminescence was observed only at very
short reaction time. The. chemiluminescence spectrum consists of
the CH(A, B-XI, C2 Swan bands, and HF vibrational-rotational
bands as reported previo~sly35~3~.
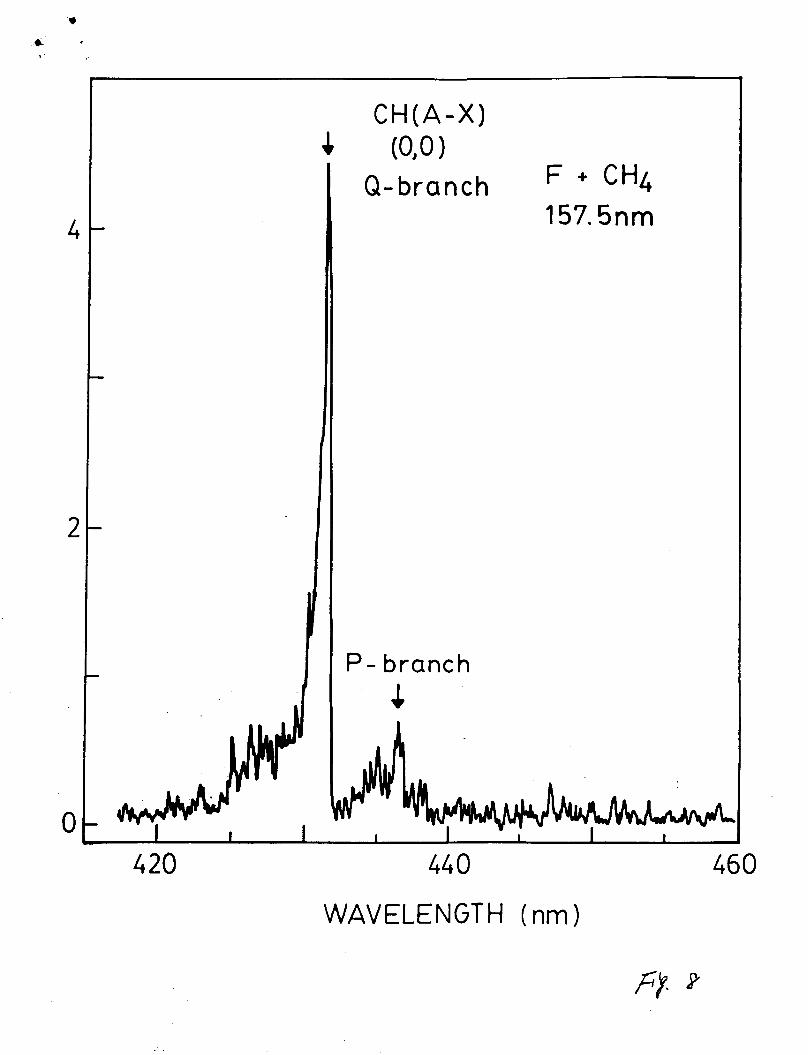
When the reaction medium was irradiated by F2 laser photons,
the CH(A, B-X) emissions were observed. The fluorescence
spectrum (with a resolution of 0.3 nm) for the CH(A-X) emission
is shown in Fig. 8. The branching ratio of the CH(A-X) to CH(B-
X) emission is similar to that of the Cl+CH4 reaction medium.
When CCH41 is excess over CF21, the fluorescence intensity
increases linearly with CF21. The shorter the reaction time, the
stronger is the fluorescence intensity. This reflects the fact
that the reaction ( 2 ) is very fast (k2 = 8 x ~ m ~ m o l e c ' ~
8-1 ) 36. The laser power dependence shows that the fluorescence
arise6 f r o m a eingle-photon excitation procees. These reeulte
Indicate that the CH fluoreecence arises from the primary product
of the F + CH4 reaction, namely, CH3. This confirms the results
obtained from the C1 + CH4 reaction.
When CFI is comparable with CCH41, the secondary reaction,
F + CH3 --3 CH2 + HF (3)
will take place. The CH2 radical may then be dissociated into
CH* + H by a 157.5 nm photon to produce the observed CH
fluorescence. Since this process requires two consecutive F
10
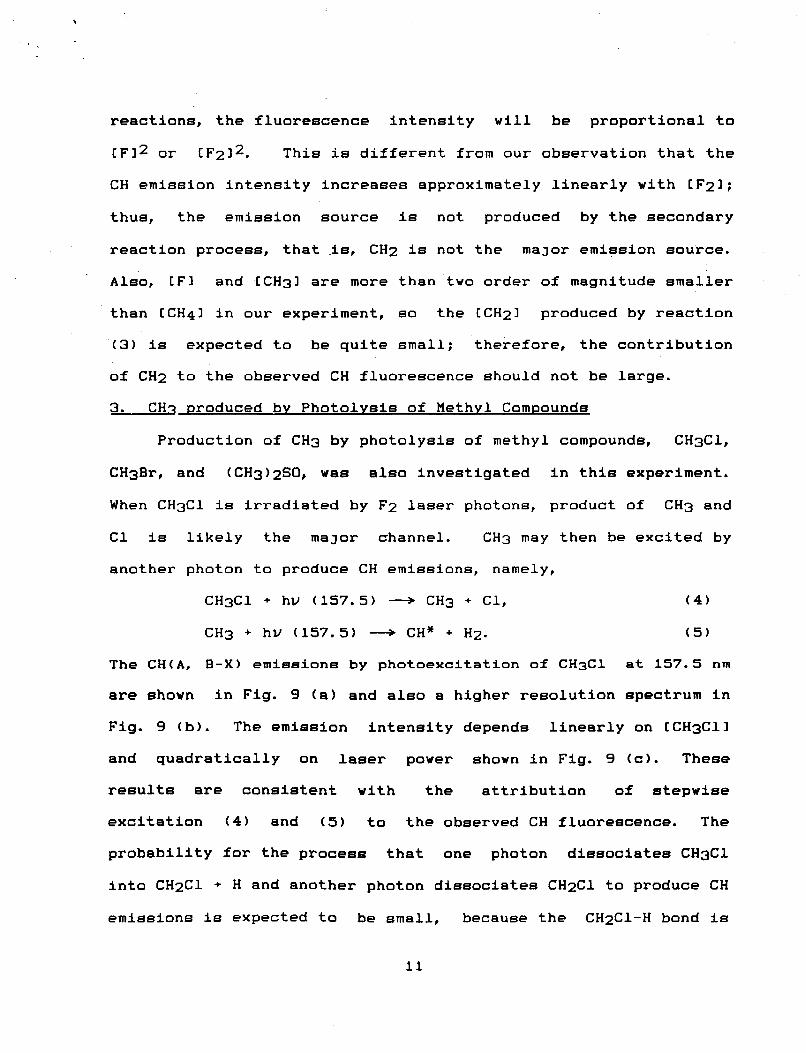
reactions, the fluorescence intensity will be proportional to
CFl2 or CF212. This is different from our observation that the
CH emission intensity increases approximately linearly with CF21;
thus, the emission source is not produced by the secondary
reaction process, that is, CH2 is not the major emission source.
Also, CFI and CCH31 are more than two order of magnitude smaller
than CCH41 in our experiment, so the ECH21 produced by reaction
(3) is expected to be quite small; therefore, the contribution
of CH2 to the observed CH fluorescence should not be large.
3. CHn produced by Photolysis of Methyl Compounds
Production of CH3 by photolyeie of methyl compounds, CH3C1,
C H 3 B r , and (CH3)2SO, was a180 inveetigated in this experiment.
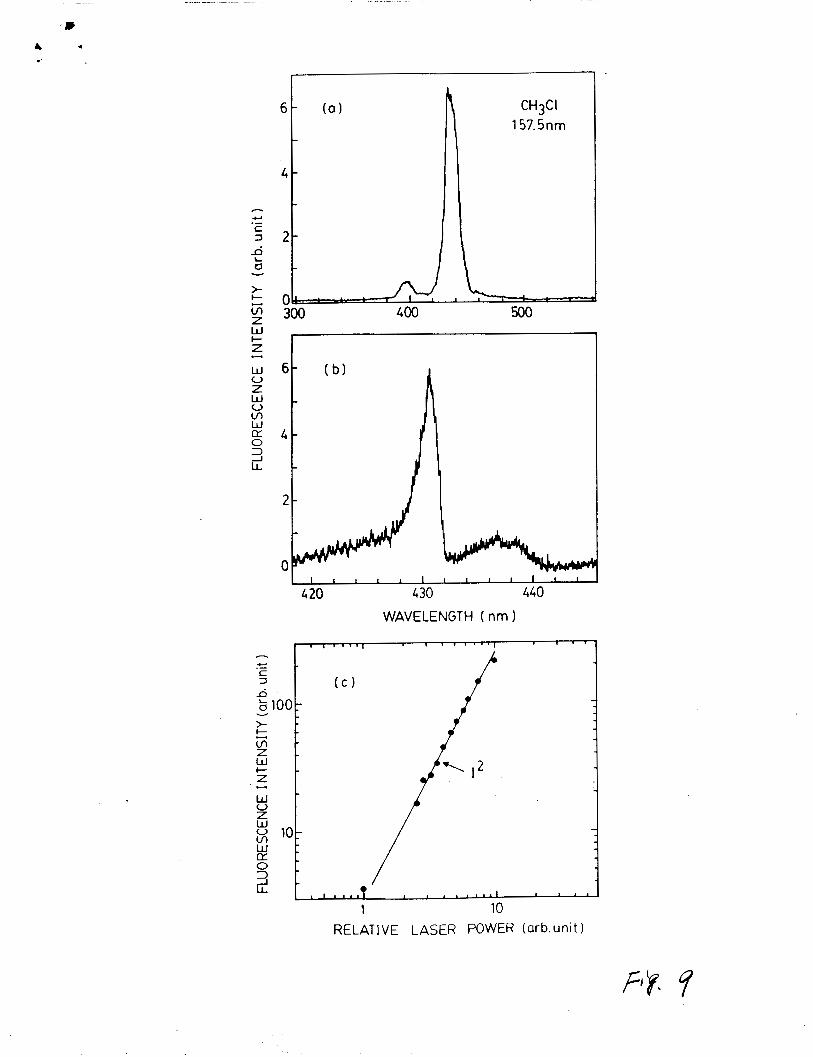
When CH3C1 is irradiated by F2 laser photons, product of CH3 and
C1 is likely the major channel. CH3 may then be excited by
another photon to produce CH emissions, namely,
CH3C1 + hv (157.5) --* CH3 + C1, ( 4 )
CH3 + hV (157.5) + CH" + H2. ( 5 )
The CH(A, B-X) emissions by photoexcitation of CHSC1 at 157.5 n m
are ehown in Fig. 9 (a) and a180 a higher resolution spectrum in
Fig. 9 (b). The emission inteneity depends linearly on CCH3C11
and quadratically on laser power shown in Fig. 9 (c). These
results are consistent with the attribution of stepwise
excitation (4) and ( 5 ) to the observed CH fluoreecence. The
probability for the process that one photon di88OCiateS CH3C1
into CH2C1 + H and another photon dissociates CH2C1 to produce CH
emissions is expected to be small, because the CH2C1-H bond is
11
c
stronger than the CH3-Cl bond. Howel er, the contribi tion of this
process is not totally ruled out.
The CH(A, B-X) emissions were observed from photoexcitation
of CH3C1 by ArF laser photons at 193 nm. The laser power
dependence of the emission intensity indicates that the
excitation is a two-photon excitation process. The CH(A, B-X)
emissions were commonly observed by the two-photon excitation of
CH3X (X=Br, I and OH) with ArF laser photons37-39. Baronavski
and McDonald3a suggested that the fluorescence from
photoexcitation of CH3Br is by,
CH3Br + hV(193) - -> CH3) + Br, (6)
CH3# + hV(193) --> CH" + H2. ( 7 )
High vibrational energy is required for process (7) to occur. On
the other hand, Fotakis et al.39 favored the simultaneous two-
photon excitation,
CH3X + 2h3 (193) - -> CH3X** - - > CH* + H2 + X. (8)
The probability for this simultaneous excitation may be smaller
than the stepwise excitation, because CH3XY* has an excitation
energy of 12.8 eV that will mostly lead to ionization.
No emission was observed from the multiphoton excitation of
CH3C1 at 248 nm. CH3C1 has a very small absorption cross
section at 248 nm40, so the two-photon excitation coefficient ia
expected to be small. Also, there is no emission from the 248 nm
excitation of CH3; thue, the chance for stepwise excitation is
eliminated.
12
The CH(A, B-X) emission was observed when CH3Br was
irradiated by F2 laser photons. The absorption cross section of
CH3Br at 157.5 nm41 is about 6 x cm2. The absorption is a
continuum, so the excited molecules undergo dissociation. The CH
emission intensity is proportional to CCH3Brl and- quadratically
dependent on laser power. These results suggest that the
excitation is a two-photon process. Similar to CH3C1, the
excitation Is likely a two-step photodissociation process. When
the gate was left off, Br2 were observed. The Br2
emissions are likely due to the secondary reaction,
Br + Br (+MI + BrZ* (+M). ( 9 )
Emission from photoexcitation of (CH312SO at 157.5 nm was
also examined, because this compound is often used as a methyl
radical source15-18. The CH(A, B - X ) emissions were observed.
The emission intensity depends linearly on C(CH3)2SOl and
quadratically on laser power. These results indicate that the CH
emission is produced by the two-photon excitation process,
(CH3)zSO + hv (157) -----) CH3 + CHsSO, (10)
CH3 + hu (157) * GH* + H2. ( 5 )
Iv. Discussion
The current excitation wavelengths do not coincide with any
Rydberg states4# 18; therefore, the observed fluorescence is
produced by dissociative states. These dissociative state8 are
expected, because the Rydberg states are very diffu~e4~5.
However, the nature of the dissociative continua is not yet
13
studied, and the current observa,,ons provide information for
such study.
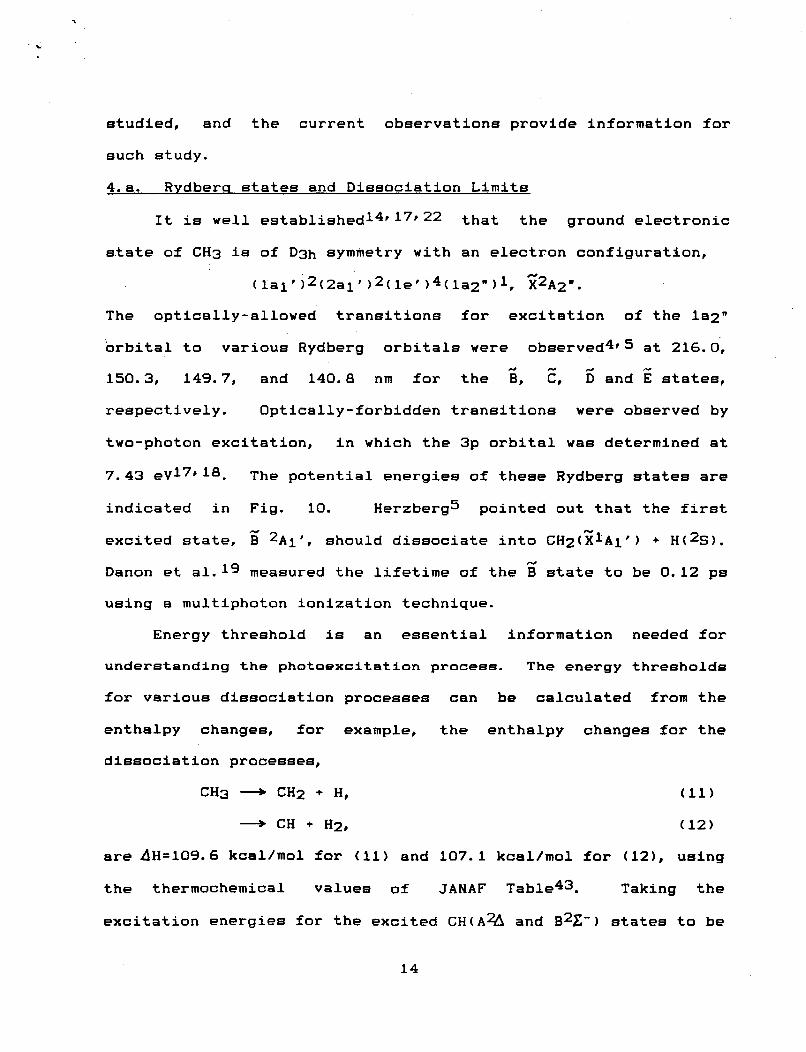
4.a. Rydberu states and Dissociation Limits
It is well e s t a b l i ~ h e d 1 ~ ~ ~ ~ ~ ~ ~ that the ground electronic
state of CH3 is of D3h symmetry with an electron configuration,
The optically-allowed transitions for excitation of the la2”
orbital to various Rydberg orbitals were 0bserved4~5 at 216.0,
150.3, 149.7, and 140.8 nm for the B, C, D and states,
respectively. Optically-forbidden transitions were observed by
two-photon excitation, in which the 3p orbital was determined at
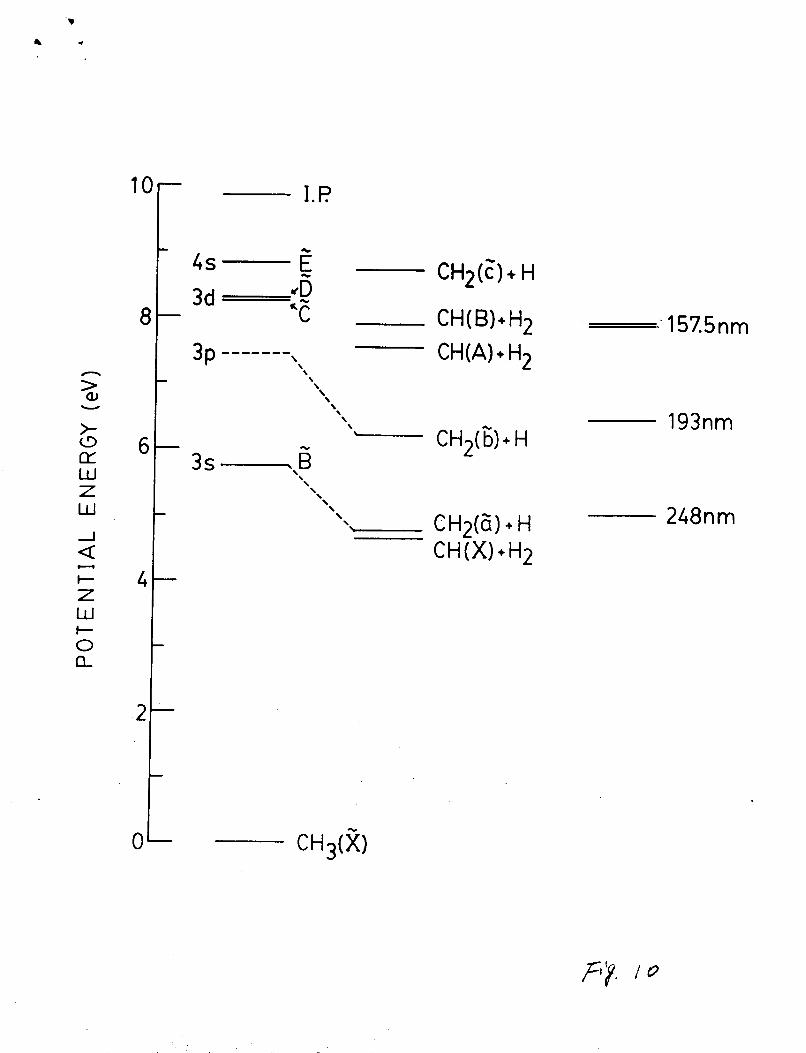
7.43 eV17r1a. The potential energies of these Rydberg states are
indicated in Fig. 10. Herzbergs pointed out that the first
excited state, B ZAi’, should dissociate into CH2(Z1A1’ 1 + H(2S).
Danon et al. l9 measured the lifetime of the % state to be 0.12 ps using a multiphoton ionization technique.
& N #.#
&
Energy threshold is an essential information needed for
understanding the photoexcitation process. The energy threeholde
be calculated from the
changes for the
for various dissociation processee can
the enthalpy changes, for example,
diesociation processes,
CH3 -+ CH2 + H,
+ CH + H2,
are dH=109.6 kcal/mol for (11) anc
the thermochemical values of
enthalpy
(11)
(12)
107. kcal/mo for (12), using
JANAF Table43. Taking the
excitation energies for the excited CH(A?4 and B2X-) states to be
14
.
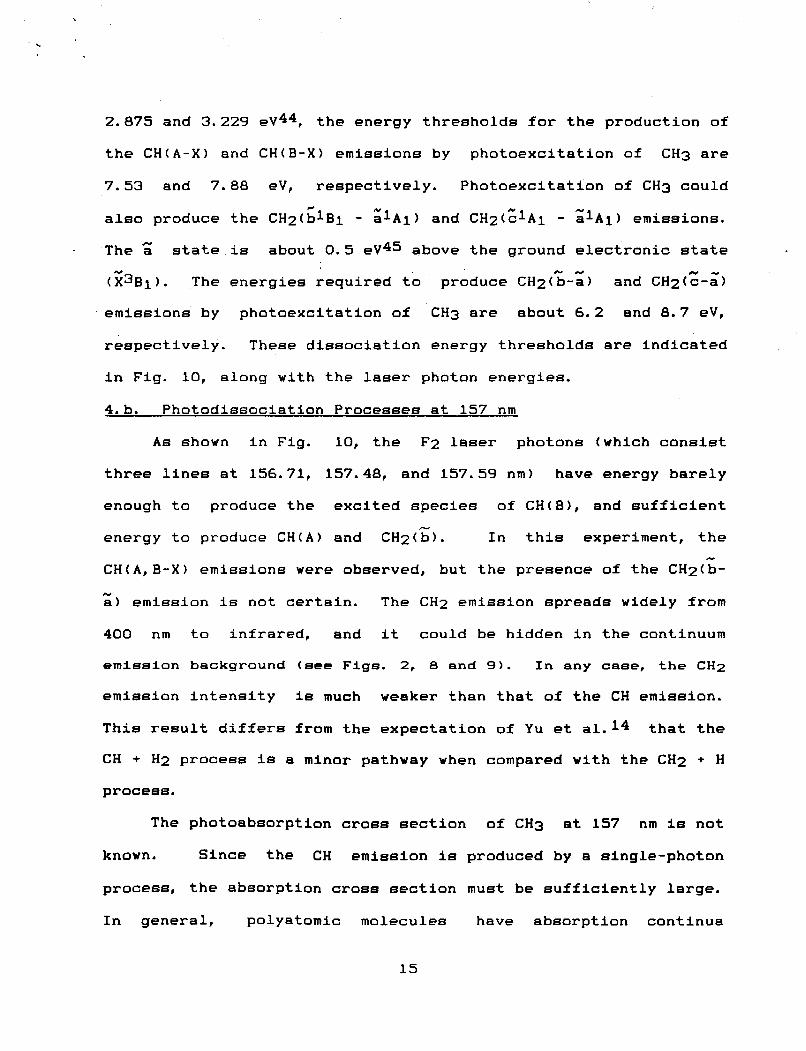
2.875 and 3.229 eV44, the energy thresholds for the production of
the CH(A-X) and CH(B-X) emissions by photoexcitation of CH3 are
7.53 and 7.88 eV, respectively. Photoexcitation of CH3 could
also produce the CH2(blBl - alA1) and CHz(g1A1 - alA1) emissions.
. The 2 state is about 0.5 eV45 above the ground electronic state
The energies required to produce CH2 ( b-a ) and CH2 (c-a )
N ry ”
k W N e
&B1 ) . emissions by photoexcitation of CH3 are about 6.2 and 8.7 eV,
respectively. These dissociation energy thresholds are indicated
in Fig. 10, along with the laser photon energies.
4.b. Photodissociation Processes at 157 nm
As shown in Fig. 10, the F2 laser photons (which consist
three lines at 156.71, 157.48, and 157.59 nm) have energy barely
enough to produce the excited species of CH(B), and sufficient
energy to produce CH(A) and CH2(G). In this experiment, the
CH(A,B-X) emissions were observed, but the presence of the CH2(b-
a) emission is not certain. The CH2 emission spreads widely from
... N
400 nm to infrared, and it could be hidden in the continuum
emission background (see F i g s . 2, 8 and 9 ) . In any case, t h e CH2
emlesion intensity is much weaker than that of the CH emlesion.
This result differs from the expectation of Yu et al.14 that the
CH + H2 process is a minor pathway when compared with the CH2 + H
process.
The photoabsorption cross section of CH3 at 157 nm le not
known. Since the CH emission is produced by a single-photon
process, the absorption cross section must be sufficiently large.
In general, polyatomic molecules have absorption continua
15
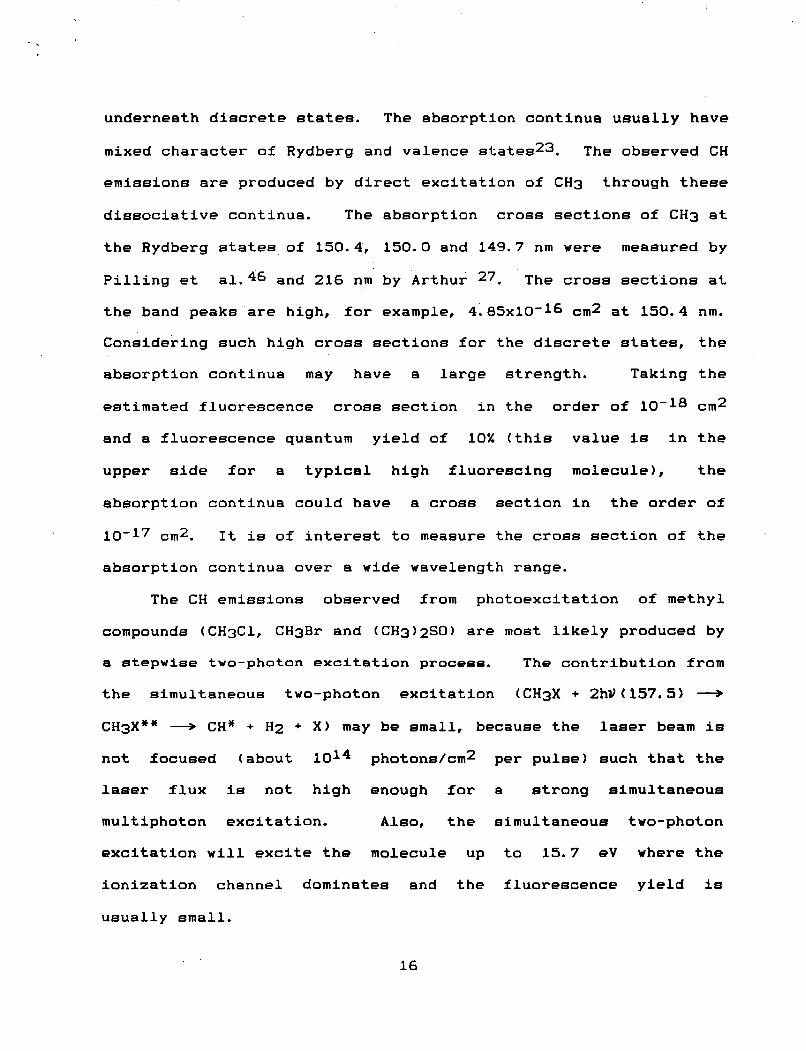
underneath discrete states. The absorption continua usually have
mixed character of Rydberg and valence states23. The observed CH
emissions are produced by direct excitation of CH3 through these
dissociative continua. The absorption cross sections of CH3 at
the Rydberg states of 150.4, 150.0 and 149.7 nm were measured by
Pilling et The cross sections at al.46 and 216 nm by Arthur 27.
the band peaks are high, for example, 4.85~10'16 cm2 at 150.4 nm.
Considering such high cross sections for the discrete states, the
absorption continua may have a large strength. Taking the
estimated fluorescence cross section in the order of 10-18 cm2
and a fluorescence quantum yield of 10% (this value is in the
upper side for a typical high fluorescing molecule), the
absorption continua could have a cross section in the order of
10-17 cm2. It is of interest to measure the cross section of the
absorption continua over a wide wavelength range.
The CH emissions observed from photoexcitation of methyl
compounds (CH3C1, CH3Br and (CH3)2SO) are most likely produced by
a stepwlse two-photon excitation process. The contribution from
the simultaneous two-photon excitation (CH3X + 2hV(157.5) --+
CH3XY* + CH* + H2 + X) may be small, because the laser beam is
not focused (about photons/cm2 per pulse) such that the
laser flux is not high enough for a strong simultaneous
multiphoton excitation. Also, the simultaneous two-photon
excitation will excite the molecule up to 15.7 eV where the
ionization channel dominates and the fluorescence yield is
usually small.
16
. .
When the CH3 radical is produced by photodissociation of
methyl compounds, it may carry a large amount of kinetic energy
and rotational-vibrational energy, depending on the parent
molecules. However, the observed fluorescence spectra are very
similar for all molecules studied. These results indicate that
the emitting species may be all produced by the same dissociative
state(s) and/or the fluorescence spectra are limited by the
nature of the excited CH states.
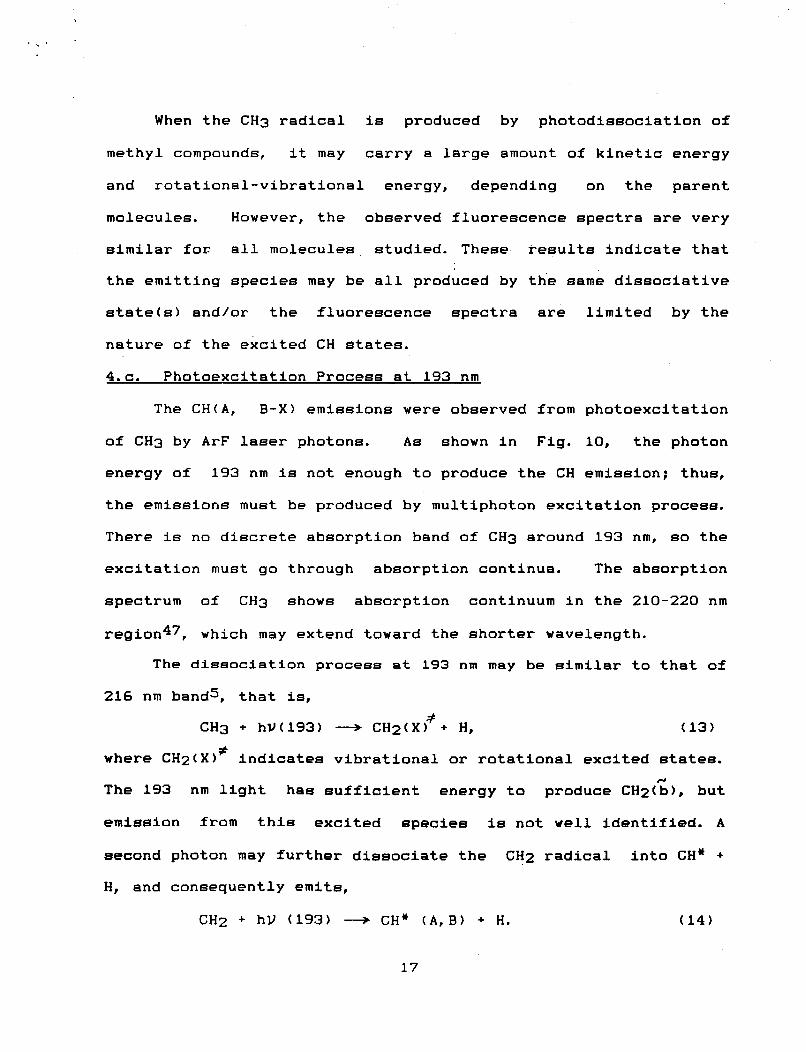
4.c. Photoexcitation Process at 193 nm
The CH(A, B-X) emissions were observed from photoexcitation
of CH3 by ArF laser photons. As shown in Fig. 10, the photon
energy of 193 nm is not enough to produce the CH emission; thus,
the emissions must be produced by multiphoton excitation process.
There is no discrete absorption band of CH3 around 193 nm, so the
excitation must go through absorption continua. The absorption
spectrum of CH3 shows absorption continuum in the 210-220 nm
region47, which may extend toward the shorter wavelength.
The dissociation process at 193 nm may be eimilar to that of
216 nm bands, that is,
(13) -3 CH3 + hV(193) + CH2(X) + H,
where CH2( X)' indicates vibrational or rotational excited states.
The 193 nm light has sufficient energy to produce CH2(b), but
emission from this excited species is not well identified. A
second photon may further dissociate the CH2 radical into CH" +
H, and consequently emits,
cy
CHZ + hV (193) + CH* (A, B) + H. ( 1 4 )
17
.
Probability for the eimultaneous two-photon excitation,
CH3(;) + 2hV (193) + CH3** --3 CH* (A,B) + H2, (15)
+ CH* (A,B) + 2H, (16)
may be small, because it will excite CH3 to 12.8 eV, where
ionization channeL dominates and the fluorescence yield is
usually quite small. The probability for the production of the
CH emissions by the stepwise excitation,
CH3 + hv(193) + CH(X)# + H2 (17)
CH + hu(193) + CH* (18)
is also expected to be small, because there are no CH resonance
states at 193 nm.
The spectral profiles of the CH emissions are always about
the same, in spite of different excitation wavelength and
excitation process. This similarity may be inherent with the
nature of the CH excited statee. The high rotational and
vibrational levels are predissociated44 so that the emission is
only due to the low rotational levels of the CH(A,B) v=O
vibrational levels that produce similar emission spectra.
4.d. Photoexcitation at 248 nm
No emiesions were detected at 248 nm excitation. The KrF
laeer power le a factor of 2-3 stronger than the ArF laser; thus
the KrF laser must have a high multiphoton excitation efficiency
if CH3 ha8 similar photoabsorption cross sections at both
wavelengthe. The non-emiseion indicates that the absorption
cross section of CH3 at 248 nm must be very small.
18
V. CONCLUDING REMARKS
Photoexcitation process of methyl radicals produced by the
reactions of C1 + CH4 and F + CH4 is studied using excimer laeere
as light sources. The CH(A, B - XI emissions are produced by a
eingle-photon excitation process at 157.5. nm. The emi~seion
source is confirmed by the dependencies of emission intensity on
reactant concentration6 and reaction time. The fluoreecence
cross section was estimated to be in the order of 10-18 cm2.
The CH emieeions are produced by two-photon excitation of CH3 at
193 nm. No emissione were detected at 248 nm. Our results
indicate that the abeorption continua have large cross sections
at 157.5 and 193 nm, but not 248 nm. Measurements for the croes
sections of the absorption continua are of intereet for further
study of photodissociation process.
ACKNOWLEDGEMENT
The authors wish to thank M. C. Lin at Naval Research
Laboratory for ueeful discuseion and euggeetione. They also
thank D. Coffey, Jr. at San Diego State Univereity for providing
the computer program for modeling the C1 + CH4 reaction kinetics.
This paper is based on the work eupported by the NSF and the
NASA.
19
REFERENCE
1. B. J. Finlayson-Pitts and J. N. Pitts Jr. "Atmospheric
Chemistry, " (Wiley, New York, 1986)
2.
3.
4.
5.
6.
7.
8.
9.
10.
11.
12.
13.
A. Dalgalno and J. H. Black, Rep. Prog. Phye. 39, 573 (1976)
Y. Saito, S. Matsuda and S. Nogita, J. Material Sci. Lett.
a 569 (1986); Y. Hirose and y. Terasawa, Jpn. J. Appl.
Phys. 25. L519 (1986); S. Matsumoto, M. Hino, and T.
Kobayashi, Appl. Phys. Lett. 51, 737 (1987).
G. Herzberg and J. Shoosmith, Can. J. Phys. 34. 523 (1956)
G. Herzberg, Proc. Roy. SOC. London Ser. A 262, 291 (1961)
J. Dyke, N. Jonathan, E. Lee and A. Morrie, J. Chem. SOC.
Faraday Trans. 2, 72, 1385 (1976)
T. Koenig, T. Belle, and W. Snell, J. Am. Chem. SOC. 97. 662
( 1975 1
G. B. Ellison, P. C. Engelking and W. C. Lineberger, J. Am.
Chem. SOC. 100, 2556 (1978)
C. Yamada, E. Hirota, K. Kawaguchi, J. Chem. Phys. 75, 5256
(1981 )
K. Morokuma, L. Pedereen, and M. Karplue, J. Chem. Phye.
48.4801 ( 1968)
Y. Ellinger, F. Pauzat, V. Barone, J. Douady and R. Subra,
J. Chem. Phys. 73 6390 (1980)
G. T. Surratt and W. A. Goddard 111, Chem. Phye. 23, 39
( 1977)
J. Pacansky, J. Phys. Chem. 86. 485 (1982)
20
14. H. T. Yu, A. Sevln, E. Kassab and E. M. Evleth, J. Chem.
Phye. 80, 2049 (1984)
T. G. DiGiuseppe, J. W. Hudgene and M.C. Lin, Chem. Phys. 15.
Lett. 82, 267 (1981)
T. G. DiGiueeppe, J. W. Hudgene and M. C. Lin, J; Phys.
Chem. 86. 36 (1982)
J. W. Hudgene, T. G. DiGiuseppe and M. C. Lin J. Chem Phys.
79. 571 (1983)
16.
17.
18. M. C. Lln and W.A. Sanders, Adv. Multiphoton Proceesee 2,,
333 (1986)
J. Danon, H. Zacharias, H. Rottke and K. H. Welge, J. Chem. 19.
Phys. 76, 2399 (1982)
B. H. Rockney and E.R. Grant, J. Chem. Phye. 77. 4257 (1982) 20.
P. Chen, S. D. Colson, W. A. Chupka and J. A. Berson, J. 21.
Phys. Chem., 90. 2319 (1986)
22. G. Herzberg, "Electronic Spectra of Polyatomic Molecules,"
Von Nostrand Reinhold, New York, 1966
23. M. B. Robin "Higher Excited States of Polyatomic Moleculee,"
vol. 1 (1974) and vol. 3 (1985), Academic Preee, New York.
24.
25.
M. Suto and L. C. Lee, J. Chem. Phys. 80. 195 (1984)
L. C. Lee, H. Helm and J. S. Chang, Chem. Phys. 81, 537
(1981); L. C. Lee, J. Chem. Phye. 76, 4909 (1982)
26. E. R. Manzanares, M. Suto, L. C. Lee, and D. Coffey, Jr., J.
Chem. Phys. 85. 5027 (1986); X. Wang, M. Suto and L. C. Lee,
J. Chem. Phye. in press.
21
41.
42.
43.
44.
45.
46.
47.
M. Suto and L. C. Lee, unpublished data.
R. W. B. Pearee and A. G. Gaydon, "The Identification of
Molecular Spectra," Chapman and Hill, London (1976)
M. W. Chase, Jr., C. A. Daviee, J. R. Downey, Jr., D. J.
Frurip, R. A. McDonald, and A. N. Syverud, "JANAF
Thermochemical Tables, Third ed. J. Phys. Chem. Reference
Data, 14, (1985) Supplement No. 1.
K. P. Huber and G. Herzberg, "Constants of Diatomic
Molecules," Van Noetrand Reinhold, New York, 1979
J. Romelt, S. D. Peyerimhoff and R. S. Bunker, Chem. Phye.
54, 147 (1981)
M. J. Pilling, A. M. Baee and W. Braun, Chem. Phye. Lett. S,
147 (1971)
D. A . Parkee, D. M. Paul, and C. P. Quinn, J. Chem. SOC.
Faraday Trane. 1, 72, 1935 (1976).
23
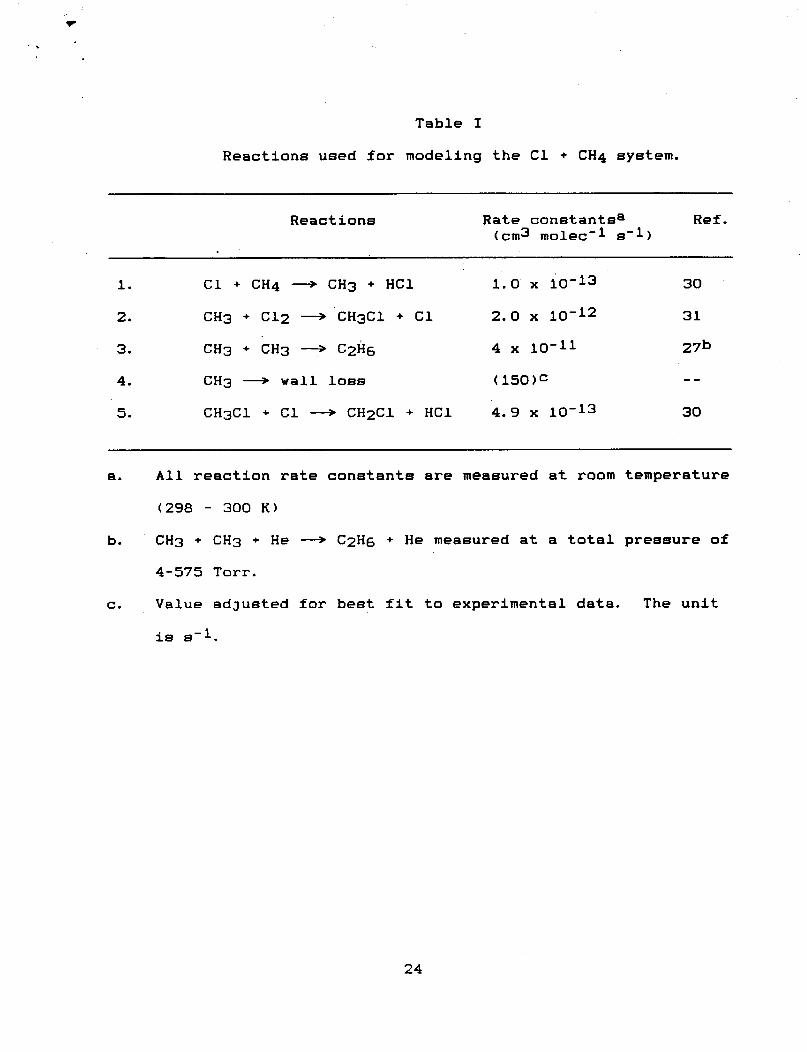
Table I
Reactions used for modeling the C1 + CH4 system.
Reactions Rate constantsa Ref. (cm3 molec-1 8-11
1. C1 + CH4 + CH3 + HC1 1.0 10-13 30
2. CH3 + C12 + CH3C1 + C1 2.0 x 10'12 31
3. CH3 + CH3 + C2Hg 4 x 10-11
4. CH3 + wall loss (150)C
5. CH3C1 + C1 -+ CH2C1 + HC1 4.9 x 10⁻¹³
27b
-- 30
b.
a. All reaction rate constants are measured at room temperature
(298 - 300 K)
CH3 + CH3 + He * C2Hg + He measured at a total pressure of
4-575 Torr.
c. Value adjusted for best fit to experimental data. The unit
is 8-1.
24
,
Fiuure Caption
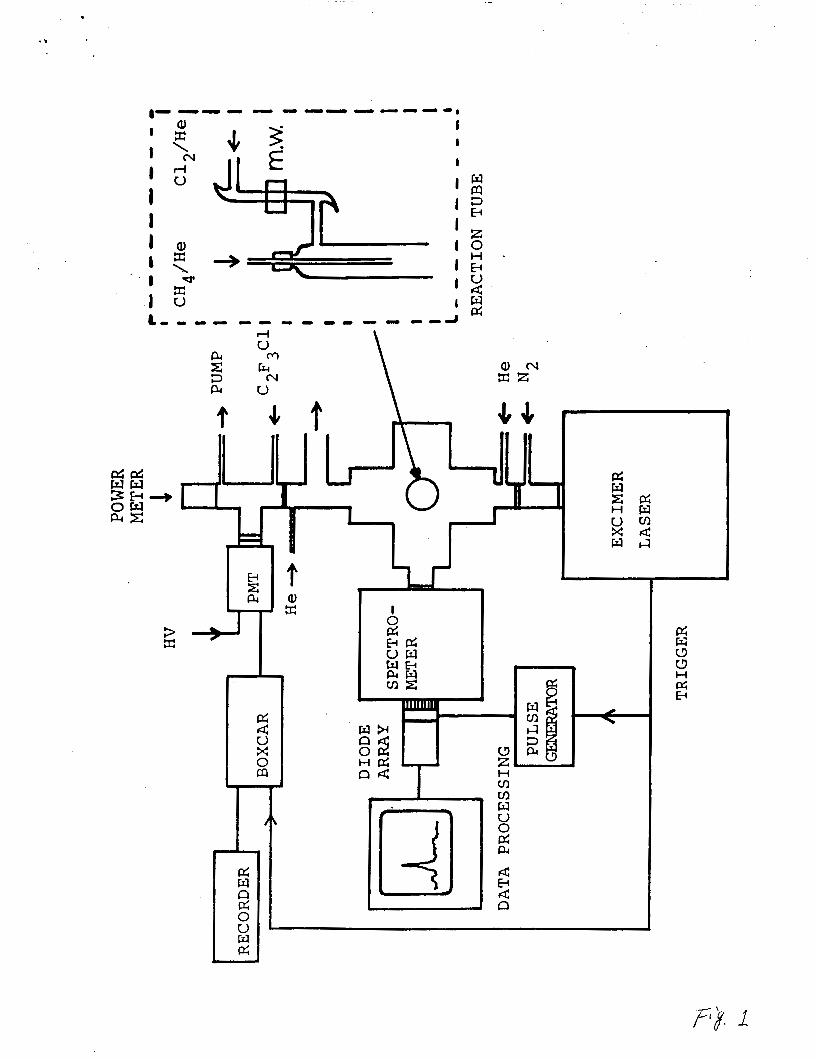
Fig. 1. Schematic diagram for the experimental setup.
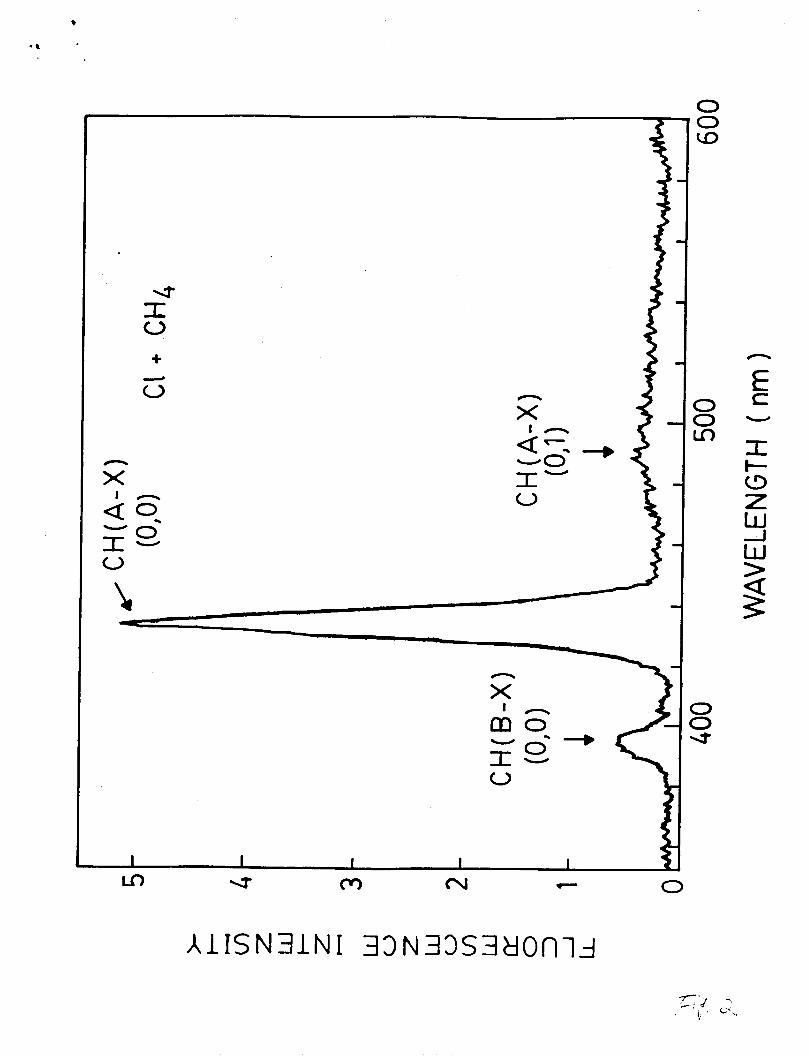
Fig. 2. The CH(A,B-X) fluorescence spectrum observed from
irradiation of the C1 + CH4 reaction medium by F2 laser
photons. The partial pressures are: CCH41 = 50 mTorr,
CC121 = 2 mTorr, and CHel = 1.5 Torr. C1 atoms are
produced by a microwave discharge of C12 in He. The
flow velocity is about 1000 cm/s, and the reaction time
is about 3 me. The spectral resolution is 12 nm, and
the OMA gate duration is 10 pe.
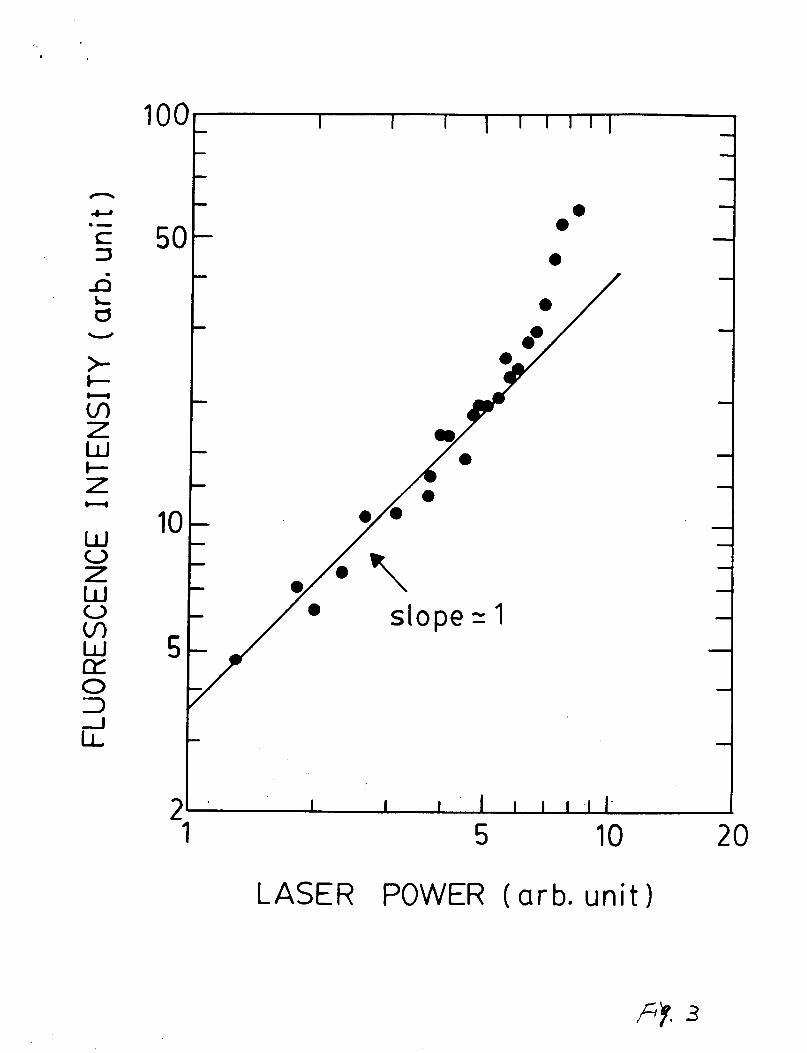
Fig. 3. The laser power dependence of the CH ( A - X ) fluoreecence
intensity produced from excitation of the C1 + CH4
reaction medium by F2 laser photons. The elope of the
plot is about 1 at small laser power. Experimental
parameters are: CC123 = 1 mlorr, LCH43 = 15 mTorr,
total pressure = 1.9 Torr, flow velocity = 1515 cm/e,
and reaction time = 4 ms.
Fig. 4. The CH (A-X) fluorescence inteneity produced from
excitation of the C1 + CH4 reaction medium by F2 laser
photon8 at varied CCH41. Experimental parameters are
fixed at CC123 = 2.2 mTorr, [He3 = 2.2 Torr, and
reaction time of about 6 ms.
25
Fig. 5. The CH(A-X) fluoreecence inteneity produced from
excitation of the C1 + CH4 reaction medium by F2 laser
photons at varied reaction timee. Experimental
parameters are: CCH41 = 20 mTorr, CC121 = 2.1 mTorr,
and CHel = 2 Torr
Fig. 6. The eimulated concentratlone of reaction producte, CH3,
C2H6, and CH3C1, in the C1 + CH4 reaction medium. The
concentrations of CC121 = 2.1 mTorr, CC11 = 0.1 CC121,
and CCH41 = 20 mTorr, and the reaction rate constante
lieted in Table I are used in the calculation.
Fig. 7. The reaction time dependence (a) and laser power
dependence (b) of fluorescence intensity produced from
excitation of the C1 + CH4 reaction media by ArF laeer
photons. (a) CC121 = 1 mTorr, CCH41 = 26 mTorr,and CHel
= 1.8 mTorr; (b) CC121 = 1 mTorr, CCH41 = 15 mTorr, and
CHel = 1.8 mTorr at a reaction time of 4 me.
Fig. 8. The CH (A-X) fluorescence spectrum produced from
excitation of the F + CH4 reaction medium by F2 laser
photons. The emission is dispersed by a 0.5 m
monochromator with a resolution of 0.3 nm.
Experimental parameters are: CF23 = 4 mTorr, tCH43 = 20
mTorr, CHel = 1.5 Torr, and reaction time = 3.5 ms.
26
Fig. 9. Fluorescence from excitation of CH3C1 by F2 laser
photone. (a) The CH(A,B - X ) emissions with a
resolution of 12 nm. (b) The CH(A - X) emission
with a reeolution of 1.5 nm. (c) laser power
dependence of the CH(A. - X ) emission intensity. The
sample gas is 60 mTorr CH3C1 diluted in 1.1 Torr He.
Fig. 10 Potential energiee for the Rydberg State8 and the
dissociation limit8 of CH3. Laser photon energiee are
also indicated.
27
a X \
rf u cv
\
3 x
0 I YJ ’
U 7z c)
+ V n
X I n
n
X
4q -0 r- 0
7-
X I
m J
I: V
n
0 - 0- U
I
I I I I I a
0
Al ISN31NI 33N 33S3tJOnlj
0 0 W
0 0 L n
0 0 U
U
>- I- -
0 3 d t
2 I I 1 I I I I l l .
1 5 10 20
LASER POWER (arb. u n i t )
Fjp. 3
4
I 1
3 4-
3 v)
3 Y
3 7
0
n
I I 0
t- E U
n
U I: V U
'.
1 1
/ /
/ /
/ 10
/ /
1
I I I /
/
.// /
/ /
I
0 N
3 7
U 0 '
' \
'4 \ \ 0
I I 1 I I I 3 N 0 (9
W z w I-
7 0 U
I-
3 CIL
I
S
n
\ \ \ . \ \
' \ \
\ \
0 cv)
0 cy
0 7
0
6(
4c
2c
0
I I I I 1 I I I I f I
00
1 I I I I 1 I 1 1 I I
(a 1 .. 0 CI.CH4 0
e 0 0 193nm
0 0
0 0
0 0
f I 11 r ' " I I I I I I I I I
10 100
LASER POWER (arb. unit)
4
2
420
CH(A-X)
Q-branch
P- branch
F + C H 4 157.5nm
44 0
WAVELENGTH (nm)
460
- .
1 10 RELATIVE LASER POWER (arb.unit)
1(
t
€
4
2
0
I. I?
JD T 3d
\
\\
\ '\
\
CH*(Z) + H
CH( B)+ H2 CH(A) + H2
CH2( 6) + H
CH2(6) + H CH (X) + H2
I 157.5nm
193nm
248nm