5-a odor and air quality: treatment plant
TRANSCRIPT

FINALENVIRONMENTALIMPACT STATEMENT
BrightwaterRegional WastewaterTreatment System
APPENDICES
5-AODOR AND AIR QUALITY:
TREATMENT PLANT

Final
Appendix 5-AOdor and Air Quality:
Treatment Plant
October 2003
Prepared for King County byCH2M HILLBellevue, WA
For more information:Brightwater Project201 South Jackson Street, Suite 503Seattle, WA 98104-3855206-684-6799 or toll free 1-888-707-8571
Alternative formats available upon requestby calling 206-684-1280 or 711 (TTY)

APPENDIX 5-A: ODOR AND AIR QUALITY: TREATMENT PLANT
October 2003 i
TABLE OF CONTENTSEXECUTIVE SUMMARY.............................................................................................. 1
ODOR PREVENTION SUMMARY.................................................................................... 2AIR QUALITY COMPLIANCE AND PREVENTION SUMMARY ......................................... 4
1 INTRODUCTION...................................................................................................... 6
2 AIR QUALITY REGULATORY ENVIRONMENT ............................................. 7
2.1 INTRODUCTION ...................................................................................................... 72.2 OVERVIEW OF AIR QUALITY AND ODOR REGULATIONS....................................... 72.3 AIR QUALITY PERMITTING REQUIREMENTS ....................................................... 112.4 PROJECT-SPECIFIC REGULATORY REQUIREMENTS ............................................. 14
3 ELEMENTS COMMON TO ODOR AND AIR QUALITY ANALYSES ......... 14
3.1 INTRODUCTION .................................................................................................... 143.2 TREATMENT PLANT OVERVIEW .......................................................................... 153.3 MASS EMISSION AND DISPERSION MODELING.................................................... 153.4 SCENARIOS MODELED......................................................................................... 29
4 ODOR IMPACTS ASSESSMENT......................................................................... 30
4.1 INTRODUCTION .................................................................................................... 304.2 ODOR PREVENTION AND CONTROL APPROACH .................................................. 304.3 ODOR SOURCES ................................................................................................... 314.4 TARGETED ODOR COMPOUNDS........................................................................... 344.5 QUANTIFICATION OF ODOR IMPACTS.................................................................. 35
5 AIR QUALITY IMPACTS ASSESSMENT.......................................................... 52
5.1 INTRODUCTION .................................................................................................... 525.2 AIR POLLUTANTS CONTROL APPROACH ............................................................. 525.3 SOURCES OF AIR POLLUTANTS............................................................................ 535.4 AEROSOLS FROM WASTEWATER TREATMENT PROCESSES................................. 545.5 TARGETED CRITERIA AND TOXIC COMPOUNDS .................................................. 555.6 QUANTIFICATION OF CRITERIA AND TOXIC POLLUTANT IMPACTS..................... 55
REFERENCES ............................................................................................................... 80
ATTACHMENTS
ATTACHMENT A – HAZARDOUS AIR POLLUTANTSATTACHMENT B – TOXIC AIR POLLUTANTSATTACHMENT C – CHEMICALS REQUIRING RISK MANAGEMENT PLANSATTACHMENT D – INFLUENT CONCENTRATIONS USED IN AIR TOXICS EMISSION
MODELINGATTACHMENT E – COMBUSTION SOURCE PARAMETERSATTACHMENT F – LIQUIDS AND SOLIDS PROCESS SOURCE PARAMETERSATTACHMENT G – ACRONYMS AND ABBREVIATIONS

APPENDIX 5-A: ODOR AND AIR QUALITY: TREATMENT PLANT
October 2003 ii
TABLES
Table ES 1 Initial Detection Threshold of Odorous Compounds
Table ES 2 Brightwater Treatment Plant Peak Offsite Odor Concentrations at 36 mgd(using onsite meteorological data)
Table ES 3 Brightwater Treatment Plant Average Offsite Odor Concentrations at 36mgd (using onsite meteorological data)
Table 1 National and State Ambient Air Quality Standards
Table 2 Three-Minute Peaking Factors
Table 3 Added Receptor Points for Sensitive Receptor Locations
Table 4 Paine Field Meteorological Station (January 1961 – December 1965)
Table 5 Route 9 Site Wind Speed and Direction (onsite data July 2002 – March 2003)
Table 6 Unocal Site Meteorological Station (onsite data July 2002 – March 2003)
Table 7 Summary of Meteorological Data
Table 8 Hydrogen Sulfide, Ammonia, and Initial Odor Detection Thresholds
Table 9 Summary of Air Flow Rates for Route 9
Table 10 Summary of Air Flow Rates for Unocal
Table 11 Hydrogen Sulfide, Ammonia, and Odor Concentrations (without process airventilation rates included) at Brightwater Treatment Plant
Table 12 Scrubber Inlet Hydrogen Sulfide, Ammonia, and Odor Concentrations(including process air ventilation rates) at Brightwater Treatment Plant
Table 13 Removal Efficiencies of Each Odor Prevention Technology at Peak Loading(inlet gas – exhaust gas)
Table 14 Comparison of Odor Prevention and Control Approach for BrightwaterTreatment Plant to Other Wastewater Treatment Plants
Table 15 Grouped Emissions of Hydrogen Sulfide for 36-, 54-, and 72-mgd TreatmentPlants
Table 16 Grouped Emissions of Ammonia for 36-, 54-, and 72-mgd Treatment Plants
Table 17 Grouped Emissions Odor for 36-, 54-, and 72-mgd Treatment Plants
Table 18 Maximum Offsite Odor Impacts at the Route 9 Site (at peak conditions)
Table 19 Comparison of Detection Thresholds to Average Offsite Concentrations atRoute 9 Site (36 mgd)
Table 20 Maximum Offsite Odor Impacts at the Unocal Site (at peak conditions)

APPENDIX 5-A: ODOR AND AIR QUALITY: TREATMENT PLANT
October 2003 iii
Table 21 Comparison of Detection Thresholds to Average Offsite Concentrations atUnocal Site (36 mgd )
Table 22 Summary of Criteria and Toxic Air Pollutants Emission Factor Sources
Table 23 Contaminants Present in Unocal Site Soils, August - October 2001
Table 24 Toxic and Hazardous Air Pollutant Emissions from Liquids and SolidsHandling Processes at Route 9 Site (no emission controls)
Table 25 Toxic and Hazardous Air Pollutant Emissions from Liquids and SolidsHandling Processes at Unocal Site (no emission controls)
Table 26 Summary of Potential Criteria Pollutant Emissions from Combustion Sourcesat Route 9 Site
Table 27 Summary of Hazardous and Toxic Air Pollutants (HAP and TAP) Emissionsfrom Combustion Sources at Route 9
Table 28 Summary of Potential Criteria Pollutant Emissions from Combustion Sourcesat Unocal
Table 29 Summary of Hazardous and Toxic Air Pollutants (HAP and TAP) Emissionsfrom Combustion Sources at Unocal Site
Table 30 Summary of Plantwide Potential Criteria Pollutant Emissions at Route 9 Site
Table 31 Summary of Plantwide Hazardous and Toxic Air Pollutants (HAP and TAP)Emissions at Route 9 Site
Table 32 Summary of Plantwide Potential Criteria Pollutant Emissions at Unocal Site
Table 33 Summary of Plantwide Hazardous and Toxic Air Pollutants (HAP and TAP)Emissions at Unocal Site
Table 34 Dispersion Modeling Results for a 54-mgd Treatment Plant at Route 9 Site
Table 35 Dispersion Modeling Results for a 54-mgd Treatment Plant at Unocal Site
Table 36 Dispersion Modeling Results for a 54-mgd Treatment Plant at Unocal Sitewith Structural Lid
Table 37 Dispersion Modeling Results for a 72-mgd Treatment Plant at Unocal Site
Table 38 Dispersion Modeling Results for a 72-mgd Treatment Plant at Unocal Sitewith Structural Lid
FIGURES
Figure 1 Paine Field Meteorological Station
Figure 2 Rte 9 Meteorological Station
Figure 3 Unocal Meteorological Station
Figure 4 Process Flow Schematic Showing Odor Prevention Systems

APPENDIX 5-A: ODOR AND AIR QUALITY: TREATMENT PLANT
October 2003 iv
Figure 5 Conceptual Odor Prevention Scrubber
Figure 6 Comparison of Detection Threshold, Maximum and Average OffsiteConcentrations at Rte 9 using Onsite Meteorological Data
Figure 7 Comparison of Detection Threshold, Maximum, and Average OffsiteConcentrations at Unocal using Onsite Meteorological Data

APPENDIX 5-A: ODOR AND AIR QUALITY: TREATMENT PLANT
October 2003 1
King County has prepared a Draft Environmental Impact Statement (Draft EIS) and FinalEnvironmental Impact Statement (Final EIS) on the Brightwater Regional WastewaterTreatment System. The Final EIS is intended to provide decision-makers, regulatoryagencies, and the public with information regarding the probable significant adverseimpacts of the Brightwater proposal and identify alternatives and reasonable mitigationmeasures.
King County Executive Ron Sims has identified a preferred alternative, which is outlinedin the Final EIS. This preferred alternative is for public information only, and is notintended in any way to prejudge the County's final decision, which will be madefollowing the issuance of the Final EIS with accompanying technical appendices,comments on the Draft EIS and responses from King County, and additional supportinginformation. After issuance of the Final EIS, the King County Executive will select finallocations for a treatment plant, marine outfall, and associated conveyances.
The County Executive authorized the preparation of a set of Technical Appendices, insupport of the Final EIS. These reports represent a substantial volume of additionalinvestigation on the identified Brightwater alternatives, as appropriate, to identifyprobable significant adverse environmental impacts as required by the StateEnvironmental Policy Act (SEPA). The collection of pertinent information and evaluationof impacts and mitigation measures on the Brightwater proposal is an ongoing process.The Final EIS incorporates this updated information and additional analysis of theprobable significant adverse environmental impacts of the Brightwater alternatives, alongwith identification of reasonable mitigation measures. Additional evaluation will continueas part of meeting federal, state, and local permitting requirements.
Thus, the readers of this Technical Appendix should take into account the preliminarynature of the data contained herein, as well as the fact that new information relating toBrightwater may become available as the permit process gets underway. It is released atthis time as part of King County's commitment to share information with the public as itis being developed.
EXECUTIVE SUMMARY
The purpose of this Technical Appendix is to present the regulatory requirements,methodology, and analysis of air and odor impacts from the proposed BrightwaterRegional Wastewater Treatment Plant (Brightwater Treatment Plant) at the Unocal andRoute 9 sites. Regulated air quality compounds and a full suite of odorous compounds areaddressed in this Technical Appendix.
Air quality compounds include federal criteria pollutants, federal hazardous air pollutants(HAPs), state toxic air pollutants (TAPs), and federal and state regulated substances. Theodorous compounds include hydrogen sulfide, ammonia, reduced sulfur compounds,amines, fatty acids, and other odor mixtures captured by a “total odor” estimate.
Federal, state, and local laws and regulations on air quality and odor are presented, andthe Brightwater Treatment Plant’s air and odor emissions are evaluated for eachcompliance requirement. In addition, odor emissions were evaluated for compliance withKing County’s policy of no detectable odor at the property line of the BrightwaterTreatment Plant.

APPENDIX 5-A: ODOR AND AIR QUALITY: TREATMENT PLANT
October 2003 2
The air quality and odor analysis used several common models, emission estimatingmethodology, and meteorological data. The common models, methodology, and datainclude:
• Bay Area Sewer Toxics Emissions (BASTE) air fate emissions estimation model, incombination with direct source testing data and emission factors, for determiningBrightwater’s air emissions from the liquid processes.
• Direct experience and source testing data from existing wastewater treatment plantsfor estimating the Brightwater Treatment Plant’s odor emissions.
• Air quality and odor potency from each process area to determine regulatory,permitting, and prevention needs and compliance approaches.
• Atmospheric dispersion model (ISCST3) to calculate both specific compound andodor emissions concentrations away from a source. For odor dispersion modeling,this model was modified to determine “puff-odor” conditions that could occur overshort periods of time (3-minute periods).
• Three meteorological data sets to analyze air quality and odor emissions compliancerequirements and offsite impacts. The data sets were Paine Field data and onsitemeteorological data for each of the two Brightwater Treatment Plant sites (Route 9and Unocal).
Odor Prevention SummaryKing County is committed to operating the Brightwater Treatment Plant with nodetectable odors at the property line 365 days per year, 24 hours per day. To this end,stringent design and performance criteria have been established for odor prevention at thetreatment plant. These standards require that odor levels at the property line be less thanthe initial detection threshold (or first detectability of an odor), including during times ofpeak odor generation within the plant and worst-case meteorological conditions. Thedetection thresholds for the odorous compounds (see Table ES 1) are significantly less,and more stringent than, the recognition thresholds, which are the typical standards formost wastewater treatment facilities. Recognition thresholds are those reached whensomeone smells something that they recognize, like a rotten egg smell, and can correctlyidentify the substance (e.g., hydrogen sulfide as a sewage-type odor). Odorouscompounds below the initial detection threshold are considered nondetectable.
TABLE ES 1Initial Detection Threshold of Odorous Compounds
Parameter Initial Detection Threshold
Hydrogen Sulfide (H2S) >0.8 ppbVa
Ammonia (NH3 ) >2,800 ppbVa
Odor >1 D/T
a Threshold based on recent work done by St. Croix Laboratories for Sacramento RegionalSanitation District.D/T = dilution to thresholdppbV = parts per billion by volume

APPENDIX 5-A: ODOR AND AIR QUALITY: TREATMENT PLANT
October 2003 3
Table ES 2 shows the predicted worst-case (peak) odor emissions at the property line.Table ES 3 shows predicted odor concentrations under average conditions at the propertyline. Both tables indicate that King County’s no detectable odor goal would be achievedwith a significant factor of safety. Worst-case odor emission estimates are based on usingthe highest potential odor emission levels and modeling those emissions for 365 days peryear, 24 hours a day. The meteorological conditions modeled vary. The worst-casemeteorological conditions modeled occur during stagnant (very stable) conditions, or “F”stability class, which include times of very low wind speeds, little change in winddirection, overcast conditions, and temperature inversions.
TABLE ES 2Brightwater Treatment Plant Peak Offsite Odor Concentrations at 36 mgd (using onsite meteorologicaldata)
Parameter
InitialDetectionThreshold
Peak Concentration at Route 9 Peak Concentration at Unocal
Total Odor 1 D/T 0.004 D/T (250 times less thaninitial detection threshold)
0.02 D/T (50 times less thaninitial detection threshold)
Hydrogen Sulfide 0.8 ppbV 0.03 ppbV (27 times less thaninitial detection threshold)
0.2 ppbV (4 times less than initialdetection threshold)
Ammonia 2,800 ppbV 0.53 ppbV (5,300 times less thaninitial detection threshold)
0.68 ppbV (4,100 times less thaninitial detection threshold)
D/T = dilution to thresholdmgd = million gallons per dayppbV = parts per billion by volume
TABLE ES 3Brightwater Treatment Plant Average OffSite Odor Concentrations at 36 mgd (using onsitemeteorological data)
Parameter
InitialDetectionThreshold
Average OffsiteConcentration at Route 9
Average OffsiteConcentration at Unocal
Total Odor 1 D/T 0.0002 D/T (5000 timesless than initial detectionthreshold)
0.0001D/T (10,000 times less thaninitial detection threshold)
Hydrogen Sulfide 0.8 ppbV 0.002 ppbV (400 times lessthan initial detectionthreshold)
0.0008 ppbV (1,000 times less thaninitial detection threshold)
Ammonia 2,800 ppbV 0.018 ppbV (155,000 timesless than initial detectionthreshold)
0.013 ppbV (215,000 times lessthan initial detection threshold)
D/T = dilution to thresholdmgd = million gallons per dayppbV = parts per billion by volume

APPENDIX 5-A: ODOR AND AIR QUALITY: TREATMENT PLANT
October 2003 4
Key odor elements of the Brightwater Treatment Plant odor prevention program are:
• King County is committed and accountable to the Puget Sound Clean Air Agency(PS Clean Air), State of Washington, and Brightwater Treatment Plant’s neighbors tomeet the criteria of no detectable odor at the property line.
• Brightwater Treatment Plant’s goals for odor prevention are the most stringent in theUnited States.
• The proposed odor prevention system selected would use best available controltechnology (BACT) and be the most advanced in the United States. Treatment Plantfeatures are described below:
− Three-stage chemical scrubbing followed by activated carbon scrubbing wouldbe used.
− All treatment processes would be covered or enclosed to capture and treatprocess air.
− Liquid-phase treatment would be provided in the collection system and at theinfluent pump station to reduce the formation of odors, further reducingdownstream treatment plant odor loading.
− Odor prevention systems would be sized to handle worst-case operatingconditions, when combinations of meteorological conditions (such as inversionsand stagnant air, which tend to occur in the autumn and winter) coincide withpeak odor releases from treatment processes (which tend to occur in thesummer). In reality, the two events are not expected to occur at the same time.
− Redundant equipment would be included in the treatment plant design to ensurethat the odor criteria are met during periods of equipment failure.
− Additional permanent air scrubbers would be provided and used during anymaintenance activity that requires cleaning the covered process equipment orbuilding. This would ensure that no foul air would be released into theatmosphere during tank cleaning, inspection, and maintenance.
Air Quality Compliance and Prevention SummaryAir quality emissions (HAPs, TAPs, and criteria pollutants) would be generated in thewastewater treatment processes and during combustion of fuel gases used in the treatmentplant. Wastewater treatment emissions are typically volatile organic chemicals that arepresent in the influent wastewater and are released from the liquid or sludge in thetreatment process. Typically, these emissions are released to the atmosphere. However, inthe case of the Brightwater Treatment Plant, where all process units are covered, theseemissions would be vented through the odor prevention system. For this analysis, nocredit for air emissions reductions of nonodorous compounds was given for the three-stage chemical scrubbing and carbon scrubbing system. Air emissions from combustionsources would be controlled in several ways, including requiring low-emissions burnersor equipment and/or add-on air emissions abatement equipment.
The treatment plant air emission estimates from the liquids, solids, and combustionsources indicate that all air emissions, except potentially chloroform, would be less thanregulatory requirements and are therefore not expected to have an adverse impact onhuman health and the environment.

APPENDIX 5-A: ODOR AND AIR QUALITY: TREATMENT PLANT
October 2003 5
Chloroform impacts were predicted to be above the Washington State Department ofEcology and the PS Clean Air’s acceptable source impact level (ASIL) in all scenariosmodeled for both potential treatment plant locations. Chloroform emissions above theASIL are typical for wastewater treatment plants due to the chlorine used in drinkingwater that is eventually discharged to the wastewater system and volatilizes during thewastewater treatment process. The carbon in the odor prevention system is expected toremove some chloroform as well as other air-quality-related substances. However, thepercent of chloroform removal provided by the carbon has not been determined at thistime. An evaluation of the chloroform removal efficiency of the carbon, and its feasibilityas a control device for chloroform, is currently being conducted. If it is not technicallyfeasible to control chloroform using carbon or some other control technology to levelsthat meet the ASIL, then a second-tier analysis would be conducted and submitted duringthe permitting process. The second-tier analysis uses a health impact assessment insteadof ASIL. Because chloroform emissions are typically above the ASILs at wastewatertreatment plants, it is common to do a second-tier analysis, and generally this assessmenthas shown little to no health risks due to chloroform.
Air emissions summaries for each location (Route 9 and Unocal) are found in thisTechnical Appendix. These emission summaries were used to evaluate air qualitycompliance requirements for initial and final buildout wastewater flows for each site.These estimates were based on emissions parameters taken from Brightwater TreatmentPlant’s layout as shown in the Final EIS, design and emissions data developed fromsimilar wastewater treatment plants, emission factors for combustion sources (fromAP-42, the U.S. Environmental Protection Agency’s [EPA’s] compilation of emissionfactors for stationary sources), and emission factors for liquids and solids processes (fromthe BASTE model). To fulfill the air quality regulatory and legal requirements for thetreatment plant, the Brightwater Treatment Plant would be required to:
• File a Notice of Construction (NOC) application and receive an Order of Approvalpermit under Section 6.07 of Puget Sound Clean Air Regulation I, Article 6: NewSource Review.
• Apply for and receive an Air Operating Permit in compliance with the WashingtonClean Air Act, Chapter 70.94 revised Code of Washington (RCW), Chapter 173-401of the Washington Administrative Code (WAC), and Puget Sound Clean AirRegulation I, Article 7.
The Brightwater Treatment Plant would be required to get a NOC, but would not berequired to have a federal Title V operating permit because it would likely emit less than100 tons per year of any criteria pollutant and less than 10 tons per year of any singleHAP, or 25 tons per year of any combination of HAPs. Both permitting programs areimplemented by PS Clean Air and would be addressed when air quality permitapplications are submitted.
As part of the NOC application process, new emission sources must also comply with allstate and local emission standards. New emission sources of criteria pollutants must applyBACT, and new emission sources of toxic air pollutants must apply best available controltechnology for toxics (TBACT), as defined by PS Clean Air. Because the treatment plantwould not be expected to be a major source of HAPs, federal maximum achievablecontrol technology (MACT) standards would not be applicable to this treatment plant.

APPENDIX 5-A: ODOR AND AIR QUALITY: TREATMENT PLANT
October 2003 6
The treatment plant would be required to submit an annual emission inventory to PSClean Air. The emission inventory would report the annual emissions of criteriapollutants or air contaminants, which include nitrogen oxides (NOx), carbon monoxide(CO), volatile organic compounds (VOCs), sulfur oxides (SOx), and particulate matter(PM). The treatment plant would also be required to report emissions of TAPs and HAPs.Currently, facilities are not required to report emissions of the greenhouse gases carbondioxide and methane, but this may change in the next few years if the regulatory agenciesadopt specific standards, regulations, or reporting requirements focused on greenhousegases.
Combustion sources planned for the treatment plant (co-generation turbines, dieselgenerator, boilers, and an emergency flare) would be equipped with BACT to controlemissions within regulatory requirements.
1 INTRODUCTION
The Brightwater Regional Wastewater Treatment System (Brightwater System) has beenproposed by King County to address the needs of the growing region. The BrightwaterSystem would protect human health and the environment by minimizing the risk ofsanitary sewer overflows from a wastewater collection and treatment system that wouldmeet its capacity by 2010.
This Technical Appendix was developed to quantify the offsite odor and air qualityimpacts generated by the proposed Brightwater Treatment Plant. Odors, criteriapollutants, hazardous and toxic air pollutant emissions, and ambient air impacts that couldresult from the construction and operation of the Brightwater Treatment Plant are alldiscussed herein. Both the Route 9 and Unocal sites were analyzed. Odor and air qualityimpacts related to the conveyance system are discussed in Appendices 5-B (OdorAnalysis: Conveyance) and 5-C (Construction-Related Air Impacts: Conveyance).
The analyses and methodology described in this Technical Appendix follow a provenapproach that has been used successfully in the past at several wastewater treatmentplants. The analyses followed these steps:
1. Establish design criteria and standards.2. Determine air flows.3. Determine odor and air toxic quantities and control requirements.4. Find the best available solution for odor prevention and air quality control.5. Show the results using proven and accepted models.
This Technical Appendix has six sections:
• Executive Summary.
• Section 1 provides an introduction to the Technical Appendix.
• Section 2 covers both air and odor emissions regulatory environment, includingapplicable laws and regulations.
• Section 3 addresses all elements that are common for both air quality and odoremissions analysis, including the plant as seen from an air quality perspective,common models, and emission factors.
• Section 4 discusses odor impacts resulting from the Brightwater Treatment Plant.

APPENDIX 5-A: ODOR AND AIR QUALITY: TREATMENT PLANT
October 2003 7
• Section 5 addresses air quality impacts from the Brightwater Treatment Plant.
Several attachments that support these sections are provided at the end of this TechnicalAppendix, including a list of focus compounds of interest, modeling results, and emissionparameters. Specifically, the attachments include:
Attachment A – Hazardous Air PollutantsAttachment B – Toxic Air PollutantsAttachment C – Chemicals Requiring Risk Management PlansAttachment D – Influent Concentrations used in Air Toxics Emission ModelingAttachment E – Combustion Source ParametersAttachment F – Liquids and Solids Process Source ParametersAttachment G – Acronyms and Abbreviations
2 AIR QUALITY REGULATORY ENVIRONMENT
2.1 IntroductionThis section gives an overview of the regulations involving odor and air quality thatwould affect the Brightwater Treatment Plant. Applicable regulations are brieflydiscussed, and then each air quality parameter is discussed in detail. A discussion ofpermitting requirements and project-specific regulatory requirements concludes thissection.
2.2 Overview of Air Quality and Odor RegulationsAir quality standards in the United States are mandated by the Clean Air Act and itsamendments. Three agencies currently have jurisdiction over air quality in King andSnohomish Counties: the U.S. Environmental Protection Agency (EPA), the WashingtonState Department of Ecology (Ecology), and the Puget Sound Clean Air Agency (PSClean Air). Each agency has developed its own air quality standards under the Clean AirAct, but the standards are similar among the agencies. EPA standards generally applyunless a more stringent standard for the source or type of pollutant has been adopted bythe state or local agency.
Three general types of air quality pollutants are regulated by federal, state, and regionalair quality agencies: criteria pollutants, hazardous air pollutants, and toxic air pollutants.A fourth type of air quality indicator—odor—is not specifically addressed under federalair quality regulations, but is broadly addressed under Washington State regulations andmore specifically addressed under PS Clean Air regulations. Each type of pollutant, andthe regulations affecting it, is described below. Substances regulated under the federalRisk Management Plan (RMP) program are also described. This is followed by adiscussion of air quality permit requirements for new sources of air emissions.

APPENDIX 5-A: ODOR AND AIR QUALITY: TREATMENT PLANT
October 2003 8
2.2.1 Criteria PollutantsThe federal Clean Air Act requires that EPA’s Office of Air Quality Planning andStandards set National Ambient Air Quality Standards (NAAQS) for six principalpollutants, called “criteria” pollutants. Most of these pollutants are commonly referred toby their abbreviations, which are used in this section for consistency with regulatorynomenclature. The six criteria pollutants currently regulated by the NAAQS are:
1. Carbon monoxide (CO)2. Sulfur dioxide (SO2)3. Lead4. Ozone5. Various categories of particulate matter, including:
− Particulate matter less than 10 microns in size (PM10)− Particulate matter less than 2.5 microns in size (PM2.5)− Total suspended particulate (TSP)
6. Nitrogen dioxide (NO2)
EPA has identified two types of standards for these pollutants:
1. Primary ambient air quality standards, which define levels of air quality necessary toprotect public health with an adequate margin of safety.
2. Secondary standards, which define levels needed to protect the public welfare fromany known or anticipated adverse effects of a pollutant.
Such standards are subject to revision, and additional primary and secondary standardsmay be promulgated as EPA deems necessary to protect the public health and welfare. Inaddition, Washington State administers its own standards (through PS Clean Air), someof which are more stringent than EPA standards. Table 1 lists the national, state, and localAmbient Air Quality Standards.
TABLE 1National and State Ambient Air Quality Standards
National
Pollutant Primary SecondaryWashington
State PS Clean Air
Carbon Monoxide
8-Hour Average 9 ppmV None 9 ppmV 9 ppmV
1-Hour Average 35 ppmV None 35 ppmV 35 ppmV
Sulfur Dioxide
Annual Average 0.03 ppmV None 0.02 ppmV 0.02 ppmV
24-Hour Average 0.14 ppmV None 0.10 ppmV 0.10 ppmV
3-Hour Average None 0.50 ppmV
1-Hour Average None None 0.40 ppmV 0.25b/0.40c ppmV
Lead
Quarterly Average 1.5 µg/mc 1.5 µg/mc None 1.5 µg/mc

APPENDIX 5-A: ODOR AND AIR QUALITY: TREATMENT PLANT
October 2003 9
TABLE 1National and State Ambient Air Quality Standards
National
Pollutant Primary SecondaryWashington
State PS Clean Air
Ozone
1-Hour Average 0.12 ppmV 0.12 ppmV 0.12 ppmV 0.12 ppmV
8-Hour Averagea 0.08 ppmV 0.08 ppmV None None
Particulate Matter (PM10)
Annual Arithmetic Average 50 µg/mc 50 µg/mc 50 µg/mc 50 µg/mc
24-Hour Average 150 µg/mc 150 µg/mc 150 µg/mc 150 µg/mc
Particulate Matter (PM2.5)
Annual Arithmetic Average 15 µg/mc 15 µg/mc None None
24-Hour Average 65 µg/mc 65 µg/mc None None
Particulate Matter (TSP)
Annual Geometric Average None None 60 µg/mc None
24-Hour Average None None 150 µg/mc None
Nitrogen Dioxide (NO2)
Annual Average 0.053 ppmV 0.053 ppmV 0.05 ppmV 0.053 ppmV
a The ozone 8-hour standards are included for information only. A 1999 federal court ruling blockedimplementation of these standards, which EPA proposed in 1997. EPA has asked the U.S. SupremeCourt to reconsider that decision.b Not to be exceeded more than twice in 7 consecutive days.c Never to be exceeded.ppmV = parts per million by volumeµg/m3 = microgram per cubic meterSources:Puget Sound Clean Air Agency Regulation 1, Article 11: Ambient Air Quality Standards. April 14, 1994.Washington State Department of Ecology Air Quality Program, 2000-2002 Air Quality Trends Report.
Geographic areas in which the NAAQS for all criteria pollutants are met are called“attainment areas.” Areas in which one or more standards are exceeded are called“nonattainment areas.” A nonattainment area must develop and implement a plan to meetand maintain NAAQS. Once EPA approves the plan, it becomes a federally enforceableState Implementation Plan (SIP) for air quality. When a nonattaining region again meetsthe standard, the area can be redesignated as a “maintenance area.” A maintenance area isa geographic region redesignated by EPA from nonattainment to attainment as a result ofmonitored attainment of the standard and EPA approval of a plan to maintain air qualitystandards for at least a 10-year period.
In the past, King and Snohomish Counties were “nonattainment areas” for carbonmonoxide and ozone. EPA redesignated the region as a “maintenance area” onOctober 10, 1996, for carbon monoxide and on November 26, 1996, for ground-levelozone. Before that, much of the area was nonattainment for PM and lead, but the area has

APPENDIX 5-A: ODOR AND AIR QUALITY: TREATMENT PLANT
October 2003 10
also met the national air quality standards for these pollutants and has been redesignatedas an attainment area for those pollutants. The project, therefore, would be located inareas that are currently designated “maintenance areas” for PM, lead, CO, and ozone. Inshort, the air quality in the area is good, and the focus of air quality regulatory efforts is toensure that it remains the same for the future. The area that the proposed project is inmeets the NAAQS for the other criteria pollutants and therefore is designated“attainment” for those pollutants.
2.2.2 Hazardous Air PollutantsIn addition to the criteria pollutants regulated by the NAAQS, there is another set offederally regulated air pollutants known as hazardous air pollutants, or HAPs. HAPs are aset of 188 chemicals specifically regulated by EPA that are known or believed to causehuman health effects. A list of HAPs is included in Attachment A.New air emission sources must comply with all federally established NewSource Performance Standards (NSPS) and National Emission Standards for HazardousAir Pollutants (NESHAP), where applicable, for the type and size of source proposed.Most NESHAPs only apply to “Major” sources of HAPs. A source would be designated aMajor Source of HAP if it emits or has the potential to emit more than 10 tons per year ofany individual HAP and/or 25 tons per year of all HAPs combined. Sources that areMajor for HAPs may trigger a NESHAP, and if so are required to install MACT. AMACT standard that applies to wastewater treatment plants that are Major Sources ofHAPs is 40 Code of Federal Regulations (CFR) Part 63, subpart VVV, National EmissionStandards of Hazardous Air Pollutants: Publicly Owned Treatment Works. If turbines orreciprocating engines are selected in the final design of the treatment plant, thecombustion technology used would need to comply with the new MACT standard, ifapplicable. Again, it is not expected that the plant would be a major HAP source, evenwith any selected combustion technology, but final determination would occur with theNOC application for the plant.
2.2.3 Toxic Air PollutantsNew emission sources must also comply with all state and local emission standards.Chapter 173-460 Washington Administrative Code (WAC) and Puget Sound Clean AirRegulation III regulate controls for new sources of toxic air pollutants (TAPs), which arealso called air toxics. TAPs are a specific set of more than 600 chemicals listed in WAC173-460-150. The list of TAPs is included in Attachment B. All of the 188 federal HAPsare included in the Washington State list of TAPs. The codes establish the systematiccontrol of new sources emitting TAPs to maintain air quality levels that would protecthuman health and safety. Most of the listed TAPs have been assigned an acceptablesource impact level (ASIL). ASILs are used to assess the impact of a single-source TAPemission on the ambient air. An Acceptable Source Impact Analysis is a procedure thatcompares maximum incremental ambient air impacts from a single source with ASILs.The permit requirements for new sources of TAPs require that the source install bestavailable control technology for toxics (TBACT), and that the resulting emissions beshown (by air dispersion modeling) to be below the ASILs1 outside the plant. Anapplicant can demonstrate that TAP emissions are below the ASIL by air dispersionmodeling or showing that the emission rates are below the small quantity emission rate
1 More detailed analysis is required for sources that apply TBACT and still exceed the ASIL.

APPENDIX 5-A: ODOR AND AIR QUALITY: TREATMENT PLANT
October 2003 11
(SQER) identified in WAC 173-460-080 (e). If the expected emissions from a source arebelow an SQER, no further air quality impact analysis is required in most cases. If theemissions are above the SQER, ambient air quality modeling is required. However, in allcases the TBACT must be installed. If the predicted ambient air impact of a compoundexceeds its assigned ASIL, an optional procedure can be used to show compliance withWAC 173-460, called a second-tier analysis. The second-tier analysis uses a healthimpact assessment instead of an ASIL.
There are two classes of TAPs, Class A and Class B, representing carcinogens (orsuspected carcinogens) and noncarcinogens, respectively. Most of the listed TAPs havebeen assigned an ASIL. ASILs are maximum ambient air concentrations in microgramsper cubic meter (µg/m3) that are used to assess the impact of single-source TAP emissionson the ambient air. Each class has a different averaging time for the ASIL. Impacts fromClass A TAPs are usually assessed on an annual average. Impacts from Class B TAPs,which are noncarcinogens, are usually averaged over a 24-hour average. Lead is one ofthose exceptions. Lead is a Class A toxic, but its impact is assessed on a 24-hour basis.For the Brightwater Treatment Plant, dispersion modeling was used to developconcentrations of TAPs at offsite receptors for the two locations. The concentrations arecompared to the ASILs. This is further discussed in Section 5.0, Air Quality ImpactsAssessment.
2.2.4 OdorWhile the Clean Air Act and state and local regulations set numerical standards forcriteria pollutants, HAPs, and TAPs, they do not set numerical standards for odors. PSClean Air regulates odors in the Puget Sound area and enforces local and state law. PugetSound Clean Air Regulation I, Article 9.11(a), Chapter 70.94 RCW and WAC 173-400-040 (4) and (5) address odors and emissions that may be a detriment to a person orproperty. Puget Sound Clean Air Regulation I, Article 9.11(a) says that:
It shall be unlawful for any person to cause or allow the emissionof any air contaminant in sufficient quantities and of such charac-teristics and duration as is, or is likely to be, injurious to humanhealth, plant or animal life, or property, or which unreasonablyinterferes with enjoyment of life and property.
PS Clean Air may take enforcement action under this regulation upon the properdocumentation and identification of the source of odor.
2.3 Air Quality Permitting RequirementsIn the state of Washington, all new sources must go through new source review (NSR)with the permitting authority, in this case PS Clean Air, unless specifically exemptaccording to Puget Sound Clean Air Regulation I, Section 6.03. The NSR processrequires the source to submit a “Notice of Construction and Application for Approval,”commonly referred to as a Notice of Construction (NOC) application. As part of the NOCapplication process, new emission sources must apply BACT, as defined by PS CleanAir, to minimize emissions and comply with all state and local emission standards.

APPENDIX 5-A: ODOR AND AIR QUALITY: TREATMENT PLANT
October 2003 12
In addition, for sources with potential emissions of more than 250 tons of a criteriapollutant per year2, a Prevention of Significant Deterioration (PSD) permit is required.Wastewater treatment plants typically emit less than 250 tons of criteria pollutants, andthe Brightwater Treatment Plant’s emissions would be well below this level; therefore, aPSD permit would not be expected for Brightwater Treatment Plant. For the PSD permitprocess, (i.e., for emission sources that emit greater than 250 tons/year of criteriapollutants), sources must propose BACT, as defined by EPA, to minimize emissions. TheBrightwater Treatment Plant triggers NSR, but not PSD.
In addition to state permitting requirements, a treatment plant may also be required toobtain a Federal Operating Permit under the Clean Air Act’s Title V Air Operating PermitStandards. Title V of the Clean Air Act requires states to adopt an EPA-approved airoperating permit program for major sources. A major source for Title V purposes isdefined as a source with an annual potential to emit more than 100 tons per year of anypollutant regulated under the federal Clean Air Act, or more than 10 tons per year of anyone HAP, or 25 tons per year of total HAPs. Sources with emissions of less than 100 tonsper year of all pollutants regulated under the federal Clean Air Act, less than 10 tons peryear of each HAP, and less than 25 tons per year of total HAPs, are considered to beminor sources for Title V. Within the project area, EPA has delegated authority to issueair quality operating permits to PS Clean Air. PS Clean Air is responsible for issuing AirOperating Permits and NOCs for new or modified sources of air pollution within King,Kitsap, Pierce, and Snohomish Counties. However, for major new or modified sourcesemitting greater than 250 tons/year, Ecology is responsible for issuing the PSD permit.
2.3.1 Best Available Control TechnologyNew air pollution sources in Washington State must control emissions of criteriapollutants to the BACT level and toxic air pollutants to the TBACT level. Emissions fromthe Brightwater Treatment Plant would include six criteria pollutants: nitrogen oxide(NOx), carbon monoxide (CO), sulfur dioxide (SO2), particulate matter less than10 microns in diameter (PM10) and less than 2.5 microns in diameter (PM2.5), lead andvolatile organic compounds (VOCs), and several toxic air pollutants and odorouscompounds. During the air quality permitting process, a BACT analysis would beconducted for each of the criteria pollutants, regulated substances, and odor emissions.Typically the toxic air pollutants are either VOCs or particulates. The BACT and TBACTanalyses follow the same general approach and often result in the same outcome. ABACT analysis typically includes five steps, called the “top-down” BACT approach. Thefive steps are:
1. Identify all potential control technologies.2. Eliminate technically unfeasible options.3. Rank effectiveness of control technologies.4. Evaluate cost effectiveness of control technologies.5. Select BACT.
The top-down approach provides that all available control technologies be ranked in adescending order of control effectiveness. To be “available,” a technology must bedemonstrated to be effective in a commercial application under comparable operating 2 EPA has established a 100 ton per year threshold for some classifications. However, puliclyowned treatment works (POTWs) are not one of those classes.

APPENDIX 5-A: ODOR AND AIR QUALITY: TREATMENT PLANT
October 2003 13
conditions. After available technologies are compiled and ranked, the technologies mustbe evaluated for technical feasibility, starting with the most effective technology. Acontrol technology can be considered unfeasible because of technical considerations,energy requirements, environmental impacts, or economic impacts. If the most effectivetechnology is eliminated in this fashion, then the next most effective alternative isevaluated using these same criteria. The process is repeated until either a technology isselected or there are no remaining technologies to consider.
Because BACT is an evaluation of control technologies, and because technologies arecontinuously being improved or new technologies introduced, the technology selected asBACT would change over time. Because it could be many years from the time of theFinal EIS to the start of construction, BACT determinations are made during the NOCapplication process. King County recently submitted an NOC application for two co-generation turbines at the King County South Wastewater Treatment Plant(Kennedy/Jenks Consultants, 2003). For this Final EIS, the control technologies used toestimate emissions from the co-generation facility at the Brightwater Treatment Plant arebased on the selection made for the South Treatment Plant in the NOC application. ABACT analysis for the Brightwater Treatment Plant would be conducted when an NOCapplication is submitted for the treatment plant; however, it is unlikely that the BACTanalysis at that time would result in increased emissions.
For major sources of HAP emissions, EPA has developed MACT standards for publiclyowned treatment works (POTWs) and is in the process of developing new MACTstandards for turbines and reciprocating engines at major HAP sources. The MACT forPOTWs is applicable only to facilities that are a major source of HAP emissions. TheBrightwater Treatment Plant, as currently shown in the conceptual designs, is not a majorsource of HAP emissions. If turbines or reciprocating engines are used in the final designof the treatment plant, the combustion technology used would need to comply with thenew MACT standard, if applicable. Again, it is not assumed that the plant would be amajor HAP source, even with any selected combustion technology, but finaldetermination would occur with the NOC for the plant.
2.3.2 Federal ProgramsThe EPA has a list of regulated substances (see Attachment C) subject to therequirements for Chemical Accident Prevention Provisions, Risk Management Planning(40 CFR 68). The Risk Management Plan (RMP) chemicals are toxic and flammablechemicals that EPA has determined pose a threat when they are present above certainthreshold quantities. While the Brightwater Treatment Plant is expected to use sodiumhypochlorite, sodium hydroxide, sulfuric acid, and ferric chloride for its various odorprevention and wastewater treatment processes, none of these chemicals are included onthe EPA’s list of regulated substances in 40 CFR 68. Because none of the regulatedchemicals would be present at the plant, the plant would not need an RMP.
A list of types and quantities of chemicals used onsite at the Brightwater Treatment Plantwould be required under the Federal Emergency Planning and Community Right-To-Know Act (as implemented in 40 CFR 372, 40 CFR 355, and 40 CFR 370). Submittal ofa Form R may be required annually by 40 CFR 372 for specific toxic chemicals. Sulfuricacid, which could be used in the multistage odor scrubbers, could potentially be used atthe treatment plant in quantities that exceed the Form R annual use quantity threshold for

APPENDIX 5-A: ODOR AND AIR QUALITY: TREATMENT PLANT
October 2003 14
reporting. The plant would likely be subject to the annual reporting requirements of40 CFR 355 because the amount of sulfuric acid stored at the plant would be above the40 CFR 355 storage threshold quantity of 1,000 pounds. The plant would need to submitinitial material safety data sheet (MSDS) information and annual Tier II forms for anumber of different chemicals, as required by 40 CFR 370; the Tier II form information isrequired annually for chemicals stored above the 40 CFR 370 threshold quantities (formost chemicals this is 10,000 pounds). These submittals would be sent to the WashingtonState Emergency Response Commission, the Local Emergency Planning Committee, andthe local fire department. If the chemicals used at the plant differ in type or quantity fromthose currently proposed, the applicability of these regulations would need to bereevaluated. Further information on chemical storage and handling can be found inChapter 9, Environmental Health.
2.4 Project-Specific Regulatory RequirementsTo fulfill the air quality requirements for the Brightwater Treatment Plant, the followingactions may be required:
• File NOC application and receive an Order of Approval permit under Section 6.07 ofPuget Sound Clean Air Regulation I, Article 6: New Source Review.
• Apply for and receive an Air Operating Permit in compliance with the WashingtonClean Air Act, Chapter 70.94 RCW, Chapter 173-401 of the WAC, and Puget SoundClean Air Regulation I, Article 7.
Based on the currently assumed design parameters, the treatment plant would be requiredto have an NOC, but would not be required to have a Federal Title V operating permitbecause it would likely emit less than 100 tons per year of any criteria pollutant, less than10 tons per year of any single HAP, or less than 25 tons per year of any combination ofHAPs. As part of the NOC application process, new emission sources must also complywith all state and local emission standards. New emission sources of criteria pollutantsmust apply BACT and new emission sources of toxic air pollutants must apply TBACT,as defined by PS Clean Air. Because the treatment plant would not be expected to be amajor source of HAPs, federal MACT standards should not be applicable to thistreatment plant unless turbines or reciprocating engines are used in final plant design.
An annual emission inventory submitted to PS Clean Air would be required for thetreatment plant. The emission inventory would report the annual emissions of criteriapollutants or air contaminants, which include NOx, CO, VOCs, SOx, and PM. Thetreatment plant would also be required to report emissions of TAPs and HAPs. Currently,facilities are not required to report emissions of the greenhouse gases carbon dioxide andmethane, but this may change in the next few years if the regulatory agencies adoptspecific standards, regulations, or reporting requirements focused on greenhouse gases.
3 ELEMENTS COMMON TO ODOR AND AIR QUALITYANALYSES
3.1 IntroductionThis section provides an overview of the project elements and tools that are common toboth the odor and air quality impact analyses. The discussion includes, in order: a review

APPENDIX 5-A: ODOR AND AIR QUALITY: TREATMENT PLANT
October 2003 15
of the treatment plant processes that contribute air emissions, identification of the types ofmodels used, and a description of the scenarios modeled.
3.2 Treatment Plant OverviewThe treatment plant proposed for either the Route 9 or Unocal site has most of the samemajor process units that contribute air emissions. These include:
• Influent pump station• Headworks (screening and degritting)• Primary sedimentation basins• Ballasted sedimentation basins• Aeration basins• Membrane tanks• Disinfection for Puget Sound discharge (Unocal only. At Route 9, disinfection occurs
in the effluent tunnel.)• Disinfection for reuse• Diesel-fired standby internal combustion engine generators• Co-generation turbines (digester gas and natural gas)• Enclosed flare (digester gas)• Hot water boilers (natural gas)
3.3 Mass Emission and Dispersion ModelingTwo models were used in the air quality impacts analysis: a model to develop massemissions, and a model to simulate offsite impacts from the treatment plant emissions.
3.3.1 Mass Emission ModelingBecause Brightwater is a new treatment plant, direct source testing of its process units isnot feasible. Mass emissions of air toxics from the treatment plant’s liquid processes werepredicted using the Bay Area Sewage Toxics Emission (BASTE) model. BASTE is a fatemodel specifically designed for use by publicly owned treatment works (POTWs) toestimate emissions from liquid wastewater treatment processes due to volatilization,sorption, and biodegradation. BASTE is one of several air emissions models that can beused. It is POTW-specific, has been validated on numerous POTW applications since itwas developed in 1989, and is one of four models (others are ToxChem, Water9, andWater7) currently accepted by EPA for estimating air emissions from POTWs. Inputrequirements for BASTE are generally more extensive than other general fate models, butthe effort put into model preprocessing and information preparation significantlyincreases flexibility and accuracy of emission estimates from any wastewater treatmentprocess, including the ones proposed for the Brightwater Treatment Plant. A comparisonof the three models (BASTE, Water7 [an earlier version of Water9] and ToxChem) wasdone by Tata3 and showed that of the three models available, BASTE yielded the smallestdifference between the predicted emission rates and directly measured emissions.
The detailed input requirements of BASTE allow the model to be highly plant-specificand to analyze any complex treatment configuration. Important properties that affect thefate of toxic chemicals in wastewater include liquid and gas phase diffusivity, Henry’s
3 Tata, Prakasam, et al. Prediction of Volatile Organic Compound Emissions from Publicly OwnedTreatment Works.

APPENDIX 5-A: ODOR AND AIR QUALITY: TREATMENT PLANT
October 2003 16
law constant, octanol-water partition coefficient, covered processes, ventilation air, andbiodegradation rate constant. Diffusivities and the Henry’s law constant are important fordefining the extent of volatilization, and the octanol-water partition coefficient has beenobserved to correlate with sorption to solids particles and biomass. Emission rates vary ifthe process is covered or uncovered and are impacted by any covered processes’ventilation air flow rates.
In a wastewater treatment plant, gas-liquid partitioning can occur at the surface ofchannels, to/from bubbles used in processes with aeration, and over weirs and drops. Foreach type of system, the variables that affect gas-liquid partitioning can be quite different.The mass flux is usually modeled using a concentration “driving-force” of the form:
( )HCCKF go /1 −=
where F is the flux with units of mass per time per unit area, C1 is the concentration in thebulk liquid with units of mass per volume, Cg is the concentration in the bulk gas withunits of mass per volume, H is the dimensionless Henry’s Law constant, and Ko is anoverall transfer or partition constant with units of length per time.
The BASTE model accounts for ventilation in the headspace above a covered liquidprocess. As air flow rates increase, the concentration in the exhaust air stream decreases,but the mass emissions could increase because the flux rate from the surface couldincrease. BASTE does not predict equilibrium concentrations by mass flux rates based onthe input conditions.
The influent HAP compound list and concentrations in BASTE are provided inAttachment D. These concentrations are default values based on Association ofMetropolitan Sewage Agencies (AMSA) 1993 National Influent Survey, which obtainedinfluent toxic concentration data from 181 POTWs. Default values from AMSA are anacceptable data source when no actual influent data are available. The influentconcentrations and mass loading for the King County South Wastewater Treatment Plantwere reviewed, but the total mass loading of the AMSA values was more conservativeand the AMSA values therefore were used.
The BASTE model output is shown as a mass emission rate in pounds per year (lb/yr)(see Section 5, Air Quality Impacts Assessment). The mass emission rate is divided bythe process ventilation rate in cubic feet per minute (cfm) and converted to aconcentration (kg/m3). The ideal gas law, assuming an air temperature of 21°C and oneatmosphere pressure, is used to convert the value to a part per million by volumeconcentration (ppmV). The mass emission rates are listed in Section 5, Air QualityImpacts Assessment.
3.3.2 Dispersion ModelingAir dispersion models are used routinely to estimate air quality and odor impacts fromemissions released by point (such as stacks), area (such as water holding basins), andvolume (such as open truck-loading areas) sources. These types of sources generallycharacterize the majority of sources that would emit odors and air toxics at a wastewatertreatment plant. Air dispersion modeling is the generally accepted, and EPA approved,tool used to predict offsite impacts.

APPENDIX 5-A: ODOR AND AIR QUALITY: TREATMENT PLANT
October 2003 17
EPA’s Industrial Source Complex Short-Term Dispersion Model (ISCST3,version 02035) was used in the air dispersion modeling analysis to evaluate offsiteimpacts. The ISCST3 model is recommended by EPA for use in demonstratingcompliance with the NAAQS. The ISCST3 model uses local hourly meteorological datato define the local dispersion environment and accepts a receptor array that containstopographic data from the U.S. Geological Survey (USGS). It is also capable of modelingpoint, area, and volume sources. The ISCST3 is widely used in odor and air qualityimpact assessments. ISCST3 is a straight line Gaussian plume model that usesmathematically and statistically averaged approximations of plume rise and downwinddispersion behavior to estimate downwind impacts. The model calculates the impactsfrom the treatment plant’s emissions at multiple locations (receptors) around thetreatment plant beyond the plant’s property line.
Two other models are typically used for air dispersion modeling, AERMOD andCALPUFF. AERMOD is also a Gaussian plume model. The dispersion coefficients arebased on boundary layer theory rather than empirically derived from sampling data. Themodel has been validated by data sets with sampling data averaged over a 1-hour timeperiod. Although proposed by EPA as a replacement for ISCST3, it has not been formallyaccepted as such.
EPA does not recommend a model for odor dispersion modeling. EPA provides noguidance on how odor dispersion modeling studies are to be performed. If EPA adoptsAERMOD as the preferred model, it does not mean that AERMOD must be used for odormodeling or that ISCST cannot be used.
The acceptance of AERMOD by EPA is specific to air quality demonstrations forpollutants with NAAQS. EPA does not have a consistent policy on modeling air toxics.Many air quality modeling studies for air toxics are driven by state rather that federalregulations. Thus, it would be up to the state or local permitting authority to approve aparticular model for air toxics modeling.
CALPUFF is a Lagrangian puff model. A recent Federal Register notice formallyendorsed CALPUFF as the preferred model for long-range transport studies and wouldgrant approval on a case-by-case basis for studies where complex wind flows are a factorin modeling impacts. The model can be used for short transport times as well. Themeteorological data needed to run the model can be a single meteorological station (aswould be the case for ISCST3) or developed from several stations (as would be requiredfor long-range transport studies). Use of the CALPUFF model for odor studies has beenlimited.
A comparison of the ISCST3, AERMOD, and CALPUFF models for odors wasconducted by Diosey4. This comparison showed that maximum predicted impacts from atypical wastewater treatment plant were similar for ISCST3 and CALPUFF run in therefined mode. Predicted impacts for AERMOD were a factor of 24 lower than ISCST3and a factor of 2 lower than CALPUFF run in the screening model.
4 Diosey, Phyllis G., Maureen E. Hess, and Larraine Farrell. 2002. Evaluation of AlternativeDispersion Models for Use in Odor Management. WEFTEC 2002 75th Annual Technical Exhibitionand Conference, Conference Proceedings. Water Environment Federation, Alexandria, VA.

APPENDIX 5-A: ODOR AND AIR QUALITY: TREATMENT PLANT
October 2003 18
The ISCST3 air dispersion model computes a concentration impact for each pollutant forevery hour of every day at each individual receptor point. The emissions from the plantare dispersed in the direction the wind is blowing for each hour of meteorological datathat are input into the model. Therefore, the impacts at each receptor are the result of thedirection of the wind, the speed of the wind, the air temperature, the amount of sunlight,and the atmospheric stability (the ability of the atmosphere to disperse pollutants bymixing the air both vertically and horizontally). Stability is affected by temperature,sunlight, and wind speed. In general, the lower the wind speed, the less air is able to mixand dilute emissions. Temperature also affects stability. When temperature does notchange much from one hour to another, the atmosphere is also less able to mix and dilutepollutants. Sunlight also affects stability. The more sunlight, the better the atmospheremixes vertically, resulting in better dispersion. The impacts at each receptor are also afunction of exhaust parameters such as exhaust height, temperature and stack exitvelocity. Emissions that are from tall stacks and at high temperature and high velocitygenerally get more diluted than emissions from low, cool stacks with a low exit velocity.
For the Brightwater Treatment Plant, standard EPA-approved methodology andapproaches were used that match required analysis and needs for siting a new treatmentplant at both targeted locations. These approaches are based on criteria set forth by PSClean Air and consistent with the EPA’s Guideline on Air Quality Modeling. Thisdocument describes the modeling process so that models are used according to the waythey were designed. By following this process, model results would be comparable witheach other and with results from other modeling.
Modeling Puff Conditions for Odor ImpactsISCST3 predicts 1-hour average pollutant concentrations. However, odor nuisances aremost often associated with puff conditions, or exposure times, on the order of seconds orminutes rather than hours. Modeling puff conditions is not required or necessary for airtoxic (HAP and TAP) risk analyses because risk analyses are based on longer periods oftime, such as 24-hour averages or lifetime (70-year) exposures. Puff conditions bestmimic potential odor nuisance events. Averaging over an hour has the effect ofsmoothing out the odor concentration peaks. Therefore, the 1-hour odor concentrationspredicted by ISCST3 were converted to peak 3-minute odor concentrations (using thepower law) for the odor modeling. The peak 3-minute odor concentrations are severaltimes greater than the 1-hour average odor concentration and better represent puff odorconditions.
Specifically, the 1-hour odor concentrations predicted by ISCST3 were converted to peak3-minute odor concentrations using the following power law:
p
shours t
= −
min601χχ
where χs is the short-term odor concentration, χ1-hour is the model-predicted 1-hour odorconcentration, ts is the desired short term averaging time (in minutes), and p is the power-law exponent. The value of the p varies by atmospheric stability class. Table 2 shows thepeaking factors used to convert from 1-hour to 3-minute concentrations.
Stability is categorized into six stability classes, A through F. Class A (Unstable)represents excellent dispersion characteristics, such as considerable vertical and

APPENDIX 5-A: ODOR AND AIR QUALITY: TREATMENT PLANT
October 2003 19
horizontal air movement, which allows pollutants to disperse easily. It has more large-scale turbulence and promotes mixing through a greater depth of the atmosphere. Alooping plume is characteristic of Unstable conditions. Because the concentration in apuff from the source can be much greater than the time average distribution through themixing layer, the peaking factor is greater for Unstable conditions than for more stableconditions.
TABLE 2Three-Minute Peaking Factors
Stability ClassPower-Law
Exponent (p)3-Minute
Peaking Factora
A, BCD
E, F
0.50.330.2
0.167
4.472.711.821.65
a For example, under a stability category A, the peak 3-minute concentration would be 4.47 timesgreater than the 1-hour average concentration.Source: Wang, Jie, and Kenneth J. Skipka. Dispersion Modeling of Odorous Emissions. RTPEnvironmental Associates. June 13, 1993.
Class F (Very Stable) represents very poor air movement. Very Stable air is defined ashaving low wind speed, little change in wind direction, overcast conditions, andtemperature inversions. The scale of turbulence is smaller and the depth of the mixinglayer is often limited by temperature inversions. Coning or fanning plumes are typical ofmore stable conditions. Class F conditions result in higher concentrations of airpollutants. Because puffs from a source do not meander through as great a mixing layer,the difference between the concentration in a puff and the time-averaged distribution issmaller and the peaking factor is smaller for Very Stable conditions.
A common mistake in odor studies is to apply the “most conservative” Peaking Factor of4.47 to the highest predicted concentration, which often occurs during stable conditions.This results in a “peak” concentration that may be three times greater than theconcentration that would be obtained if the correct approach, as described in Table 2,were used. During stable conditions, the peak and average conditions show minimalvariation and, therefore, the peaking factor is smaller.
Air and Odor Model Dispersion CoefficientsThe Pasquill-Gifford dispersion coefficients used in the ISCST3 model for both odor andair toxics are based on ambient sampling data collected as part of various studies done byEPA. For many of these studies, the emission source was a ground-level release of aneutrally buoyant gas. The samples were collected along arcs located 100 meters toseveral kilometers downwind. The sample time ranges from 6 to 15 minutes. The types ofemission sources found at a wastewater treatment plant are often ground-level releases orrelatively short stacks that emit a nearly neutrally buoyant gas. Transport times for odorstudies are relatively short, often to the nearest plant property boundary.
ISCST3 was run with the following options, as recommended in EPA’s Guidelines on AirQuality Modeling:
• Regulatory default options• Direction-specific building downwash
APPENDIX 5-A: ODOR AND AIR QUALITY: TREATMENT PLANT
October 2003 20
• Actual receptor elevations• Complex/intermediate terrain algorithms
ISCST3 allows the selection of either rural or urban dispersion coefficients. The Auerland-use classification was used to determine the dispersion model for this analysis.Under the Auer scheme, if more than 50 percent of the land area within 3 kilometers ofthe treatment plant has an urban land use classification, the urban dispersion coefficientsshould be used. The urban lands are industrial, commercial, and compact residential areasthat have limited areas of vegetation due to the presence of buildings or paving. All otherland use types, including common single-family residential areas, undeveloped areas, andagricultural areas, would be considered rural.
Rural dispersion coefficients were used for both the Route 9 and Unocal sites. More than50 percent of the land use within 3 kilometers of the Route 9 site would be forested andsingle-family residential areas. The Unocal site has water on one side and not manybuildings or parking lots. Neither site is considered urban for the purpose of dispersionmodeling.
Receptor GridThe dispersion model calculates the impacts from the treatment plant emissions atmultiple locations around the treatment plant. The locations where the impacts arecalculated are called receptors. The grid spacing for receptor points is determined byguidelines for setting up models according to the EPA document Guidelines on AirQuality Modeling. This document describes the modeling process so that models are usedaccording to the way they were designed. By following this process, model results areconsistent and comparable.
Several sets of receptors were used to obtain the location and magnitude of the maximumoffsite concentrations at each treatment plant site. Receptors were located along the sitefence line (which is inside the property line) and beyond for the air toxics modeling. Forthe odor modeling, receptors were located at the property line and beyond. A coarse gridwas centered on each site with a 1,640-foot (500-meter) spacing between receptors. Thisgrid extended approximately 5 miles around the site. For the air quality modeling, a328-foot (100-meter) spaced grid centered on the treatment plant extended 3,280 feet(1,000 meters) from the treatment plant fence line. Fence line receptors were placed at164-foot (50-meter) intervals around the treatment plant.
In addition to the receptor configuration described above, a receptor grid was added to theUnocal Structural Lid sub-alternative analysis to consider areas where the public couldhave access. This receptor grid had 82-foot (2-meter) spacing between receptors over theentire area of the multimodal lid.
Determining sensitive receptors is part of the process that King County is required tofollow in order to show compliance with federal, state, and local air pollution regulations.As part of this process, an NOC Permit Application would be prepared for submittal andwould have to be approved by PS Clean Air before construction could begin.
Sensitive receptors are identified to acknowledge the presence of people within a 5-mileradius of the treatment plant site who may experience compromised respiratory systems.People with compromised respiratory systems may be more sensitive to air pollutants that

APPENDIX 5-A: ODOR AND AIR QUALITY: TREATMENT PLANT
October 2003 21
may or may not be odorous. The term “sensitive receptor” is not meant to be applied tothose who are more likely to detect an odor. Additional receptors were added to themodel at the locations in Table 3 to ensure that concentrations were calculated at“sensitive receptors” such as schools, parks, hospitals, retirement homes, and seniorcitizen and daycare centers. The model grid included multiple receptors in the vicinity ofthe ferry terminal and on the lid of the multimodal facility.
Areas that were not specifically for seniors or children, such as apartment buildings, orlocations were sensitive individuals would typically not spend a significant amount oftime each year, such as recreational areas, were not included in the list of added sensitivereceptors.
Table 3 shows the sensitive receptors that were added to the model’s receptor grid. Thelocations of the sensitive receptors were identified using GIS data files provided by KingCounty and Snohomish County. This table may not be a complete listing of sensitivereceptor locations; however, with model receptors located every 100 meters, there is areceptor near all potential sensitive receptor locations within 1,000 meters of the plant. Ifthe concentrations at specific receptor points are below the ASIL, then the areas betweenthe receptor points are also below the ASIL.
TABLE 3Added Receptor Points for Sensitive Receptor Locations
Sensitive Receptors Within 5-Mile Radiusof the Route 9 Site
Sensitive Receptors Within 5-Mile Radius ofthe Unocal Site
Bear CreekElementary
Kokanee ElementarySchool
Albert Einstein MiddleSchool
LynnwoodIntermediate School
Bellevue Christian-Woodinville
Leota Junior HighSchool
Aldercrest ConvalescentCenter
Madrona MiddleSchool
Bothell High School Maltby ElementarySchool
Aldercrest Learning Center MeadowdaleElementary School
Canyon CreekElementary School
Maywood Elementary Aurora-Edmonds NursingHome
Meadowdale HighSchool
Canyon Park JuniorHigh School
Montessori HouseSchool
Beverly Elementary School Meadowdale MiddleSchool
Cathcart ElementarySchool
Northshore JuniorHigh School
Cedar Valley ElementarySchool
Meridian ViewElementary
Cedar Park Christian Ricketts Building Cedar Way ElementarySchool
Mountlake TerraceElementary School
CedarwoodElementary School
Robert FrostElementary
Cedarbrook Elementary Mountlake TerraceSenior High School
Chrysalis School SecondaryAlternative School
Chase Lake ElementarySchool
North CityElementary
Cottage LakeElementary
Shelton ViewElementary School
College Place ElementarySchool
ParkwoodElementary
Eastern Star NursingHome
Skyview MiddleSchool
College Place MiddleSchool
Planned Parenthood
Crystal SpringsElementary School
Sorenson EarlyChildhood Center
Echo Lake Elementary Scriber Lake HighSchool

APPENDIX 5-A: ODOR AND AIR QUALITY: TREATMENT PLANT
October 2003 22
TABLE 3Added Receptor Points for Sensitive Receptor Locations
Sensitive Receptors Within 5-Mile Radiusof the Route 9 Site
Sensitive Receptors Within 5-Mile Radius ofthe Unocal Site
Evergreen Academy St. Brendan School Edmonds CommunityCollege
Seaview HeightsElementary School
FernwoodElementary School
Sunrise Elementary Edmonds ElementarySchool
SherwoodElementary School
Frank LoveElementary School
Support ServicesBuilding
Edmonds LandingRetirement Community
Shoreline Children'sCenter
Gateway MiddleSchool
TimbercrestElementary
EdmondsRehabilitation/Health Care
ShorelineCommunity College
Heritage ChristianSchool
Timbercrest JuniorHigh School
Edmonds School District#15
Shorewood SeniorHigh School
Hillcrest Building WellingtonElementary
Edmonds/Woodway HighSchool
Snohomish CountyChristian School
Hilltop ElementarySchool
Westhill Elementary Educational ServiceCenter
South County SeniorCenter
Hollywood HillElementary
Woodin Elementary Evergreen ElementarySchool
St. Luke School
John Muir Elementary Woodinville HighSchool
Highland TerraceElementary
St. Mark School
Heritage ChristianSchool
WoodinvilleMontessori School
King's Elementary/HighSchool
Stevens MemorialHospital
Kamiakin Junior HighSchool
WoodmoorElementary
Lake Forest ParkElementary
Sunset MiddleSchool
Lake Forest ParkMontessori
Syre Elementary
Lynndale ElementarySchool
Terrace ParkElementary School
Woodway Elementary The HighlandsSchool
Meteorological DataTypically, air dispersion modeling is performed during the permitting phase.Meteorological data from the nearest offsite meteorological station are used becauseonsite meteorological data typically are not available. This is a routine procedure and isaccepted by Ecology. Any available onsite data would be used.
For the Brightwater System Final EIS, air dispersion modeling was performed. Themeteorological data used in the air dispersion modeling analysis were above and beyondthe commonly used offsite data from the nearest meteorological station. Meteorologicalstations were installed at both the Route 9 and Unocal sites in July 2002 to gather site-specific data. Nine months of data (July 2002 through March 2003) were gathered priorto the preparation of this Technical Appendix (1 year of data were not yet available when

APPENDIX 5-A: ODOR AND AIR QUALITY: TREATMENT PLANT
October 2003 23
the modeling was performed). In addition, 4 years of meteorological data from PaineField were analyzed. Two separate model runs were conducted for each site, one usingthe site-specific data and one using the Paine Field data. By using both data sets, theworst-case data from both meteorological station were modeled. Again, this is moreanalysis than is typically performed for an EIS.
By using both the site data and Paine Field data, the model predicted worst-casemaximum impacts for any single hour of meteorological data from the combined data set.The Paine Field data had a greater frequency of Very Stable, or worst-case, conditionsthan the site-specific data. All meteorological data from Paine Field and the site-specificstations were modeled, including worst-case meteorological conditions. The model wouldtypically overpredict worst-case impacts, so by using the Paine Field data (which hasmore worst-case days) with the site-specific data, an extra degree of conservatism wasincorporated into the modeling.
Wind roses for the three meteorological stations are shown in Figures 1 through 3. Awind rose is a graphical representation of wind speed and direction over a discrete periodof time. It is a 360-degree compass that looks like a flower with petals that represent thedirection from which the wind is blowing. The four main wind directions—north, south,east and west—are labeled on each figure. The wind speed is expressed numerically oneach of the concentric rings of the rose. The length of each petal segment indicates thepercentage of wind speed observations that fall into a specific speed category, or ring, foreach wind direction. The wind speed categories are identified by different colors in thelegend at the bottom of the wind rose figure.
Upper Air Station DataIn dispersion modeling, both surface air and upper air data are used. The surface air dataused for the Brightwater Treatment Plant modeling were from the meteorological stationsas described above. Upper air data are from weather balloons that are released from theground and travel high into air (thousands of feet) and gather pressure, temperature,relative humidity, wind speed, and wind direction data. There are two upper air stations inthe state of Washington, one in Spokane and one on the Olympic Peninsula at Quillayute.The Quillayute data set is the more appropriate data set of the two to use for both theUnocal and Route 9 sites as the climate is more similar to that in Western Washingtonand was used in the dispersion modeling.
Paine FieldFor the Draft EIS, meteorological data used for the dispersion modeling consisted ofsurface data collected at the Paine Field Airport station in Everett, Washington. Fouryears of data (1961, 1962, 1964, and 1965) were used in the model. These were the mostcomplete data sets available from Paine Field. In 1966 Paine Field followed the trend ofother small airports in the area and started collecting data for only 18 hours of every day.The airport ceased collecting data at night, because few airplanes landed on Paine field atnight. Since many inversions and stable air conditions occur at night, the data collected atPaine Field since 1966 would not include those data. Therefore, the data from 1961,1962, 1964, and 1965 provide more stable air conditions for the modeling and producemore conservative results than data from more recent years.

APPENDIX 5-A: ODOR AND AIR QUALITY: TREATMENT PLANT
October 2003 24
A wind rose of the Paine Field data is presented in Figure 1. The hourly data are shown inTable 4. The frequency of winds speeds less than 0.51 meter per second (mps) isindicated at the bottom of the table, because wind speeds this low are not assigned a winddirection.
TABLE 4Paine Field Meteorological Station (January 1961 – December 1965)
Wind Speed (mps)
WindDirection
0.51 -1.80
1.80 -3.34
3.34 -5.40
5.40 -8.49
8.49 -11.06 >11.06 Total
Hours
N 323 947 590 47 4 0 1911NNE 235 406 98 2 0 0 741NE 398 647 107 4 0 0 1156ENE 415 634 230 34 5 1 1319E 391 777 409 74 1 0 1652ESE 1052 1865 840 64 0 0 3821SE 371 969 604 85 1 0 2030SSE 367 959 825 276 24 0 2451S 593 1894 2210 1110 173 30 6010SSW 355 724 917 636 109 27 2768SW 303 329 91 24 2 0 749WSW 66 124 40 1 0 0 231W 97 171 53 1 0 0 322WNW 175 311 94 28 2 0 610NW 309 459 191 37 1 0 997NNW 879 1674 946 115 2 1 3617Totalnumber ofhours
6,329 12,890 8,245 2,538 324 59 30,385
Total number of hours in data set: 35,067 hoursFrequency of winds less than 0.51 mps: 13.34 percentAverage Wind Speed : 3.18 mps
mps = meter per second
Site-Specific Meteorological StationsSite-specific meteorological data are currently being gathered from two monitoringstations, one near the Unocal site at the Edmonds Marina and one on the Route 9 site.Meteorological monitoring stations have been collecting data at the prospective Unocaland Route 9 sites since July 2002. Data from July 1, 2002, through March 31, 2003, arepresented here. The monitoring stations collect data to document wind speed, winddirection, air temperature, relative humidity, solar radiation, barometric pressure, andrainfall.
The meteorological monitoring program was designed to characterize each site’s uniquewind, temperature, and atmospheric stability for use in air quality models to perform airquality impact analyses for the Final EIS. The data were collected according to EPAstandards associated with Prevention of Significant Deterioration (PSD) requirements for

APPENDIX 5-A: ODOR AND AIR QUALITY: TREATMENT PLANT
October 2003 25
new major stationary sources of air emissions. Solar radiation, vertical temperaturedifference measurements, and standard deviation of wind direction (sigma-theta) wereused for calculation of atmospheric stability class. The program is described inMeteorological Monitoring and Quality Assurance Plan - Brightwater WastewaterTreatment Facility Site Assessments (Brown and Caldwell, 2003).
Aluminum towers 10 meters tall were installed specifically for this monitoring program.Meteorological sensors on the towers were installed to measure wind speed, winddirection, and temperature at 10 meters; calculated temperature difference between10 and 2 meters (∆T); relative humidity at 2 meters; solar radiation at 3 meters; andbarometric pressure at 1.5 meters. Rain gauges were installed a short distance from thetowers.
Route 9 SiteThe Route 9 monitoring station is located just east of Route 9 about 0.5 mile north of theintersection of Route 9 and Highway 522, approximately 3 miles northeast of the town ofWoodinville, WA. The site lies in a small valley with hills rising several hundred feetwithin 1,000 feet to the east and south of the tower. This location for the meteorologicalstation was selected because it is within the proposed boundary of the Route 9 treatmentplant site. Therefore, the data collected are representative of the site.
Analysis of the Route 9 data collected from July 2002 through March 2003 show that, forthe 9-month period, the winds predominantly blow from the north 50 percent of the timeand from the south 23 percent of the time. This pattern is consistent during both winterand summer months. The Route 9 onsite meteorological data are presented as a wind rosein Figure 2. The winds at this site generally follow the terrain and flow up and down theSR-9 corridor, mostly following the Little Bear Creek drainage. Nighttime wind patternsare also from the north. The hourly data are shown in Table 5. The frequency of windspeeds less than 0.51 meter per second is indicated at the bottom of the table, becausewind speeds this low are not assigned a wind direction.
TABLE 5Route 9 Site Wind Speed and Direction (onsite data July 2002 – March 2003)
Wind Speed (mps)
WindDirection
0.51 -1.80
1.80 -3.34
3.34 -5.40
5.40 -8.49
8.49 -11.06 >11.06 Total
Hours
N 735 232 33 0 0 0 1000
NNE 1663 132 1 0 0 0 1796
NE 282 21 1 0 0 0 304
ENE 128 8 0 0 0 0 136
E 158 13 0 0 0 0 171
ESE 204 60 0 0 0 0 264
SE 225 33 0 0 0 0 258
SSE 238 76 0 0 0 0 314
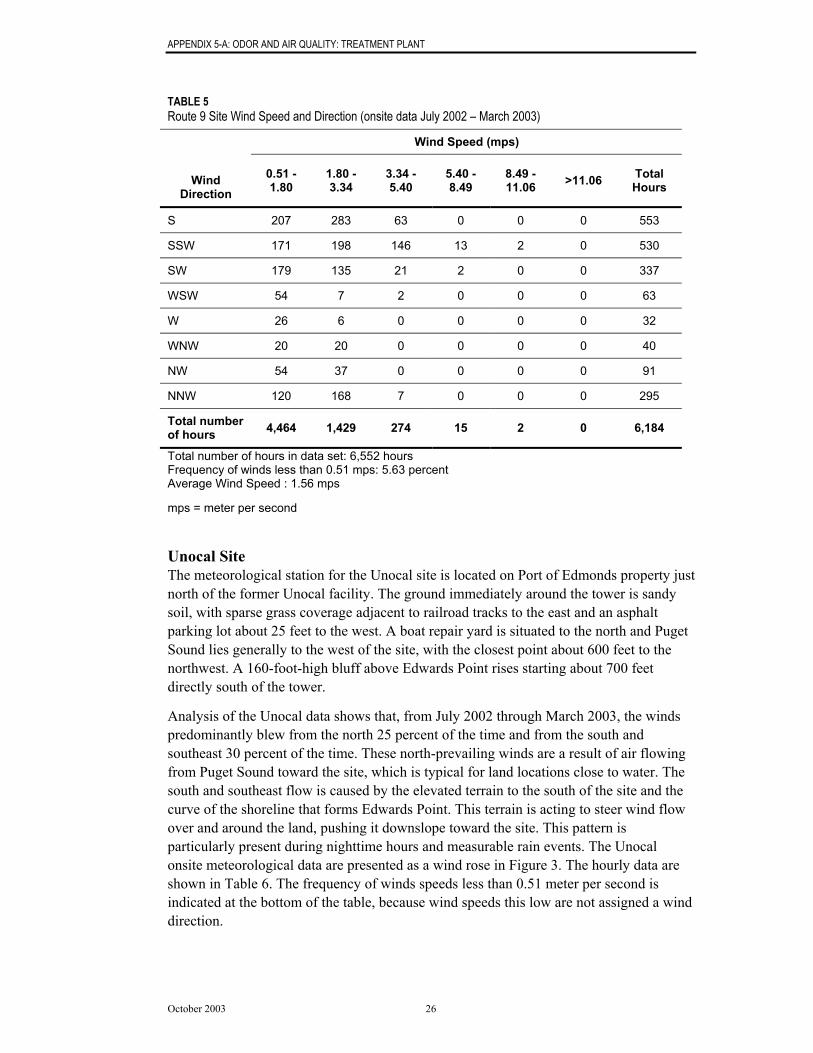
APPENDIX 5-A: ODOR AND AIR QUALITY: TREATMENT PLANT
October 2003 26
TABLE 5Route 9 Site Wind Speed and Direction (onsite data July 2002 – March 2003)
Wind Speed (mps)
WindDirection
0.51 -1.80
1.80 -3.34
3.34 -5.40
5.40 -8.49
8.49 -11.06 >11.06 Total
Hours
S 207 283 63 0 0 0 553
SSW 171 198 146 13 2 0 530
SW 179 135 21 2 0 0 337
WSW 54 7 2 0 0 0 63
W 26 6 0 0 0 0 32
WNW 20 20 0 0 0 0 40
NW 54 37 0 0 0 0 91
NNW 120 168 7 0 0 0 295
Total numberof hours 4,464 1,429 274 15 2 0 6,184
Total number of hours in data set: 6,552 hoursFrequency of winds less than 0.51 mps: 5.63 percentAverage Wind Speed : 1.56 mps
mps = meter per second
Unocal SiteThe meteorological station for the Unocal site is located on Port of Edmonds property justnorth of the former Unocal facility. The ground immediately around the tower is sandysoil, with sparse grass coverage adjacent to railroad tracks to the east and an asphaltparking lot about 25 feet to the west. A boat repair yard is situated to the north and PugetSound lies generally to the west of the site, with the closest point about 600 feet to thenorthwest. A 160-foot-high bluff above Edwards Point rises starting about 700 feetdirectly south of the tower.
Analysis of the Unocal data shows that, from July 2002 through March 2003, the windspredominantly blew from the north 25 percent of the time and from the south andsoutheast 30 percent of the time. These north-prevailing winds are a result of air flowingfrom Puget Sound toward the site, which is typical for land locations close to water. Thesouth and southeast flow is caused by the elevated terrain to the south of the site and thecurve of the shoreline that forms Edwards Point. This terrain is acting to steer wind flowover and around the land, pushing it downslope toward the site. This pattern isparticularly present during nighttime hours and measurable rain events. The Unocalonsite meteorological data are presented as a wind rose in Figure 3. The hourly data areshown in Table 6. The frequency of winds speeds less than 0.51 meter per second isindicated at the bottom of the table, because wind speeds this low are not assigned a winddirection.

APPENDIX 5-A: ODOR AND AIR QUALITY: TREATMENT PLANT
October 2003 27
TABLE 6Unocal Site Meteorological Station (onsite data July 2002 – March 2003)
Wind Speed (mps)
WindDirection
0.51 -1.80
1.80 -3.34
3.34 -5.40
5.40 -8.49
8.49 -11.06 >11.06 Total
Hours
N 331 233 45 2 0 0 611
NNE 299 311 31 0 0 0 641
NE 189 319 40 0 0 0 548
ENE 139 30 2 0 0 0 171
E 170 10 4 0 0 0 184
ESE 405 54 14 2 0 0 475
SE 624 300 82 5 0 0 1011
SSE 210 354 379 97 0 0 1040
S 137 270 149 16 0 0 572
SSW 123 171 22 1 0 0 317
SW 92 183 27 2 0 0 304
WSW 46 16 0 0 0 0 62
W 35 4 1 0 0 0 40
WNW 28 8 1 0 0 0 37
NW 60 20 22 4 0 0 106
NNW 173 143 35 5 0 0 356
Total numberof hours 3,061 2,426 854 134 0 0 6,475
Total number of hours in data set: 6,552 hoursFrequency of winds less than 0.51 mps: 1.19 percentAverage Wind Speed : 2.19 mps
mps = meter per second
Summary of Wind Speed DataThe data summaries in Figures 1 through 3 show the number of hours of data that werecollected for each wind speed and direction. This is also summarized in Table 7.
The frequency of calms that are calculated for the wind rose figures is based on the EPAdefinition of a calm, which is less than 0.5 mps. This calm calculation is useful forinterpreting the wind rose figure, but is not related to stability or dispersion model input.Low wind speeds do not always result in very stable conditions. It is possible to have avery low wind speed and unstable conditions.

APPENDIX 5-A: ODOR AND AIR QUALITY: TREATMENT PLANT
October 2003 28
TABLE 7Summary of Meteorological Data
SiteAverage Wind Speed
(mps)Frequency of Winds
< 0.51 mps
Paine Field 3.18 13.24%
Route 9 1.56 5.63%
Unocal 2.19 1.19%
mps = meter per second
The total number of hours in the tables is less than the total number of hours in the dataset. Hours with wind speeds between 0.4 mps (the minimum the instrument can record)and 0.51 mps are not shown in the table, but were modeled. The total number of hours inthe 9-month period less the total number of hours shown is approximately the number ofhours with wind speeds between 0.4 and 0.51 mps. A few hours were not included in thedata set when the instruments were being calibrated.
Periods with little or no air movement require special consideration in air qualityevaluations because they usually result in the highest impacts offsite from a wastewatertreatment plant. The parameter used to characterize air movement is atmosphericstability. A value for stability is calculated for each hour of data collected at ameteorological station. As discussed above, atmospheric stability is grouped in Classes Athrough F. Class A stability indicates good air movement. Class F stability indicates thatthe air is very stable and little or no air movement is occurring.
Stability is calculated according to the methods described in Meteorological MonitoringGuidelines for Regulatory Modeling (EPA, 2000). Stability can be described as the abilityof the atmosphere to disperse pollutants. Stability is determined by wind speed, winddirection, sunlight, and air temperature. Each of these parameters has varying effects onhow pollutants are dispersed. All of these parameters are used to determine the stabilityfor each hour of the day. This stability calculation is part of the data input into theISCST3 dispersion model.
Class F stability, an hourly calculation made from the onsite met data, can only occur atnight when the two temperature sensors record an inversion condition where the airtemperature is warmer aloft (for the Brightwater meteorological station at the 10-meterlevel), than at the surface (2-meter level). In addition, the wind speed must be less than2.0 mps. The frequencies of Class F stability conditions calculated from the hourlymeteorological data collected from the Route 9 site, Unocal site, and Paine Field werecompared and are shown below:
• Paine Field = 36 percent• Route 9 = 21 percent• Unocal = 14 percent
Because of the higher frequency of F stability conditions, the Paine Field data wouldlikely predict higher offsite impacts than either the Route 9 or Unocal data.

APPENDIX 5-A: ODOR AND AIR QUALITY: TREATMENT PLANT
October 2003 29
TopographyThe Draft and Final EIS model results are different at the Unocal and Route 9 sites in partbecause of the difference in terrain at the two locations. Site-specific topography wasused in the dispersion model. U.S. Geological Survey Digital Elevation Map (DEM) fileswith a resolution of 98 feet were used to estimate the terrain elevation for each receptor.The elevations between the 98-foot grids are determined by interpolation to the nearest0.1 meter, or approximately 4 inches. These files are available to the public on the Website http://data.geocomm.com/dem/. Concentrations from all sources were evaluated atground level (that is, no "flagpole" receptors). The USGS data are recommended byregulatory agencies for input to dispersion modeling.
3.4 Scenarios ModeledPotential emission estimates were calculated for five different scenarios at the twotreatment plant sites:
• Route 9 with an initial capacity of 36 million gallons per day (mgd)• Route 9 with a buildout capacity of 54 mgd• Unocal with an initial capacity of 36 mgd• Unocal site with a buildout capacity of 54 mgd• Unocal site with a buildout capacity of 72 mgd
Ambient air quality and odor impacts resulting from the project were estimated usingdispersion modeling for seven different scenarios:
1. Route 9 site with an initial capacity of 36 mgd (odor modeling only)
2. Route 9 site with a buildout capacity of 54 mgd (odor and air quality modeling)
3. Unocal site with an initial capacity of 36 mgd (odor modeling only)
4. Unocal site with a buildout capacity of 54 mgd (odor and air quality modeling)
5. Unocal site with a buildout capacity of 54 mgd and a structural lid over a portion ofthe treatment plant (odor and air quality modeling)
6. Unocal site with a buildout capacity of 72 mgd (odor and air quality modeling)
7. Unocal site with a buildout capacity of 72 mgd and a structural lid over a portion ofthe treatment plant (odor and air quality modeling)
A lid with an approximate top elevation of 50 feet above sea level could potentially beconstructed over the northern portion of the treatment plant at the Unocal site only. Thelid would be used for a multimodal transportation facility. The addition of the lid wouldnot affect emission rates, but would change the fence line of the treatment plant, whichaffects the area that must be evaluated. Because the public could have access to the lidarea, the fence line of the treatment plant would be reduced to the area surrounding thenonlidded portion of the site – namely, the portion located on the highest terrace andclosest to the southern property line. Therefore, for the modeling analyses, the southernedge of the proposed lid was considered to be the northern fence line of the plant and anyimpact in the lid area would be included in the model results.

APPENDIX 5-A: ODOR AND AIR QUALITY: TREATMENT PLANT
October 2003 30
4 ODOR IMPACTS ASSESSMENT
4.1 IntroductionThe odor impacts assessment starts with the approach followed for the BrightwaterTreatment Plant, followed by a description of the odor sources at the treatment plant,identification of the targeted odor compounds, and quantification of the offsite odorimpacts.
4.2 Odor Prevention and Control ApproachKing County is committed to operating the Brightwater Treatment Plant without odors.To this end, stringent design and performance criteria have been established for odorprevention at the treatment plant. Key elements of this program are:
• Odor standard of no detectable odors at the property line. Brightwater TreatmentPlant would be a good neighbor by operating 365 days a year, 24 hours a day, with nooffsite odors.
• King County is accountable to PS Clean Air, the State of Washington, andBrightwater Treatment Plant’s neighbors regarding odors.
• Brightwater Treatment Plant’s goals for odor prevention are currently among themost stringent in the United States and include application of BACT. Other highlycontrolled plants have less stringent goals than Brightwater Treatment Plant and areallowed to exceed their selected criteria up to 100 hours each year.
• The proposed odor prevention system selected would also be the most advanced inthe United States:
− Three-stage chemical scrubbing followed by activated carbon. This multiple-stage system would be designed to specifically treat target compounds. Theactivated carbon would be used to remove any residual odors from the multiple-stage scrubbers. This is similar to the activated carbon filters used in homes toremove any trace contaminants in drinking water.
− Space would be reserved in the first stage of the scrubber to potentially addbiotowers or other technologies in the future as new technologies are developedand proven.
− Liquid-phase treatment would be provided in the collection system and at theinfluent pump station to reduce the formation of odors, further reducingdownstream treatment plant odor loading.
− Odor prevention systems would be designed to handle peak odor emissions.
− Odor prevention systems would be sized to handle worst-case operatingconditions, when combinations of meteorological conditions (such as inversionsand stagnant air, which tend to occur in the autumn and winter) coincide withpeak odor releases from treatment processes (which tend to occur in thesummer). In reality, the two events are not expected to occur at the same time.All dispersion modeling runs include using worst-case air and odor emissionsdata.

APPENDIX 5-A: ODOR AND AIR QUALITY: TREATMENT PLANT
October 2003 31
− The treatment plant would have dual electric feeders to provide a reliable andredundant power supply to the treatment plant. Onsite energy self-generationusing digester gas and natural gas as well as standby diesel internal combustion(IC) engines would provide additional backup power.
− Redundant equipment would be included in the treatment plant design to providebackup in the event of equipment malfunction or breakdown.
• Additional maintenance air scrubbers would be used during any maintenance activitythat requires opening the covered process equipment or building to ensure that nofoul air would be released into the atmosphere. Instead, odors would be pulled fromthe opened processes to the odor prevention system until that process is cleaned anddeclared to be nonodorous.
4.3 Odor SourcesThe following facilities at the treatment plant generate process air, which would betreated in the odor prevention system:
• Influent pump station
• Headworks (screening and degritting)
• Primary sedimentation basins
• Ballasted sedimentation basins
• Aeration basins
• Membrane tanks
• Disinfection for Puget Sound discharge (Unocal site only; Route 9 site disinfectionoccurs in effluent tunnel)
• Disinfection for reuse
Each process and how the odorous air would be collected and treated is described below.A schematic of the treatment plant, its odor-generating sources, and how the odors arecaptured and treated are shown in Figure 4. Each liquid process would be fully covered.Air would be pulled from under the cover to the odor prevention system, which wouldcreate a negative pressure. A negative pressure minimizes the chance for odors to escape.Buildings would be fully enclosed, with process areas inside the buildings also covered orenclosed, and the process air treated in the odor prevention system. The odor preventionsystem would receive the process air from the various sources and treat it to eliminate theodor in a three-stage chemical scrubber followed by carbon.
4.3.1 Liquids ProcessesThe liquids processes treat the wastewater to remove the solids and pollutants throughprimary treatment, secondary treatment, and disinfection. The process air ventilationsystem for each is described below.
Influent Pump Station Ventilation SystemThe influent pump station wet well would collect the raw sewage from the conveyancesystem in a deep tunnel below the treatment plant. A pump station building would be

APPENDIX 5-A: ODOR AND AIR QUALITY: TREATMENT PLANT
October 2003 32
located at the ground surface to pump the wastewater up to the treatment plant. Theinfluent pump station would be designed with a ventilation system that would keep anypotential exposed wastewater surface in the wet well or any process opening area undernegative pressure to prevent the escape of process air into the ambient air surrounding thestation. The air removed from these areas would pass through odor prevention systems totreat the air before it is discharged to the atmosphere.
Under maintenance conditions, the wet well would be uncovered and additional airchanges would be provided to enable maintenance work to be performed safely, and tomaintain a low concentration of odorous substances in the pump station. Supplementarymaintenance air scrubbers would be used for this purpose.
Preliminary Treatment (Headworks) Ventilation SystemBoth screening and grit removal processes would be housed in a headworks building andcovered and vented for odor prevention. The headworks building would be a two-storybuilding with an enclosed truck loading area. The channels inside the building would becovered and vented. The headworks building would be designed with a ventilation systemthat would maintain negative pressure under the covered processes and in the truckloading area to prevent the escape of process air into ambient air surrounding theheadworks. Trucks would be covered before exiting the treatment plant. The air removedfrom this area would pass through odor prevention systems to treat the air before it isdischarged to the atmosphere.
No additional maintenance air would be necessary because the primary scrubbers wouldhandle any additional loading from uncovering a screen channel, for example.
Primary Treatment Ventilation SystemThe primary sedimentation basins and ballasted sedimentation basins would be coveredwith airtight covers and a ventilation system designed to maintain negative pressure underthe covers. Process air from under these covers would be vented to an odor preventionsystem for treatment before discharge into the atmosphere.
Under maintenance conditions, one primary sedimentation basin would be drained at atime for major maintenance activities. Additional air would be required to ventilate theempty basin to provide for worker safety. Supplementary maintenance air scrubberswould be used for this purpose without any reduction of odor scrubbing ability.
Secondary Treatment Ventilation SystemThe secondary treatment system includes fine screens, aeration basins (which act asbioreactors), and membrane tanks (which house membranes that separate the liquids fromthe solids). All process tanks and screening channels would be covered and process airvented to an odor prevention system for treatment before discharge to the atmosphere.
Under maintenance conditions, one aeration basin and one membrane tank, together,would be drained for major maintenance activities. Additional air would be required toventilate the empty basins. Supplementary maintenance air scrubbers would be used forthis purpose.

APPENDIX 5-A: ODOR AND AIR QUALITY: TREATMENT PLANT
October 2003 33
Disinfection for Puget Sound Discharge Ventilation SystemAt the Route 9 site, the effluent from the membrane tanks would be blended with theeffluent from the ballasted sedimentation prior to disinfection. Contact time for thedisinfection, using sodium hypochlorite, would occur in the effluent tunnel. No contactchamber or onsite odor prevention would be required. Dechlorination using sodiumbisulfite would occur in the effluent tunnel at Portal 5 or 26 between the treatment plantand Puget Sound.
At the Unocal site, ultraviolet (UV) light would be used for disinfection of the membranebioreactor (MBR) effluent due to limited space onsite for chemical disinfection. The UVdisinfection chamber would be a covered channel vented to an odor prevention scrubber.Sodium hypochlorite would be used for disinfection of the ballasted sedimentationeffluent. This would also be covered and vented to the odor prevention system. Theeffluent from the membrane tanks would be blended with the ballasted effluent afterdisinfection and prior to discharge to Puget Sound. Process air from under these coverswould be vented to an odor prevention system for treatment before discharge into theatmosphere.
Maintenance air for the disinfection chamber would be provided by the maintenance airsystem used for the aeration basins and MBR.
Disinfection for Reuse Ventilation SystemUV disinfection would be used for the reuse disinfection system at both sites. Somesodium hypochlorite could be added in the distribution system after disinfection toprevent biofouling of the system. The reuse disinfection chambers would be covered andthe process air vented to an odor prevention system before discharge to the atmosphere.
Maintenance air for the disinfection chamber would be provided by the maintenance airsystem used for the aeration basins and MBR.
4.3.2 Solids Processing and Biosolids Management VentilationSystems
Solids handling consists of thickening primary and secondary sludge followed byanaerobic digestion, dewatering, and hauling of biosolids offsite for reuse.
Emergency Digester Gas Release Odor PreventionThickened sludge would receive a minimum of Class B stabilization through mesophilicanaerobic digestion in multiple cylindrical tanks. The digesters would be fully enclosedwith fixed roofs. Only trace amounts of digester gas could escape through pressure reliefvents during emergency conditions to prevent over-pressuring of the digester and its gasdistribution and storage system. The digesters and digester gas distribution system wouldbe designed to minimize any potential emergency digester gas venting. A carbon systemwould be located at all vents for odor prevention and would scrub the gas in the event ofan emergency release.
Thickening and Dewatering Ventilation SystemSolids would be thickened using gravity belt thickeners (GBTs) and dewatered usingcentrifuges. The thickening and dewatering equipment, as well as auxiliary storage,pumping equipment, and polymer addition system, would be contained in a three-story

APPENDIX 5-A: ODOR AND AIR QUALITY: TREATMENT PLANT
October 2003 34
solids handling building. The solids handling building would be designed with aventilation system designed to maintain negative pressure to capture the process air fromthe GBTs, centrifuges, conveyors, and truck loading area and treat it in an odorprevention system prior to discharge to the atmosphere.
No additional maintenance air would be necessary because the primary scrubbers wouldhandle any additional loading from cleaning a GBT or centrifuge, for example.
Biosolids Truck Ventilation SystemDewatered biosolids would be transferred into trucks inside an enclosed loading/scalearea in the solids handling building that would vent to an odor prevention system beforedischarge to the atmosphere. This area would be equipped with doors that would beclosed after the truck enters, and the doors would not be opened until the truck wascovered and the air in the loading bay purged and scrubbed. These emissions have beenincluded in the solids handling emissions estimates. Because the ventilation system wouldbe designed to keep the scale area under a negative pressure, normal operations wouldrequire that the doors be kept closed for proper operation. It is likely that an alarm wouldbe generated within the plant control system whenever one of these doors is open,allowing improper operating conditions to be corrected.
Biosolids would either be directly loaded into the trucks from the dewatering devices(centrifuges) or stored in an enclosed tank to allow for loading into trucks independent ofthe dewatering operation. This loading would occur via an enclosed and ventilatedconveyor system, or by means of an overhead hopper system. In either case, the entireprocess would be ventilated and the air treated in the odor prevention system beforedischarge to ambient air. The biosolids haul trucks would have covers designed to preventany odors from escaping. Trucks located in the treatment plant site staging area and notinside the ventilated loading area would be hooked up to an odor prevention system. Thesystem would include flexible ducts that attach to the trucks and pull air from theheadspace between the cover and biosolids on full trucks and from the trailer on emptytrucks. The air would be treated in an odor prevention system either near the truck stagingarea or in the solids handling building odor prevention system.
4.4 Targeted Odor CompoundsTotal odors represent odors from all potential odor compounds that can be mixed togetherin the emissions from the source. Total odors include reduced sulfur compounds, amines,fatty acids, and mercaptans, along with ammonia and hydrogen sulfide. Odor compoundscould be emitted from all Brightwater Treatment Plant sources, but some compoundscould be emitted in the front end of the plant, generated in the plant, or be emitted fromback-end and solids handling facilities. Different types of odor compound groups wouldalso likely be emitted at various treatment processes throughout the plant.
Hydrogen sulfide generation is more prevalent in the influent pump station, headworks,and primary clarifiers than in downstream process units. Aeration basins are typically notsignificant sources of hydrogen sulfide or ammonia odor because of the biologicalactivity taking place within the basin. The aeration basins have a distinct earthy or mustyodor, but the odor typically does not have the intensity of hydrogen sulfide. Disinfectionprocesses typically are not large odor sources at wastewater treatment plants and arecommonly uncovered. However, disinfection would be covered at the Brightwater
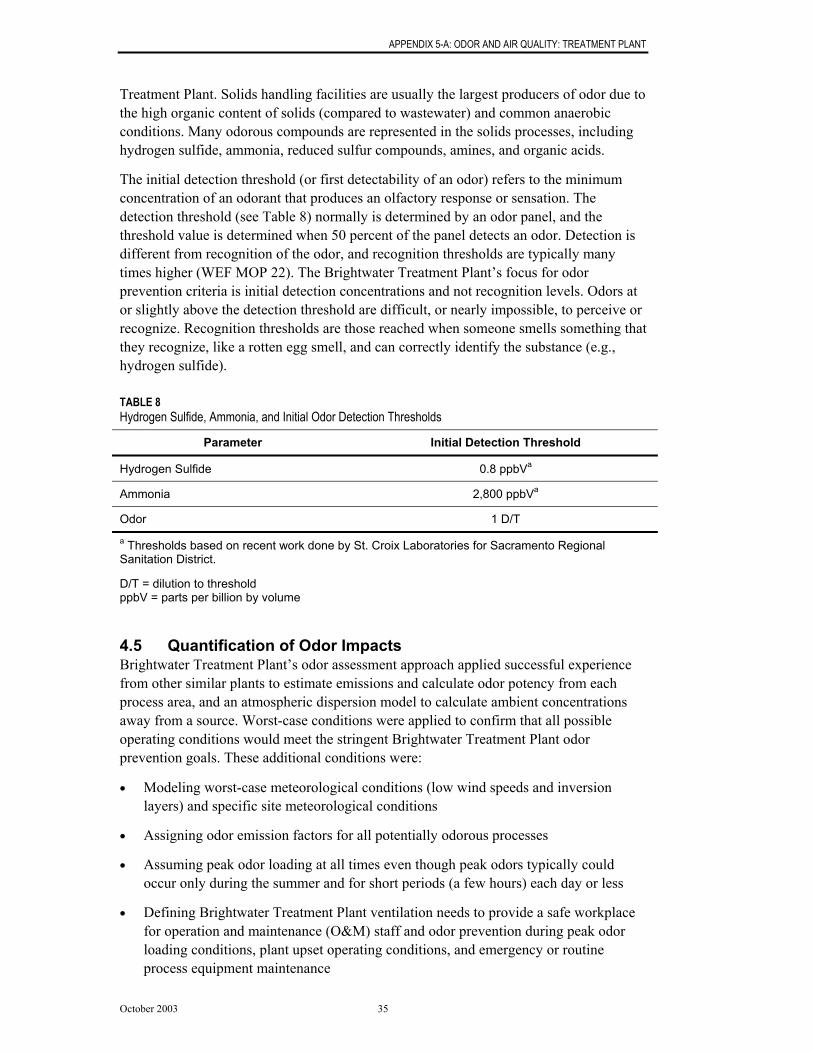
APPENDIX 5-A: ODOR AND AIR QUALITY: TREATMENT PLANT
October 2003 35
Treatment Plant. Solids handling facilities are usually the largest producers of odor due tothe high organic content of solids (compared to wastewater) and common anaerobicconditions. Many odorous compounds are represented in the solids processes, includinghydrogen sulfide, ammonia, reduced sulfur compounds, amines, and organic acids.
The initial detection threshold (or first detectability of an odor) refers to the minimumconcentration of an odorant that produces an olfactory response or sensation. Thedetection threshold (see Table 8) normally is determined by an odor panel, and thethreshold value is determined when 50 percent of the panel detects an odor. Detection isdifferent from recognition of the odor, and recognition thresholds are typically manytimes higher (WEF MOP 22). The Brightwater Treatment Plant’s focus for odorprevention criteria is initial detection concentrations and not recognition levels. Odors ator slightly above the detection threshold are difficult, or nearly impossible, to perceive orrecognize. Recognition thresholds are those reached when someone smells something thatthey recognize, like a rotten egg smell, and can correctly identify the substance (e.g.,hydrogen sulfide).
TABLE 8Hydrogen Sulfide, Ammonia, and Initial Odor Detection Thresholds
Parameter Initial Detection Threshold
Hydrogen Sulfide 0.8 ppbVa
Ammonia 2,800 ppbVa
Odor 1 D/T
a Thresholds based on recent work done by St. Croix Laboratories for Sacramento RegionalSanitation District.
D/T = dilution to thresholdppbV = parts per billion by volume
4.5 Quantification of Odor ImpactsBrightwater Treatment Plant’s odor assessment approach applied successful experiencefrom other similar plants to estimate emissions and calculate odor potency from eachprocess area, and an atmospheric dispersion model to calculate ambient concentrationsaway from a source. Worst-case conditions were applied to confirm that all possibleoperating conditions would meet the stringent Brightwater Treatment Plant odorprevention goals. These additional conditions were:
• Modeling worst-case meteorological conditions (low wind speeds and inversionlayers) and specific site meteorological conditions
• Assigning odor emission factors for all potentially odorous processes
• Assuming peak odor loading at all times even though peak odors typically couldoccur only during the summer and for short periods (a few hours) each day or less
• Defining Brightwater Treatment Plant ventilation needs to provide a safe workplacefor operation and maintenance (O&M) staff and odor prevention during peak odorloading conditions, plant upset operating conditions, and emergency or routineprocess equipment maintenance

APPENDIX 5-A: ODOR AND AIR QUALITY: TREATMENT PLANT
October 2003 36
4.5.1 Ventilation RatesAll ventilation air would be pulled from the outside or surrounding building air into theprocess and then treated in the odor prevention system. This means that the coveredsystems and buildings would both be under negative air pressure and that all odorousprocess air would always be vented to the odor prevention system before discharge to theatmosphere. The general rule of thumb used for the Brightwater Treatment Plant was thatoccupied buildings would have 20 air changes per hour (ACH) and covered processes12 ACH. The 20-ACH level provides operator safety by keeping the odor concentrationsinside the buildings at a minimum. Air calculations based on ACH were compared to aircalculations based on velocities (0.5 cfm divided by ft2) and air volumes based on thehourly maximum air flow rates to the aeration basins and membrane tanks plus 10 percentto keep a negative pressure. In all cases, the highest value for the three methods waschosen and is shown in Tables 9 and 10. The highest values were calculated using theACH method for all units except for aeration basins and membrane tanks. For aerationbasins and membrane tanks, the maximum aeration air plus 10 percent was used to ensurea negative pressure at all times. The Unocal air flow would be slightly higher becausethere would be an onsite disinfection basin for Puget Sound discharge disinfection.Route 9 has no onsite disinfection basin and uses the effluent tunnel to provide therequired contact time.
Each odor prevention source is further described in Attachment F, Liquids and SolidsProcess Source Parameters. The attachment includes number of stacks, air flow, stackdiameter, stack height, and other parameters.
There is a tradeoff between ventilation rates and mass flux. Higher ventilation rateswould produce a higher mass flux off the process units and therefore would produce agreater mass of odorous compounds to be treated in the odor prevention system.However, lowering the ventilation rates to lower the scrubber loading is not necessarilythe best approach. Keeping higher ventilation rates provides a greater safety factor formaintaining a negative pressure in all process areas at all times (even when an operatorlifts a hatch on a process to look inside) to ensure adequate capture of air under covers, toregulate the loading to the scrubbers to optimize performance, and to prevent deadspotsunder the covers, which would increase the corrosion potential. The potential for deadspots, corrosion, and fugitive emissions increases at lower ventilation rates. In addition,ventilation rates for buildings have taken code requirements into account, includingNational Fire Protection Act (NFPA) 820. Buildings must be adequately ventilated toensure worker safety and also to provide a comfortable work environment so that doorsand windows are not opened, which would allow fugitive odors to escape.
Maintenance air would be used when a tank is taken out of service. This is often the timewhen odor events occur due to the exposure of the residual solids or odorous wastewaterto the ambient air. For the Brightwater Treatment Plant, to ensure that maintenanceactivities do not cause odor events and potential complaints, the odor prevention systemwould be designed with additional ventilation capacity to handle air flow from units outof service. The assumptions for this analysis were that one primary clarifier, one aerationbasin, and one membrane tank would be out of service at the same time and requireventilation (at 12 ACH). The ventilation air in the empty basins would be sent to themaintenance air odor prevention scrubbers. The ventilation rates for maintenance airwould be approximately 100,000 to 150,000 cfm for all processes combined.

APPENDIX 5-A: ODOR AND AIR QUALITY: TREATMENT PLANT
October 2003 37
TABLE 9Summary of Air Flow Rates for Route 9 Site
SourceNormal Operations Ventilation
Rate at 36 mgd (cfm)Normal Operations Ventilation
Rate at 54 mgd (cfm)
Influent Pump Station 63,000 63,000
Headworks, PrimaryClarifiers, BallastedSedimentation, and FineScreens
119,000 158,500
Aeration Basins,Membrane Tanks, andReuse Disinfection
134,000 201,500
Solids Handling 74,000 111,000
Total 390,000 534,000
cfm = cubic feet per minute
TABLE 10Summary of Air Flow Rates for Unocal Site
Source
Normal OperationsVentilation Rate at 36
mgd (cfm)
Normal OperationsVentilation Rate at
54 mgd (cfm)
Normal OperationsVentilation Rate at
72 mgd (cfm)
Influent Pump Station 63,000 63,000 63,000
Headworks, PrimaryClarifiers, BallastedSedimentation, and FineScreens
119,000 158,500 198,000
Aeration Basins,Membrane Tanks, andDisinfection (Reuse andPuget Sound Discharge)
138,500 208,000 277,000
Solids Handling 74,000 111,000 148,000
Total 394,500 540,500 686,000
cfm = cubic feet per minutemgd = million gallons per day
The covers for the liquids processes would likely be concrete, with some removablehatches to allow for viewing the liquid. Any removable cover or hatch would be gasketedto prevent fugitive emissions. Some walk-in enclosures could also be provided sooperators can observe the liquid surface as well as equipment (such as scum collection).The walk-in enclosures would be under negative pressure. The clean make-up air for theodor prevention system would enter through the walk-in enclosures.
4.5.2 Assumed Odor ConcentrationsIn general, the process air at the front end of the plant would be high in ammonia andhydrogen sulfide, which makes up the majority of the “odor.” In the secondary process

APPENDIX 5-A: ODOR AND AIR QUALITY: TREATMENT PLANT
October 2003 38
and disinfection, there would be little hydrogen sulfide, ammonia, or odors caused byreduced sulfur compounds, and few other chemical smells. In the solids processes, therewould be more ammonia and less hydrogen sulfide than the liquid processes, and higherlevels of reduced sulfur compounds, amines, and fatty acids. These together make up the“odor” from this process.
Table 11 shows the assumed peak concentrations at the surface of the liquid prior todilution with ventilation air. All concentrations assume upstream chemical addition toreduce influent liquid total sulfide to 0.5 milligrams per liter (mg/L) or less. The assumedconcentrations were chosen based on actual data from King County and other treatmentplants. When converted to mass emissions, the hydrogen sulfide and ammoniaconcentrations chosen for the Brightwater Treatment Plant are more conservative thanthose predicted by BASTE, which is an inherently conservative model. The reason thatthe values below were used instead of values predicted by BASTE was to ensure that theBrightwater Treatment Plant would be designed for worst-case conditions and would beable to successfully treat and prevent offsite odor impacts under all conditions.
TABLE 11Hydrogen Sulfide, Ammonia, and Odor Concentrations (without process air ventilation rates included) atBrightwater Treatment Plant
HydrogenSulfide Ammonia Odor
Odor Source Peak ppmV Peak ppmV Peak D/T
Influent Pump Station Wet Well 50 10 5,000
Headworks Building 50 10 5,000
Headworks (truck loading) 50 10 5,000
Aerated Grit Removal 50 10 5,000
Primary Clarifiers 50 10 5,000
Ballasted Sedimentation 50 10 5,000
Fine Screens 50 5 1,000
Aeration Basins 1 5 1,000
Membrane Tanks 1 5 500
Disinfection 0.5 1 100
Centrifuges 25 50 5,000
Conveyors 25 50 5,000
Biosolids Truck Loading 25 50 5,000
Gravity Belt Thickeners 25 50 5,000
Thickened Sludge Blend Tank 100 50 15,000

APPENDIX 5-A: ODOR AND AIR QUALITY: TREATMENT PLANT
October 2003 39
TABLE 11Hydrogen Sulfide, Ammonia, and Odor Concentrations (without process air ventilation rates included) atBrightwater Treatment Plant
HydrogenSulfide Ammonia Odor
Odor Source Peak ppmV Peak ppmV Peak D/T
Raw Sludge Blend Tank 100 50 15,000
Centrate Tanks 25 50 5,000
Note: Chemical treatment in collection system and at influent pump station was assumed tomaintain total sulfide ≤ 0.5 mg/L.
mg/L = milligram per literD/T = dilution to thresholdppmV = part per million by volume
The process air collected from the enclosed and covered process units would be scrubbedusing multistage (sodium hypochlorite, sodium hydroxide, and/or sulfuric acid) chemicalscrubbers followed by activated carbon for additional odor reduction. Each stage treatsthe process air to a greater degree. The exhaust air from the scrubbers would bedischarged from the scrubber stacks. The concentrations from Table 11 would be dilutedwith ventilation air prior to entering the odor prevention system. Table 12 shows the inletconcentrations to the odor prevention scrubbers, including the process ventilation air. Asseen in Table 12, the concentrations modeled are much lower than those shown inTable 11. The higher ventilation rates result in more dilute concentrations entering thescrubber system, which reduces the odor peaks and valleys to allow for more consistentodor prevention performance. By having more consistent loadings to the scrubbers, theodor prevention system would be able to reliably meet the design criteria.
The 17 odor sources listed in Tables 11 and 12 are grouped into 4 odor preventionsystems:
1. Influent pump station
2. Headworks, primary clarifiers, ballasted sedimentation, and fine screens
3. Aeration basins, membrane tanks, and disinfection
4. Solids handling building (centrifuges, conveyors, biosolids truck loading, gravity beltthickeners, thickened sludge blend tank, raw sludge blend tank, centrate tank)
The concentrations from each process are combined with the ventilation rates for eachprocess. The individual sources combined together produce a flow-weightedconcentration for each of the four systems.

APPENDIX 5-A: ODOR AND AIR QUALITY: TREATMENT PLANT
October 2003 40
TABLE 12Scrubber Inlet Hydrogen Sulfide, Ammonia, and Odor Concentrations (including process air ventilation rates) atBrightwater Treatment Plant
HydrogenSulfide Ammonia Odor
Odor Source Peak ppmV Peak ppmV Peak D/T
Influent Pump Station Wet Well 7.52 1.50 752
Headworks Building 3.25 0.65 325
Headworks (truck loading) 0.98 0.20 98
Aerated Grit Removal 10.83 2.17 1083
Primary Clarifiers 7.65 1.53 765
Ballasted Sedimentation 10.83 2.17 1083
Fine Screens 3.25 0.33 65
Aeration Basins 0.10 0.50 101
Membrane Tanks 0.02 0.11 11
Disinfection 0.22 0.43 43
Centrifuges 0.9 1.76 176
Conveyors 25 50 5,000
Biosolids Truck Loading 0.1 0.12 12
Gravity Belt Thickeners 1 1.95 195
Thickened Sludge Blend Tank 7 3.25 975
Raw Sludge Blend Tank 9 4.33 1300
Centrate Tanks 2 3.25 325
Note: Chemical treatment in collection system and at influent pump station was assumed to maintaintotal sulfide ≤ 0.5 mg/L.
mg/L = milligram per literD/T = dilution to thresholdppmV = part per million by volume
4.5.3 Technology Selection ProcessTo achieve the objectives above, high removal rates through a multistage system arerequired. Numerous technologies are available for odor prevention. Typically the mosteffective methods of odor prevention and control involve both liquid and vapor phasetreatment. Not all odor generation can be prevented through liquid phase treatment, butliquid phase treatment can substantially mitigate odor generation and reduce the vaporphase treatment required if used properly. Experience at King County and other similarplants has shown that liquid phase treatment is most effective if used both in thewastewater collection system and at the influent pump station to reduce sulfide loadingcoming into the plant.

APPENDIX 5-A: ODOR AND AIR QUALITY: TREATMENT PLANT
October 2003 41
Evaluated TechnologiesDuring pre-design of the odor prevention system, 10 liquid phase technologies wereevaluated:
• Precipitation: iron salts (e.g., ferrous chloride, ferric chloride, ferrous sulfate)• Inhibition: anthraquinone• Inhibition: calcium nitrate (Bioxide)• Augmentation: organisms and enzymes• pH control: caustic, lime, magnesium oxides/hydroxides• Oxidation: chlorine compounds• Oxidation: air/oxygen• Oxidation: hydrogen peroxide• Oxidation: ozone• Oxidation: potassium permanganate
In addition, 11 vapor phase technologies were evaluated:
• Chemical scrubbers (packed towers)• Chemical scrubbers (atomized mist)• Biofilters• Bioscrubbers/biotrickling towers• Activated carbon• Thermal oxidation• Masking agents• Counteractants• Ozone• Ionization• Foul air to aeration basins for treatment
The selection of the odor prevention technologies was similar to that used for the BACTtop-down process described previously in Section 2.3.1 of this appendix. During pre-design the overall evaluation process was developed and the criteria defined that were tobe used in that process. A two-step process was selected in which alternatives could beprogressively screened and evaluated.
In the first step, pass/fail screening criteria were applied to eliminate any technicalalternative that did not meet basic King County requirements for Brightwater TreatmentPlant. In the second step, the remaining alternatives were ranked using nonmonetary-focused criteria. Following the ranking, an initial evaluation of the shortlisted alternativeswas performed. The alternatives were evaluated to see whether they could meet the odorprevention threshold goals for hydrogen sulfide, ammonia, and odor removal. Conceptualdesign level cost-benefit analyses were also performed. This is further described in thefinal report for Predesign Task 1.04 – Odor Prevention Technology Review and ImpactAnalysis.
Chosen TechnologiesIt was a complex procedure to select the vapor phase odor prevention treatment to meetKing County’s stringent goal of no detectable odors beyond the property line. Multistagescrubbers are necessary. Due to the varied odor loading at different process units, a firststage “rougher,” or acid stage—which can remove ammonia or other targeted, hard to

APPENDIX 5-A: ODOR AND AIR QUALITY: TREATMENT PLANT
October 2003 42
remove odors—was selected. A last stage “polisher” unit made up of carbon would beused. The scrubber system proposed for Brightwater Treatment Plant is shown inFigure 5. The vapor phase treatment technologies investigated during pre-design variedbetween two and five units in series (stages).
The chosen process includes the following components:
• Liquid phase treatment (one stage) in collection system using sodium hypochlorite,calcium nitrate, sodium hydroxide, or iron salts
− Liquid phase treatment in the tunnel during the odor season (March – November)
− Liquid phase treatment of the plant influent during the odor season (March –November)
• Three-stage chemical scrubbing (three stages) plus carbon scrubbing (one stage)
Brightwater Treatment Plant’s odor prevention strategy focuses on proven, state-of-the-art odor prevention approaches (BACT) to provide large safety factors. The three-stagechemical scrubbers followed by activated carbon were sized for peak conditions. Spentchemicals would be discharged to the treatment plant (likely to the aeration basins).Redundant scrubber systems would be used when primary scrubbers are shut down forroutine servicing and repairs. Dual electric feed and backup energy self generation wouldensure that the scrubbers would be in service at all times unless a catastrophic failure ofall three power supply systems were to occur. In addition, there would be additionalscrubbers assigned to ventilate areas during routine maintenance activities (e.g., tankcleaning).
Conservative assumptions were used for removal rates (at peak loading) from each stage(actual removals could be higher) and are shown in Table 13.
TABLE 13Removal Efficiencies of Each Odor Prevention Technology at Peak Loading (inlet gas – exhaust gas)
Removal EfficienciesHydrogen Sulfide
Removal (%)Ammonia
Removal (%)Odor
Removal (%)
Chemical scrubber – acid stage 10 99 45
Chemical scrubber – caustic stage 80 10 80Chemical scrubber – caustic/hypo stage 98 90 90
Carbon 97 20 85Multistage System
3-stage scrubber (acid + caustic +caustic/hypo) + carbon
99.99 99.93 99.84
4.5.4 Comparison to Other Treatment PlantsThe Brightwater Treatment Plant would have an odor prevention and control system thatis more sophisticated and comprehensive than most, if not all, treatment plants in theUnited States. Not only would all the process units be covered or enclosed with theprocess air treated in a multistage odor prevention system, but there would be severaladditional features that add factors of safety to the system. Table 14 compares the

APPENDIX 5-A: ODOR AND AIR QUALITY: TREATMENT PLANT
October 2003 43
Brightwater Treatment Plant odor prevention and control system to typical wastewatertreatment systems in the United States.
TABLE 14Comparison of Odor Prevention and Control Approach for Brightwater Treatment Plant to Other WastewaterTreatment Plants
Parameter
TypicalWastewater
PlantBrightwater
Treatment Plant
Ability to capture all process air and eliminate odor sourcesand fugitive emissions
- +
Treat the collection system and treatment plant as one odorgeneration system
0 +
Volume of process air requiring treatment 0 +
Ability to capture and treat peak emissions - +
Ability to treat range of odorous compounds 0 +
Ability to meet low offsite odor thresholds - +
Using combined approach of liquid and vapor phase treatment 0 +
Provisions for redundancy - +
Provisions for maintenance air treatment - +
0 = average+ = above average- = below average
4.5.5 Monitoring Effectiveness of Odor Prevention SystemMonitoring the odor prevention system to ensure that it is working as designed would beparamount to the success of the odor prevention and control program. There are fivecomponents that would be monitored:
• Continuous hydrogen sulfide measurements in the influent pump station wetwell headspace. The influent pump station wet well headspace would have hydrogensulfide continuously monitored. This would allow for demand-based dosing of thechemical used for liquid phase treatment.
• Routine exhaust gas monitoring and scrubber hydrogen sulfide removalefficiency checks for the scrubber trains. All odor prevention scrubbers wouldhave routine measurements of the inlet and outlet (stack) gas hydrogen sulfideconcentrations to make sure that the scrubber operation would be optimized.
• Continuous scrubber chemical dose optimization. Scrubber monitoring systemswould measure residual hydrogen sulfide in the scrubber exhaust. If the levels arebelow the detection thresholds at the stack, then the levels would be even fartherbelow them at the property line. The monitoring would provide instant feedback tothe chemical feed system to raise or lower the chemical feed rate.
• Handheld instrument checks of exhaust gas hydrogen sulfide concentration.Handheld instruments would be used to spot-check scrubber inlet and outlet

APPENDIX 5-A: ODOR AND AIR QUALITY: TREATMENT PLANT
October 2003 44
concentrations to calibrate continuous monitoring equipment. Handheld instrumentscan be more sensitive than online instruments and can help refine chemical dosingand ensure that the scrubbers are performing as designed.
If the odor prevention system does not meet the design criteria for hydrogen sulfide,ammonia, or odor during routine operations, investigation of performance loss would beconducted using more refined analytical equipment. The sampling period could also beextended to ensure that the original sampling event was not caused by equipment partsfailure, needs of equipment operating adjustments, or mistakes by the odor analysislaboratories. If refined sampling or repairs showed that the process’s scrubbers stillexceeded the design criteria, then each stage of the scrubber would be tested to seewhether the scrubber stage that was not performing adequately could be identified.Scrubber inspections and O&M activities, such as scrubber cleaning or carbonreplacement, could then be implemented. After the O&M activities, the scrubbers wouldbe retested.
These monitoring procedures would be further refined in the design and startup phases.The monitoring would make certain that the existing scrubbing system functionsoptimally to meet the Brightwater Treatment Plant odor standard of no detectable odors atthe property line.
4.5.6 Odor Impact AssessmentThe odor impact assessment had two steps. First was to calculate the odor emissions, andsecond to enter the emissions into an air dispersion model to simulate offsite odorimpacts.
Odor EmissionsTables 15 through 17 show the hydrogen sulfide, ammonia, and odor concentrations,uncontrolled and controlled, assumed for the major treatment processes. The controlledmass emissions are also shown. These are the values input into the air dispersion model.The mass emissions for hydrogen sulfide and ammonia are in units of grams per second(g/s). The concentrations (as grams or micrograms per cubic meter (µg/m3)) aremultiplied by the dilution air (in cubic meters per second (m3/s)) to get the mass emissionin g/s.
Odor is the mixture of many compounds, all of which have different masses. Theconcentration of an odor sample is expressed as a volumetric ratio, dilution-to-threshold(D/T). The D/T is the amount of dilution from using clean air until you can no longersmell the odor. This is a unit of measure that is used for air volumes. If you have one unitof air (e.g., 1 liter) that smells like coffee, and it takes 20 liters of clean air (odorless airpassed through a carbon filter) mixed with the coffee air until you no longer can smellanything, then the quantity of odor in the original sample was 20 D/T.
Odor concentrations are not specific to a particular compound. For hydrogen sulfide (andother compounds), it is possible to express its concentration in ppbV, which in fact is avolume ratio. However, the ideal gas law allows us to convert the portion that is hydrogensulfide to a mass and change the volumetric concentration to a mass/volumeconcentration (µg/m3). Because odor concentrations are not specific to a particular

APPENDIX 5-A: ODOR AND AIR QUALITY: TREATMENT PLANT
October 2003 45
compound but a human response to all compounds present in the sample, it is not possibleto convert the volumetric concentration (D/T) to a mass concentration.
For odor, the model input is D/T per second. It is not a concentration but rather aconcentration per unit time. Odor cannot be modeled as a mass emission because it is notspecific to an individual compound with a given mass; rather odor is a human response toall compounds present in the sample. Thus, the odor emission rate and correspondingodor standard are expressed as volumetric ratios.
Upstream liquid phase (chemical) treatment of the influent is assumed to keep theinfluent total sulfide concentration at or below 0.5 mg/L. The inlet concentrations are theconcentrations shown in Table 12 and include ventilation air.
The odor emissions from 36 mgd were scaled up to the final design capacities of 54 mgd(for Route 9 and Unocal) and 72 mgd (for the Unocal Structural Lid sub-alternative only).The mass emissions were entered into an air dispersion model to determine offsite(beyond the plant property line) impacts. As plant flows increase from 36 to 54 or72 mgd, concentration values would remain the same; however, mass discharge wouldincrease as more surface area in the process tanks is exposed to ventilation air.
Route 9 and UnocalThe emissions were the same for both sites except that the Unocal site had additionalodor prevention for disinfection for Puget Sound discharge (the Route 9 site woulddisinfect in the effluent tunnel), so the mass emissions were slightly higher due to thedisinfection at Unocal.
The reason the inlet concentrations are the same for 36 mgd and 54 mgd for all except theinfluent pump station is that ventilation air flow for the influent pump station shaft wouldbe the same at 36 mgd and 54 mgd. Therefore, the concentration in the process air fromthe wet well would be higher at the higher wastewater flow rate because the massemissions would increase with higher flows. For the rest of the process units, the numberof units would increase when moving from 36 mgd to 54 mgd. Therefore, the ventilationrates would also increase due to the additional surface area that would require ventilation.The inlet concentrations would be the same, but the mass emissions would increase dueto the higher air flow rates.

APPENDIX 5-A: ODOR AND AIR QUALITY: TREATMENT PLANT
October 2003 46
TABLE 15Grouped Emissions of Hydrogen Sulfide for 36-, 54-, and 72-mgd Treatment Plants
Odor Prevention for 36-mgd Treatment Plant Odor Prevention for 54-mgd Treatment PlantOdor Prevention for 72-mgd Treatment
Plant (Unocal Only)
EmissionSource
Inlet H2S(ppmV)
Outlet H2S(ppmV) Outlet H2S (g/s)
Inlet H2S(ppmV)
OutletH2S
(ppmV) Outlet H2S (g/s)Inlet H2S(ppmV)
OutletH2S
(ppmV) Outlet H2S (g/s)
Influent pumpstation
7.52 0.00081 0.0000330 11.3 0.00121 0.0000495 15.02 0.00162 0.0000660
Headworks,primaryclarifiers,ballastedsedimentation,and finescreens
3.14 0.00034 0.0000259 3.14 0.00034 0.0000346 3.14 0.00034 0.0000432
Aerationbasins,membranetanks, anddisinfection
0.07 0.000008 0.000000617 (Rte 9)
0.000000677(Unocal)
0.07 0.000008 0.000000924 (Rte 9)
0.00000102(Unocal)
0.07 0.000008 0.00000136
Solids handlingbuilding
4.86 0.00053 0.0000249 4.86 0.00053 0.0000374 4.86 0.00053 0.0000498
g/s = gram/secondH2S = hydrogen sulfidemgd = million gallons per dayppmV = parts per million by volumeRte = Route

APPENDIX 5-A: ODOR AND AIR QUALITY: TREATMENT PLANT
October 2003 47
TABLE 16Grouped Emissions of Ammonia for 36-, 54-, and 72-mgd Treatment Plants
Odor Prevention for 36-mgd TreatmentPlant
Odor Prevention for 54-mgd TreatmentPlant
Odor Prevention for 72-mgdTreatment Plant (Unocal Only)
Emission SourceInlet NH3(ppbV)
OutletNH3
(ppbV) Outlet NH3 (g/sa)Inlet NH3(ppbV)
OutletNH3
(ppbV) Outlet NH3 (g/sa)
InletNH3
(ppbV)
OutletNH3
(ppbV)Outlet NH3
(g/sa)
Influent pumpstation
1,500 1.10 0.0000440 2,250 1.70 0.0000659 3,000 2.20 0.0000879
Headworks,primary clarifiers,ballastedsedimentation,and fine screens
600 0.43 0.0000330 600 0.43 0.0000439 600 0.43 0.0000549
Aeration basins,membrane tanks,and disinfection
260 0.19 0.0000160 (Rte 9)
0.0000168 (Unocal)
260 0.19 0.00002.40 (Rte 9)
0.0000252(Unocal)
260 0.19 0.0000337
Solids handlingbuilding
8,460 6.10 0.000289 8,460 6.10 0.000434 8,460 6.10 0.000578
g/s = gram/secondmgd = million gallons per dayNH3 = ammoniappbV = parts per billion by volumeRte = Route

APPENDIX 5-A: ODOR AND AIR QUALITY: TREATMENT PLANT
October 2003 48
TABLE 17Grouped Emissions Odor for 36-, 54-, and 72-mgd Treatment Plants
Odor Prevention for 36-mgd TreatmentPlant
Odor Prevention for 54-mgd TreatmentPlant
Odor Prevention for 72-mgd TreatmentPlant (Unocal Only)
Emission SourceInlet Odor
(D/T)Outlet Odor
(D/T)Outlet Odor
(D/T/s)Inlet Odor
(D/T)Outlet Odor
(D/T)Outlet Odor
(D/T/s)Inlet Odor
(D/T)Outlet Odor
(D/T)Outlet Odor
(D/T/s)
Influent pumpstation
752 1.24 37 1128 1.86 55.5 1504 2.48 74
Headworks,primary clarifiers,ballastedsedimentation,and fine screens
292 0.48 27 292 0.48 35.9 292 0.48 45
Aeration basins,membrane tanks,and disinfection
44 0.07 4.7 (Rte 9)
4.8 (Unocal)
44 0.07 7.1 (Rte 9)
7.2 (Unocal)
44 0.07 9.6
Solids handlingbuilding
931 1.54 54 931 1.54 81 931 1.54 108
D/T = dilution to thresholdD/T/s = dilution to threshold per secondg/s = gram/secondmgd = million gallons per dayppmV = parts per million by volumeRte = Route

APPENDIX 5-A: ODOR AND AIR QUALITY: TREATMENT PLANT
October 2003 49
Maximum Air Emissions for Hydrogen Sulfide and AmmoniaThe mass of odorous compounds that is not removed in the odor prevention system isreleased to the atmosphere. The predicted worst-case, treatment-plant-wide hydrogensulfide and ammonia mass air emission rates for both the Route 9 and Unocal sites at54-mgd and 72-mgd (Unocal only) are shown below.
Compound
EmissionsWithout Odor Prevention
(lb/yr)
Emissions With OdorPrevention
(lb/yr)
54 mgd
Hydrogen Sulfide 78,600 8.5
Ammonia 54,700 39.7
72 mgd (Unocal Only)
Hydrogen Sulfide 102,800 11.1
Ammonia 72,600 52.5
Note: Odor not included in this table because odor is a combination of numerous odorouscompounds, each with a different mass, and total mass cannot be quantified.
The mass emissions at Unocal for 54 mgd would actual be slightly higher than forRoute 9 because of the additional air from the Puget Sound discharge disinfection processthat would be treated by the odor prevention system. However, for this analysis, due torounding of the data, they are considered equal.
Offsite Odor ImpactsThe results of the odor modeling at both sites indicate that predicted impacts using onsitedata and Paine field data would consist of no detectable odors beyond the property line ofthe treatment plant. The property line and offsite values are considerably lower than thedetection thresholds for each parameter. The modeling approach was to use the highestpeak loadings expected in the summer (Table 11) as year-round values to developconservative worst-case estimates. The worst meteorological conditions occur in thewinter when the atmosphere is very stable. The results shown in Tables 18 through 21show the summer peak loadings with the winter meteorology, a condition that wouldnever occur. The actual expected peak summer numbers would be lower than the valuesshown in Tables 18 through 21 and even farther below the odor detection thresholds.During peak events, the stack exhaust concentrations may not be below the initialdetection threshold of 0.8 ppbV hydrogen sulfide and 1 D/T odor. However, stackconcentrations during the worst-case, peak events are close enough to the initial detectionthresholds to achieve the standard of no detectable odor beyond the site property line,even under peak conditions. A person would have to place their nose directly into thestack exhaust to register any faint odors, and the faint odors would dissipate quickly invery short distances from the stack exhaust.
Route 9The maximum impacts would occur about 100 meters south of the site property line. Theresults are summarized in Table 18.
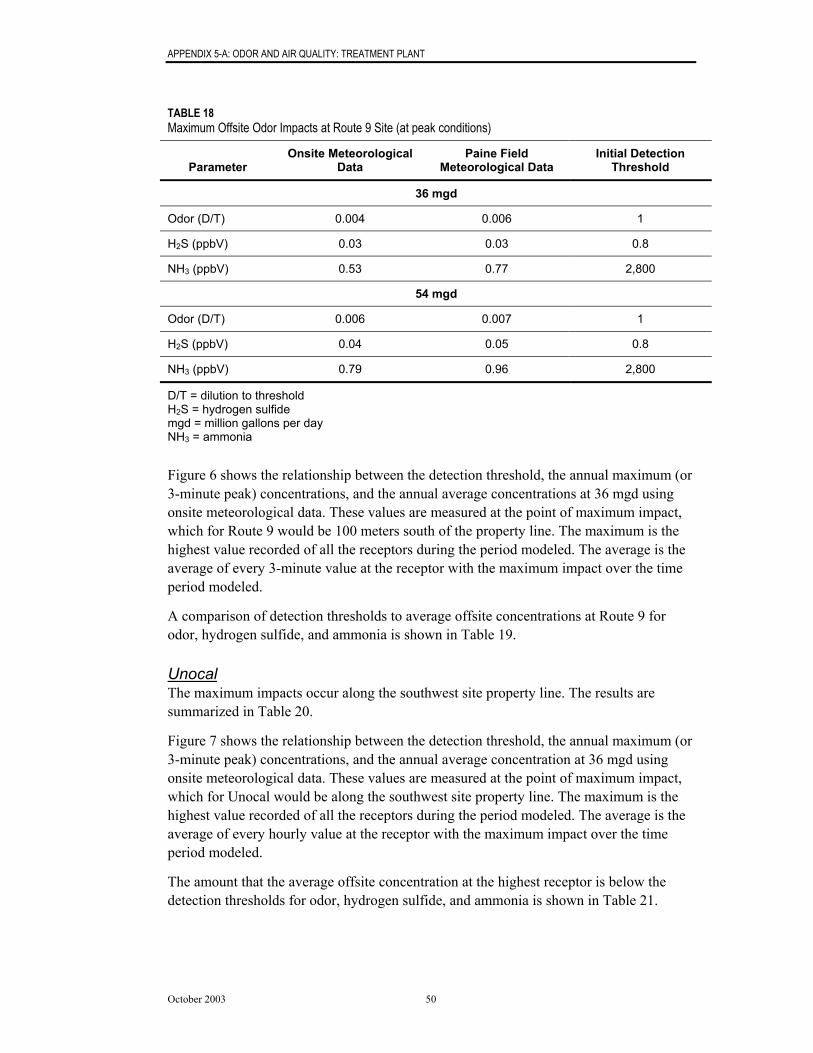
APPENDIX 5-A: ODOR AND AIR QUALITY: TREATMENT PLANT
October 2003 50
TABLE 18Maximum Offsite Odor Impacts at Route 9 Site (at peak conditions)
ParameterOnsite Meteorological
DataPaine Field
Meteorological DataInitial Detection
Threshold
36 mgd
Odor (D/T) 0.004 0.006 1
H2S (ppbV) 0.03 0.03 0.8
NH3 (ppbV) 0.53 0.77 2,800
54 mgd
Odor (D/T) 0.006 0.007 1
H2S (ppbV) 0.04 0.05 0.8
NH3 (ppbV) 0.79 0.96 2,800
D/T = dilution to thresholdH2S = hydrogen sulfidemgd = million gallons per dayNH3 = ammonia
Figure 6 shows the relationship between the detection threshold, the annual maximum (or3-minute peak) concentrations, and the annual average concentrations at 36 mgd usingonsite meteorological data. These values are measured at the point of maximum impact,which for Route 9 would be 100 meters south of the property line. The maximum is thehighest value recorded of all the receptors during the period modeled. The average is theaverage of every 3-minute value at the receptor with the maximum impact over the timeperiod modeled.
A comparison of detection thresholds to average offsite concentrations at Route 9 forodor, hydrogen sulfide, and ammonia is shown in Table 19.
UnocalThe maximum impacts occur along the southwest site property line. The results aresummarized in Table 20.
Figure 7 shows the relationship between the detection threshold, the annual maximum (or3-minute peak) concentrations, and the annual average concentration at 36 mgd usingonsite meteorological data. These values are measured at the point of maximum impact,which for Unocal would be along the southwest site property line. The maximum is thehighest value recorded of all the receptors during the period modeled. The average is theaverage of every hourly value at the receptor with the maximum impact over the timeperiod modeled.
The amount that the average offsite concentration at the highest receptor is below thedetection thresholds for odor, hydrogen sulfide, and ammonia is shown in Table 21.

APPENDIX 5-A: ODOR AND AIR QUALITY: TREATMENT PLANT
October 2003 51
TABLE 19Comparison of Detection Thresholds to Average Offsite Concentrations at Route 9 Site (36 mgd)
Parameter Initial DetectionThreshold
Average Offsite Concentration
Odor 1 D/T 0.0002 D/T (5000 times less than initialdetection threshold)
Hydrogen Sulfide 0.8 ppbVa 0.002 ppbV (400 times less than initialdetection threshold)
Ammonia 2,800 ppbVa 0.018 ppbV (155,000 times less than initialdetection threshold)
a Threshold based on recent work done by St. Croix Laboratories for Sacramento RegionalSanitation District.
D/T = dilution to thresholdppbV = parts per billion by volume
TABLE 20Maximum Offsite Odor Impacts at Unocal Site (at peak conditions)
ParameterOnsite Meteorological
DataPaine Field
Meteorological DataInitial Detection
Threshold
36 mgd
Odor (D/T) 0.02 0.01 1
H2S (ppbV) 0.20 0.10 0.8
NH3 (ppbV) 0.68 0.93 2,800
54 mgd
Odor (D/T) 0.03 0.02 1
H2S (ppbV) 0.30 0.14 0.8
NH3 (ppbV) 1.08 1.30 2,800
54 mgd with structural lid
Odor (D/T) 0.03 0.02 1
H2S (ppbV) 0.30 0.14 0.8
NH3 (ppbV) 1.31 1.30 2,800
72 mgd
Odor (D/T) 0.04 0.02 1
H2S (ppbV) 0.39 0.19 0.8
NH3 (ppbV) 1.51 1.48 2,800

APPENDIX 5-A: ODOR AND AIR QUALITY: TREATMENT PLANT
October 2003 52
TABLE 20Maximum Offsite Odor Impacts at Unocal Site (at peak conditions)
ParameterOnsite Meteorological
DataPaine Field
Meteorological DataInitial Detection
Threshold
72 mgd with structural lid
Odor (D/T) 0.04 0.02 1
H2S (ppbV) 0.40 0.19 0.8
NH3 (ppbV) 1.71 1.48 2,800
D/T = dilution to thresholdH2S = hydrogen sulfidemgd = million gallons per dayNH3 = ammonia
TABLE 21Comparison of Detection Thresholds to Average Offsite Concentrations at Unocal Site (36 mgd)
ParameterInitial Detection
Threshold Average Offsite Concentration
Odor 1 D/T 0.0001 D/T (10,000 times less than initialdetection threshold)
Hydrogen Sulfide 0.8 ppbVa 0.0008 ppbV (1,000 times less than initialdetection threshold)
Ammonia 2,800 ppbVa 0.013 ppbV (215,000 times less than initialdetection threshold)
a Threshold based on recent work done by St. Croix Laboratories for Sacramento RegionalSanitation District.
D/T = dilution to thresholdppbV = parts per billion by volume
5 AIR QUALITY IMPACTS ASSESSMENT
5.1 IntroductionThis section describes the air quality impacts assessment starting with the approach usedfor the Brightwater Treatment Plant, and followed by a description of the air pollutantsources at the treatment plant, the targeted compounds, and a quantification of the offsiteair quality impacts.
5.2 Air Pollutants Control ApproachCriteria, hazardous, and toxic air pollutants (HAPs and TAPs) generated during thetreatment process as volatile organic chemicals present in the influent wastewater arereleased from the liquid or sludge to the air. Criteria pollutants, HAPs, and TAPs are alsogenerated from combustion sources at the treatment plant. For a facility of this size, airpollutants generated from the liquid and solid treatment processes are typically

APPENDIX 5-A: ODOR AND AIR QUALITY: TREATMENT PLANT
October 2003 53
discharged directly to the atmosphere without treatment because they are generallygenerated in trace amounts below federal, state, and local air quality regulations. TheBrightwater Treatment Plant odor prevention system would have carbon scrubbers thatcould potentially remove VOCs and air toxics (air toxics are the list of TAPs and includeHAPs). Some percentage of the volatile organics could adsorb to the carbon. However,for this analysis no credit was given to the possibility of adsorption to carbon. Allnonodorous emissions from the liquids and solids treatment process were assumed to bereleased into the atmosphere, and impacts to the environment were based on thisassumption of zero percent adsorption to the carbon.
5.3 Sources of Air Pollutants
5.3.1 Liquids and Solids Treatment FacilitiesThe following treatment facilities at the treatment plant would generate trace levels ofVOCs and air toxics (TAPs and HAPs):
• Influent pump station
• Headworks (screening and degritting)
• Primary sedimentation basins
• Ballasted sedimentation basins
• Aeration basins
• Membrane tanks
• Disinfection for Puget Sound discharge (Unocal only; disinfection at Route 9 occursin the effluent tunnel)
• Disinfection for reuse
The liquids and solids treatment process are the same as those described in Section 4.3,Odor Sources. The additional sources are combustion sources, which are describedbelow.
5.3.2 Combustion SourcesFour types of combustion sources were considered when evaluating air emissions fromthe facility:
• Co-generation turbines operating on digester gas and natural gas
• Standby (emergency) internal combustion engines operating on diesel
• An enclosed flare (for combustion of digester gas when the cogenerators are down)
• Hot water boilers for heating during the winter, operating on natural gas
All of the combustion units except the enclosed flare were assumed to be located in theco-generation building. The flare would be located near the digesters.

APPENDIX 5-A: ODOR AND AIR QUALITY: TREATMENT PLANT
October 2003 54
Diesel-Fired Standby Internal Combustion Engine GeneratorTwo independent power feeders would provide power to the Brightwater Treatment Plantto meet redundancy and standby power requirements. In addition, diesel-fired onsitegeneration would be provided for critical life safety requirements.
Co-Generation TurbinesCo-generation turbines (cogens) were assumed to be used as an onsite power generationsource capable of providing sufficient power (using digester gas and natural gas) to runthe entire treatment plant facility at annual wastewater flow capacity, including theinfluent pump station if electrical power from the dual electric feed is not available.Under normal operation, the cogens would run using digester gas to offset the electricityrequired from the grid. It is possible that reciprocating engines could be used instead ofturbines if new control technology becomes available that would allow them to pass theASILs (currently not the case).
Enclosed FlareFor this analysis, the enclosed flare was assumed to be operated only when the cogens areunable to accept digester gas continuously. Operation of the flare is not expected, so itwas assumed that the flare would operate no more than 500 hours per year.
Natural Gas-Fired Hot Water BoilersAlthough the heat recovery from the cogen units would likely provide sufficient heat, thisanalysis also assumed that natural gas-fired hot water boilers would be used to heat thetreatment plant buildings for 8 months of the year (the winter heating season).
Assumptions were made regarding the types of combustion units, configuration, andcapacity of the units. Final selection, configuration, and capacity would be determinedduring project design. The combustion equipment used in the final design would require aNOC permit, use BACT and TBACT, and demonstrate that TAP emissions would be lessthan the ASILs.
5.4 Aerosols from Wastewater Treatment ProcessesAerosols are small, airborne droplets that could be generated in the aerated grit, aerationbasins, biosolids handling and treatment facilities, or other aerated wastewater processingareas. There should be no significant emissions of aerosols from the BrightwaterTreatment Plant. The design of the liquid treatment processes includes covers for allliquids and solids handling processes. Emissions of aerosols from the liquid processeswould be collected by the covers and either re-entrained in the wastewater or sent to theodor prevention system for removal or re-entrainment in the scrubber’s wastewater.Because all wastewater and solids handling processes are covered or enclosed inbuildings at Brightwater Treatment Plant, aerosols should stay in the process or be carriedand treated in the odor prevention system before discharge to the atmosphere.

APPENDIX 5-A: ODOR AND AIR QUALITY: TREATMENT PLANT
October 2003 55
5.5 Targeted Criteria and Toxic CompoundsCriteria air pollutants as well as HAPs and TAPs were evaluated in this analysis. Thecompounds evaluated are:
Nitrogen oxidesCarbon monoxideParticulate matter (<10 microns)Particulate matter (<2.5 microns)Sulfur dioxideVOCs2-MethylnaphthaleneAcetaldehydeAcroleinAcrylonitrileAmmoniaArsenicBariumBenzeneButaneCadmiumCarbon tetrachloride
ChlorobenzeneChloroform
ChromiumDichlorobenzeneDichloroethaneEthylbenzeneEthylene dibromideFluorantheneFluoreneFormaldehydeHexaneHydrogen SulfideLeadManganeseMercuryMethylene chlorideMethyl chloroform(1,1,1 Trichloroethane)Molybdenum
NaphthaleneNitric oxidePAHPentanePhenanthrenePyreneSeleniumStyreneTetrachloroethylene(perchloroethylene)TolueneTrichloroethaneTrichloroethyleneVanadiumVinyl chlorideVinylidene chlorideXyleneZinc
5.6 Quantification of Criteria and Toxic Pollutant Impacts
5.6.1 Ventilation RatesThe ventilation rates for the liquids and solids processes are the same as those describedin Section 4.5.1, Ventilation Rates. Each odor prevention source is further described inAttachment F, Liquids and Solids Process Source Parameters. For combustion sources,the exhaust rates and physical parameters are described in Attachment E, CombustionSource Parameters.
5.6.2 Assumed Influent ConcentrationsAssumptions were made for the influent wastewater concentrations of several HAPs.These influent concentrations are provided in Attachment D. Three compounds (acrolein,methylene chloride, and trichloroethylene) were not available from AMSA; thus,concentrations for these compounds were compiled from several POTWs that haveinfluent concentrations similar to those of the Brightwater facility.
The influent concentrations were chosen from sources that have been accepted by manystates, many local air quality regulatory agencies, and EPA as one of the best ways toestimate air emissions from POTWs. In addition, these influent concentrations have beenused in many POTW Title V and states’ operating permit programs and approved permitapplications. Influent data from King County’s South Treatment Plant were reviewed, butwere less conservative for total influent HAPs. Therefore, the more conservative AMSAand other POTWs values were chosen for modeling.

APPENDIX 5-A: ODOR AND AIR QUALITY: TREATMENT PLANT
October 2003 56
The references chosen to determine the emission factors used for each source aresummarized in Table 22.
TABLE 22Summary of Criteria and Toxic Air Pollutants Emission Factor Sources
Air Emission Source Reference for Emission Factors
Influent Pump Station AMSA/BASTE
Headworks AMSA/BASTE
Primary Sedimentation Basins AMSA/BASTE
Aeration Basins AMSA/BASTE
Membrane Bioreactors AMSA/BASTE
Thickening POTW Database
Dewatering PEEP
Co-Generation Turbines Section 3.1 of AP-42 + So-Low-NOx
Diesel Internal Combustion Engines Section 3.3 of AP-42 and 40 CFRChapter I Part 89 Tier 2 Standards
Enclosed Flare Section 13.5 of AP-42
Natural Gas Boilers Section 1.4 of AP-42 + low NOx burner
AMSA = Association of Metropolitan Sewage AgenciesBASTE = Bay Area Sewer Toxics EmissionsCFR = Code of Federal RegulationsPEEP = Pooled Emission Estimation ProgramPOTW = publicly owned treatment works
Emission factors from AP-42 are typically used for new facilities. AP-42 is a compilationof actual source test data from numerous facilities. The AP-42 emission factors provide abaseline emission rate. The actual emission rate would be determined during sourcetesting as required during the air permitting process.
5.6.3 Technology Selection Process (BACT)Liquids and Solids ProcessesBACT for VOCs in wastewater is typically implemented through source controlprograms. King County does this through its industrial pretreatment program. Carbonadsorption is also considered BACT for some VOCs once they move from the liquidphase to the vapor phase. For other compounds, the relative humidity of the air renderssorption to the carbon impossible. For this analysis, no credit was given for the removalof TAPs and HAPs by the carbon, and all nonodorous emissions were assumed to bereleased directly to the atmosphere. This is a conservative approach that could potentiallyoverestimate the emissions from the liquids and solids treatment processes.
Co-Generation TurbinesAs part of the air permitting process, the turbines would be required to meet BACT. Aswith other emission sources, BACT and TBACT for the co-generation turbines must be

APPENDIX 5-A: ODOR AND AIR QUALITY: TREATMENT PLANT
October 2003 57
determined on a case-by-case basis at the time of permitting. For this Final EIS, thecontrol technologies used to estimate emissions from the co-generation facility at theBrightwater Treatment Plant are based on the selection King County made for the SouthWastewater Treatment Plant in the NOC application (Kennedy/Jenks Consultants, 2003).The BACT analysis for the South Plant NOC recommended So-Low-NOx combustiontechnology, which has a guaranteed emission limit of 25 ppm NOx and 50 ppm CO at15 percent oxygen. A BACT analysis for the Brightwater Treatment Plant would beconducted when a NOC application is submitted for the facility, because newtechnologies may be available at that time.
EPA is in the process of developing MACT standards for turbines and reciprocatingengines. The combustion technology used in the NOC application would need to complywith the applicable proposed or adopted MACT standard at the time of permitting.
Diesel-Fired Standby Internal Combustion Engine GeneratorsThe engines were assumed to meet Tier 2 emission standards for NOx, hydrocarbons,CO, and particulate matter as specified in 40 CFR Chapter I Part 89 for off-highway ICengines; however, more stringent Tier 3 standards are likely to be in effect by the time theengines are installed.
Enclosed FlareAP-42 does not include specific emission factors for digester gas flares, so the emissionfactors for industrial flares (from Section 13.5 of AP-42) were used. No BACTdetermination was made for the flares. A regenerative thermal oxidizer (RTO) may beused instead of a flare. It is more conservative to use flare emissions because they aregenerally higher.
Natural Gas-Fired Hot Water HeatersA BACT analysis for the hot water boilers was not conducted at this time, but would beconducted for the NOC application. However, low-NOx burners were assumed to beinstalled on the boilers because this is generally required on all boilers of this size.
5.6.4 Air Quality Impacts AssessmentAir quality impacts were assessed for two conditions:
• Construction phase• Operations phase
Construction PhaseAlthough construction impacts are temporary, they would be mitigated based on therequirements of the PS Clean Air for minimizing air quality impacts to ambient air. PSClean Air Regulation I Section 9.15 states, “No person shall allow visible emissionsunless reasonable precautions are employed.” Construction emissions would be mitigatedby watering roads, covering loaded dump trucks, washing truck tires prior to them exitingthe construction area, and minimizing idling vehicle times. As is customary atconstruction sites, traffic could be rerouted to minimize impacts by using detours, laneclosures, and flag persons to control traffic flow. Traffic provisions are aimed at reducing

APPENDIX 5-A: ODOR AND AIR QUALITY: TREATMENT PLANT
October 2003 58
emissions by moving construction traffic in and out of the area promptly to reducevehicle emissions impacts. For Unocal, a shuttle for construction workers could be used.The shuttle would bring workers to the site from offsite parking lots. There would also bea remote construction truck holding area to minimize conflicts to the ferry trafficmovement along SR 104, schedule construction material delivery to the site duringoffpeak hours, and encourage workers to carpool to the construction site.
PS Clean Air has the responsibility to determine compliance with its Regulation I,Section 9.15. Washington State and Federal Operational Safety and Health Act (OSHA)regulations for worker safety during construction may also require onsite monitoring toensure that worker health and safety standards are met. This would include monitoring aircontaminants that could be emitted to the air from contaminated soil or groundwater.Failure to comply with these standards would result in curtailing or stopping the activitythat was producing violations.
Final EIS Chapter 16, Transportation, includes traffic estimates of the number of truckstrips to be used during construction.
Route 9 SiteThe history of land uses at the Route 9 site (auto wrecking yards) indicates that somecontaminants could potentially have leaked from vehicles and other sources. However,the expected concentration of these chemicals in the soil and the volumes of material tobe excavated from the site are less than at the Unocal site. Therefore, air emissionimpacts from the cleanup of contaminated soils and fugitive dust should be less for theRoute 9 site than for the Unocal site.
Because less excavated material would be removed from the Route 9 site than the Unocalsite, the number of haul truck trips would be fewer, resulting in lower air impacts fromthe combustion of diesel in haul trucks. The potential for impacts would be short term,occurring only while demolition or construction work is in progress. No significant long-term adverse impacts on local or regional air quality are anticipated.
Unocal SitePotential air emissions from construction at the Unocal site could be generated due topossible emissions of contaminants present in groundwater or soil at the site. Thesecontaminants (which would be classified as TAPs or HAPs under applicable regulations)could volatilize, or disperse into the air, if the soil or groundwater containing them weredisturbed. Cleanup of the contamination at the Unocal site could follow two scenarios:
• Unocal could clean up all known contamination and bring the site up to Ecology’srequirements before selling the site to King County, or
• King County could purchase the site and take over responsibility for site cleanup.
If Unocal were to clean up the site prior to sale, emissions of these contaminants wouldnot take place during treatment plant construction because the contamination would havebeen removed prior to the County’s acquisition of the site. Because a decision has not yetbeen made regarding site cleanup timing and responsibility, potential impacts based oncurrently available information are discussed in this section.

APPENDIX 5-A: ODOR AND AIR QUALITY: TREATMENT PLANT
October 2003 59
Information on soil contaminant concentrations is available for the Unocal site. Theinformation presented here is from the most recent interim action performed by Unocal atthe site. The interim action consisted of removal of contaminants in soil and groundwaterfrom four areas in the lower yard. The work was performed from August through October2001. Data were obtained from Draft Lower Yard Interim Action, As-Built Report,Unocal Edmonds Terminal (Maul, Foster, and Algoni (MFA), 2002). This information isused here because it is the most recent data and it represents contaminant concentrationspresent in soil that likely would be excavated if construction were to begin in the nearfuture.
The interim action consisted of removing soil that was visibly saturated with petroleumproduct to a depth below the water table surface (which fluctuates several feet daily undertidal influence). The excavations then were left open for 1 month to allow petroleumproduct to accumulate on water in the excavation. Unocal then removed the product usingskimmer type pumps. The excavations were backfilled with clean, imported material.Prior to backfilling, samples were obtained from the excavation sidewalls to documenttotal petroleum hydrocarbon (TPH) concentrations in the unsaturated soil at theexcavation limits. The samples were analyzed for gasoline-range (GRO), diesel-range(DRO), and heavy-oil-range (HO) hydrocarbons; benzene, toluene, ethylbenzene, andxylenes (BETX); and polycyclic aromatic hydrocarbons (PAHs). The report does notinclude the exact locations of the samples, but all the excavations were located in thelower yard.
Table 23 presents the results of soil sampling conducted in the excavations. Included arefour samples: one with the highest concentration in the diesel range (designated as“Maximum D” in the table); one with the highest concentration in the gasoline range(designated as “Maximum G”); one with a moderate or “Medium” concentration (but notan average); and one with a low concentration.
TABLE 23Contaminants Present in Unocal Site Soils, August – October 2001
ContaminantMaximum D
(mg/kg)Maximum G
(mg/kg)Medium(mg/kg)
Low(mg/kg)
TPH-Diesel Range (DRO) 35,100 2830 1320 254
TPH-Heavy Oil Range (HO) 10,900 1790 1040 214
TPH-Gasoline Range (GRO) 147 J 2060 363J 8.93J
Benzene <0.0600 1.36J 0.0681 <0.0300
Ethylbenzene 0.169 17.1 0.551 <0.0500
Toluene <0.100 <1.00 <0.0500 <0.0500
Total Xylenes 1.01 J 31.4 1.44 <0.100
Benzo(a)pyrene <0.028 <0.0055 0.057 0.025
Benzo(a)anthracene 0.24 0.12 0.098 0.034
Benzo(b)fluoranthene <0.030 <0.0060 <0.0060 <0.0012
Benzo(k)fluoranthene <0.040 <0.0080 <0.0080 <0.0016

APPENDIX 5-A: ODOR AND AIR QUALITY: TREATMENT PLANT
October 2003 60
TABLE 23Contaminants Present in Unocal Site Soils, August – October 2001
ContaminantMaximum D
(mg/kg)Maximum G
(mg/kg)Medium(mg/kg)
Low(mg/kg)
Chrysene 1.3J 0.24 0.16 0.1
Dibenzo(a,h)anthracene <0.035 <0.0070 <0.0070 <0.0014
Indeno(1,2,3-cd)pyrene <0.048 <0.0095 <0.0095 0.02
Source: Draft Lower Yard Interim Action, As-Built Report, Unocal Edmonds Terminal (Maul,Foster, and Algoni, 2002)
“J” = qualifier indicating estimated value“D” = diesel“G” = gasolinemg/kg = milligram per kilogram
Based upon the contaminant levels in Table 23, only benzene and PAH appear to have thepotential to exceed the SQER. Thus, it is likely that air quality regulatory agencies wouldrequire dispersion modeling for benzene and PAH if site cleanup had not been completedbefore King County undertook construction of a treatment plant at the Unocal site.Dispersion modeling for these contaminants was not conducted for this EIS because theamount of contaminated material to be excavated and the period over which theexcavation of this material would be completed (both critical factors in dispersionmodeling) are not known at this time.
Operations PhaseThe air impact assessment for the operations phase had two steps. First was to calculatethe air emissions from the treatment plant liquids, solids, and combustion sources, andsecond was to enter the emissions into an air dispersion model to simulate offsite impacts.
The emission estimates are for potential yearly and maximum daily emissions. Theestimate of potential yearly emissions assumed that all liquids, solids, and combustionunits are operating at the design capacity. Because the facility has the ability to operatethe standby engine and the enclosed flare from 0 to 500 hours a year, which would resultin the cogen turbines operating from 8,260 to 8,760 hours per year (assuming noelectricity is available from the dual feed), the maximum potential yearly emissions foreach pollutant were based on the source with the highest emission factor operating themaximum hours allowed. Emissions from liquids and solids processes were added toemissions from combustion sources. In addition, the maximum daily emissions estimatedthe maximum potential emission for each pollutant in a 24-hour period. For example, thestandby diesel engines would not operate at the same time as the cogen turbines. Forsome pollutants the daily emissions would be higher if the engines operated for 24 hours,but for other pollutants the daily emissions would be higher if the turbines were operatedfor 24 hours. Because the maximum daily emission for each pollutant was based on thehighest emission rate for that pollutant, some of the emission rates are with the cogensoperating and some are with the diesel engines operating. The actual daily maximum forthe sum total of all the pollutants would always be less than this estimate, because allthese units would not be operated concurrently.

APPENDIX 5-A: ODOR AND AIR QUALITY: TREATMENT PLANT
October 2003 61
The approach used for Brightwater Treatment Plant was to assume the worst-case or peakoperating condition for all sources to establish the highest possible emissions for criteriapollutants, HAPs, and TAPs. In reality, all facilities may not operate at their peakcondition at the same time. However, this approach is appropriately conservative formodeling at this level of design. If the Brightwater Treatment Plant can meets its airtoxics and other air quality criteria with these assumptions, and because furtherrefinements would likely make the assumptions less conservative, then the BrightwaterTreatment Plant’s air emissions would not adversely impact its neighbors.
Air EmissionsAir emissions at the treatment plant are from three sources: liquids processes, solidsprocesses, and combustion sources.
Liquids Treatment EmissionsVolatile organic compound (VOC) and HAP emissions were estimated using the BASTEmodel and the POTW database. The individual compounds and influent concentrationsmodeled are from AMSA and are included in Attachment D. The influent concentrationsfor the King County South Treatment Plant were reviewed, but the total mass loading forthe AMSA values was more conservative and therefore AMSA values were used.
The emissions from the liquids processes are captured under the covers and vented to theodor prevention system as described in Section 4.2, Odor Sources.
All compounds were modeled by BASTE or estimated using data from similar typePOTWs except ethylene dibromide and vinylidene chloride. These compounds were notavailable in BASTE, and a mass balance approach using influent data from AMSA wasused to determine these HAP emissions. The mass balance method is conservativebecause it assumes that the entire influent mass is completely volatilized and does notaccount for the sorption or biodegradation that typically occurs at a POTW for mostVOCs, HAPs, and TAPs.
Because all the identified HAPs and TAPs from the liquid treatment processes are alsovolatiles, the VOC emission rate was calculated by adding up the individual HAP andTAP emission rates, plus other pollutants that are VOCs and not either a HAP or TAP.
Solids Treatment EmissionsVOC and HAP emissions from the solids treatment processes result from three processes:gravity belt thickeners (GBTs), digesters, and dewatering centrifuges. The emissionsfrom dewatering centrifuges were estimated using the Pooled Emission EstimationProgram (PEEP). PEEP was established to develop a POTW industrywide estimationmethod for air toxic emissions from 18 POTW unit processes. PEEP quantified airemissions using uniform protocols for sampling and analysis, which were approved bylocal air regulators and reviewed by state and national air pollution agencies. The annualaverage emission rates at other POTWs were adjusted using the appropriate sludge flowrates for Brightwater Treatment Plant. PEEP and POTW emissions were used becausethey have been accepted by local, state, and federal regulatory agencies and used in manyexisting POTW Title V and state-required air quality operating permits. The emissionsfrom the GBTs at the Brightwater Treatment Plant were estimated using the appropriate
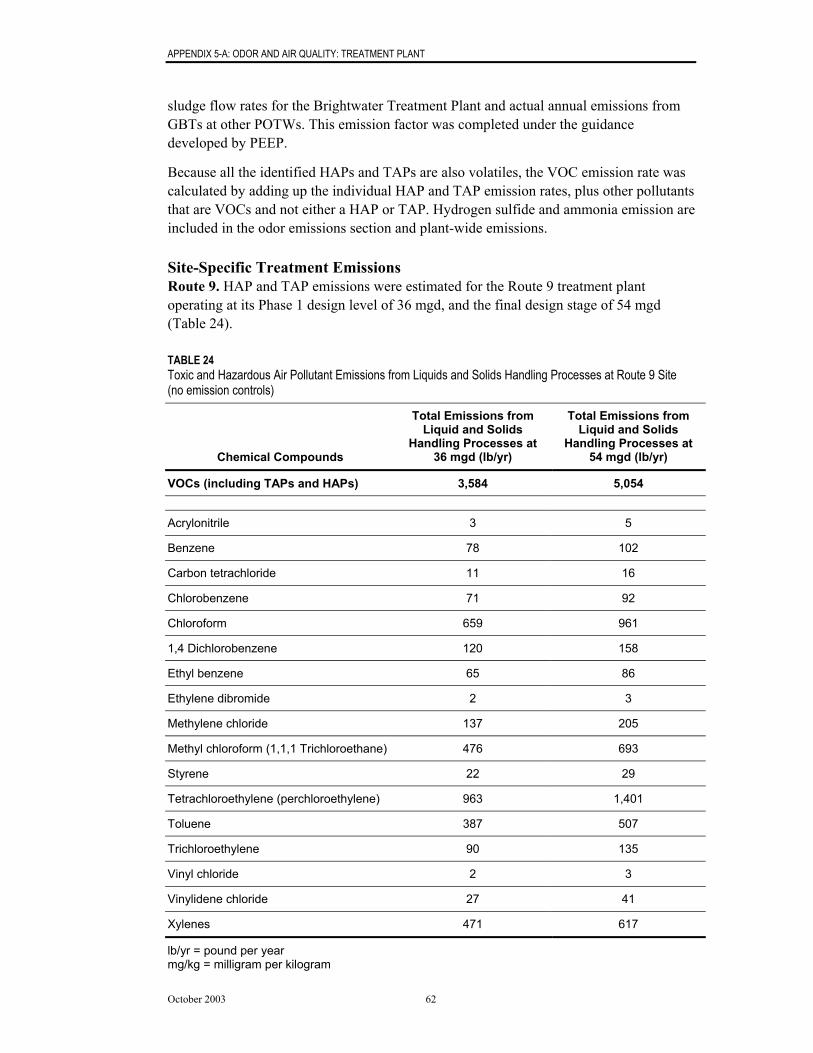
APPENDIX 5-A: ODOR AND AIR QUALITY: TREATMENT PLANT
October 2003 62
sludge flow rates for the Brightwater Treatment Plant and actual annual emissions fromGBTs at other POTWs. This emission factor was completed under the guidancedeveloped by PEEP.
Because all the identified HAPs and TAPs are also volatiles, the VOC emission rate wascalculated by adding up the individual HAP and TAP emission rates, plus other pollutantsthat are VOCs and not either a HAP or TAP. Hydrogen sulfide and ammonia emission areincluded in the odor emissions section and plant-wide emissions.
Site-Specific Treatment EmissionsRoute 9. HAP and TAP emissions were estimated for the Route 9 treatment plantoperating at its Phase 1 design level of 36 mgd, and the final design stage of 54 mgd(Table 24).
TABLE 24Toxic and Hazardous Air Pollutant Emissions from Liquids and Solids Handling Processes at Route 9 Site(no emission controls)
Chemical Compounds
Total Emissions fromLiquid and Solids
Handling Processes at36 mgd (lb/yr)
Total Emissions fromLiquid and Solids
Handling Processes at54 mgd (lb/yr)
VOCs (including TAPs and HAPs) 3,584 5,054
Acrylonitrile 3 5
Benzene 78 102
Carbon tetrachloride 11 16
Chlorobenzene 71 92
Chloroform 659 961
1,4 Dichlorobenzene 120 158
Ethyl benzene 65 86
Ethylene dibromide 2 3
Methylene chloride 137 205
Methyl chloroform (1,1,1 Trichloroethane) 476 693
Styrene 22 29
Tetrachloroethylene (perchloroethylene) 963 1,401
Toluene 387 507
Trichloroethylene 90 135
Vinyl chloride 2 3
Vinylidene chloride 27 41
Xylenes 471 617
lb/yr = pound per yearmg/kg = milligram per kilogram

APPENDIX 5-A: ODOR AND AIR QUALITY: TREATMENT PLANT
October 2003 63
Unocal. HAP and TAP emissions were estimated for the Unocal treatment plantoperating at its Phase 1 design level of 36 mgd, the final design stage of 54 mgd, and the72-mgd sub-alternative (Table 25).
TABLE 25Toxic and Hazardous Air Pollutant Emissions from Liquids and Solids Handling Processes at Unocal Site(no emission controls)
Chemical Compounds
Total Emissionsfrom Liquid andSolids Handling
Processes at 36 mgd(lb/yr)
Total Emissionsfrom Liquid andSolids Handling
Processes at 54 mgd(lb/yr)
Total Emissionsfrom Liquid andSolids Handling
Processes at 72 mgd(lb/yr)
VOCs (including TAPsand HAPs)
3,584 5,054 6,595
Acrylonitrile 3 5 6
Benzene 78 102 126
Carbon tetrachloride 11 16 22
Chlorobenzene 71 92 114
Chloroform 659 961 1,283
1,4 Dichlorobenzene 120 158 195
Ethyl benzene 65 86 107
Ethylene dibromide 2 3 4
Methylene chloride 137 205 273
Methyl chloroform (1,1,1Trichloroethane)
476 693 925
Styrene 22 29 36
Tetrachloroethylene(perchloroethylene)
963 1,401 1,871
Toluene 387 507 629
Trichloroethylene 90 135 179
Vinyl chloride 2 3 4
Vinylidene chloride 27 41 55
Xylenes 471 617 764
lb/yr = pound per yearmg/kg = milligram per kilogram
Combustion SourcesCriteria pollutant, HAP, and TAP emission estimates for the combustion sources weredeveloped using emission information provided by EPA’s AP-42, Compilation of AirPollution Emission Factors, and 40 CFR Chapter I Part 89, which regulates emissionsfrom off-highway internal combustion engines. As the treatment plant’s design continues
APPENDIX 5-A: ODOR AND AIR QUALITY: TREATMENT PLANT
October 2003 64
to develop and more specific information about the emission units can be provided by theselected vendors, the accuracy of the emission estimates would improve and most likelyproduce lower emission rates.
Assumptions were made regarding the types of combustion units, configuration, andcapacity of the units. Final selection, configuration, and capacity would be determinedduring project design. The combustion equipment used in the final design would require aNOC permit, use BACT and TBACT, and demonstrate that TAP emissions would be lessthan the ASILs.
Assumptions related to the capacity and operating hours of combustion equipment arecrucial in determining emissions. Potential emissions are based on the combustionsources running at rated capacity, or maximum digester gas flow rates, for the maximumallowed time period. Additional information about assumptions used in characterizing theemissions is provided below and in a later Section titled Offsite Air Quality Impacts.
Operating scenarios could include:
• Using digester gas and natural gas to generate electricity for the average wet weatherplant flow (including the influent pump station)
• Using the emergency internal combustion engines during power failures to serveessential life and safety needs and to restart the cogen units
• Flaring digester gas when the cogen units are inoperable
Co-Generation TurbinesThe cogen equipment used in the final design would require a NOC permit, use BACTand TBACT, and demonstrate that TAP emissions would be less than the ASILs. Thecogens would use digester gas and natural gas as fuel. The peak digester gas productionof the 54-mgd treatment plant is estimated at 1,100 cfm, with an average yearlyproduction of 398 cfm at 54 mgd. Potential emissions were calculated assuming theturbines would operate at maximum load 365 days a year. The yearly fuel requirementswere provided by a daily average of 398 cfm of digester gas, with the remaining fuelrequirement provided by natural gas. The daily fuel requirements were provided by peakdaily rate of 1,100 cfm of digester gas, with the remaining fuel requirement provided bynatural gas. In calculating the maximum 24-hour emission rate, if the emission factor fora specific toxic chemical was higher for natural gas than the emission factor for digestergas, all the fuel requirement was assumed to be provided by natural gas. Section 3.1 ofAP-42 provides emissions for turbines operating on digester gas and natural gas, whichwere used in the modeling. The estimated heat content of the digester gas is 600 Britishthermal units (Btu) per cubic foot.
The primary criteria pollutants that could be emitted from the co-generation facilities areoxides of NOx, CO, particulate matter less than 10 microns in diameter (PM10) and lessthan 2.5 microns (PM2.5), and SO2. Several key assumptions were made concerning NOx
and SO2 emissions; these are discussed below.

APPENDIX 5-A: ODOR AND AIR QUALITY: TREATMENT PLANT
October 2003 65
Emission estimates for the toxic air pollutant nitric oxide (NO), a component of NOx, arebased on the assumption that 95 percent of the NOx emitted from a turbine is in the formof NO. Therefore, as NOx emissions are reduced, nitric oxide emissions also are reduced.
SO2 emissions were based on an estimated maximum annual concentration of 200 partsper million (ppm) of H2S in the digester gas stream because this is the concentrationtypically seen in the digester gas at the King County South Wastewater Treatment Plant.
Fuel CellsIt is possible that the final design of the Brightwater Treatment Plant would use fuel cellsinstead of turbines for converting the digester gas into energy. Emissions from fuel cellsconsist mostly of nitrogen, water vapor, and carbon dioxide. Fuel cells do generate someemissions of NOx, CO, and VOCs, but at significantly lower levels than combustiontechnology like the cogen turbines. A 1.0-megawatt (MW) fuel cell is currently beinginstalled at the South Wastewater Treatment Plant. The fuel cell will be tested on bothdigester gas and natural gas during a 2-year demonstration period from fall 2003 throughfall 2005. Air emissions will be monitored during this period, and the data from thedemonstration will be used to determine future feasibility for long-term use of fuel cellsat wastewater treatment plants, including Brightwater.
Diesel-Fired Standby Internal Combustion EngineThis air emissions analysis includes the use of two 250-kilowatt (kW) standby internalcombustion (IC) engines to provide emergency power to serve essential life and safetyneeds and to startup the cogens during a power failure. These standby IC engines wouldonly be used as an emergency source of power. This analysis assumes that the enginescould be operated for up to 500 hours per year, or 6 percent of the year, in a standbymode. It was assumed that the standby IC engines, when operated, would be operated atgreater than 90 percent capacity. Emission factors for these types of units are provided inSection 3.3 of AP-42.
The engines were assumed to meet Tier 2 emission standards for NOx, hydrocarbons,CO, and particulate matter as specified in 40 CFR Chapter I Part 89 for off-highway ICengines. If they are built after 2006, they would likely have to meet the Tier 3 emissionstandards in 40 CFR Chapter 1, Part 89. The Tier 3 emission standards are more stringentthan the Tier 2 standards. As in the cogen discussion, emission estimates for the toxic airpollutant NO are based on the assumption that 95 percent of the NOx emitted from aengines would be in the form of NO.
The standby engines and the cogen turbines do not operate at the same time. Therefore,yearly and daily potential emission estimates for each pollutant were estimated assumingthat the process with the highest emission rate for that pollutant is operating themaximum amount of time allowed.
Enclosed FlareThe digester gas flared would be the peak digester gas production of 1,100 cfm for a54 mgd facility and 1,600 cfm for a 72 mgd facility. AP-42 does not include specificemission factors for digester gas flares, so the emission factors for industrial flares (from
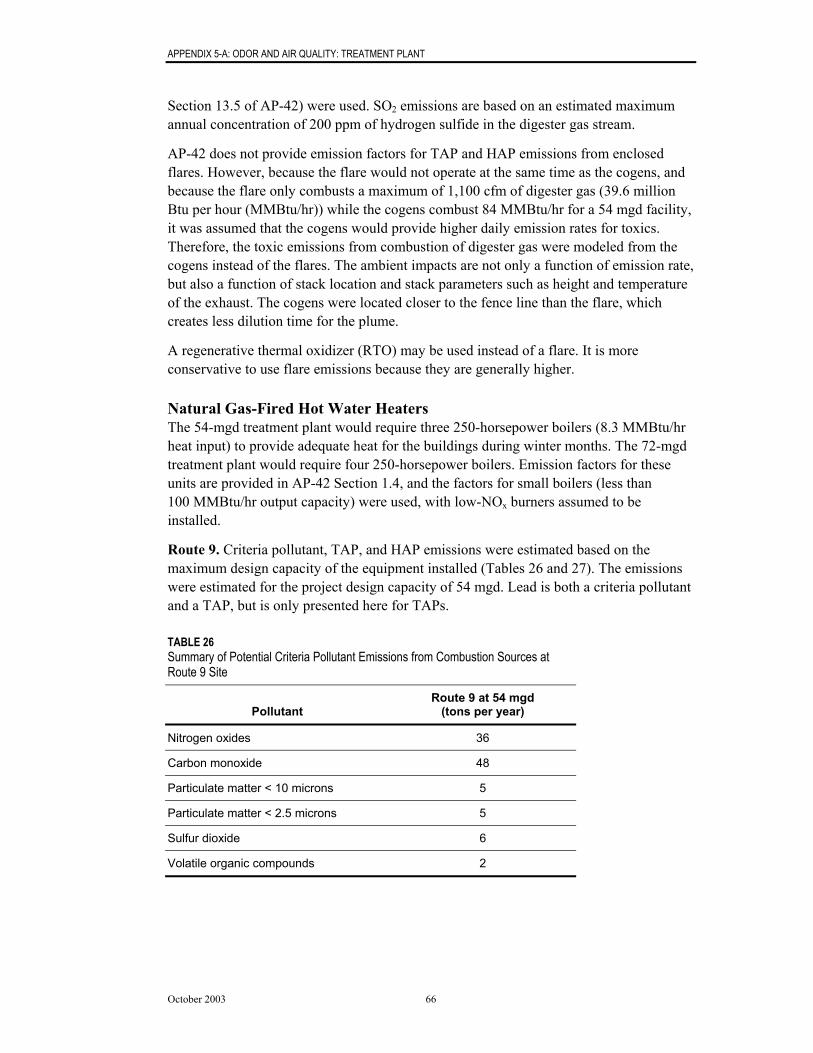
APPENDIX 5-A: ODOR AND AIR QUALITY: TREATMENT PLANT
October 2003 66
Section 13.5 of AP-42) were used. SO2 emissions are based on an estimated maximumannual concentration of 200 ppm of hydrogen sulfide in the digester gas stream.
AP-42 does not provide emission factors for TAP and HAP emissions from enclosedflares. However, because the flare would not operate at the same time as the cogens, andbecause the flare only combusts a maximum of 1,100 cfm of digester gas (39.6 millionBtu per hour (MMBtu/hr)) while the cogens combust 84 MMBtu/hr for a 54 mgd facility,it was assumed that the cogens would provide higher daily emission rates for toxics.Therefore, the toxic emissions from combustion of digester gas were modeled from thecogens instead of the flares. The ambient impacts are not only a function of emission rate,but also a function of stack location and stack parameters such as height and temperatureof the exhaust. The cogens were located closer to the fence line than the flare, whichcreates less dilution time for the plume.
A regenerative thermal oxidizer (RTO) may be used instead of a flare. It is moreconservative to use flare emissions because they are generally higher.
Natural Gas-Fired Hot Water HeatersThe 54-mgd treatment plant would require three 250-horsepower boilers (8.3 MMBtu/hrheat input) to provide adequate heat for the buildings during winter months. The 72-mgdtreatment plant would require four 250-horsepower boilers. Emission factors for theseunits are provided in AP-42 Section 1.4, and the factors for small boilers (less than100 MMBtu/hr output capacity) were used, with low-NOx burners assumed to beinstalled.
Route 9. Criteria pollutant, TAP, and HAP emissions were estimated based on themaximum design capacity of the equipment installed (Tables 26 and 27). The emissionswere estimated for the project design capacity of 54 mgd. Lead is both a criteria pollutantand a TAP, but is only presented here for TAPs.
TABLE 26Summary of Potential Criteria Pollutant Emissions from Combustion Sources atRoute 9 Site
PollutantRoute 9 at 54 mgd
(tons per year)
Nitrogen oxides 36
Carbon monoxide 48
Particulate matter < 10 microns 5
Particulate matter < 2.5 microns 5
Sulfur dioxide 6
Volatile organic compounds 2

APPENDIX 5-A: ODOR AND AIR QUALITY: TREATMENT PLANT
October 2003 67
TABLE 27Summary of Hazardous and Toxic Air Pollutants (HAP and TAP) Emissions fromCombustion Sources at Route 9 Site
PollutantRoute 9 at 54 mgd(pounds per year)
2-Methylnaphthalene 0.0034
Acetaldehyde 56
Acrolein 8.7
Arsenic 0.029
Barium 0.63
Benzene 17.5
Butane 299
Cadmium 0.157
Chlorobenzene 0.009
Chloroform 0.019
Chromium 0.200
Dichlorobenzene 0.196
Dichloroethane 0.034
Ethylbenzene 40
Fluoranthene 0.0004
Fluorene 0.0004
Formaldehyde 916
Hexane 257
Lead 0.071
Manganese 0.054
Mercury 0.037
Methylene chloride 0.006
Molybdenum 0.157
Naphthalene 2.1
Nitric oxide 67789
PAH 3
Pentane 371
Phenanthrene 0.0024
Pyrene 0.0007
Selenium 1.4
Tetrachloroethylene (perchloroethylene) 0.09

APPENDIX 5-A: ODOR AND AIR QUALITY: TREATMENT PLANT
October 2003 68
TABLE 27Summary of Hazardous and Toxic Air Pollutants (HAP and TAP) Emissions fromCombustion Sources at Route 9 Site
PollutantRoute 9 at 54 mgd(pounds per year)
Toluene 162
Trichloroethane 0.0007
Vanadium 0.33
Vinyl chloride 0.034
Xylene 80
Zinc 4.1
Unocal. Criteria pollutant, TAP, and HAP emissions were estimated based on themaximum design capacity of the equipment installed (Tables 28 and 29). The emissionswere estimated for the project design capacity of 54 mgd and 72 mgd. Lead is both acriteria and a toxic air pollutant, but is only presented in the table for toxic air pollutants.
Plantwide EmissionsHydrogen sulfide and ammonia were evaluated as odor-causing compounds; however,they are also considered toxic air contaminants. Therefore, they have been included in theplantwide emission of toxic and hazardous air pollutants. The estimated emissions forhydrogen sulfide and ammonia are from the calculations described in Section 4.5.2,Assumed Odor Concentrations, and not from BASTE.
TABLE 28Summary of Potential Criteria Pollutant Emissions from Combustion Sources at Unocal Site
PollutantUnocal at 54 mgd(Tons Per Year)
Unocal at 72 mgd(Tons Per Year)
Nitrogen oxides 36 44
Carbon monoxide 48 60
Particulate matter < 10 microns 5 7
Particulate matter < 2.5 microns 5 7
Sulfur dioxide 6 8
Volatile organic compounds 2 3

APPENDIX 5-A: ODOR AND AIR QUALITY: TREATMENT PLANT
October 2003 69
TABLE 29Summary of Hazardous and Toxic Air Pollutants (HAP and TAP) Emissions from Combustion Sources atUnocal Site
PollutantUnocal at 54 mgd(pounds per year)
Unocal at 72 mgd(pounds per year)
2-Methylnaphthalene 0.0034 0.0046
Acetaldehyde 56 69
Acrolein 8.7 10.8
Arsenic 0.029 0.038
Barium 0.63 0.84
Benzene 17.5 20.9
Butane 299 399
Cadmium 0.157 0.209
Chlorobenzene 0.009 0.012
Chloroform 0.019 0.026
Chromium 0.200 0.266
Dichlorobenzene 0.196 0.262
Dichloroethane 0.034 0.045
Ethylbenzene 40 49
Fluoranthene 0.0004 0.0006
Fluorene 0.0004 0.0005
Formaldehyde 916 1122
Hexane 257 342
Lead 0.071 0.095
Manganese 0.054 0.072
Mercury 0.037 0.049
Methylene chloride 0.006 0.008
Molybdenum 0.157 0.209
Naphthalene 2.1 2.5
Nitric oxide 67789 84127
PAH 3 4
Pentane 371 494
Phenanthrene 0.0024 0.0032
Pyrene 0.0007 0.0010
Selenium 1.4 1.8
Tetrachloroethylene (perchloroethylene) 0.09 0.12

APPENDIX 5-A: ODOR AND AIR QUALITY: TREATMENT PLANT
October 2003 70
TABLE 29Summary of Hazardous and Toxic Air Pollutants (HAP and TAP) Emissions from Combustion Sources atUnocal Site
PollutantUnocal at 54 mgd(pounds per year)
Unocal at 72 mgd(pounds per year)
Toluene 162 198
Trichloroethane 0.0007 0.0010
Vanadium 0.33 0.44
Vinyl chloride 0.034 0.045
Xylene 80 98
Zinc 4.1 5.5
Route 9. The plantwide emissions for the Route 9 site are summarized in Tables 30 and31.
TABLE 30Summary of Plantwide Potential Criteria Pollutant Emissions at Route 9 Site
PollutantRoute 9 at 54 mgd
(tons per year)
Nitrogen oxides 36
Carbon monoxide 48
Particulate matter < 10 microns 5
Particulate matter < 2.5 microns 5
Sulfur dioxide 6
Volatile organic compounds 5
TABLE 31Summary of Plantwide Hazardous and Toxic Air Pollutants (HAP and TAP) Emissions at Route 9 Site
Pollutant Class A or B TAP HAP54 mgd
(Pounds per Year)
2-Methylnaphthalene Federal PAH Yes 0.0034
Acetaldehyde A 56
Acrolein B 8.7
Acrylonitrile A Yes 4.8
Ammonia B 39.7
Arsenic A 0.029
Barium B 0.63

APPENDIX 5-A: ODOR AND AIR QUALITY: TREATMENT PLANT
October 2003 71
TABLE 31Summary of Plantwide Hazardous and Toxic Air Pollutants (HAP and TAP) Emissions at Route 9 Site
Pollutant Class A or B TAP HAP54 mgd
(Pounds per Year)
Benzene A 119
Butane B 299
Cadmium A 0.16
Carbon tetrachloride A Yes 16
Chlorobenzene B Yes 92
Chloroform A Yes 961
Chromium B 0.200
Dichlorobenzene A 158
Dichloroethane A 0.034
Ethylbenzene B 126
Ethylene dibromide A Yes 3.3
Fluoranthene Federal PAH Yes 0.0004
Fluorene Federal PAH Yes 0.0004
Formaldehyde A 916
Hexane B 257
Hydrogen Sulfide B 8.5
Lead A 0.071
Manganese B 0.054
Mercury B 0.037
Methylene chloride A Yes 205
Methyl chloroform(1,1,1 Trichloroethane)
B Yes 693
Molybdenum B 0.157
Naphthalene B 2.1
Nitric oxide B 67,789
PAH A - TAP PAH 3.0
Pentane B 371
Phenanthrene Federal PAH Yes 0.0024
Pyrene Federal PAH Yes 0.0007
Selenium B 1.4
Styrene B Yes 29
Tetrachloroethylene A Yes 1401

APPENDIX 5-A: ODOR AND AIR QUALITY: TREATMENT PLANT
October 2003 72
TABLE 31Summary of Plantwide Hazardous and Toxic Air Pollutants (HAP and TAP) Emissions at Route 9 Site
Pollutant Class A or B TAP HAP54 mgd
(Pounds per Year)(perchloroethylene)
Toluene B 669
Trichloroethane B 0.0007
Trichloroethylene A Yes 135
Vanadium B 0.33
Vinyl chloride A Yes 3.3
Vinylidene chloride B Yes 41
Xylene B 697
Zinc B 4.1
Total HAPs 5,738
Total TAPs without Nitric Oxide 7,322
Total TAPs with Nitric Oxide 75,111
PAH = polycyclic aromatic hydrocarbon
Unocal. The plantwide emissions for the Unocal site are summarized in Tables 32 and33.
TABLE 32Summary of Plantwide Potential Criteria Pollutant Emissions at Unocal Site
PollutantUnocal at 54 mgd
(tons per year)Unocal at 72 mgd
(tons per year)
Nitrogen oxides 36 44
Carbon monoxide 48 60
Particulate matter < 10 microns 5 7
Particulate matter < 2.5 microns 5 7
Sulfur dioxide 6 8
Volatile organic compounds 5 6

APPENDIX 5-A: ODOR AND AIR QUALITY: TREATMENT PLANT
October 2003 73
TABLE 33Summary of Plantwide Hazardous and Toxic Air Pollutants (HAP and TAP) Emissions at Unocal Site
Pollutant Class A or B TAP HAP54 mgd
(pounds per year)72 mgd
(pounds per year)
2-Methylnaphthalene Federal PAH Yes 0.0034 0.0046
Acetaldehyde A 56 69
Acrolein B 8.7 10.8
Acrylonitrile A Yes 4.8 6.3
Ammonia B 39.7 52.5
Arsenic A 0.029 0.038
Barium B 0.63 0.84
Benzene A 119 147
Butane B 299 399
Cadmium A 0.16 0.21
Carbon tetrachloride A Yes 16 22
Chlorobenzene B Yes 92 114
Chloroform A Yes 961 1283
Chromium B 0.200 0.266
Dichlorobenzene A 158 195
Dichloroethane A 0.034 0.045
Ethylbenzene B 126 156
Ethylene dibromide A Yes 3.3 4.4
Fluoranthene Federal PAH Yes 0.0004 0.0006
Fluorene Federal PAH Yes 0.0004 0.0005
Formaldehyde A 916 1122
Hexane B 257 342
Hydrogen Sulfide B 8.5 11.1
Lead A 0.071 0.095
Manganese B 0.054 0.072
Mercury B 0.037 0.049
Methylene chloride A Yes 205 273
Methyl chloroform(1,1,1 Trichloroethane)
B Yes 693 925
Molybdenum B 0.157 0.209
Naphthalene B 2.1 2.5
Nitric oxide B 67,789 84,127

APPENDIX 5-A: ODOR AND AIR QUALITY: TREATMENT PLANT
October 2003 74
TABLE 33Summary of Plantwide Hazardous and Toxic Air Pollutants (HAP and TAP) Emissions at Unocal Site
Pollutant Class A or B TAP HAP54 mgd
(pounds per year)72 mgd
(pounds per year)
PAH A - TAP PAH 3.0 3.7
Pentane B 371 494
Phenanthrene Federal PAH Yes 0.0024 0.0032
Pyrene Federal PAH Yes 0.0007 0.0010
Selenium B 1.4 1.8
Styrene B Yes 29 36
Tetrachloroethylene(perchloroethylene)
A Yes 1401 1871
Toluene B 669 827
Trichloroethane B 0.0007 0.0010
Trichloroethylene A Yes 135 179
Vanadium B 0.33 0.44
Vinyl chloride A Yes 3.3 4.4
Vinylidene chloride B Yes 41 55
Xylene B 697 862
Zinc B 4.1 5.5
Total HAPs 5,738 7,447
Total TAPs without Nitric Oxide 7,322 9,478
Total TAPs with Nitric Oxide 75,111 93,605
PAH = polycyclic aromatic hydrocarbon
Offsite Air Quality ImpactsThe results of the air quality modeling at both sites indicate that predicted impacts usingonsite meteorological data and Paine Field data would not result in any ASILexceedances beyond the property line of the treatment plant except for chloroform. ForTables 34 through 38, the maximum impacts of the combined onsite and Paine Field dataset are shown. An evaluation of the removal efficiency of the carbon, and its feasibility asa control device for chloroform, is currently being conducted. If it is not technicallyfeasible to control chloroform using carbon or some other control technology to levelsthat meet the ASIL, then a second-tier analysis would be conducted. Chloroformemissions are regularly above the ASILs at other similar-sized wastewater treatmentplants due to the chlorine in the drinking water that is discharged to the treatment plant. Itis common to do a second-tier analysis, and typically the health impact assessment showslittle to no health risks due to chloroform in the area surrounding a wastewater treatmentplant.

APPENDIX 5-A: ODOR AND AIR QUALITY: TREATMENT PLANT
October 2003 75
A second-tier analysis was conducted for King County’s West Point Sewage TreatmentPlant in 1982. The analysis concluded that the exposure of Fort Lawton residents to thechloroform emissions from the West Point plant yielded an estimated cancer risk that waswell below the generally accepted cancer risk of one in one million.
A second-tier analysis is an optional procedure to use after TBACT, and uses a healthimpact assessment instead of ASIL. Following EPA approved methods, risks could bemore accurately characterized by using updated EPA unit risk factors, inhalationreference concentrations, or other EPA-recognized approved methods. A second-tieranalysis includes a discussion of the demographics pertinent to assessing the public healthrisk, a brief review of the toxicological literature regarding chloroform, characterizationof existing emissions and exposure pathways, and a quantitative estimate of the cancerrisk to potentially exposed individuals.
The tables below present the maximum predicted concentration of each TAP in theambient air in micrograms per cubic meter (ug/m3) at or beyond the fence line of thetreatment plant. The tables also present the ASIL for comparison. The maximumpredicted concentration is from the combined onsite and Paine Field data set, as describedin Section 3 in the subsection titled Meteorological Data.
Route 9The results of the dispersion modeling for the 54-mgd treatment plant at Route 9, shownin Table 34, indicate that a treatment plant at the Route 9 site would not exceed the ASILfor any of the pollutants modeled except chloroform.
TABLE 34Dispersion Modeling Results for a 54-mgd Treatment Plant at Route 9 Site
PollutantASIL
(µg/m3) Averaging PeriodMaximum Predicted
Concentration (µg/m3)
Acetaldehyde 0.45 Annual 0.003
Acrolein 0.02 24 hour 0.002
Arsenic 0.00023 Annual 0.00003
Benzene 0.12 Annual 0.05
Cadmium 0.00056 Annual 0.0002
Chloroform 0.043 Annual 0.32
Chromium 1.7 24 hour 0.0009
Ethylene dibromide 0.0045 Annual 0.0015
Formaldehyde 0.077 Annual 0.04
Methylene Chloride 0.56 Annual 0.09
Methyl chloroform(1,1,1 Trichloroethane)
6400 24 hour 2.12
Nitric Oxide 100 24 hour 29.92
Total TAP PAH 0.00048 Annual 0.00013

APPENDIX 5-A: ODOR AND AIR QUALITY: TREATMENT PLANT
October 2003 76
TABLE 34Dispersion Modeling Results for a 54-mgd Treatment Plant at Route 9 Site
PollutantASIL
(µg/m3) Averaging PeriodMaximum Predicted
Concentration (µg/m3)
Tetrachloroethylene(perchloroethylene)
1.1 Annual 0.65
Trichloroethylene 0.59 Annual 0.06
Xylene 1500 24 hour 2.19
Lead 0.5 24 hour 0.0003
PAH = polycyclic aromatic hydrocarbonµg/m3 = microgram per cubic meter
Unocal54-mgd Plant. The results of the dispersion modeling for the 54-mgd treatment plant,shown in Table 35, indicate that a treatment plant at the Unocal site would not exceed theASIL for any of the pollutants modeled except chloroform.
TABLE 35Dispersion Modeling Results for a 54-mgd Treatment Plant at Unocal Site
PollutantASIL
(µg/m3) Averaging PeriodMaximum Predicted
Concentration (µg/m3)
Acetaldehyde 0.45 Annual 0.00008
Acrolein 0.02 24 hour 0.001
Arsenic 0.00023 Annual 0.00001
Benzene 0.12 Annual 0.03
Cadmium 0.00056 Annual 0.00007
Chloroform 0.043 Annual 0.29
Chromium 1.7 24 hour 0.001
Ethylene dibromide 0.0045 Annual 0.001
Formaldehyde 0.077 Annual 0.01
Methylene Chloride 0.56 Annual 0.06
Methyl chloroform(1,1,1 Trichloroethane)
6400 24 hour 4.48
Nitric Oxide 100 24 hour 37.75
Total TAP PAH 0.00048 Annual 0.00003
Tetrachloroethylene(perchloroethylene)
1.1 Annual 0.43

APPENDIX 5-A: ODOR AND AIR QUALITY: TREATMENT PLANT
October 2003 77
TABLE 35Dispersion Modeling Results for a 54-mgd Treatment Plant at Unocal Site
PollutantASIL
(µg/m3) Averaging PeriodMaximum Predicted
Concentration (µg/m3)
Trichloroethylene 0.59 Annual 0.041
Xylene 1500 24 hour 3.93
Lead 0.5 24 hour 0.0004
PAH = polycyclic aromatic hydrocarbonµg/m3 = microgram per cubic meter
54-mgd Treatment Plant with Structural Lid Sub-AlternativeDispersion modeling was also conducted for the Unocal Structural Lid sub-alternative.The results are summarized in Table 36.
The results of the dispersion modeling for a 54-mgd treatment plant with a lid over aportion of the plant demonstrated that all the compounds except chloroform are predictedto have ambient impacts less than the ASIL.
TABLE 36Dispersion Modeling Results for a 54-mgd Treatment Plant at Unocal Site with Structural Lid
PollutantASIL
(µg/m3) Averaging PeriodMaximum Predicted
Concentration (µg/m3)
Acetaldehyde 0.45 Annual 0.0006
Acrolein 0.02 24 hour 0.0010
Arsenic 0.00023 Annual 0.00001
Benzene 0.12 Annual 0.04
Cadmium 0.00056 Annual 0.00007
Chloroform 0.043 Annual 0.36
Chromium 1.7 24 hour 0.001
Ethylene dibromide 0.0045 Annual 0.001
Formaldehyde 0.077 Annual 0.01
Methylene Chloride 0.56 Annual 0.08
Methyl chloroform(1,1,1 Trichloroethane)
6400 24 hour 7.85
Nitric Oxide 100 24 hour 37.75
Total TAP PAH 0.00048 Annual 0.00003
Tetrachloroethylene(perchloroethylene)
1.1 Annual 0.52
Trichloroethylene 0.59 Annual 0.05

APPENDIX 5-A: ODOR AND AIR QUALITY: TREATMENT PLANT
October 2003 78
TABLE 36Dispersion Modeling Results for a 54-mgd Treatment Plant at Unocal Site with Structural Lid
PollutantASIL
(µg/m3) Averaging PeriodMaximum Predicted
Concentration (µg/m3)
Xylene 1500 24 hour 6.91
Lead 0.5 24 hour 0.0004
PAH = polycyclic aromatic hydrocarbonµg/m3 = microgram per cubic meter
72-mgd Treatment PlantThe results of the dispersion modeling indicate that predicted concentrations from a72-mgd treatment plant at the Unocal site do not exceed the ASIL for all compoundsexcept chloroform. Results are summarized in Table 37.
TABLE 37Dispersion Modeling Results for a 72-mgd Treatment Plant at Unocal Site
PollutantASIL
(µg/m3) Averaging PeriodMaximum Predicted
Concentration (µg/m3)
Acetaldehyde 0.45 Annual 0.0007
Acrolein 0.02 24 hour 0.0009
Arsenic 0.00023 Annual 0.00002
Benzene 0.12 Annual 0.04
Cadmium 0.00056 Annual 0.00009
Chloroform 0.043 Annual 0.39
Chromium 1.7 24 hour 0.001
Ethylene dibromide 0.0045 Annual 0.001
Formaldehyde 0.077 Annual 0.01
Methylene Chloride 0.56 Annual 0.09
Methyl chloroform(1,1,1 Trichloroethane)
6400 24 hour 5.97
Nitric Oxide 100 24 hour 48.28
Total TAP PAH 0.00048 Annual 0.00004
Tetrachloroethylene(perchloroethylene)
1.1 Annual 0.59
Trichloroethylene 0.59 Annual 0.06
Xylene 1500 24 hour 4.87
Lead 0.5 24 hour 0.0005
PAH = polycyclic aromatic hydrocarbonµg/m3 = microgram per cubic meter

APPENDIX 5-A: ODOR AND AIR QUALITY: TREATMENT PLANT
October 2003 79
72-mgd Treatment Plant with a Structural LidThe results of the dispersion modeling indicate that predicted concentrations from a 72-mgd treatment plant at the Unocal site with a structural lid do not exceed the ASIL for allcompounds except chloroform. Results are summarized in Table 38.
TABLE 38Dispersion Modeling Results for a 72-mgd Treatment Plant at Unocal Site with Structural Lid
PollutantASIL
(µg/m3) Averaging PeriodMaximum Predicted
Concentration (µg/m3)
Acetaldehyde 0.45 Annual 0.0007
Acrolein 0.02 24 hour 0.0009
Arsenic 0.00023 Annual 0.00002
Benzene 0.12 Annual 0.05
Cadmium 0.00056 Annual 0.00009
Chloroform 0.043 Annual 0.47
Chromium 1.7 24 hour 0.001
Ethylene dibromide 0.0045 Annual 0.002
Formaldehyde 0.077 Annual 0.01
Methylene Chloride 0.56 Annual 0.1
Methyl chloroform (1,1,1Trichloroethane)
6400 24 hour 7.89
Nitric Oxide 100 24 hour 48.28
Total TAP PAH 0.00048 Annual 0.00004
Tetrachloroethylene(perchloroethylene)
1.1 Annual 0.71
Trichloroethylene 0.59 Annual 0.07
Xylene 1500 24 hour 6.42
Lead 0.5 24 hour 0.0005
PAH = polycyclic aromatic hydrocarbonµg/m3 = microgram per cubic meter

APPENDIX 5-A: ODOR AND AIR QUALITY: TREATMENT PLANT
October 2003 80
REFERENCES
AMSA. 1993. POTW Air Emissions Meeting Materials. Washington D.C. December.
Bay Area Air Toxics Group. 1992. BASTE User’s Manual, Version 3.0.
Brown and Caldwell. 2003. Meteorological Monitoring and Quality Assurance Plan-Brightwater Wastewater Treatment Facility Site Assessments. January.
CH2M HILL. 1992. Second-Tier Analysis for Chloroform Emissions from the Metro-West Point Sewage Treatment Plant. March 30, 1992.
CH2M HILL. 2002. Predesign Report for Task 1.04 - Odor Prevention TechnologyReview and Impact Analysis (Tab 1), Brightwater Treatment Plant. December.
Diosey, Phyllis G., Maureen E. Hess, and Larraine Farrell. 2002. Evaluation ofAlternative Dispersion Models for Use in Odor Management. WEFTEC 2002 75thAnnual Technical Exhibition and Conference, Conference Proceedings. Alexandria, VA:WEF.
Emergency Planning & Community Right-to-Know Act, Right to Know. 40 CFR 355,370, and 372.
Environmental Protection Agency (EPA). Guideline on Air Quality Modeling. GAQM,40 CFR 51, Appendix W.
Environmental Protection Agency (EPA). 1995. User’s Guide for the Industrial SourceComplex (ISC3) Dispersion Models. EPA-454/B-95-003a. September.
Environmental Protection Agency (EPA). 2000. Meteorological Monitoring Guidance forRegulatory Modeling Applications. EPA-454/R-99-005. February.
Hazardous Air Pollutants. 40 CFR 63. http://www.epa.gov/ttn/atw/188polls.html
Kennedy/Jenks Consultants. 2003. Notice of Construction, South Wastewater TreatmentPlant Cogeneration Facility. April.
Maul, Foster, and Algoni. 2002. Draft Lower Yard Interim Action, As-Built Report,Unocal Edmonds Terminal.
McEwen, Dave. 2002. CH2M HILL, personal correspondence regarding odor thresholdsfrom St. Croix Laboratories for Sacramento Regional Sanitation District. December 10,2002.
National Ambient Air Quality Standards. http://www.epa.gov/airs/criteria.html
NESHAP Regulations: For Publicly Owned Treatment Works (POTW). 40 CFR 63subpart VVV; proposed rule NESHAPS for boilers, stationary reciprocating internalcombustion engines, and stationary turbines. 40 CFR Part 63.
MACT for POTWs. 40 CFR Part 261. Revision of Wastewater Treatment Exemptions forHazardous Waste Mixtures (“Headworks Exemptions”).

APPENDIX 5-A: ODOR AND AIR QUALITY: TREATMENT PLANT
October 2003 81
Montgomery (James M.) Consulting Engineers, Inc. 1990. PEEP Joint Powers Agenciesfor Pooled Emission Estimation Program, Final Report for Publicly Owned TreatmentWorks (POTWs). December.
Water Environment Federation (WEF). 1995. Odor Prevention in Wastewater TreatmentPlants. WEF Manual of Practice 22.
Puget Sound Clean Air Agency. Puget Sound Clean Air Reg 1, Article 9.11 (a), RCW70.94, WAC 173-40-040 – Odor Regulations.
Puget Sound Clean Air Agency. Puget Sound Clean Air Reg 1 Article 6, New SourceReview.
Puget Sound Clean Air Agency. Puget Sound Clean Air Reg 1, Article 7, RCW 70.94;WAC 173-40 – Air Operating Permit.
Puget Sound Clean Air Agency. Puget Sound Clean Air Reg 1, Article 9, ConstructionEmissions.
Risk Management Plans. 40 CFR 68.
Tata, Prakasam et al. Prediction of Volatile Organic Compound Emissions from PubliclyOwned Treatment Works.
Toxic Air Pollutants. WAC173-460-150.
Wang, Jie and Kenneth J. Skipka. 1993. Dispersion Modeling of Odorous Emissions.RTP Environmental Associates. June 13, 1993.

������������
������������ ������������
����
����
��� ���
��
��
���
���
���
���� ����� ����
! ��"��
�"�# $ ��"��
%"�� $ �"�#
&"&� $ %"��
�"�� $ &"&�
�"%� $ �"��
'�(��)���((����
����)��$���$��(
����������������������� ����������������� �������
���
������
�����)
����������
����
�!
������*�"%��(��
��"�#
�+,"��������
�"�$� �!
'�((���
��-'��������"����������
��%������&'��(����)%� *
����������� ����������������������������������� ��������������� ���
��������
��������������� ����������������
�������� ������� ��������������������������������� �!������"����������"��������������#��������������$%&'��(��(%)(�*((�((' �+) ,�����,+���-�������.�����������������,�/����������#��� �������.�(0�(0(��.���
1�2���������!3������������#�����,��������������� �� ���������������
�����������
4567�+����65 3+��+ ��+�����+�/�3�� 8 ��/

������������
���������������� ��������������������
����
����
��� ���
��
���
���
���
���
��������� ��� !
" ��#��
�#�$ % ��#��
&#�� % �#�$
�#�� % &#��
�#�� % �#��
�#&� % �#��
'�(��)���((����
����)��%���%��(
���� �������������� �������
���
��������
�����)
������ ���
����
!��
������*�#&��(��
�"#�$
�+,#��������
�"�#�!��
'�((���
��-'��������#����������
%��������&'�(����)��!*
����������� ����������������������������������� ��������������� ���
��������
����������������� ����������������� ������ ��������������������������������� �!������"����������"��������������#������������$%&'(��)��)&*)��))�))( �+* ,�����,�+��-�������.������������(�/����������#��� �������.�$)0�)0)��.���
1�2���������!3������������#�����,��������������������������������
�����������
4567�+����65 3+��+ ��+�����+�/�3�� 8 ��/

��������
��������������� ��������������������
����
����
��� ���
��
��
���
���
���
��������� ����
!��"��
�"�# $��"��
%"�� $�"�#
&"&� $%"��
�"�� $&"&�
�"%� $�"��
'�(��)(����
����)��$���$
���� ��������������������
���
��������
�����)
����� ��������
���
������*�"%�
�!�"#�+,"�����
�!�"����
'�((���
��-'���������������
$��������%&��'����(���)
� �
��������
�������������� ������ ���������������� ����������������������������������� ������!����������!��������������"��� �������#$%&'��(��(%)(�*((�(('��+) ,�����,�+��-�������.�������/��"���0����������"�����������.�#(1�(1(��.���
2�3��������� 4������������"�����,������������������� � � ��
� ��������
��������������������������������������������������������������������
5678�+����76 4+��+���+�����+�0�4���9���0

�������������� ������ ������������������������������� � � ��
� ��������� ���������������������� ������������� !" !"�#$"%�"" ""�&'(#)�����(*�+ ��*�,-.*/�������.�0&�1����*�-�"2 �2" -�02/�2�0
.*/ ���
������������������� ������ �������������� ���������
3��4�5$(5'��'4�)�(�$(&5'$(5'�5�'(5�'�5&6&5'�
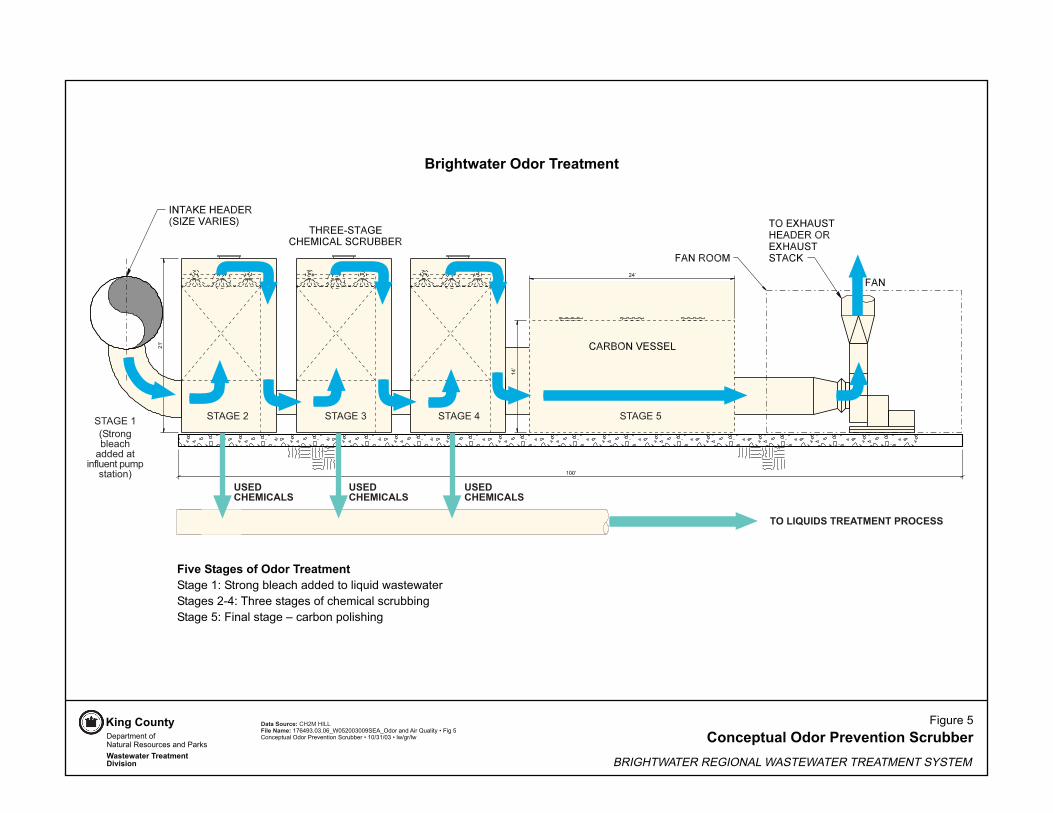
�������������� ������ ������������������������������� � � ��
� ��������� ���������������������� ������������� !" !"�#$"%�"" ""�&'(#)�����(*�+ ��*�,-.*/%������ ��)�����0���*�&�� 11��-�"2 �2" -�32/�2�3
.*/ ��%
����������������������� �����������
� �!�������������������
� �����������"�������������&��/��4&���/1����5�������*6 *�3����3����&��/���7�485������/����5��*������ 11*�/&��/�%4.*������/�9���1���*�5*�/
#�$��%$&'�()�
#�$��%$&'�()�
#�$��%$&'�()�
��)'*#'���+$(&$���+��$��
&8(:'�;&���/1����5�������
*��� ���� ������*�<
&8(:'� &8(:' &8(:'� &8(:'%
=��:�8$(8'��':�)�(�$(&8'$(8'�8�'(8�'�8&>&8'�

�
�����������
���
���������
���
���������������
�
���
�
���
�
���
�
�������������� � � ��� ���
�������������������������� ����� ���� �������
� ���!�����������������������
������ ����� ��������
�����"�#$ %���"&&'($ �))�����"&&)($
���� %��
�))����
��������
������������ � ������� ������������������ ��� �������
��� ������������� � !"���#��������� � � ��������������
��������� $��� ��%�� &�� $��������������������������������� ������!��"�#$�%�������&'���(� ��)�*�#�+#�� �,-��(-�"��.��#����%���/��/���%�"0*�'��#&� #��)
1�#���"�.�(���+�(�� ��2��3('��� (�� ��� ��� ��������
)������*
4. 5,��,�.�.�5 �1������,���,�.�,.��,��1,��6�,��

�
����������
���
���������
���
���������������
�
���
�
���
�
���
�
����������� ������������ � ��� ���
�������������� ������ ���� ��� �������
� ��!����������� ������ ������ ������ �������"
�����#�$�% &���#��'(% ��������#���(%
����
&��
�������
��������
������������ � ������� ������������������ ��� �������
��� ��������������� !���"��������� � � ��������������
��������� #��� ��$�� %�� #��������������������������������� ������!��"�#$�%�������&'���(� ��)�*�#�+#�� �,-��(-�"��. �+�"�%���/��/���%�"0*�'��#&� #��)
1�#���"�2�(���+�(�� ��3��4(&��� '�� ��� ��� ��������
(������)
52 6,��,�2�2�6 �1������,���,�2�,2��,��1,��7�,��

APPENDIX 5-A: ODOR AND AIR QUALITY: TREATMENT PLANT
October 2003
ATTACHMENTS
• A – Hazardous Air Pollutants• B – Toxic Air Pollutants• C – Substances Requiring Risk Management Plans• D – Influent Concentrations used in Air Toxics Emission Modeling• E – Combustion Source Parameters• F – Liquids and Solids Source Parameters• G – Acronyms and Abbreviations

APPENDIX 5-A: ODOR AND AIR QUALITY: TREATMENT PLANT
October 2003
ATTACHMENT A – Hazardous Air Pollutants

APPENDIX 5-A: ODOR AND AIR QUALITY: TREATMENT PLANT
October 2003 A-1
ATTACHMENT A – Hazardous Air Pollutants
http://www.epa.gov/ttn/atw/188polls.html
CASNumber
ChemicalName
75070 Acetaldehyde60355 Acetamide75058 Acetonitrile98862 Acetophenone53963 2-Acetylaminofluorene107028 Acrolein79061 Acrylamide79107 Acrylic acid107131 Acrylonitrile107051 Allyl chloride92671 4-Aminobiphenyl62533 Aniline90040 o-Anisidine1332214 Asbestos71432 Benzene (including benzene from gasoline)92875 Benzidine98077 Benzotrichloride100447 Benzyl chloride92524 Biphenyl117817 Bis(2-ethylhexyl)phthalate (DEHP)542881 Bis(chloromethyl)ether75252 Bromoform106990 1,3-Butadiene156627 Calcium cyanamide105602 Caprolactam (See Modification)133062 Captan63252 Carbaryl75150 Carbon disulfide56235 Carbon tetrachloride463581 Carbonyl sulfide120809 Catechol133904 Chloramben57749 Chlordane7782505 Chlorine79118 Chloroacetic acid532274 2-Chloroacetophenone108907 Chlorobenzene510156 Chlorobenzilate67663 Chloroform107302 Chloromethyl methyl ether126998 Chloroprene1319773 Cresols/Cresylic acid (isomers and mixture)95487 o-Cresol108394 m-Cresol106445 p-Cresol98828 Cumene94757 2,4-D, salts and esters3547044 DDE334883 Diazomethane132649 Dibenzofurans96128 1,2-Dibromo-3-chloropropane84742 Dibutylphthalate106467 1,4-Dichlorobenzene(p)91941 3,3-Dichlorobenzidene111444 Dichloroethyl ether (Bis(2-chloroethyl)ether)
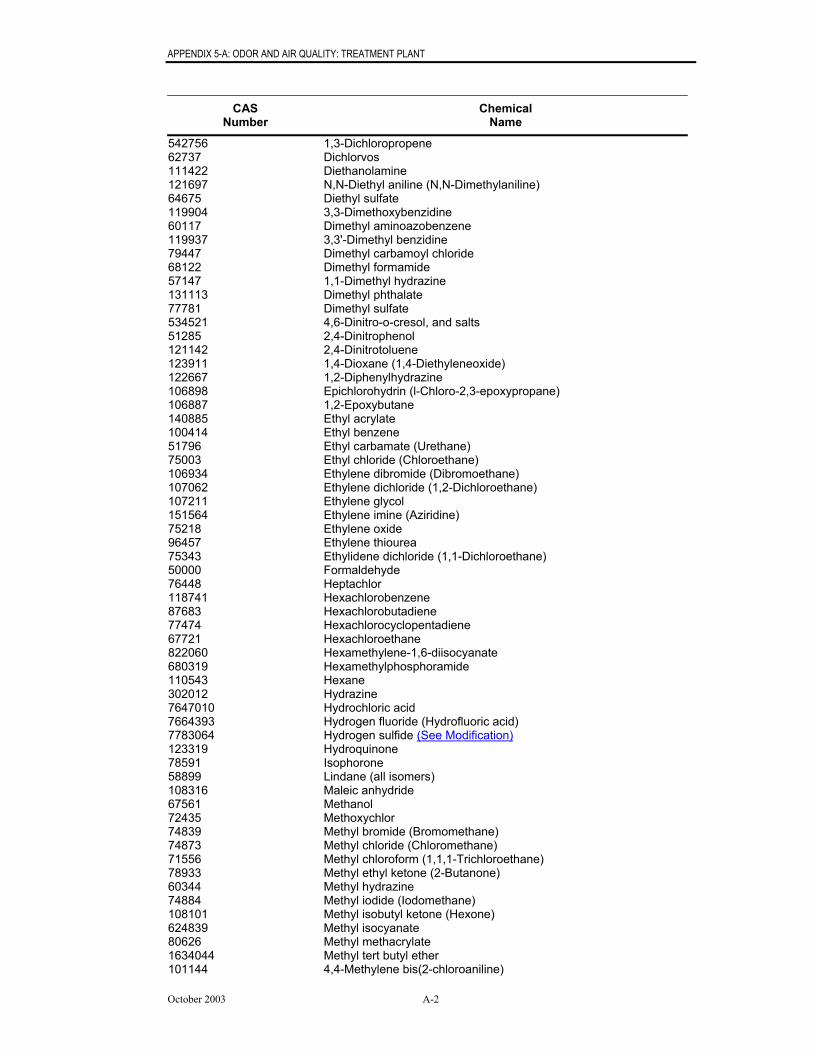
APPENDIX 5-A: ODOR AND AIR QUALITY: TREATMENT PLANT
October 2003 A-2
CASNumber
ChemicalName
542756 1,3-Dichloropropene62737 Dichlorvos111422 Diethanolamine121697 N,N-Diethyl aniline (N,N-Dimethylaniline)64675 Diethyl sulfate119904 3,3-Dimethoxybenzidine60117 Dimethyl aminoazobenzene119937 3,3'-Dimethyl benzidine79447 Dimethyl carbamoyl chloride68122 Dimethyl formamide57147 1,1-Dimethyl hydrazine131113 Dimethyl phthalate77781 Dimethyl sulfate534521 4,6-Dinitro-o-cresol, and salts51285 2,4-Dinitrophenol121142 2,4-Dinitrotoluene123911 1,4-Dioxane (1,4-Diethyleneoxide)122667 1,2-Diphenylhydrazine106898 Epichlorohydrin (l-Chloro-2,3-epoxypropane)106887 1,2-Epoxybutane140885 Ethyl acrylate100414 Ethyl benzene51796 Ethyl carbamate (Urethane)75003 Ethyl chloride (Chloroethane)106934 Ethylene dibromide (Dibromoethane)107062 Ethylene dichloride (1,2-Dichloroethane)107211 Ethylene glycol151564 Ethylene imine (Aziridine)75218 Ethylene oxide96457 Ethylene thiourea75343 Ethylidene dichloride (1,1-Dichloroethane)50000 Formaldehyde76448 Heptachlor118741 Hexachlorobenzene87683 Hexachlorobutadiene77474 Hexachlorocyclopentadiene67721 Hexachloroethane822060 Hexamethylene-1,6-diisocyanate680319 Hexamethylphosphoramide110543 Hexane302012 Hydrazine7647010 Hydrochloric acid7664393 Hydrogen fluoride (Hydrofluoric acid)7783064 Hydrogen sulfide (See Modification)123319 Hydroquinone78591 Isophorone58899 Lindane (all isomers)108316 Maleic anhydride67561 Methanol72435 Methoxychlor74839 Methyl bromide (Bromomethane)74873 Methyl chloride (Chloromethane)71556 Methyl chloroform (1,1,1-Trichloroethane)78933 Methyl ethyl ketone (2-Butanone)60344 Methyl hydrazine74884 Methyl iodide (Iodomethane)108101 Methyl isobutyl ketone (Hexone)624839 Methyl isocyanate80626 Methyl methacrylate1634044 Methyl tert butyl ether101144 4,4-Methylene bis(2-chloroaniline)

APPENDIX 5-A: ODOR AND AIR QUALITY: TREATMENT PLANT
October 2003 A-3
CASNumber
ChemicalName
75092 Methylene chloride (Dichloromethane)101688 Methylene diphenyl diisocyanate (MDI)101779 4,4¬-Methylenedianiline91203 Naphthalene98953 Nitrobenzene92933 4-Nitrobiphenyl100027 4-Nitrophenol79469 2-Nitropropane684935 N-Nitroso-N-methylurea62759 N-Nitrosodimethylamine59892 N-Nitrosomorpholine56382 Parathion82688 Pentachloronitrobenzene (Quintobenzene)87865 Pentachlorophenol108952 Phenol106503 p-Phenylenediamine75445 Phosgene7803512 Phosphine7723140 Phosphorus85449 Phthalic anhydride1336363 Polychlorinated biphenyls (Aroclors)1120714 1,3-Propane sultone57578 beta-Propiolactone123386 Propionaldehyde114261 Propoxur (Baygon)78875 Propylene dichloride (1,2-Dichloropropane)75569 Propylene oxide75558 1,2-Propylenimine (2-Methyl aziridine)91225 Quinoline106514 Quinone100425 Styrene96093 Styrene oxide1746016 2,3,7,8-Tetrachlorodibenzo-p-dioxin79345 1,1,2,2-Tetrachloroethane127184 Tetrachloroethylene (Perchloroethylene)7550450 Titanium tetrachloride108883 Toluene95807 2,4-Toluene diamine584849 2,4-Toluene diisocyanate95534 o-Toluidine8001352 Toxaphene (chlorinated camphene)120821 1,2,4-Trichlorobenzene79005 1,1,2-Trichloroethane79016 Trichloroethylene95954 2,4,5-Trichlorophenol88062 2,4,6-Trichlorophenol121448 Triethylamine1582098 Trifluralin540841 2,2,4-Trimethylpentane108054 Vinyl acetate593602 Vinyl bromide75014 Vinyl chloride75354 Vinylidene chloride (1,1-Dichloroethylene)1330207 Xylenes (isomers and mixture)95476 o-Xylenes108383 m-Xylenes106423 p-Xylenes0 Antimony Compounds0 Arsenic Compounds (inorganic including arsine)0 Beryllium Compounds0 Cadmium Compounds

APPENDIX 5-A: ODOR AND AIR QUALITY: TREATMENT PLANT
October 2003 A-4
CASNumber
ChemicalName
0 Chromium Compounds0 Cobalt Compounds0 Coke Oven Emissions0 Cyanide Compoundsa
0 Glycol ethersb
0 Lead Compounds0 Manganese Compounds0 Mercury Compounds0 Fine mineral fibersc
0 Nickel Compounds0 Polycylic Organic Matterd
0 Radionuclides (including radon)e
0 Selenium Compounds
NOTE: For all listings above that contain the word “compounds,” and for glycol ethers, the followingapplies: Unless otherwise specified, these listings are defined as including any unique chemicalsubstance that contains the named chemical (i.e., antimony, arsenic, etc.) as part of that chemical'sinfrastructure.a X'CN where X = H' or any other group where a formal dissociation may occur. For example, KCNor Ca(CN)2.b Includes mono- and di- ethers of ethylene glycol, diethylene glycol, and triethylene glycol R-(OCH2CH2)n -OR' wheren = 1, 2, or 3R = alkyl or aryl groupsR' = R, H, or groups which, when removed, yield glycol ethers with the structure: R-(OCH2CH)n-OH. Polymers are excluded from the glycol category.c Includes mineral fiber emissions from facilities manufacturing or processing glass, rock, or slagfibers (or other mineral derived fibers) of average diameter 1 micron or less.d Includes organic compounds with more than one benzene ring, and that have a boiling pointgreater than or equal to 100 °C.e A type of atom that spontaneously undergoes radioactive decay.

APPENDIX 5-A: ODOR AND AIR QUALITY: TREATMENT PLANT
October 2003
ATTACHMENT B – Toxic Air Pollutants

APPENDIX 5-A: ODOR AND AIR QUALITY: TREATMENT PLANT
October 2003 B-1
ATTACHMENT B – Toxic Air PollutantsWAC 173-460-150 Class A toxic air pollutants: Known, probable, and potentialhuman carcinogens and acceptable source impact levels.
http://search.leg.wa.gov/wslwac/WAC%20173%20%20TITLE/WAC%20173%20-460%20%20CHAPTER/WAC%20173%20-460%20-150.htm
(1) TABLE ICLASS A TOXIC AIR POLLUTANTSKnown and Probable Carcinogens
CAS # SUBSTANCE
75-07-0 Acetaldehyde53-96-3 2-Acetylaminofluorene79-06-1 Acrylamide107-13-1 Acrylonitrile309-00-2 Aldrin––– Aluminum smelter polyaromatic hydrocarbon emissions117-79-3 2-Aminoanthraquinone97-56-3 o-Aminoazotoluene92-67-1 4-Aminobiphenyl61-82-5 Amitrole62-53-3 Aniline90-04-0 o-AnisidineC7440-38-2 Arsenic and inorganic arsenic compounds1332-21-4 Asbestos2465-27-2 Auramine (technical grade)71-43-2 Benzene92-87-5 Benzidine and its salts56-55-3 Benzo(a)anthracene50-32-8 Benzo(a)pyrene205-99-2 Benzo(b)fluoranthene205-82-3 Benzo(j)fluoranthene207-08-9 Benzo(k)fluoranthene1694-09-3 Benzyl violet 4b7440-41-7 Beryllium and compounds111-44-4 Bis(2-chloroethyl)ether117-81-7 Bis(2-ethylhexyl)phthalate (DEHP)542-88-1 Bis(chloromethyl)ether75-25-2 Bromoform106-99-0 1,3-Butadiene3068-88-0 B-Butyrolactone7440-43-9 Cadmium and compounds56-23-5 Carbon tetrachloride57-74-9 Chlordane510-15-6 Chlorobenzilate67-66-3 Chloroform107-30-2 Chloromethyl methyl ether (technical-grade)108-43-0 Chlorophenols126-99-8 ChloropreneC7440-47-3 Chromium, hexavalent metal and compounds––– Coke oven emissions8001-58-9 Creosote135-20-6 Cupferron94-75-7 2,4-D and esters3547-04-4 DDE (p,p'-Dichlorodiphenyldichloroethylene)50-29-3 DDT (1,1,1 Trichloro-2,2-Bis(p-chlorophenyl)-ethane)613-35-4 N,N-Diacetylbenzidine101-80-4 4,4'-Diaminodiphenyl ether

APPENDIX 5-A: ODOR AND AIR QUALITY: TREATMENT PLANT
October 2003 B-2
CAS # SUBSTANCE226-36-8 Dibenz(a,h)acridine53-70-3 Dibenz(a,h)anthracene224-42-0 Dibenz(a,j)acridine132-64-9 Dibenzofurans189-64-0 Dibenzo(a,h)pyrene191-30-0 Dibenzo(a,l)pyrene189-55-9 1,2,7,8-Dibenzopyrene (dibenzo(a,i)pyrene)192-65-4 Dibenzo(a,e)pyrene764-41-0 1,4-Dichloro-2-butene28434-86-8 3,3'-Dichloro-4,4'-diaminodiphenyl ether106-46-7 1,4-Dichlorobenzene91-94-1 3,3'-Dichlorobenzidine107-06-2 1,2-Dichloroethane (ethylene chloride)75-09-2 Dichloromethane (methylene chloride)696-28-6 Dichlorophenylarsine (arsenic group)78-87-5 1,2-Dichloropropane60-57-1 Dieldrin1615-80-1 1,2-Diethylhydrazine101-90-6 Diglycidyl resorcinol ether119-90-4 3,3'-Dimethoxybenzidine (ortol-dianisidine)119-93-7 3,3-Dimethyl benzidine77-78-1 Dimethyl sulfate540-73-8 1,2-Dimethylhydrazine123-91-1 1,4-Dioxane––– Dioxins and furans122-66-7 1,2-Diphenylhydrazine106-89-8 Epichlorohydrin106-93-4 Ethylene dibromide (dibromethane)75-21-8 Ethylene oxide96-45-7 Ethylene thiourea50-00-0 Formaldehyde67-45-8 Furazolidone
Furium (nitrofuran group)765-34-4 Glyciadaldehyde76-44-8 Heptachlor118-74-1 Hexachlorobenzene319-84-6 Hexachlorocyclohexane (Lindane) Alpha BHC319-85-7 Hexachlorocyclohexane (Lindane) Beta BHC58-89-9 Hexachlorocyclohexane (Lindane) Gamma BHC680-31-9 Hexamethylphosphoramide302-01-2 Hydrazine193-39-5 Indeno(1,2,3-cd)pyrene––– Isopropyl oils––– Lead compounds301-04-2 Lead acetate7446-27-7 Lead phosphate129-15-7 2-Methyl-1-nitroanthraquinone592-62-1 Methyl azoxymethyl acetate3697-24-3 5-Methylchrysene101-14-4 4,4'-Methylenebis(2-chloroaniline) (MBOCA)838-88-0 4,4'-Methylenebis(2-methylaniline)101-77-9 4,4-Methylene dianiline13552-44-8 4,4-Methylenedianiline dihydrochloride64091-91-4 4-(Methylnitrosamino)-1-(3-pyridyl)-1-butanone2385-85-5 Mirex139-91-3 5-(Morpholinomethyl)-3-amino)-
2-oxazolidinone (furaltudone)134-32-7 1-NapthylamineC7440-02-0 Nickel and compounds (as nickel subsulfide or nickel
refinery dust)531-82-8 N-(4-(5-Nitro-2-furyl)-2-thiazolyl)acetamide602-87-9 5-Nitroacenaphthene

APPENDIX 5-A: ODOR AND AIR QUALITY: TREATMENT PLANT
October 2003 B-3
CAS # SUBSTANCE1836-75-5 Nitrofen
Nitrofurans59-87-0 Nitrofurazone555-84-9 1-(5-Nitrofurfurylidene)amino)-2-imidazolidinone126-85-2 Nitrogen mustard N-oxide302-70-5 Nitrogen mustard N-oxide hydrochloride79-46-9 2-Nitropropane924-16-3 N-Nitrosodi-n-butylamine759-73-9 N-Nitroso-N-ethylurea (NEU)615-53-2 N-Nitroso-N-methylurethane621-64-1 N-Nitrosodi-n-propylamine10595-95-6 N-Nitrosomethylethylamine59-89-2 N-Nitrosomorpholine86-30-6 N-Nitrosodiphenylamine55-18-5 N-Nitrosodiethylamine (diethylnitrosoamine) (DEN)62-75-9 N-Nitrosodimethylamine2646-17-5 Oil orange SS794-93-4 Panfuran S (dihydroxymethylfuratrizine)87-86-5 Pentachlorophenol127-18-4 Perchloroethylene (tetrachloroethylene)63-92-3 Phenoxybenzamine hydrochloride
N-Phenyl-2-napthylamine––– Polyaromatic hydrocarbons (PAH)1336-36-3 Polychlorinated biphenyls (PCBs)3761-53-3 Ponceau MX
P(p)(alpha, alpha, alpha)-Tetra-chlorotoluene1120-71-4 1,3-Propane sultone75-56-9 Propylene oxide1746-01-6 2,3,7,8-Tetrachlorodibenzo-p-dioxin (2,3,7,8-TCDD)139-65-1 4,4'-Thiodianiline1314-20-1 Thorium dioxide95-80-7 2,4-Toluene diamine584-84-9 2,4-Toluene diisocyanate95-53-4 o-Toluidine636-21-5 o-Toluidine hydrochloride8001-35-2 Toxaphene55738-54-0 Trans-2((Dimethylamino)methylimino)-5-
(2-(5-nitro-2-furyl) vinyl-1,3,4-oxadiazole79-01-6 Trichloroethylene
88-06-2 2,4,6-Trichlorophenol75-01-4 Vinyl chloride

APPENDIX 5-A: ODOR AND AIR QUALITY: TREATMENT PLANT
October 2003 B-4
(2) TABLE IICLASS A TOXIC AIR POLLUTANTS
WITH ESTABLISHEDACCEPTABLE SOURCE IMPACT LEVELS
CAS # SUBSTANCE
10-6 RISKASIL MICRO-GRAMS/M3
ANNUALAVERAGE
75-07-0 Acetaldehyde 0.450000079-06-1 Acrylamide 0.0007700107-13-1 Acrylonitrile 0.0150000309-00-2 Aldrin 0.000200062-53-3 Aniline 6.3000000C7440-38-2 Arsenic and inorganic arsenic compounds 0.00023001332-21-4 Asbestos (Note: fibers/ml) 0.000004471-43-2 Benzene 0.120000092-87-5 Benzidine and its salts 0.000015050-32-8 Benzo(a)pyrene 0.00048007440-41-7 Beryllium and compounds 0.0004200111-44-4 Bis(2-chloroethyl)ether 0.0030000117-81-7 Bis(2-ethylhexyl)phthalate (DEHP) 2.5000000542-88-1 Bis(chloromethyl)ether 0.000016075-25-2 Bromoform 0.9100000106-99-0 1,3-Butadiene 0.00360007440-43-9 Cadmium and compounds 0.000560056-23-5 Carbon tetrachloride 0.067000057-74-9 Chlordane 0.0027000510-15-6 Chlorobenzilate 0.200000067-66-3 Chloroform 0.0430000108-43-0 Chlorophenols 0.1800000C7440-47-3 Chromium, hexavalent metal and compounds 0.0000830––– Coke oven emissions 0.00160003547-04-4 DDE (p,p'-dichlorodiphenyldichloroethylene) 0.100000050-29-3 DDT (1,1,1 Trichloro-2,2-Bis-
(p-chlorophenyl)-ethane) 0.0100000764-41-0 1,4-Dichloro-2-butene 0.0003800106-46-7 1,4-Dichlorobenzene 1.500000091-94-1 3,3'-Dichlorobenzidine 0.0770000107-06-2 1,2-Dichloroethane (ethylene chloride) 0.038000075-09-2 Dichloromethane (methylene chloride) 0.560000060-57-1 Dieldrin 0.0002200119-93-7 3,3-Dimethyl benzidine 0.0038000123-91-1 1,4-Dioxane 0.0320000122-66-7 1,2-Diphenylhydrazine 0.0045000106-89-8 Epichlorohydrin 0.8300000106-93-4 Ethylene dibromide (dibromethane) 0.004500075-21-8 Ethylene oxide 0.010000096-45-7 Ethylene thiourea 1.000000050-00-0 Formaldehyde 0.077000076-44-8 Heptachlor 0.0007700118-74-1 Hexachlorobenzene 0.002200058-89-9 Hexachlorocyclohexane (Lindane) gamma BHC 0.0026000302-01-2 Hydrazine 0.0002000C7440-02-0 Nickel and compounds (as nickel subsulfide or nickel
refinery dust)0.0021000
924-16-3 N-Nitrosodi-n-butylamine 0.000630055-18-5 N-Nitrosodiethylamine
(diethylnitrosoamine)(DEN) 0.000023062-75-9 N-Nitrosodimethylamine 0.000071079-46-9 2-Nitropropane 0.0003700

APPENDIX 5-A: ODOR AND AIR QUALITY: TREATMENT PLANT
October 2003 B-5
CAS # SUBSTANCE
10-6 RISKASIL MICRO-GRAMS/M3
ANNUALAVERAGE
87-86-5 Pentachlorophenol 0.3300000127-18-4 Perchloroethylene (tetrachloroethylene) 1.10000001336-36-3 Polychlorinated biphenyls (PCB) 0.004500075-56-9 Propylene oxide 0.27000001746-01-6 2,3,7,8-Tetrachlorodibenzo-p-dioxin
(2,3,7,8-TCDD) 0.0000000395-80-7 2,4-Toluene diamine 0.011000095-53-4 o-Toluidine 0.1400000636-21-5 o-Toluidine hydrochloride 0.14000008001-35-2 Toxaphene 0.003100079-01-6 Trichloroethylene 0.590000088-06-2 2,4,6-Trichlorophenol 0.320000075-01-4 Vinyl chloride 0.0120000
(3) TABLE IIICLASS A TOXIC AIR POLLUTANTS
WITH SPECIAL ACCEPTABLE SOURCEIMPACT LEVELS
CAS # SUBSTANCE
ASILMICRO-
GRAMS/M3AVERAGING
TIME
––– Primary aluminum smelter uncontrolled roof ventpolyaromatic hydrocarbon (PAH) emissions (Note:Quantify according to WAC 173-460-050 (4)(d))
0.0013 Annual
61-82-5 Amitrole 0.06 24 hour90-04-0 o-Anisidine 1.7 24 hour126-99-8 &bgr;-Chloroprene 120 24 hour94-75-7 2,4-D and esters 33 24 hour78-87-5 1,2-Dichloropropane 4.0 24 hour77-78-1 Dimethyl sulfate 1.7 24 hour540-73-8 1,2-Dimethylhydrazine 4.0 24 hour319-84-6 Hexachlorocyclohexane (Lindane) alpha BHC
1.7 24 hour319-85-7 Hexachlorocyclohexane (Lindane) beta BHC
1.7 24 hour––– Lead compounds 0.5 24 hour101-14-4 4,4'-Methylenebis
(2-Chloroaniline) (MBOCA)0.7 24 hour
101-77-9 4,4-Methylene dianiline 2.7 24 hour––– Polyaromatic hydrocarbon
(PAH) emissions(Note: Quantify according to WAC 173-460-050(4)(d))
0.00048 Annual
584-84-9 2,4-Toluene diisocyanate 0.12 24 hour
[Statutory Authority: Chapter 70.94 RCW. 94-03-072 (Order 93-19), § 173-460-150, filed 1/14/94,effective 2/14/94. Statutory Authority: RCW 70.94.331. 91-13-079 (Order 90-62), § 173-460-150,filed 6/18/91, effective 9/18/91.]

APPENDIX 5-A: ODOR AND AIR QUALITY: TREATMENT PLANT
October 2003
ATTACHMENT C – Chemicals Requiring Risk Management Plans

APPENDIX 5-A: ODOR AND AIR QUALITY: TREATMENT PLANT
October 2003 C-1
ATTACHMENT C – Chemicals Requiring Risk Management Planshttp://www.access.gpo.gov/nara/cfr/cfrhtml_00/Title_40/40cfr68_00.html
THIS DATA CURRENT AS OF THE FEDERAL REGISTER DATED JUNE 11, 2003
40 CFR - CHAPTER I - PART 68
§ 68.130 List of substances.(a) Regulated toxic and flammable substances under section 112(r) of the Clean Air Actare the substances listed in Tables 1, 2, 3, and 4. Threshold quantities for listed toxic andflammable substances are specified in the tables.(b) The basis for placing toxic and flammable substances on the list of regulatedsubstances is explained in the notes to the list.
Table 1 to § 68.130_List of Regulated Toxic Substances and Threshold Quantities for Accidental Release Prevention [Alphabetical Order_77 Substances]----------------------------------------------------------------- Threshold Chemical name CAS No. quantity Basis for (lbs) listing-----------------------------------------------------------------Acrolein [2-Propenal]... 107-02-8 5,000 bAcrylonitrile [2- 107-13-1 20,000 b Propenenitrile].Acrylyl chloride [2-Propenoyl 814-68-6 5,000 b chloride].Allyl alcohol [2-Propen-l-ol]. 107-18-61 15,000 bAllylamine [2-Propen-l-amine]. 107-11-9 10,000 bAmmonia (anhydrous)... 7664-41-7 10,000 a, bAmmonia (conc 20% or greater). 7664-41-7 20,000 a, bArsenous trichloride... 7784-34-1 15,000 bArsine...... 7784-42-1 1,000 bBoron trichloride [Borane, 10294-34-5 5,000 b trichloro-].Boron trifluoride [Borane, 7637-07-2 5,000 b trifluoro-].Boron trifluoride compound with 353-42-4 15,000 b methyl ether (1:1) [Boron, trifluoro [oxybis [metane]]-, T-4-.Bromine...... 7726-95-6 10,000 a, bCarbon disulfide.... 75-15-0 20,000 bChlorine...... 7782-50-5 2,500 a, bChlorine dioxide [Chlorine 10049-04-4 1,000 c oxide (ClO2)].Chloroform [Methane, trichloro- 67-66-3 20,000 b ].Chloromethyl ether [Methane, 542-88-1 1,000 b oxybis[chloro-].Chloromethyl methyl ether 107-30-2 5,000 b [Methane, chloromethoxy-].Crotonaldehyde [2-Butenal]. 4170-30-3 20,000 bCrotonaldehyde, (E)- [2- 123-73-9 20,000 b Butenal, (E)-].

APPENDIX 5-A: ODOR AND AIR QUALITY: TREATMENT PLANT
October 2003 C-2
Cyanogen chloride.... 506-77-4 10,000 cCyclohexylamine 108-91-8 15,000 b [Cyclohexanamine].Diborane...... 19287-45-7 2,500 bDimethyldichlorosilane [Silane, 75-78-5 5,000 b dichlorodimethyl-].1,1-Dimethylhydrazine 57-14-7 15,000 b [Hydrazine, 1,1-dimethyl-].Epichlorohydrin [Oxirane, 106-89-8 20,000 b (chloromethyl)-].Ethylenediamine [1,2- 107-15-3 20,000 b Ethanediamine].Ethyleneimine [Aziridine].. 151-56-4 10,000 bEthylene oxide [Oxirane].. 75-21-8 10,000 a, bFluorine...... 7782-41-4 1,000 bFormaldehyde (solution).. 50-00-0 15,000 bFuran....... 110-00-9 5,000 bHydrazine...... 302-01-2 15,000 bHydrochloric acid (conc 37% or 7647-01-0 15,000 d greater).Hydrocyanic acid.... 74-90-8 2,500 a, bHydrogen chloride (anhydrous) 7647-01-0 5,000 a [Hydrochloric acid].Hydrogen fluoride/Hydrofluoric 7664-39-3 1,000 a, b acid (conc 50% or greater) [Hydrofluoric acid].Hydrogen selenide.... 7783-07-5 500 bHydrogen sulfide.... 7783-06-4 10,000 a, bIron, pentacarbonyl- [Iron 13463-40-6 2,500 b carbonyl (Fe(CO)5), (TB-5-11)- ].Isobutyronitrile 78-82-0 20,000 b [Propanenitrile, 2-methyl-].Isopropyl chloroformate 108-23-6 15,000 b [Carbonochloridic acid, 1- methylethyl ester].Methacrylonitrile [2- 126-98-7 10,000 b Propenenitrile, 2-methyl-].Methyl chloride [Methane, 74-87-3 10,000 a chloro-].Methyl chloroformate 79-22-1 5,000 b [Carbonochloridic acid, methylester].Methyl hydrazine [Hydrazine, 60-34-4 15,000 b methyl-].Methyl isocyanate [Methane, 624-83-9 10,000 a, b isocyanato-].Methyl mercaptan [Methanethiol] 74-93-1 10,000 bMethyl thiocyanate [Thiocyanic 556-64-9 20,000 b acid, methyl ester].Methyltrichlorosilane [Silane, 75-79-6 5,000 b trichloromethyl-].Nickel carbonyl.... 13463-39-3 1,000 bNitric acid (conc 80% or 7697-37-2 15,000 b greater).Nitric oxide [Nitrogen oxide 10102-43-9 10,000 b (NO)].Oleum (Fuming Sulfuric acid) 8014-95-7 10,000 e

APPENDIX 5-A: ODOR AND AIR QUALITY: TREATMENT PLANT
October 2003 C-3
[Sulfuric acid, mixture with sulfur trioxide] \1\.Peracetic acid [Ethaneperoxoic 79-21-0 10,000 b acid].Perchloromethylmercaptan 594-42-3 10,000 b [Methanesulfenyl chloride, trichloro-].Phosgene [Carbonic dichloride]. 75-44-5 500 a, bPhosphine...... 7803-51-2 5,000 bPhosphorus oxychloride 10025-87-3 5,000 b [Phosphoryl chloride].Phosphorus trichloride 7719-12-2 15,000 b [Phosphorous trichloride].Piperidine..... 110-89-4 15,000 bPropionitrile [Propanenitrile]. 107-12-0 10,000 bPropyl chloroformate 109-61-5 15,000 b [Carbonochloridic acid, propylester].Propyleneimine [Aziridine, 2- 75-55-8 10,000 b methyl-].Propylene oxide [Oxirane, 75-56-9 10,000 b methyl-].Sulfur dioxide (anhydrous). 7446-09-5 5,000 a, bSulfur tetrafluoride [Sulfur 7783-60-0 2,500 b fluoride (SF4), (T-4)-].Sulfur trioxide.... 7446-11-9 10,000 a, bTetramethyllead [Plumbane, 75-74-1 10,000 b tetramethyl-].Tetranitromethane [Methane, 509-14-8 10,000 b tetranitro-].Titanium tetrachloride 7550-45-0 2,500 b [Titanium chloride (TiCl4) (T- 4)-].Toluene 2,4-diisocyanate 584-84-9 10,000 a [Benzene, 2,4-diisocyanato-1- methyl-] \1\.Toluene 2,6-diisocyanate 91-08-7 10,000 a [Benzene, 1,3-diisocyanato-2- methyl-] \1\.Toluene diisocyanate 26471-62-5 10,000 a (unspecified isomer) [Benzene, 1,3-diisocyanatomethyl-] \1\.Trimethylchlorosilane [Silane, 75-77-4 10,000 b chlorotrimethyl-].Vinyl acetate monomer [Acetic 108-05-4 15,000 b acid ethenyl ester].------------------------------------------------------------------------\1\ The mixture exemption in § 68.115(b)(1) does not apply to the substance. Note: Basis for Listing:a Mandated for listing by Congress.b On EHS list, vapor pressure 10 mmHg or greater.c Toxic gas.d Toxicity of hydrogen chloride, potential to release hydrogenchloride, and history of accidents.

APPENDIX 5-A: ODOR AND AIR QUALITY: TREATMENT PLANT
October 2003 C-4
e Toxicity of sulfur trioxide and sulfuric acid, potential torelease sulfur trioxide, and history of accidents.

APPENDIX 5-A: ODOR AND AIR QUALITY: TREATMENT PLANT
October 2003
ATTACHMENT D – Influent Concentrations Used in Air ToxicsEmission Modeling

APPENDIX 5-A: ODOR AND AIR QUALITY: TREATMENT PLANT
October 2003 D-1
ATTACHMENT D – Influent Concentrations Used in Air ToxicsEmission Modeling (BASTE)
CompoundAMSA Influent Conc.
(ug/L)Acrolein ** 0Acrylonitrile 3.18Benzene 3.09Carbon tetrachloride 0.06Chlorobenzene 3.38Chloroform 5.871,4 Dichlorobenzene 6.97Ethyl benzene 2.54Ethylene dibromide * 0.02***Ethylene dichloride (1,2Dichloroethane) **
0
Formaldehyde * 0Methylene chloride ** 10.57Methyl chloroform (1,1,1Trichloroethane)
4.16
Styrene 1.19Tetrachloroethylene(perchloroethylene)
8.52
Toluene 14.27Trichloroethylene ** 1.39Vinyl chloride 0.02Vinylidene chloride * 0.25Xylenes 20.28Total 85.76* Not modeled in BASTE. Used mass balance approach to calculate the emission from liquidtreatment processes, assuming all emitted from liquid surface.** Emissions adjusted based on several POTWs inventories completed in 1990 for California StateLaw AB 2588.***No value in AMSA data. Made assumption.
Source: AMSA POTW Air Emissions Meeting Materials. Washington D.C. December1993.

APPENDIX 5-A: ODOR AND AIR QUALITY: TREATMENT PLANT
October 2003
ATTACHMENT E – Combustion Source Parameters

APPENDIX 5-A: ODOR AND AIR QUALITY: TREATMENT PLANT
October 2003 E-1
ATTACHMENT E – Combustion Source Parameters
The input parameters used in the dispersion model are based on current designknowledge. The input parameters include the exhaust stack height, diameter, velocity,and temperature of the exhaust gas. Air toxic modeling is typically conducted with themaximum potential emissions, which are determined by the design capacity of thetreatment plant, in this case 54 mgd or 72 mgd. The source parameters used in the odorand air quality dispersion modeling for the 54 mgd treatment plant at the Route 9 site ispresented in Table E1 and, for the Unocal site, in Table E2. The input parameters for thecombustion sources are the same for 54 mgd and 72 mgd. The presence of a lid does notchange the input parameters because the co-generation facility would not be under the lid.
TABLE E1Combustion Source Parameters for a 54-mgd Treatment Plant at Route 9 Site
Source ParametersStandby Diesel IC
EnginesCogen Turbines
Generators Hot Water Boilers
Stack Temperature,degrees F
916 829 200
Stack Temperature,degrees K
764 716 366
Stack Air flow, acfm 1,968 119,403 12,237
Stack Velocity, mps 12.7 16 11.7
Stack Velocity, fps 41.8 51.7 38.5
Stack Diameter, inches 12 84 18
Stack Diameter, feet 1 7 1.5
Stack Diameter, meters 0.3 2.1 0.5
Stack Height, meters 9.1 9.1 9.1
Stack Height, feet 30 30 30
Number of Stacks 2 2 3
TABLE E2Combustion Source Parameters for a 54-mgd Treatment Plant at Unocal Site With and Without the Lid
Source ParametersStandby Diesel
IC EnginesCogen Turbines
Generators Hot Water Boilers
Stack Temperature,degrees F
916 829 200
Stack Temperature,degrees K
764 716 366
Stack Air flow, acfm 1,968 129,353 12,237
Stack Velocity, mps 12.7 15 11.7
Stack Velocity, fps 41.8 48.8 38.5
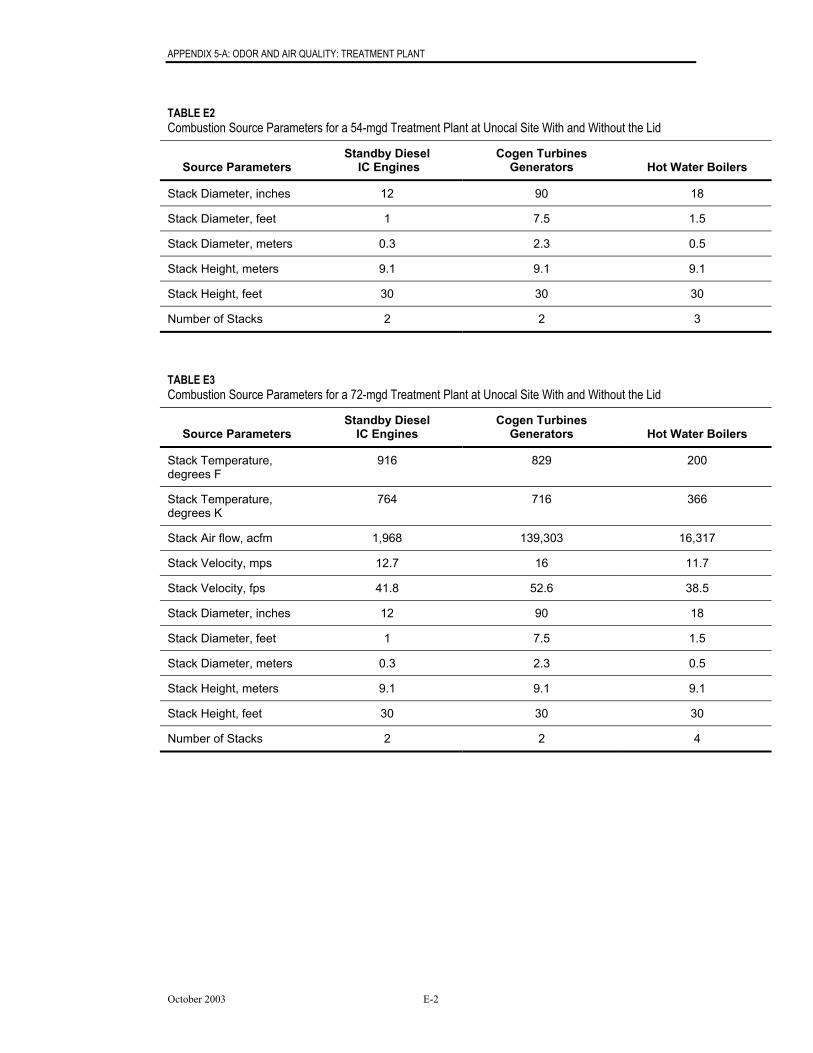
APPENDIX 5-A: ODOR AND AIR QUALITY: TREATMENT PLANT
October 2003 E-2
TABLE E2Combustion Source Parameters for a 54-mgd Treatment Plant at Unocal Site With and Without the Lid
Source ParametersStandby Diesel
IC EnginesCogen Turbines
Generators Hot Water Boilers
Stack Diameter, inches 12 90 18
Stack Diameter, feet 1 7.5 1.5
Stack Diameter, meters 0.3 2.3 0.5
Stack Height, meters 9.1 9.1 9.1
Stack Height, feet 30 30 30
Number of Stacks 2 2 3
TABLE E3Combustion Source Parameters for a 72-mgd Treatment Plant at Unocal Site With and Without the Lid
Source ParametersStandby Diesel
IC EnginesCogen Turbines
Generators Hot Water Boilers
Stack Temperature,degrees F
916 829 200
Stack Temperature,degrees K
764 716 366
Stack Air flow, acfm 1,968 139,303 16,317
Stack Velocity, mps 12.7 16 11.7
Stack Velocity, fps 41.8 52.6 38.5
Stack Diameter, inches 12 90 18
Stack Diameter, feet 1 7.5 1.5
Stack Diameter, meters 0.3 2.3 0.5
Stack Height, meters 9.1 9.1 9.1
Stack Height, feet 30 30 30
Number of Stacks 2 2 4

APPENDIX 5-A: ODOR AND AIR QUALITY: TREATMENT PLANT
October 2003
ATTACHMENT F – Liquids and Solids Process Source Parameters

APPENDIX 5-A: ODOR AND AIR QUALITY: TREATMENT PLANT
October 2003 F-1
ATTACHMENT F – Liquids and Solids Process Source Parameters
The input parameters used in the model are based on current design knowledge. The inputparameters include the exhaust stack height, diameter, velocity, and temperature of theexhaust gas. The source input parameters used in odor modeling of the odor preventionsystems are the same parameters used for the air toxics modeling for those sources.
Odor modeling was conducted for the Phase 1 of the project (36 mgd) as well as 54 mgdand 72 mgd.
Route 9 Site
TABLE F1Odor Prevention System Source Parameters for a 36-mgd Treatment Plant at Route 9 Site
Source Parameters
Influent PumpStation Odorprevention
Solids Handlingodor prevention
Primary OdorPrevention
Secondary OdorPrevention
Stack Temperature,degrees F 68 68 68 68
Stack Temperature,degrees K 285 285 285 285
Stack Air flow, acfm 31,646 36,976 39,615 33,597
Stack Velocity, mps 11.8 13.8 14.8 12.5
Stack Velocity, fps 38.7 45.2 48.4 41.1
Stack Diameter, inches 50 50 50 50
Stack Diameter, feet 4.2 4.2 4.2 4.2
Stack Diameter, meters 1.3 1.3 1.3 1.3
Stack Height, meters 6.1 6.1 6.1 6.1
Stack Height, feet 20 20 20 20
Number of Stacks 2 2 3 4
TABLE F2Odor Prevention System Source Parameters for a 54-mgd Treatment Plant at Route 9 Site
Source Parameters
Influent PumpStation OdorPrevention
Solids HandlingOdor Prevention
Primary OdorPrevention
Secondary OdorPrevention
Stack Temperature,degrees F 68 68 68 68
Stack Temperature,degrees K 285 285 285 285
Stack Air flow, acfm 31,646 36,976 39,615 33,597

APPENDIX 5-A: ODOR AND AIR QUALITY: TREATMENT PLANT
October 2003 F-2
TABLE F2Odor Prevention System Source Parameters for a 54-mgd Treatment Plant at Route 9 Site
Source Parameters
Influent PumpStation OdorPrevention
Solids HandlingOdor Prevention
Primary OdorPrevention
Secondary OdorPrevention
Stack Velocity, mps 11.8 13.8 14.8 12.5
Stack Velocity, fps 38.7 45.2 48.4 41.1
Stack Diameter, inches 50 50 50 50
Stack Diameter, feet 4.2 4.2 4.2 4.2
Stack Diameter, meters 1.3 1.3 1.3 1.3
Stack Height, meters 6.1 6.1 6.1 6.1
Stack Height, feet 20 20 20 20
Number of Stacks 2 3 4 6
Unocal Site
TABLE F3Odor Prevention System Parameters for a 36-mgd Treatment Plant at Unocal Site
Source Parameters
Influent PumpStation OdorPrevention
Solids HandlingOdor Prevention
Primary OdorPrevention
Secondary OdorPrevention
Stack Temperature,degrees F 68 68 68 68
Stack Temperature,degrees K 285 285 285 285
Stack Air flow, acfm 31,646 36,976 39,615 34,618
Stack Velocity, mps 11.8 13.8 14.8 12.5
Stack Velocity, fps 38.7 45.2 48.4 41.1
Stack Diameter, inches 50 50 50 50
Stack Diameter, feet 4.2 4.2 4.2 4.2
Stack Diameter, meters 1.3 1.3 1.3 1.3
Stack Height, meters 6.1 6.1 6.1 6.1
Stack Height, feet 20 20 20 20
Number of Stacks 2 2 3 4

APPENDIX 5-A: ODOR AND AIR QUALITY: TREATMENT PLANT
October 2003 F-3
TABLE F4Odor Prevention System Parameters for a 36-mgd Treatment Plant at Unocal Site with Structural Lid
Source Parameters
Influent PumpStation OdorPrevention
Solids HandlingOdor Prevention
Primary OdorPrevention
Secondary OdorPrevention
Stack Temperature,degrees F 68 68 68 68
Stack Temperature,degrees K 285 285 285 285
Stack Air flow, acfm 31,646 36,976 39,615 34,618
Stack Velocity, mps 11.8 13.8 14.8 12.5
Stack Velocity, fps 38.7 45.2 48.4 41.1
Stack Diameter, inches 50 50 50 50
Stack Diameter, feet 4.2 4.2 4.2 4.2
Stack Diameter, meters 1.3 1.3 1.3 1.3
Stack Height, meters 6.1 6.1 6.1 6.1
Stack Height, feet 20 20 20 20
Number of Stacks 2 2 3 4
TABLE F5Odor Prevention System Parameters for a 54-mgd Treatment Plant at Unocal Site
Source Parameters
Influent PumpStation OdorPrevention
Solids HandlingOdor Prevention
Primary OdorPrevention
Secondary OdorPrevention
Stack Temperature,degrees F 68 68 68 68
Stack Temperature,degrees K 285 285 285 285
Stack Air flow, acfm 31,646 36,976 39,615 34,618
Stack Velocity, mps 11.8 13.8 14.8 12.5
Stack Velocity, fps 38.7 45.2 48.4 41.1
Stack Diameter, inches 50 50 50 50
Stack Diameter, feet 4.2 4.2 4.2 4.2
Stack Diameter, meters 1.3 1.3 1.3 1.3
Stack Height, meters 6.1 6.1 6.1 6.1
Stack Height, feet 20 20 20 20
Number of Stacks 2 3 4 6
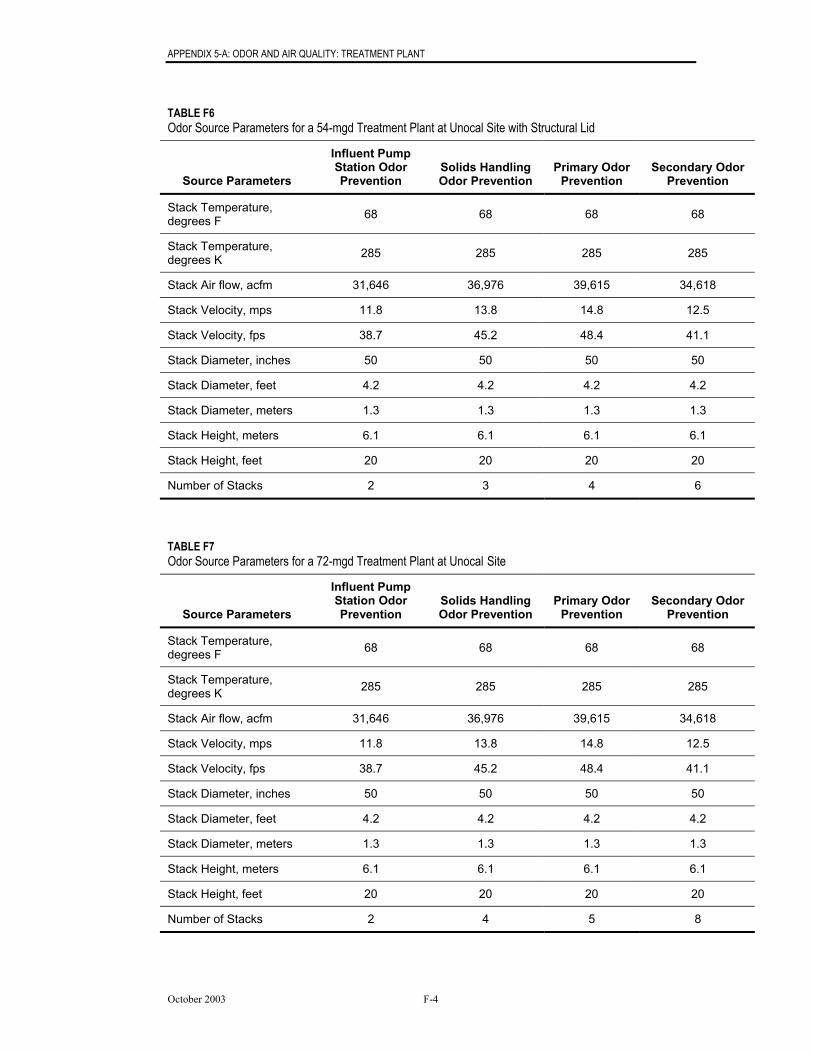
APPENDIX 5-A: ODOR AND AIR QUALITY: TREATMENT PLANT
October 2003 F-4
TABLE F6Odor Source Parameters for a 54-mgd Treatment Plant at Unocal Site with Structural Lid
Source Parameters
Influent PumpStation OdorPrevention
Solids HandlingOdor Prevention
Primary OdorPrevention
Secondary OdorPrevention
Stack Temperature,degrees F 68 68 68 68
Stack Temperature,degrees K 285 285 285 285
Stack Air flow, acfm 31,646 36,976 39,615 34,618
Stack Velocity, mps 11.8 13.8 14.8 12.5
Stack Velocity, fps 38.7 45.2 48.4 41.1
Stack Diameter, inches 50 50 50 50
Stack Diameter, feet 4.2 4.2 4.2 4.2
Stack Diameter, meters 1.3 1.3 1.3 1.3
Stack Height, meters 6.1 6.1 6.1 6.1
Stack Height, feet 20 20 20 20
Number of Stacks 2 3 4 6
TABLE F7Odor Source Parameters for a 72-mgd Treatment Plant at Unocal Site
Source Parameters
Influent PumpStation OdorPrevention
Solids HandlingOdor Prevention
Primary OdorPrevention
Secondary OdorPrevention
Stack Temperature,degrees F 68 68 68 68
Stack Temperature,degrees K 285 285 285 285
Stack Air flow, acfm 31,646 36,976 39,615 34,618
Stack Velocity, mps 11.8 13.8 14.8 12.5
Stack Velocity, fps 38.7 45.2 48.4 41.1
Stack Diameter, inches 50 50 50 50
Stack Diameter, feet 4.2 4.2 4.2 4.2
Stack Diameter, meters 1.3 1.3 1.3 1.3
Stack Height, meters 6.1 6.1 6.1 6.1
Stack Height, feet 20 20 20 20
Number of Stacks 2 4 5 8

APPENDIX 5-A: ODOR AND AIR QUALITY: TREATMENT PLANT
October 2003 F-5
TABLE F8Odor Source Parameters for a 72-mgd Treatment Plant at Unocal with Structural Lid
Source Parameters
Influent PumpStation OdorPrevention
Solids HandlingOdor Prevention
Primary OdorPrevention
Secondary OdorPrevention
Stack Temperature,degrees F 68 68 68 68
Stack Temperature,degrees K 285 285 285 285
Stack Air flow, acfm 31,646 36,976 39,615 34,618
Stack Velocity, mps 11.8 13.8 14.8 12.5
Stack Velocity, fps 38.7 45.2 48.4 41.1
Stack Diameter, inches 50 50 50 50
Stack Diameter, feet 4.2 4.2 4.2 4.2
Stack Diameter, meters 1.3 1.3 1.3 1.3
Stack Height, meters 6.1 6.1 6.1 6.1
Stack Height, feet 20 20 20 20
Number of Stacks 2 4 5 8

APPENDIX 5-A: ODOR AND AIR QUALITY: TREATMENT PLANT
October 2003
ATTACHMENT G – Acronyms and Abbreviations
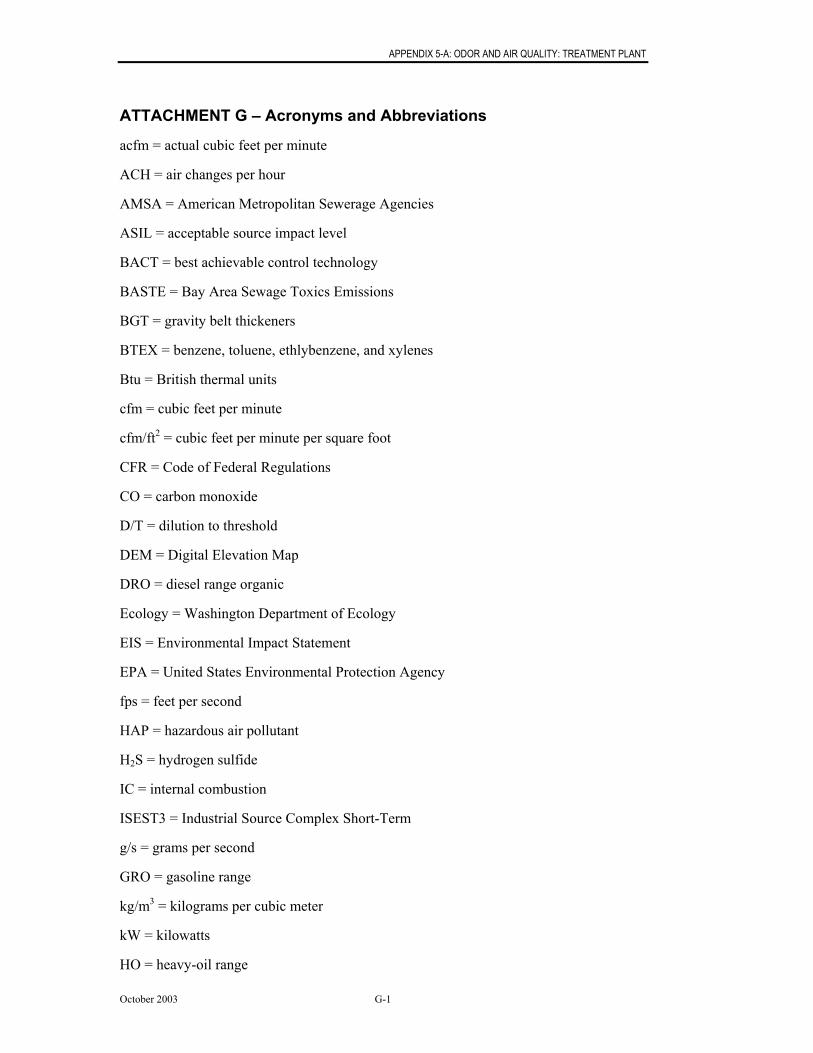
APPENDIX 5-A: ODOR AND AIR QUALITY: TREATMENT PLANT
October 2003 G-1
ATTACHMENT G – Acronyms and Abbreviations
acfm = actual cubic feet per minute
ACH = air changes per hour
AMSA = American Metropolitan Sewerage Agencies
ASIL = acceptable source impact level
BACT = best achievable control technology
BASTE = Bay Area Sewage Toxics Emissions
BGT = gravity belt thickeners
BTEX = benzene, toluene, ethlybenzene, and xylenes
Btu = British thermal units
cfm = cubic feet per minute
cfm/ft2 = cubic feet per minute per square foot
CFR = Code of Federal Regulations
CO = carbon monoxide
D/T = dilution to threshold
DEM = Digital Elevation Map
DRO = diesel range organic
Ecology = Washington Department of Ecology
EIS = Environmental Impact Statement
EPA = United States Environmental Protection Agency
fps = feet per second
HAP = hazardous air pollutant
H2S = hydrogen sulfide
IC = internal combustion
ISEST3 = Industrial Source Complex Short-Term
g/s = grams per second
GRO = gasoline range
kg/m3 = kilograms per cubic meter
kW = kilowatts
HO = heavy-oil range
APPENDIX 5-A: ODOR AND AIR QUALITY: TREATMENT PLANT
October 2003 G-2
lb/yr = pounds per year
MACT = maximum achievable control technology
mgd = millions gallons per day
mg/L = milligrams per liter
mps = meters per second
m3/s = cubic meters per second
MW = megawatts
MMBtu = million British thermal units
NA = not applicable
NAAQS = National Ambient Air Quality Standards
NESHAP = National Emission Standards for Hazardous Air Pollutants
NSPS = New Source Performance Standards
NFPA = National Historic Preservation Act
NH3 = ammonia
NO = nitric oxide
NOC = Notice of Construction
NO2 = nitrogen dioxide
NOx = nitrogen oxides
NSR = new source review
O&M = operations and maintenance
OSHA = Occupational Safety and Health Act
PAH = polycyclic aromatic hydrocarbon
PEEP = Pooled Emission Estimation Program
PM = particulate matter
PM10 = particulate matter less than 10 microns in diameter
PM25 = particulate matter less than 2.5 microns in diameter
POTW = publicly owned treatment works
ppm = parts per million
ppbV = parts per billion by volume
PS Clean Air = Puget Sound Clean Air Agency
APPENDIX 5-A: ODOR AND AIR QUALITY: TREATMENT PLANT
October 2003 G-3
PSD = Prevention of Significant Deterioration
RMP = Risk Management Plan
RTO = regenerative thermal oxidizer
SIP = State Implementation Plan
SOx = sulfur oxides
SQER = small quantity emission rate
TAP = toxic air pollutant
TBACT = best achievable control technology for toxics
TSP = total suspended particulate matter
µg/m3= microgram per cubic meter
USGS = United States Geological Survey
UV = ultraviolet
VOC = volatile organic compound