5-5 graphing linear functions warm up warm up lesson presentation lesson presentation problem of the...
TRANSCRIPT
5-5 Graphing Linear Functions
Warm UpWarm Up
Lesson PresentationLesson Presentation
Problem of the DayProblem of the Day
Lesson QuizzesLesson Quizzes
5-5 Graphing Linear Functions
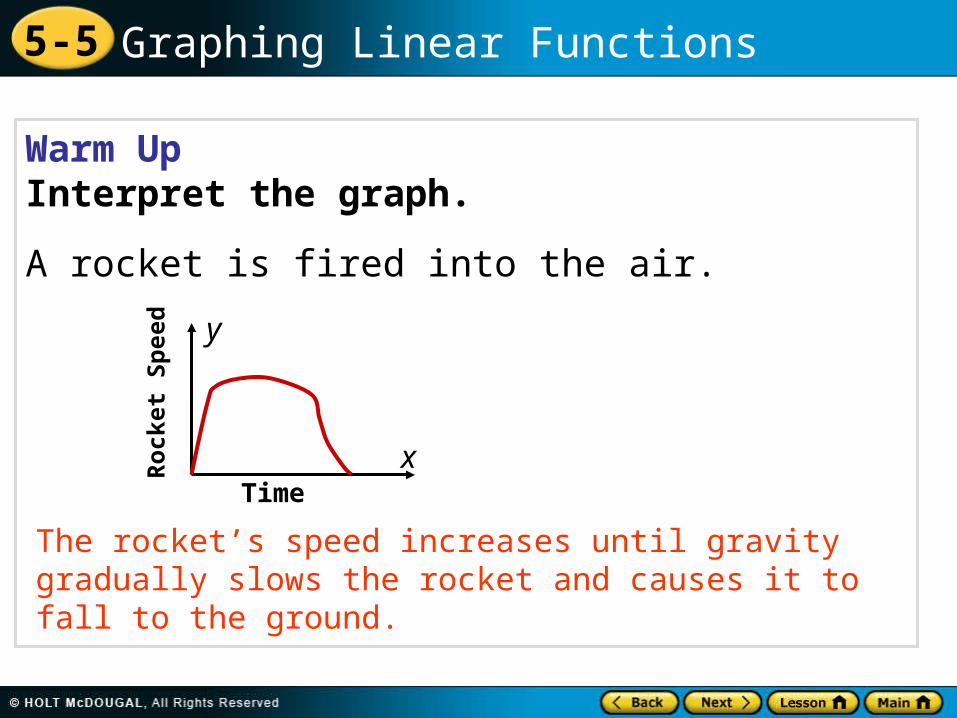
Warm UpInterpret the graph.
A rocket is fired into the air.
The rocket’s speed increases until gravity gradually slows the rocket and causes it to fall to the ground.
Rocket
Sp
eed
Time
y
x
5-5 Graphing Linear Functions
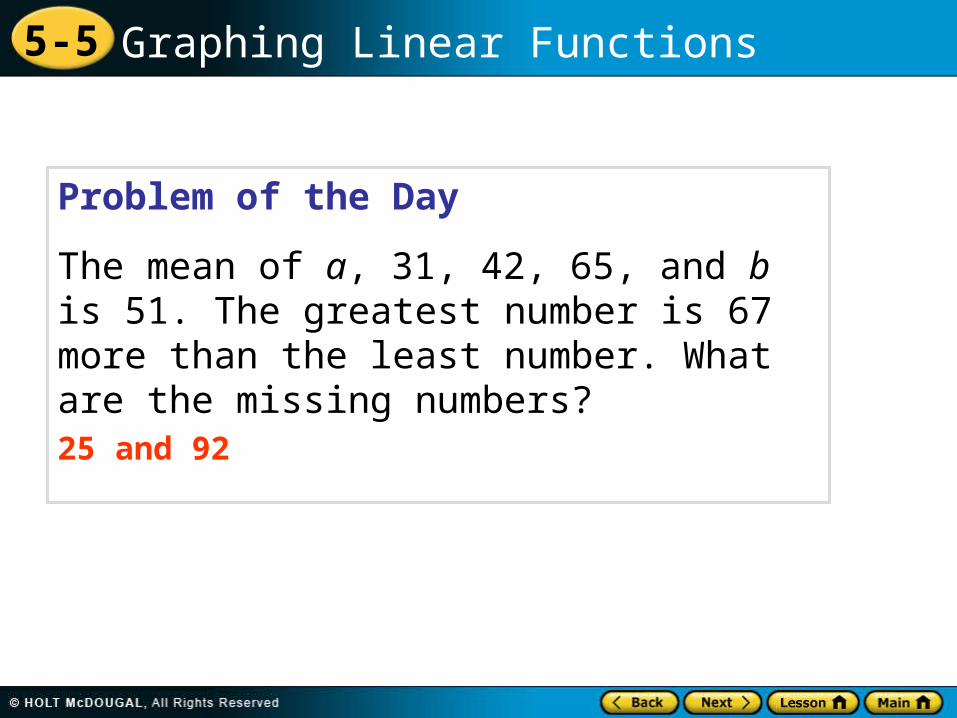
Problem of the Day
The mean of a, 31, 42, 65, and b is 51. The greatest number is 67 more than the least number. What are the missing numbers?25 and 92

5-5 Graphing Linear Functions
Learn to identify and graph linear equations.

5-5 Graphing Linear Functions
Vocabulary
linear equation
linear function

5-5 Graphing Linear Functions
The graph at right shows how far a kayak travels down a river if the current flows 2 miles per hour. The graph is linear because all the points fall on a line. It is part of the graph of a linear equation.
A linear equation is an equation whose graph is a line. The solutions of a linear equation are the points that make up its graph. Linear equations and linear graphs can be different representations of linear functions. A linear function is a function whose graph is a nonvertical line.
y
02 4
2
4
6
x
Miles
Hours0

5-5 Graphing Linear Functions
Only two points are needed to draw the graph of a linear function. However, graphing a third point serves as a check. You can use a function table to find each ordered pair.
5-5 Graphing Linear Functions
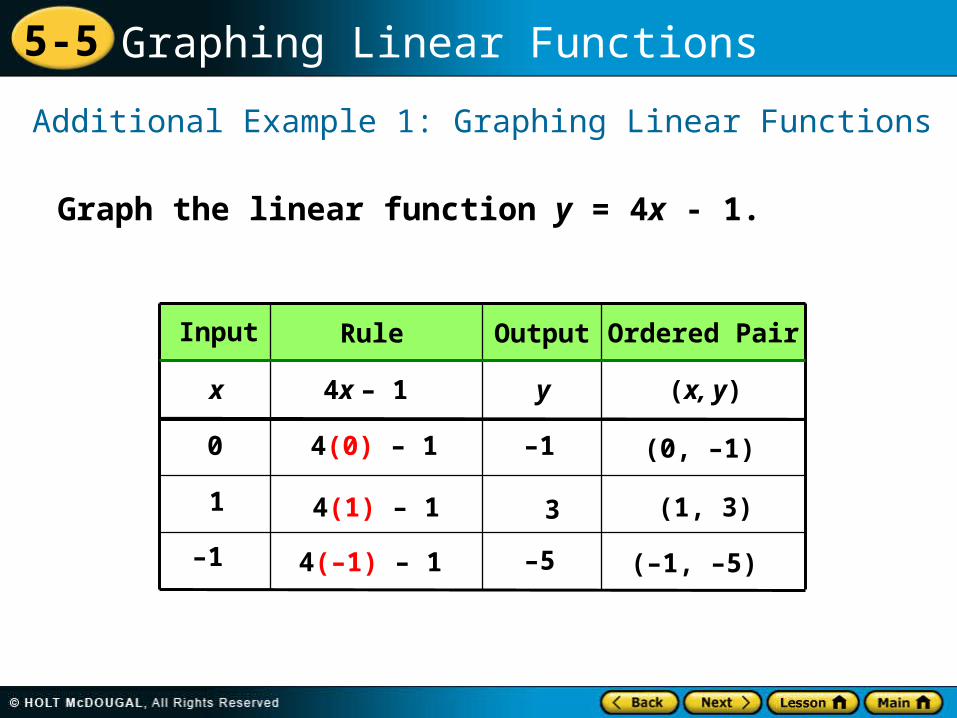
Graph the linear function y = 4x - 1.
Additional Example 1: Graphing Linear Functions
Input Rule Output Ordered Pair
x 4x – 1 y (x, y)
0
1
–1
4(0) – 1
4(1) – 1
4(–1) – 1
–1
3
–5
(0, –1)
(1, 3)
(–1, –5)

5-5 Graphing Linear Functions
Additional Example 1 Continued
Graph the linear function y = 4x - 1.
Place each ordered pair on the coordinate grid and then connect the points with a line.
x
y
0–2–4 2 4
2
4
–2
–4
(0, –1)
(1, 3)
(–1, –5)

5-5 Graphing Linear Functions
Graph the linear function y = 3x + 1.
Input Rule Output Ordered Pair
x 3x + 1 y (x, y)
0
1
–1
3(0) + 1
3(1) + 1
3(–1) + 1
1
4
–2
(0, 1)
(1, 4)
(–1, –2)
Check It Out: Example 1

5-5 Graphing Linear Functions
Check It Out: Example 1 Continued
Graph the linear function y = 3x + 1.
Place each ordered pair on the coordinate grid and then connect the points with a line.
x
y
0–2–4 2 4
2
4
–2
–4
(0, 1)
(1, 4)
(–1, –2)

5-5 Graphing Linear Functions
The fastest-moving tectonic plates on Earth move apart at a rate of 15 centimeters per year. Scientists began studying two parts of these plates when they were 30 centimeters apart. Write a linear function that describes the movement of the plates over time. Then make a graph to show the movement over 4 years.
Additional Example 2: Earth Science Application
Begin by making a function table. Include a column for the rule.

5-5 Graphing Linear Functions
Additional Example 2 Continued
OutputRuleInput
15(x) + 30x
0
2
4
15(0) + 30
15(2) + 30
15(4) + 30
y
30
60
90
Let x represent the input and y represent the output.
Multiply the input by 15 and then add 30.
The function is y = 15x + 30, where x is the number of years and y is the total centimeters apart the two plates are.

5-5 Graphing Linear Functions
Additional Example 2 Continued
Graph the ordered pairs (0, 30), (2, 60), and (4, 90) from your table. Connect the points with a line.
x
y100
80
60
40
20
0 2 4 8 10 12
Cen
tim
ete
rs
Years
Check
Substitute the orderedpairs into th functiony = 15x + 30.
30 = 15(0) + 30 ?
30 = 30?
90 = 15(4) + 30 ?
90 = 90?

5-5 Graphing Linear Functions
Check It Out: Example 2
Dogs are considered to age 7 years for each human year. If a dog is 3 years old today, how old in human years will it be in 4 more years? Write a linear equation which would show this relationship. Then make a graph to show how the dog will age in human years over the next 4 years.
Begin by making a function table. Include a column for the rule.

5-5 Graphing Linear Functions
Check It Out: Example 2 Continued
OutputRuleInput
7(x) + 21x
0
2
4
7(0) + 21
7(2) + 21
7(4) + 21
y
21
35
49
Let x represent the input and y represent the output.
Multiply the input by 7 and then add 21.
The function is y = 7x + 21, where x is the number of years and y is the total age of the dog in human years.

5-5 Graphing Linear Functions
Check it Out: Example 2 Continued
x
Check
Substitute the orderedpairs into th functiony = 15x + 30.
30 = 15(0) + 30 ?
30 = 30?
90 = 15(4) + 30 ?
90 = 90?
Graph the ordered pairs (0, 21), (2, 35), and (4, 49) from your table. Connect the points with a line.
y
80
60
40
20
0 2 4 8 10
Hu
man
Year
Years

5-5 Graphing Linear Functions
Standard Lesson Quiz
Lesson Quizzes
Lesson Quiz for Student Response Systems
5-5 Graphing Linear Functions
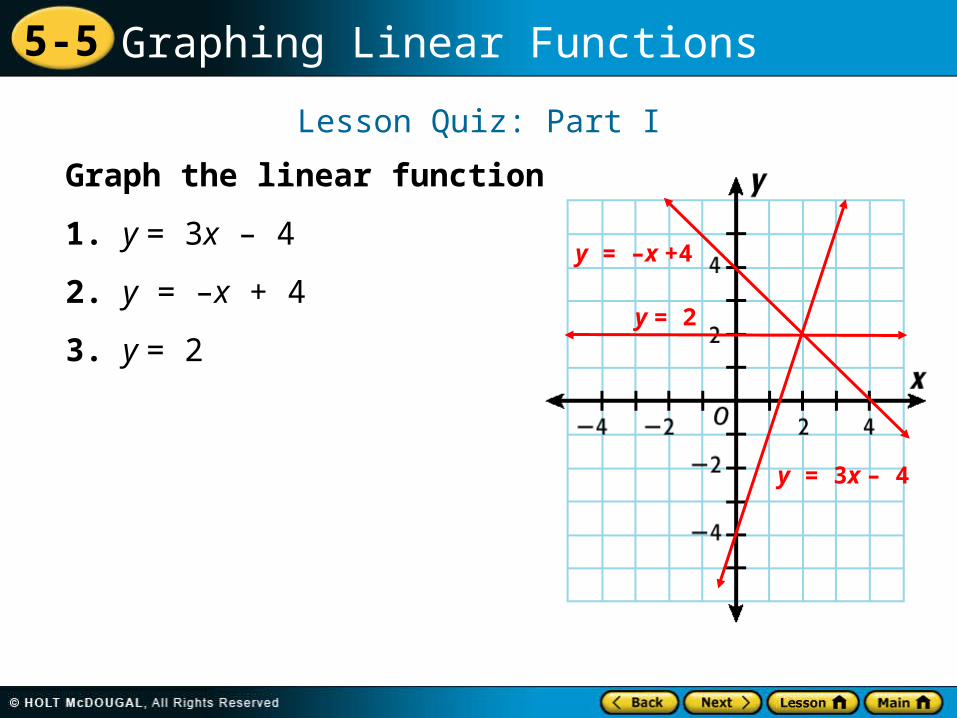
Lesson Quiz: Part I
Graph the linear functions.
1. y = 3x – 4
2. y = –x + 4
3. y = 2
y = 3x – 4
y = –x +4
y = 2

5-5 Graphing Linear Functions
Lesson Quiz: Part II
4. The temperature of a liquid is decreasing at a rate of 12°F per hour. Susan begins measuring the liquid at 200°F. Write a linear function that describes the change in temperature over time. Then make a graph to show the temperature over 5 hours.
y = 200 – 12x
5-5 Graphing Linear Functions
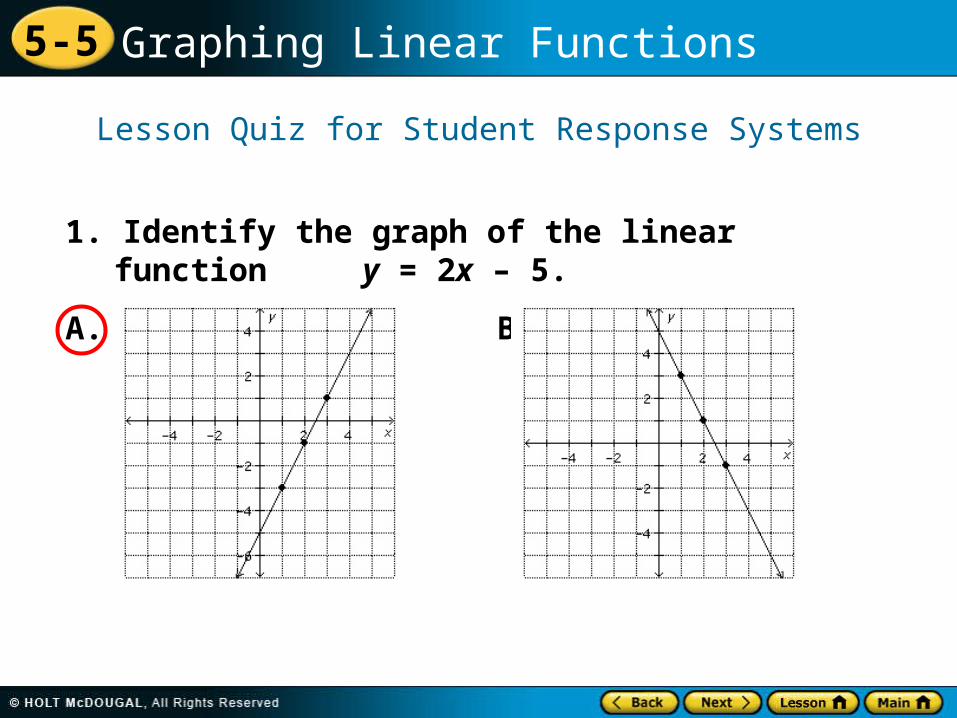
1. Identify the graph of the linear function y = 2x – 5.
A. B.
Lesson Quiz for Student Response Systems

5-5 Graphing Linear Functions
2. Identify the graph of the linear function y = –x + 4.
A. B.
Lesson Quiz for Student Response Systems

5-5 Graphing Linear Functions
3. Identify the graph of the linear function y = 5.
A. B.
Lesson Quiz for Student Response Systems

5-5 Graphing Linear Functions
4. Larry has 150 cents in his piggy bank. He puts 20 cents into it everyday. Identify a linear function that describes the amount in the piggy bank over time and a graph that shows the amount over 5 days.
A. y = 150 – 20x B. y = 150 + 20x
Lesson Quiz for Student Response Systems