4q 2018 and full year earnings review and 2019 outlook
TRANSCRIPT

4Q 2018 And Full Year Earnings Review And 2019 OutlookJanuary 23, 2019
(Preliminary Results)
2
OurBelief
Our Plan for Value Creation
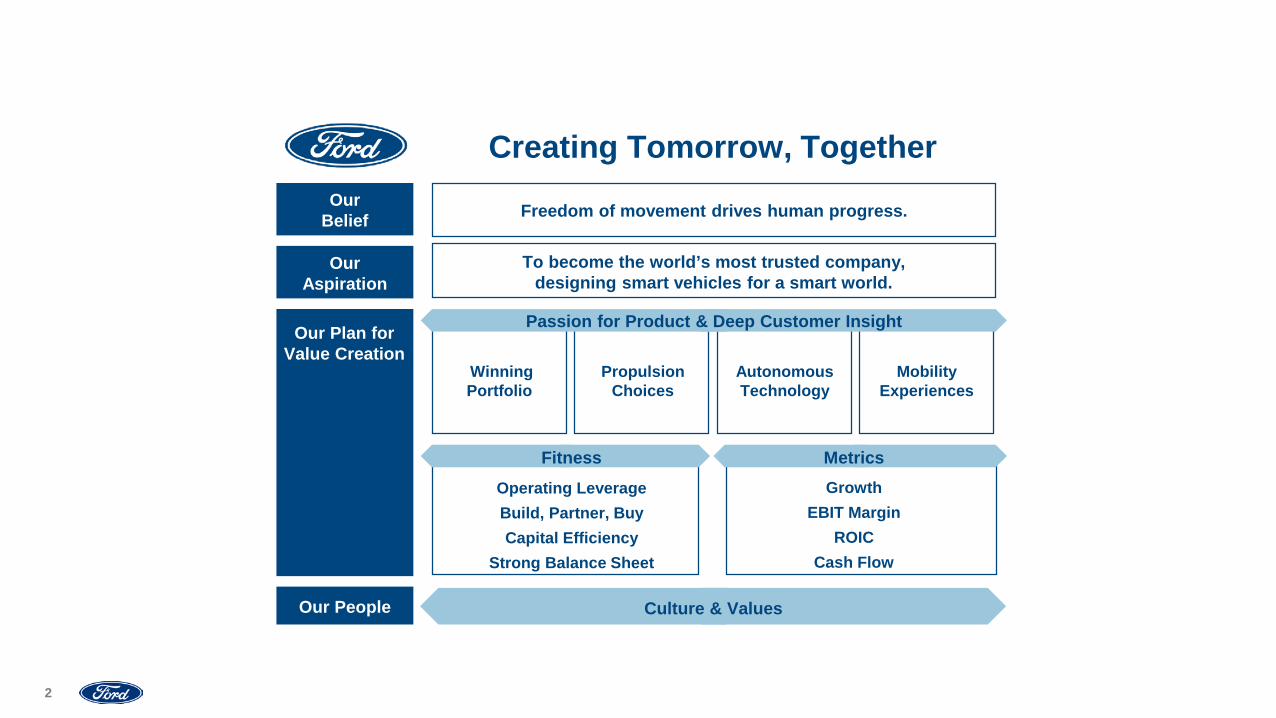
Creating Tomorrow, Together
WinningPortfolio
Propulsion Choices
Autonomous Technology
MobilityExperiences
Operating LeverageBuild, Partner, BuyCapital Efficiency
Strong Balance Sheet
Fitness
Culture & Values
MetricsGrowth
EBIT MarginROIC
Cash Flow
Passion for Product & Deep Customer Insight
Our People
OurAspiration
Freedom of movement drives human progress.
To become the world’s most trusted company,designing smart vehicles for a smart world.

3
Financial Highlights
* See Appendix for reconciliation to GAAP and definitions
Company Revenue
Company Adj. EBIT*Company Adj. EBIT Margin*
NA EBIT Margin
Ford Credit EBT
Company Adj. Op. Cash Flow*
Company Cash*Liquidity
Adj. EPS*
$41.8B 1%
$1.5B 3.5%
7.6%
$0.7B
$1.5B
$23.1B $34.2B
$0.30
$$160.3B 2%
$7.0B 4.4%
7.9%
$2.6B
$2.8B
$23.1B $34.2B
$1.30
FOURTH QUARTER FULL YEAR

4
Strategic Highlights F-Series: Over 1 million sold globally in 2018; largest-ever lead on competition; ATPs about $2k higher than segment
Ranger: In the U.S., launched Ranger, the second best selling medium pickup outside of the U.S.
All-new Focus in China: Higher ATP than segment; new mid-size SUV Territory in dealer showrooms by the end of January
All-new Shelby GT500 revealed, most powerful street legal Ford in history
Winning Portfolio
Explorer: America’s all-time best-selling SUV. All-new in 2019 with performance-tuned ST and no-compromise hybrid. Hybrid is the first of our next generation of advanced hybrids that provide both capability and efficiency
New all-electric utility to be revealed this year and go on sale in 2020
Early work started on all-electric F-150
Propulsion Choices
Miami AV drive highlighting technology and business models for moving people and goods – exceeded expectationsAutonomous Technology
Acquired e-scooter company SPIN to deliver first-mile / last-mile mobility solutions
Announced plan to deploy cellular vehicle-to-everything technology (C-V2X) in all-new vehicles in the U.S. beginning in 2022
Mobility Experiences
Fitness
Redesign of our global salaried workforce to increase effectiveness and efficiency complete in 2Q
Began consultation with labor partners on restructuring and redesign of European operations to reach sustainable profitability
Russia business under strategic review
Auto structural costs flat in 2018 YoY versus average annual increase of $1.7 billion 2013 - 2017
Entered into alliance with VW to develop medium-sized pickup trucks and commercial vans

Bob ShanksChief Financial OfficerFinancial Review

6
2018 H / (L)
FOURTH QUARTER • All 4Q key metrics lower YoY except revenue; mainly reflects performance in China and Europe
• Company adj. EBIT at$1.5B, down $0.6B; adj. EBIT margin at 3.5%, down 1.4 ppts
• Company adj. EPS at $0.30, down $0.09; adj. effective tax rate of negative 4.0%
• Company adj. operating cash flow at $1.5B, down $0.7B due primarily to lower EBIT
• Net income loss of $0.1B, down $2.6B; includes negative $0.9B non-cash pre-tax mark-to-market adjustment for global pension and OPEB plans
Company Key Metrics Summary
* See Appendix for reconciliation to GAAP, calculations and definitions
2017 2018 H / (L)2017
FULL YEAR
Non-GAAP
GAAP
Wholesales (000) 1,749 1,474 (16) % 6,607 5,982 (9) %
Market Share (Pct) 6.6 % 5.9 % (0.7) ppts 7.0 % 6.3 % (0.7) ppts
Revenue (Bils) 41.3$ 41.8$ 1 % 156.8$ 160.3$ 2 %
Net Income (Bils) 2.5 (0.1) (2.6)$ 7.7 3.7 (4.1)$
Net Income Margin (Pct) 6.1 % (0.3) % (6.4) ppts 4.9 % 2.3 % (2.6) ppts
EPS (Diluted) 0.63$ (0.03)$ (0.66)$ 1.93$ 0.92$ (1.01)$
Cash Flows From Op. Activities (Bils) 3.1 1.4 (1.8) 18.1 15.0 (3.1)
Company Adj. EBIT* (Bils) 2.0$ 1.5$ (0.6)$ 9.6$ 7.0$ (2.6)$
Company Adj. EBIT Margin* (Pct) 4.9 % 3.5 % (1.4) ppts 6.1 % 4.4 % (1.7) ppts
Adjusted EPS* (Diluted) 0.39$ 0.30$ (0.09)$ 1.78$ 1.30$ (0.48)$
Company Adj. Op. Cash Flow* (Bils) 2.2 1.5 (0.7) 4.2 2.8 (1.4)
Adjusted Cash Conversion* 43 % 40 % (3) ppts 43 % 40 % (3) ppts
Adjusted Debt to EBITDA* 2.5 3.0 0.5 2.5 3.0 0.5
Adjusted ROIC* (Trailing Four Qtrs) 11.8 % 7.1 % (4.7) ppts 11.8 % 7.1 % (4.7) ppts

7
Company Revenue And Adj. Operating Cash Flow Trending Higher;Company Adj. EBIT And Adj. EBIT Margin Trending Lower
Company Key Financial MetricsCompany Adjusted EBIT Margin (Pct)
Company Adjusted EBIT (Bils)
Note: See Appendix for reconciliation to GAAP and definitions
Company Adjusted Operating Cash Flow (Bils)
Company Revenue (Bils)
4Q 2017 2Q 2018 4Q 20181Q 2018 3Q 2018
$41.3 $42.0 $38.9 $37.6
$41.8 4.9% 5.2%
4.3% 4.4%3.5%
4Q 2017 2Q 2018 4Q 20181Q 2018 3Q 2018
$2.0 $2.2 $1.7 $1.7 $1.5
4Q 2017 2Q 2018 4Q 20181Q 2018 3Q 2018
$2.2 $3.0
$(1.8)
$0.1 $1.5
4Q 2017 2Q 2018 4Q 20181Q 2018 3Q 2018

8
• 4Q Company adj. EBIT of $1.5B driven by Auto and Ford Credit; YoY decline due mainly to Auto, driven by China and Europe
• Loss at Mobility due to planned investment increases for development of services and autonomous vehicle business
• Corporate Other reflects Corporate governance cost and adverse fair market value changes for marketable securities; Auto interest income a partial offset
• Special Items mainly non-cash pre-tax mark-to-market adjustment for global pension and OPEB plans; key driver of net income loss
• Unfavorable YoY change in taxes due to non-repeat of favorable U.S. tax reform and other tax-planning actions in 4Q 2017
4Q 2018 Company Results (Mils)
Auto Net Income (GAAP)
Ford CreditMobility Corporate Other
Company Adj. EBIT*
Interest On Debt
SpecialItems
Taxes / Non-
Controlling
B / (W) 4Q 2017 $(504) $(95) $53 $(25) $(571) $13 $(1,331) $(747) $(2,636)
$1,131
$(195)
$663
$(142)
$1,457
$(295)
$(1,179)
$(99) $(116)
* See Appendix for reconciliation to GAAP and definitions

9
$1,131
$1,959
$(199) $(199)$(49)
$(381)
• 4Q Automotive EBIT of $1.1B more than explained by North America, which improved YoY
• Operations outside North America at an EBIT loss of $828M, down $692M due to China and Europe
• Within Asia Pacific, China a loss of $534M, a YoY decline of $515M
• Automotive structural costs reduced nearly $200M YoY due to fitness benefits
4Q 2018 Automotive EBIT By Region (Mils)
$(828)
B / (W)4Q 2017 $(504) $188 $(10) $(288) $17 $(411)
SouthAmericaAutomotive
NorthAmerica Europe
Middle East& Africa
AsiaPacific

10
Ford Credit Key Metrics
• Strong 4Q and best FY EBT at Ford Credit in 8 years
• U.S. consumer credit metrics healthy with improved LTR
• Balance sheet and liquidity remain strong; managed leverage within target range of 8:1 to 9:1
2018 H / (L)
FOURTH QUARTER
2017 2018 H / (L)2017
FULL YEAR
Other Balance Sheet Metrics
* See Appendix for reconciliation to GAAP and definitions** U.S. retail and lease
*** U.S. 36-month off-lease fourth quarter auction values at 4Q 2018 mix, full year auction values at FY 2018 mix
Net Receivables (Bils) 143$ 146$ 3 % 143$ 146$ 3 %
Managed Receivables* (Bils) 151$ 155$ 3 % 151$ 155$ 3 %
Loss-to-Receivables** (LTR) 60 bps 55 bps (5) bps 53 bps 46 bps (7) bps
Auction Values*** 17,505$ 17,865$ 2 % 17,430$ 18,055$ 4 %
Earnings Before Taxes (EBT) (Mils) 610$ 663$ 53$ 2,310$ 2,627$ 317$
ROE (Pct) 50 % 14 % (36) ppt 22 % 14 % (8) ppts
Debt (Bils) 138$ 140$ 2 %
Liquidity (Bils) 30$ 27$ (7) %
Financial Statement Leverage (to 1) 8.7 9.4 0.7
Managed Leverage* (to 1) 8.0 8.8 0.8

11
• 4Q and FY Company adj. operating cash flow at $1.5B and $2.8B, respectively
• Company cash and liquidity balances remain strong
• Committed to maintaining an investment grade credit rating and debt capacity; fully funded and de-risked global funded pension plans; and cash balances and liquidity at or above $20B and $30B, respectively
Company Cash Flow And Balance Sheet (Bils)
2017Dec 31
2018Dec 31
Balance Sheet and Liquidity
Company Cash Flow
20174Q
20184Q
2017FY
2018FY
* See Appendix for reconciliation to GAAP and definitions
Company Adj. Op. Cash Flow* 2.2$ 1.5$ 4.2$ 2.8$ Change in Company Cash 0.3 (0.6) (1.0) (3.4)
Company Excluding Ford CreditCompany Cash* 26.5$ 23.1$ Liquidity 37.4 34.2
Debt (16.5)$ (14.1)$ Cash Net of Debt 10.0 8.9
Pension Funded StatusFunded Plans (0.1)$ (0.3)$ Unfunded Plans (6.5) (6.0)
Total Global Pension (6.6)$ (6.3)$
Total Funded Status OPEB (6.2)$ (5.6)$
12
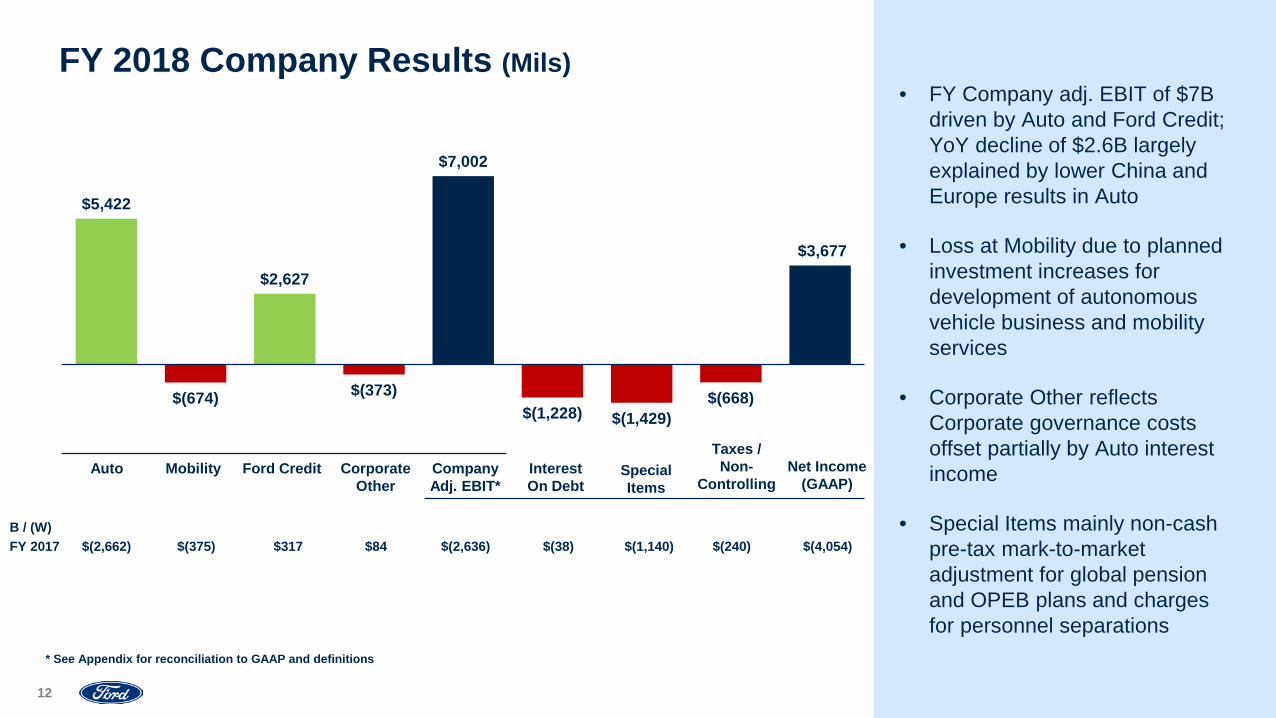
• FY Company adj. EBIT of $7B driven by Auto and Ford Credit; YoY decline of $2.6B largely explained by lower China and Europe results in Auto
• Loss at Mobility due to planned investment increases for development of autonomous vehicle business and mobility services
• Corporate Other reflects Corporate governance costs offset partially by Auto interest income
• Special Items mainly non-cash pre-tax mark-to-market adjustment for global pension and OPEB plans and charges for personnel separations
FY 2018 Company Results (Mils)
Auto Net Income (GAAP)
Ford CreditMobility Corporate Other
Company Adj. EBIT*
Interest On Debt
SpecialItems
Taxes / Non-
Controlling
B / (W) FY 2017 $(2,662) $(375) $317 $84 $(2,636) $(38) $(1,140) $(240) $(4,054)
$5,422
$(674)
$2,627
$(373)
$7,002
$(1,228) $(1,429)$(668)
$3,677
* See Appendix for reconciliation to GAAP and definitions

13
$5,422
$7,607
$(678) $(398) $(7)
$(1,102)
• FY Automotive EBIT of $5.4B driven by North America
• North America EBIT lower YoY due to higher warranty cost
• Operations outside North America at an EBIT loss of $2.2B, compared to last year’s breakeven result. Loss driven by Asia Pacific (China), South America and Europe
• Non-North America YoY decline represents over 80% of lower Auto EBIT; results down $1.7B in China and $0.8B in Europe
FY 2018 Automotive EBIT By Region (Mils)
$(2,185)
B / (W)FY 2017 $(2,662) $(450) $75 $(765) $239 $(1,761)
SouthAmericaAutomotive
NorthAmerica Europe
Middle East& Africa
AsiaPacific
14
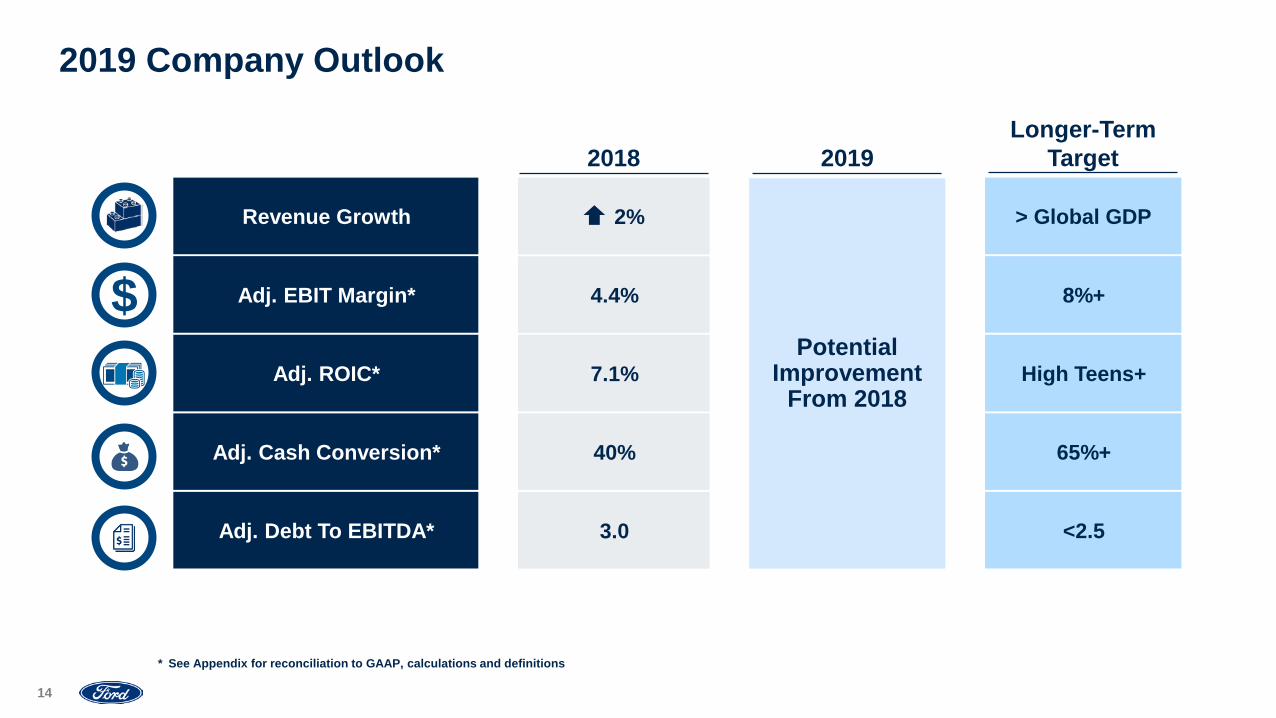
2019 Company Outlook
* See Appendix for reconciliation to GAAP, calculations and definitions
2019
Potential Improvement
From 2018
2018
2%
4.4%
7.1%
40%
3.0
> Global GDP
8%+
High Teens+
65%+
<2.5
Longer-Term Target
Revenue Growth
Adj. EBIT Margin*
Adj. ROIC*
Adj. Cash Conversion*
Adj. Debt To EBITDA*
$

15
Actions to Improve Performance
Growth
Improved dealer engagement and profitability
Right-sized inventory
Lower material costs through local sourcing
Significant reduction in structural costs for consolidated operations
Profitability
Extend brand leadership in LCV share from 14.1%
Ranger and Transit upgrades; Transit PHEV
Higher than segment average transaction prices on all-new Focus and Escort
10 new product launches in 2019
Focus on higher margin sub brands
Reduce passenger vehicle complexity
Prioritize higher-margin markets
Significant reduction in personnel and structural costs
Improve or exit unprofitable products and markets
China Europe

Questions & Answers

17
OurBelief
Our Plan for Value Creation
Creating Tomorrow, Together
WinningPortfolio
Propulsion Choices
Autonomous Technology
MobilityExperiences
Operating LeverageBuild, Partner, BuyCapital Efficiency
Strong Balance Sheet
Fitness
Culture & Values
MetricsGrowth
EBIT MarginROIC
Cash Flow
Passion for Product & Deep Customer Insight
Our People
OurAspiration
Freedom of movement drives human progress.
To become the world’s most trusted company,designing smart vehicles for a smart world.
• 2018 laid the foundation for global redesign
• 2019 clear vision to improve profitability and returns; now in execution mode
• Decisive actions to address underperforming parts of the business and to allocate capital to higher-return opportunities
• More specifics on global redesign in the coming months
Supplemental MaterialsFinancial Review

19
• 4Q Company revenue of $42B up 1%; driven by favorable mix and higher net pricing in North America
4Q 2018 Company Revenue YoY Bridge (Bils)
Volume Mix OtherNet
Pricing 4Q 20184Q 2017 Exchange

20
• FY Company revenue of $160B up 2%; driven by favorable mix, mainly North America, and higher net pricing in all regions except China
FY 2018 Company Revenue YoY Bridge (Bils)
Volume Mix OtherNet
Pricing 20182017 Exchange

21
Global SAAR (Mils) 99.6 90.8 (9) % 95.0 94.2 (1) %
Market Share (Pct) 6.6 % 5.9 % (0.7) ppts 7.0 % 6.3 % (0.7) ppts
Wholesales (000) 1,749 1,474 (16) % 6,607 5,982 (9) %
Revenue (Bils) 38.5$ 38.7$ 1 % 145.7$ 148.3$ 2 %
EBIT (Mils) 1,635$ 1,131$ (504)$ 8,084$ 5,422$ (2,662)$
EBIT Margin (Pct) 4.3 % 2.9 % (1.4) ppts 5.6 % 3.7 % (1.9) ppts
Launched all-new Ford Ranger at Michigan Assembly Plant
• 4Q Automotive key metrics lower YoY except revenue
• Global SAAR down 9% driven by China with smaller declines in Europe and North America
• Global market share lower with declines in all regions except Europe
• Lower volume due mainly to joint ventures in China and Turkey
Automotive Key MetricsFOURTH QUARTER FULL YEAR
2018 H / (L)20172018 H / (L)2017
Volume /Mix
NetPricing OtherCost 4Q 20184Q 2017
22
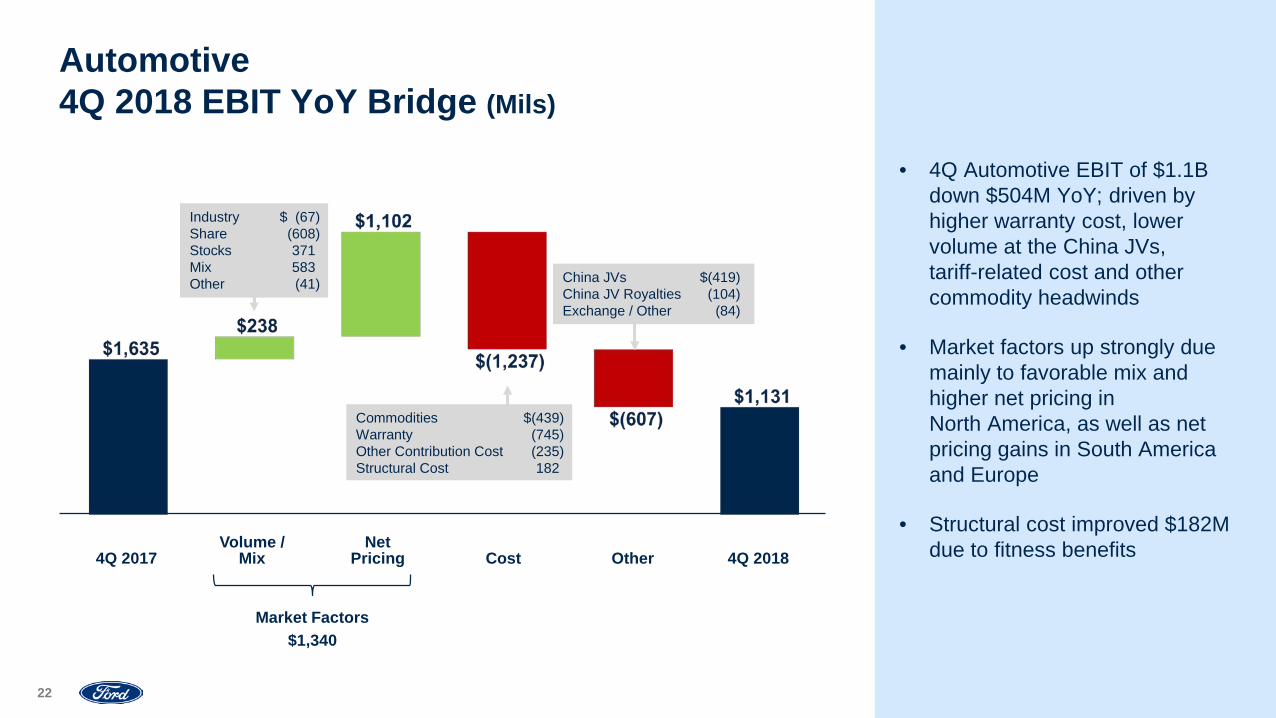
Automotive4Q 2018 EBIT YoY Bridge (Mils)
• 4Q Automotive EBIT of $1.1B down $504M YoY; driven by higher warranty cost, lower volume at the China JVs, tariff-related cost and other commodity headwinds
• Market factors up strongly due mainly to favorable mix and higher net pricing in North America, as well as net pricing gains in South America and Europe
• Structural cost improved $182M due to fitness benefits
Industry $ (67)Share (608)Stocks 371Mix 583Other (41) China JVs $(419)
China JV Royalties (104)Exchange / Other (84)
$1,340Market Factors
Commodities $(439)Warranty (745)Other Contribution Cost (235)Structural Cost 182
Volume /Mix
NetPricing OtherCost 20182017
23
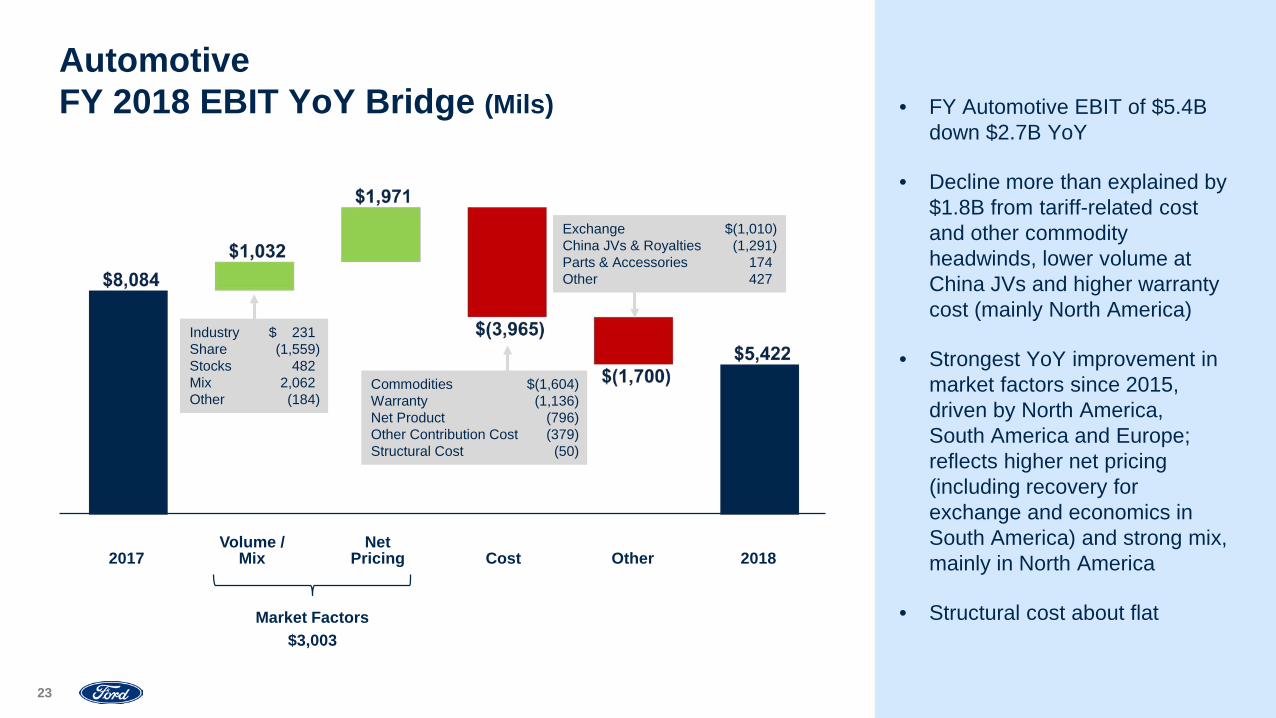
AutomotiveFY 2018 EBIT YoY Bridge (Mils) • FY Automotive EBIT of $5.4B
down $2.7B YoY
• Decline more than explained by $1.8B from tariff-related costand other commodity headwinds, lower volume at China JVs and higher warranty cost (mainly North America)
• Strongest YoY improvement in market factors since 2015, driven by North America, South America and Europe; reflects higher net pricing (including recovery for exchange and economics in South America) and strong mix, mainly in North America
• Structural cost about flat
Industry $ 231Share (1,559)Stocks 482Mix 2,062Other (184)
Exchange $(1,010)China JVs & Royalties (1,291)Parts & Accessories 174Other 427
$3,003Market Factors
Commodities $(1,604)Warranty (1,136)Net Product (796)Other Contribution Cost (379)Structural Cost (50)
24
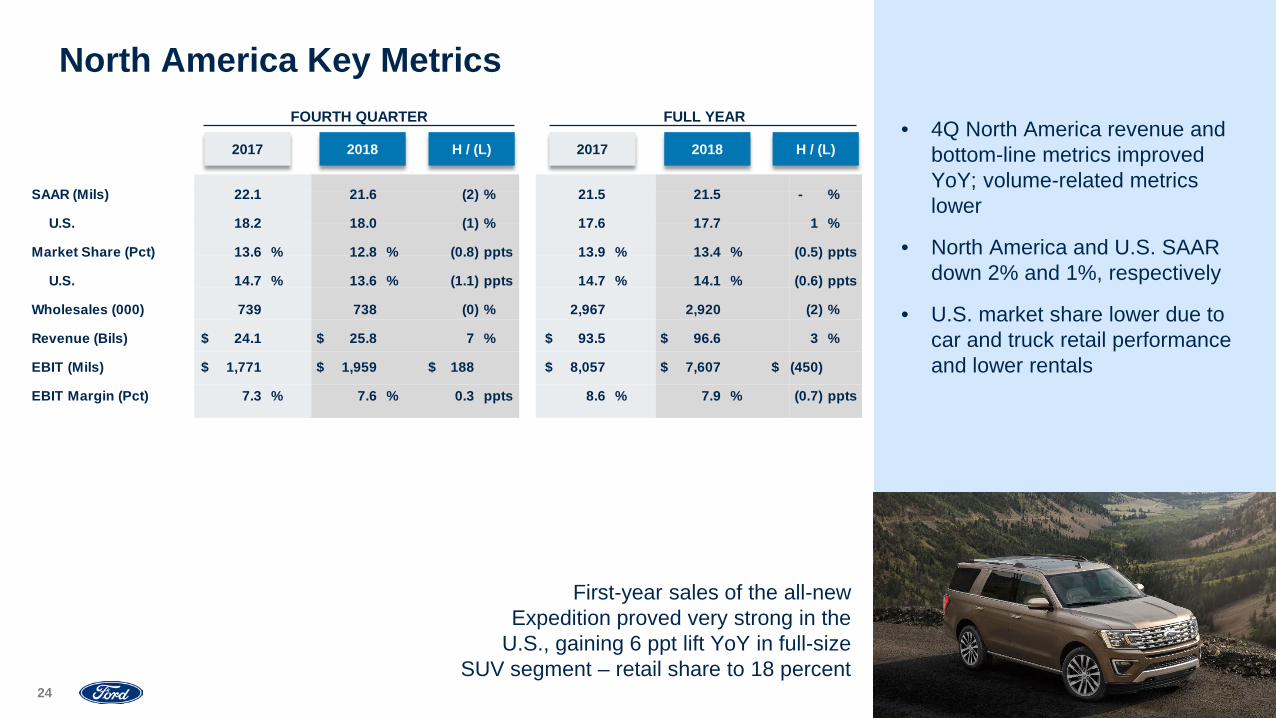
SAAR (Mils) 22.1 21.6 (2) % 21.5 21.5 - %
U.S. 18.2 18.0 (1) % 17.6 17.7 1 %
Market Share (Pct) 13.6 % 12.8 % (0.8) ppts 13.9 % 13.4 % (0.5) ppts
U.S. 14.7 % 13.6 % (1.1) ppts 14.7 % 14.1 % (0.6) ppts
Wholesales (000) 739 738 (0) % 2,967 2,920 (2) %
Revenue (Bils) 24.1$ 25.8$ 7 % 93.5$ 96.6$ 3 %
EBIT (Mils) 1,771$ 1,959$ 188$ 8,057$ 7,607$ (450)$
EBIT Margin (Pct) 7.3 % 7.6 % 0.3 ppts 8.6 % 7.9 % (0.7) ppts
First-year sales of the all-new Expedition proved very strong in the
U.S., gaining 6 ppt lift YoY in full-size SUV segment – retail share to 18 percent
• 4Q North America revenue and bottom-line metrics improved YoY; volume-related metrics lower
• North America and U.S. SAAR down 2% and 1%, respectively
• U.S. market share lower due to car and truck retail performance and lower rentals
North America Key MetricsFOURTH QUARTER FULL YEAR
2018 H / (L)20172018 H / (L)2017

Volume /Mix
NetPricing OtherCost 4Q 20184Q 2017
25
North America 4Q 2018 EBIT YoY Bridge (Mils)
• 4Q North America EBIT at $2B, up $188M YoY
• Healthy improvement in market factors due to strong mix and higher net pricing
• Headwinds represented by higher warranty and commodity costs, including tariff-related effects
• Structural cost flat
Industry $ 49Share (569)Stocks 495Mix 444Other (47)
$1,001Market Factors
Commodities $(301)Warranty (707)Other Cost (42)

Volume /Mix
NetPricing OtherCost 20182017
26
North America FY 2018 EBIT YoY Bridge (Mils)
• FY North America EBIT of $7.6B, down $450M YoY
• EBIT decline mainly reflects higher commodity cost, including tariff-related effects, and warranty cost; higher structural cost due to increased non-cash depreciation and amortization expense
• Market factors up strongly due to favorable mix and higher net pricing
Industry $ 219Share (1,272)Stocks 651Mix 1,919Other 70
$2,012Market Factors
Commodities $(1,108)Warranty (1,070)Other Contribution Cost (603)Structural Cost (265)
27
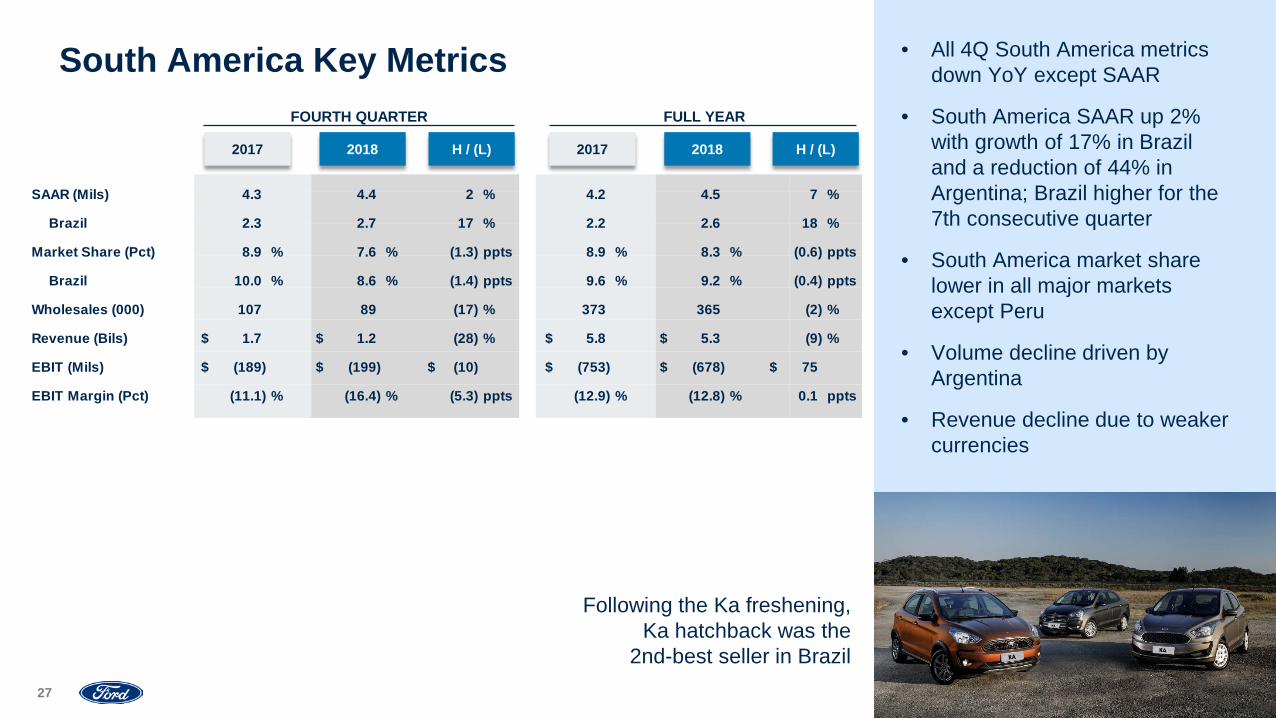
SAAR (Mils) 4.3 4.4 2 % 4.2 4.5 7 %
Brazil 2.3 2.7 17 % 2.2 2.6 18 %
Market Share (Pct) 8.9 % 7.6 % (1.3) ppts 8.9 % 8.3 % (0.6) ppts
Brazil 10.0 % 8.6 % (1.4) ppts 9.6 % 9.2 % (0.4) ppts
Wholesales (000) 107 89 (17) % 373 365 (2) %
Revenue (Bils) 1.7$ 1.2$ (28) % 5.8$ 5.3$ (9) %
EBIT (Mils) (189)$ (199)$ (10)$ (753)$ (678)$ 75$
EBIT Margin (Pct) (11.1) % (16.4) % (5.3) ppts (12.9) % (12.8) % 0.1 ppts
Following the Ka freshening, Ka hatchback was the
2nd-best seller in Brazil
• All 4Q South America metrics down YoY except SAAR
• South America SAAR up 2% with growth of 17% in Brazil and a reduction of 44% in Argentina; Brazil higher for the 7th consecutive quarter
• South America market share lower in all major markets except Peru
• Volume decline driven by Argentina
• Revenue decline due to weaker currencies
South America Key MetricsFOURTH QUARTER FULL YEAR
2018 H / (L)20172018 H / (L)2017

Volume /Mix
NetPricing OtherCost 4Q 20184Q 2017
28
South America 4Q 2018 EBIT YoY Bridge (Mils)
• 4Q South America EBIT loss of $199M, about flat from year ago
• Higher net pricing and favorable cost performance about offset by weaker currencies and inflationary effects, including higher commodities
$241Market Factors
Exchange $(184)Other 12
Commodities $ (74)Other Inflationary Cost (130)Cost Performance 125

Volume /Mix
NetPricing OtherCost 20182017
29
South America FY 2018 EBIT YoY Bridge (Mils)
• FY South America EBIT loss of $678M improved $75M YoY
• Higher net pricing and favorable cost performance about offset by weaker currencies and inflationary effects, including higher commodities
• Higher industry volume flows through to improved EBIT loss
$882Market Factors
Exchange $(451)Other 67
Commodities $(224)Other Inflationary Cost (407)Cost Performance 208
Industry $ 76Other (15)
30
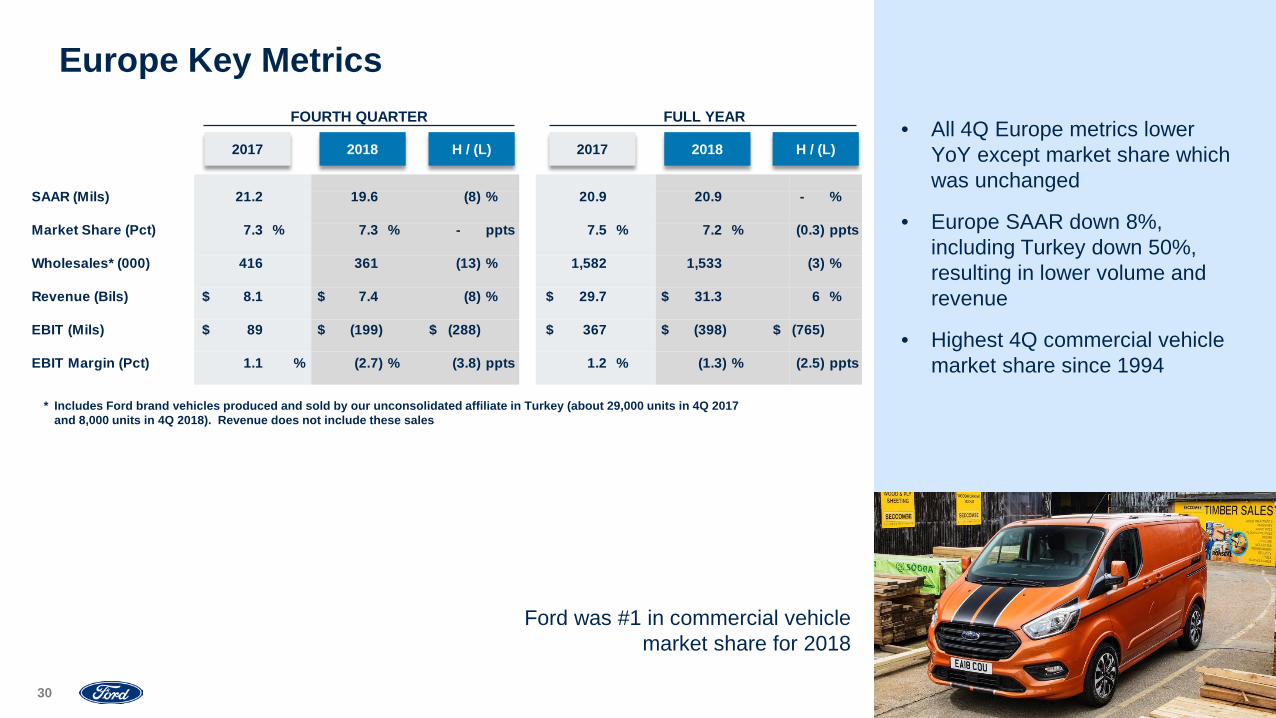
SAAR (Mils) 21.2 19.6 (8) % 20.9 20.9 - %
Market Share (Pct) 7.3 % 7.3 % - ppts 7.5 % 7.2 % (0.3) ppts
Wholesales* (000) 416 361 (13) % 1,582 1,533 (3) %
Revenue (Bils) 8.1$ 7.4$ (8) % 29.7$ 31.3$ 6 %
EBIT (Mils) 89$ (199)$ (288)$ 367$ (398)$ (765)$
EBIT Margin (Pct) 1.1 % (2.7) % (3.8) ppts 1.2 % (1.3) % (2.5) ppts
Ford was #1 in commercial vehicle market share for 2018
• All 4Q Europe metrics lower YoY except market share which was unchanged
• Europe SAAR down 8%, including Turkey down 50%, resulting in lower volume and revenue
• Highest 4Q commercial vehicle market share since 1994
Europe Key Metrics
* Includes Ford brand vehicles produced and sold by our unconsolidated affiliate in Turkey (about 29,000 units in 4Q 2017 and 8,000 units in 4Q 2018). Revenue does not include these sales
FOURTH QUARTER FULL YEAR
2018 H / (L)20172018 H / (L)2017

Volume /Mix
NetPricing OtherCost 4Q 20184Q 2017
31
Europe 4Q 2018 EBIT YoY Bridge (Mils)
• 4Q Europe EBIT loss at $199M – an EBIT decline of $288M YoY
• Decline due mainly to higher cost, adverse exchange and lower industry volume; higher net pricing a partial offset
$152Market Factors
Net Product $(75)Other Contribution Cost (157)Structural Cost (40)
Industry $(73)Share 62Stocks (69)Mix 84Other (71)
Exchange $(89)Parts & Accessories (29)Other (50)
Volume /Mix
NetPricing OtherCost 20182017
32
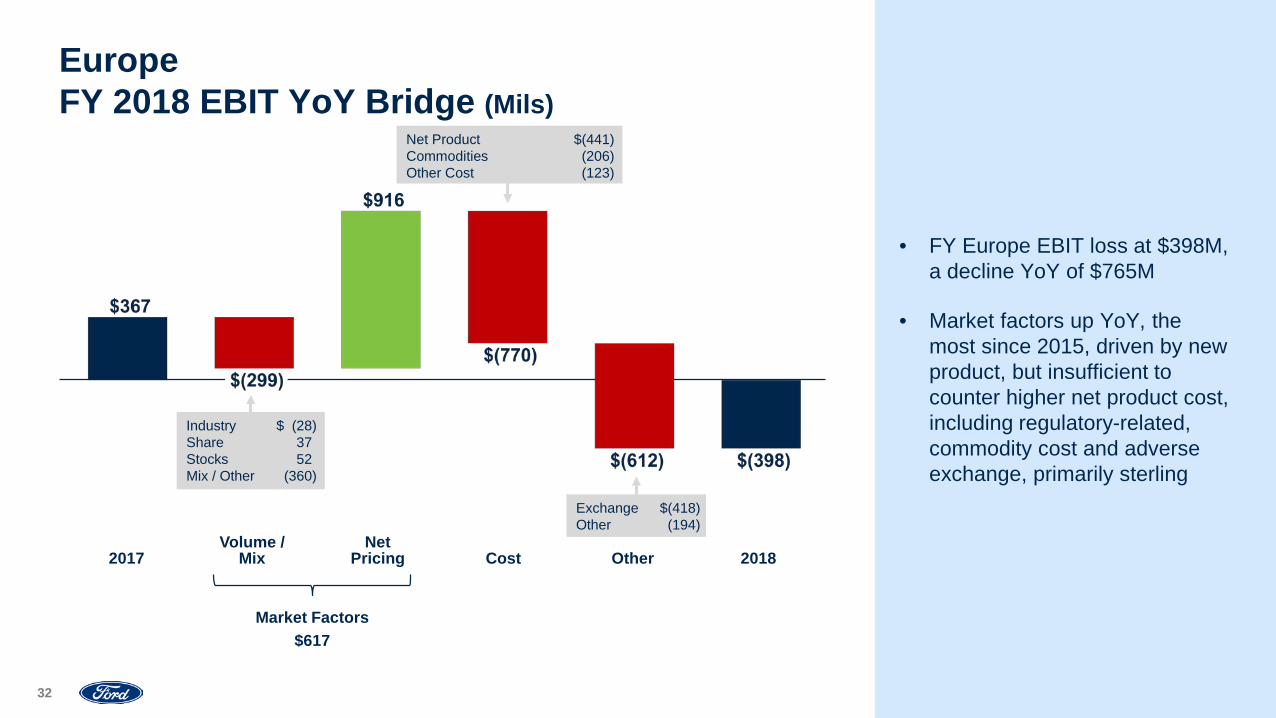
Europe FY 2018 EBIT YoY Bridge (Mils)
• FY Europe EBIT loss at $398M, a decline YoY of $765M
• Market factors up YoY, the most since 2015, driven by new product, but insufficient to counter higher net product cost, including regulatory-related, commodity cost and adverse exchange, primarily sterling
Exchange $(418)Other (194)
$617Market Factors
Net Product $(441)Commodities (206)Other Cost (123)
Industry $ (28)Share 37Stocks 52Mix / Other (360)

33
SAAR (Mils) 3.7 3.9 5 % 3.6 3.8 6 %
Market Share (Pct) 4.3 % 3.0 % (1.3) ppts 3.8 % 3.0 % (0.8) ppts
Wholesales (000) 35 32 (9) % 119 109 (8) %
Revenue (Bils) 0.8$ 0.7$ (12) % 2.6$ 2.7$ 2 %
EBIT (Mils) (66)$ (49)$ 17$ (246)$ (7)$ 239$
EBIT Margin (Pct) (8.3) % (7.0) % 1.3 ppts (9.3) % (0.3) % 9.0 ppts
Launched mobility and future transportation workshop for young entrepreneurs as part of
Henry Ford Entrepreneurship Academy in Dubai
• 4Q MEA top-line metrics lower YoY; EBIT and EBIT margin higher
• MEA SAAR up 5%, though down 9% in markets where we participate
• Market share lower in most major markets; key driver of lower volume
• Revenue down because of lower volume
Middle East & Africa Key MetricsFOURTH QUARTER FULL YEAR
2018 H / (L)20172018 H / (L)2017
Volume /Mix
NetPricing OtherCost 4Q 20184Q 2017
34
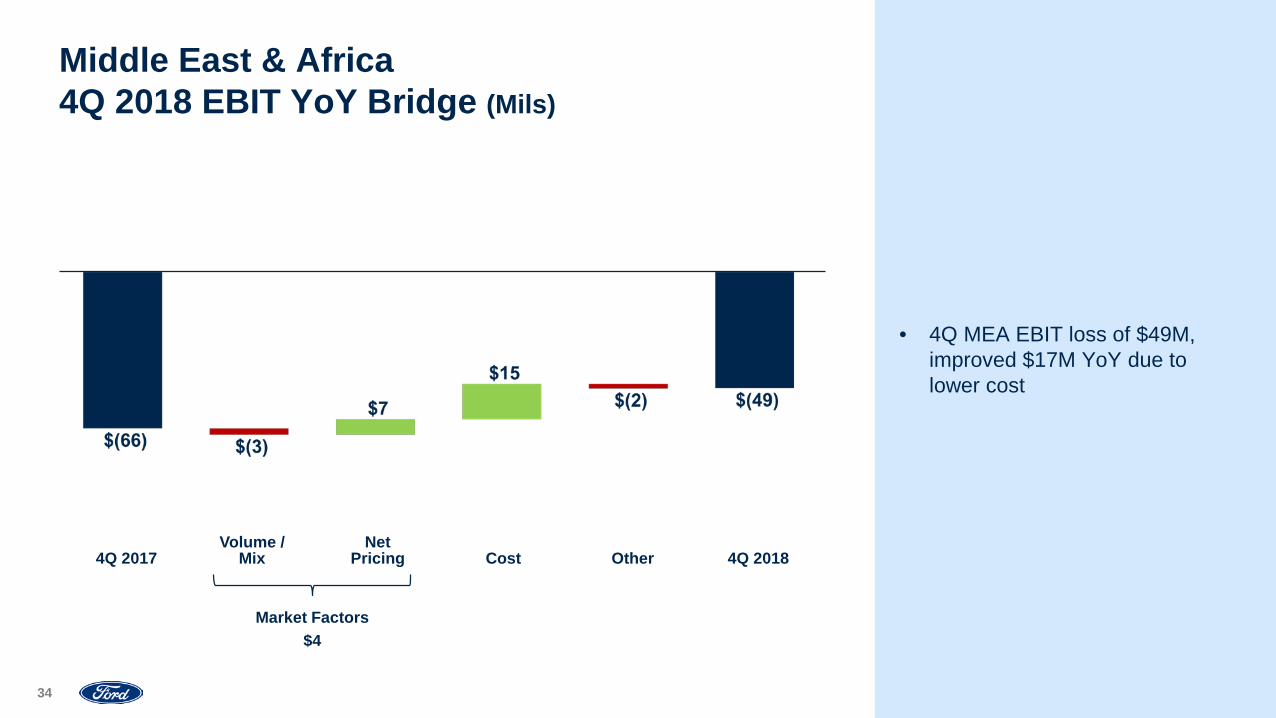
Middle East & Africa4Q 2018 EBIT YoY Bridge (Mils)
• 4Q MEA EBIT loss of $49M, improved $17M YoY due to lower cost
$4Market Factors
Volume /Mix
NetPricing OtherCost 20182017
35
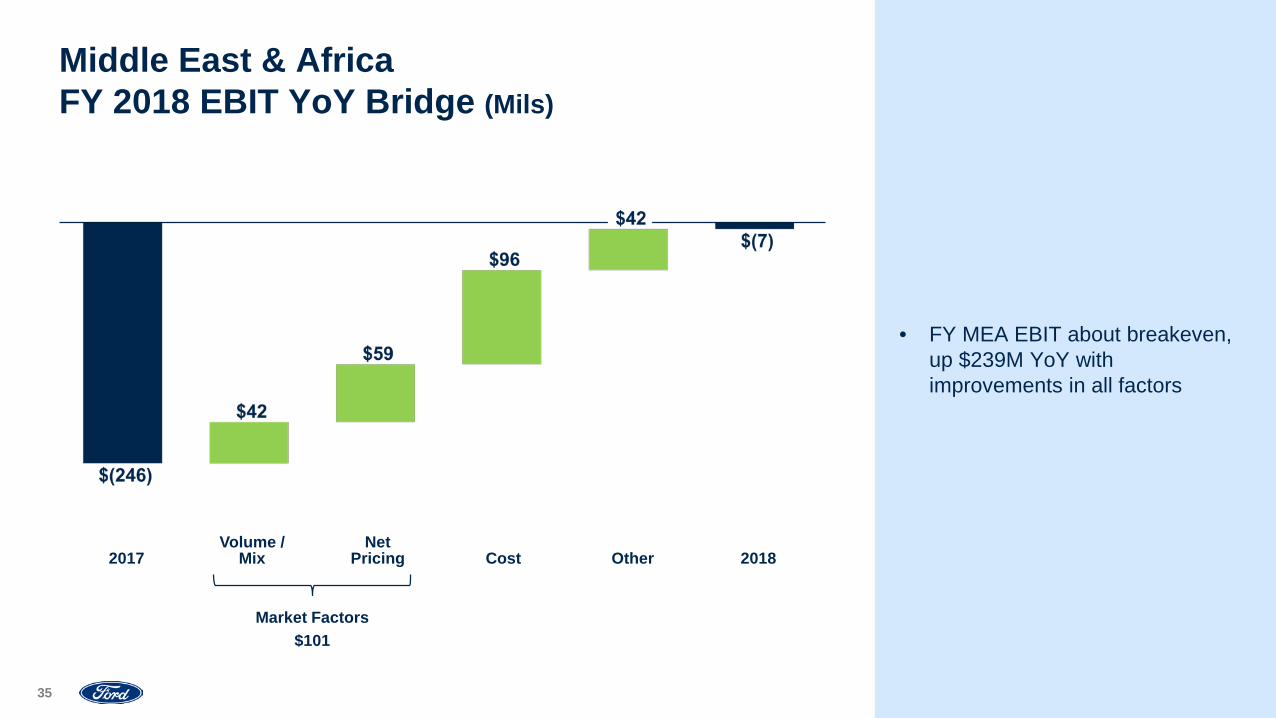
Middle East & AfricaFY 2018 EBIT YoY Bridge (Mils)
• FY MEA EBIT about breakeven, up $239M YoY with improvements in all factors
$101Market Factors
36
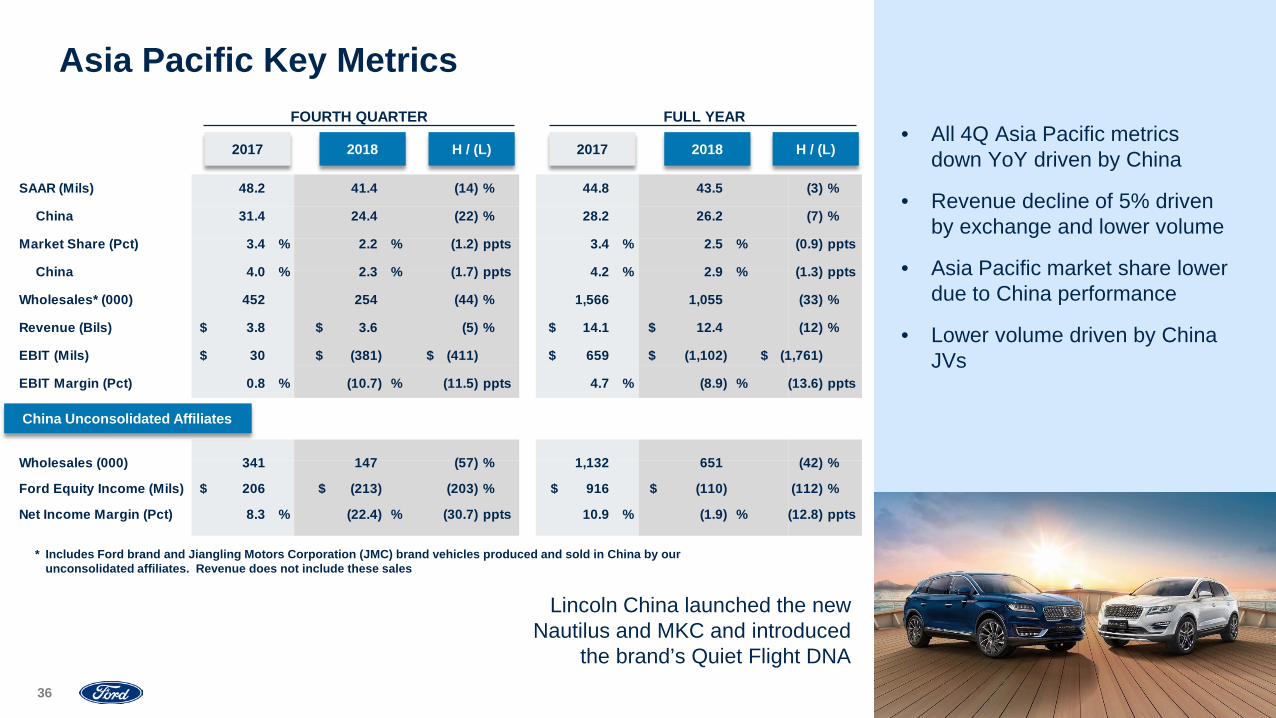
Lincoln China launched the new Nautilus and MKC and introduced
the brand’s Quiet Flight DNA
• All 4Q Asia Pacific metrics down YoY driven by China
• Revenue decline of 5% driven by exchange and lower volume
• Asia Pacific market share lower due to China performance
• Lower volume driven by China JVs
Asia Pacific Key Metrics
* Includes Ford brand and Jiangling Motors Corporation (JMC) brand vehicles produced and sold in China by our unconsolidated affiliates. Revenue does not include these sales
China Unconsolidated Affiliates
FOURTH QUARTER FULL YEAR
2018 H / (L)20172018 H / (L)2017
SAAR (Mils) 48.2 41.4 (14) % 44.8 43.5 (3) %
China 31.4 24.4 (22) % 28.2 26.2 (7) %
Market Share (Pct) 3.4 % 2.2 % (1.2) ppts 3.4 % 2.5 % (0.9) ppts
China 4.0 % 2.3 % (1.7) ppts 4.2 % 2.9 % (1.3) ppts
Wholesales* (000) 452 254 (44) % 1,566 1,055 (33) %
Revenue (Bils) 3.8$ 3.6$ (5) % 14.1$ 12.4$ (12) %
EBIT (Mils) 30$ (381)$ (411)$ 659$ (1,102)$ (1,761)$
EBIT Margin (Pct) 0.8 % (10.7) % (11.5) ppts 4.7 % (8.9) % (13.6) ppts
Wholesales (000) 341 147 (57) % 1,132 651 (42) %
Ford Equity Income (Mils) 206$ (213)$ (203) % 916$ (110)$ (112) %
Net Income Margin (Pct) 8.3 % (22.4) % (30.7) ppts 10.9 % (1.9) % (12.8) ppts

Volume /Mix
NetPricing OtherCost 4Q 20184Q 2017
37
Asia Pacific 4Q 2018 EBIT YoY Bridge (Mils)
• 4Q Asia Pacific EBIT at $381M loss, down $411M YoY – China down $515M with Other Asia Pacific up $104M
• Lower China result due entirely to lower JV equity income and lower royalties driven by lower JV volume
• China JVs equity income at loss of $213M, down $419M
$(58)Market Factors
China JVs $(419)JV Royalties (89) Exchange / Other 6
Contribution Cost $53Structural Cost 96

38
• 4Q China EBIT loss at $534M –$213M at JVs and $321M at consolidated operations
• China EBIT YoY decline of $515M driven by China JVs –mainly lower volume and net pricing – and lower royalty income because of the lower JV volume
• Other Asia Pacific EBIT at $153M, up $104M due to lower cost
China4Q 2018 EBIT YoY Bridge (Mils)
$(79)Market Factors
Net Equity Income $(419)Royalties (104)
Other AP $49 $(14) $36 $116 $20 $(54) $153
Volume /Mix
NetPricing OtherCost 4Q 20184Q 2017 JVs

Volume /Mix
NetPricing OtherCost 20182017
39
Asia Pacific FY 2018 EBIT YoY Bridge (Mils)
• FY Asia Pacific EBIT loss at $1.1B, down $1.8B YoY –$1.7B in China and $0.1B in Other Asia Pacific
• China EBIT decline due to lower JV equity income, unfavorable volume and lower net pricing for Explorer and Lincoln imports and lower royalties driven by lower JV volume
• China JVs equity income at loss of $110M, down $1B
• Lower Other Asia Pacific EBIT due to unfavorable exchange, primarily Thai baht and Australian dollar
$(609)Market Factors
Exchange $ (199)China JVs (1,025)JV Royalties (204)Other 98
Industry $ (22)Share (142)Stocks (261)Mix 70Other (4)
Contribution Cost $ 57Structural Cost 121

40
• FY China EBIT loss at $1.5B –$110M at JVs and $1.4B at consolidated operations
• China EBIT YoY decline of $1.7B largely due to China JVs –mainly lower volume and net pricing
• Consolidated China EBIT decline due to lower volume and net pricing for Explorer and Lincoln imports and lower royalties driven by lower JV volume
• Other Asia Pacific EBIT at $444M, down $63M due to unfavorable exchange
ChinaFY 2018 EBIT YoY Bridge (Mils)
$(498)Market Factors
Net Equity Income $(1,025)Royalties (266)
Other AP $507 $(146) $35 $106 $62 $(120) $444
Volume /Mix
NetPricing OtherCost 20182017 JVs

41
EBIT (Mils) (100)$ (195)$ (95)$ (299)$ (674)$ (375)$ • 4Q Mobility EBIT loss of $195M,
down $95M due to increased investment for mobility services and AV business development
Mobility Key Metrics And 4Q 2018 EBIT YoY Bridge (Mils)
Ford Smart Mobility
AutonomousVehicles 4Q 20184Q 2017
4Q 2018 EBIT YoY Bridge
Key Metrics
FOURTH QUARTER FULL YEAR
2018 H / (L)20172018 H / (L)2017
42
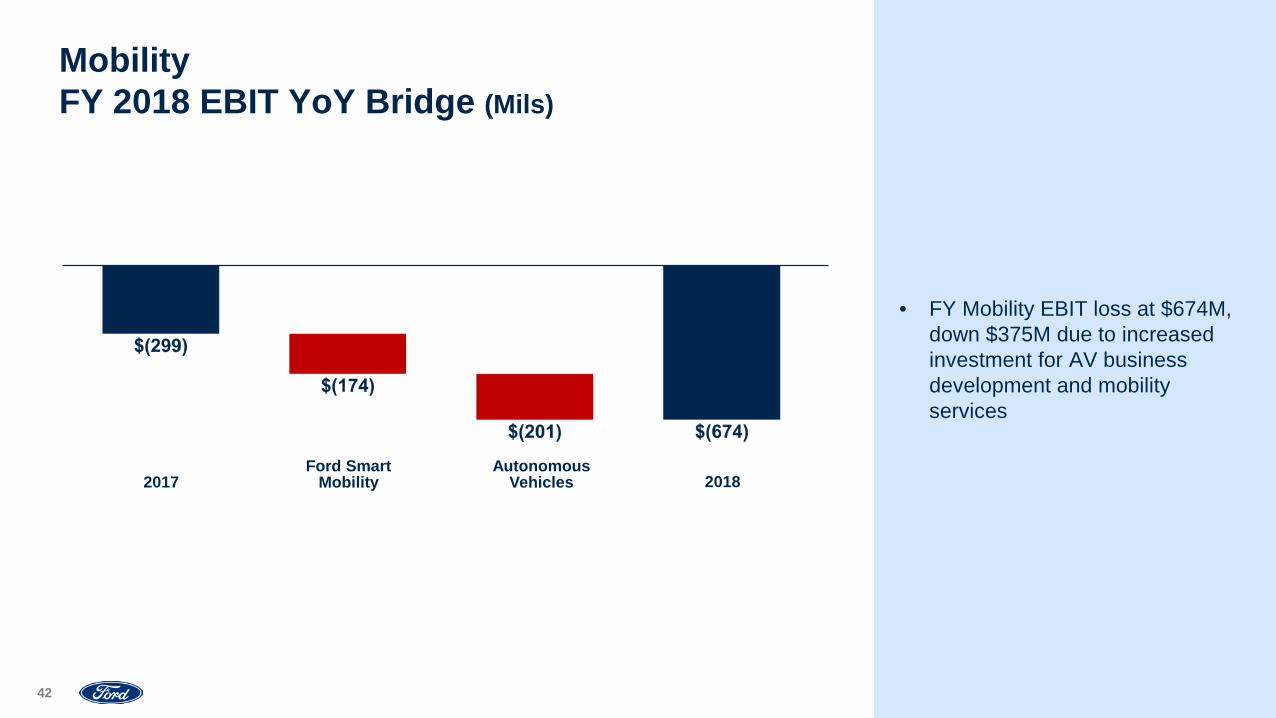
• FY Mobility EBIT loss at $674M, down $375M due to increased investment for AV business development and mobility services
Mobility FY 2018 EBIT YoY Bridge (Mils)
Ford Smart Mobility
AutonomousVehicles 20182017

43
Volume /Mix
FinancingMargin
LeaseResidual
Credit Loss 4Q 20184Q 2017 Exchange Other
Ford Credit 4Q 2018 EBT YoY Bridge (Mils)
• 4Q Ford Credit EBT at $663M, up $53M YoY driven by favorable lease residual performance and volume and mix
Supplemental Depreciation $129Residual Losses (38)

44
Volume /Mix
FinancingMargin
LeaseResidual
Credit Loss 20182017 Exchange Other
Ford Credit FY 2018 EBT YoY Bridge (Mils)
• FY Ford Credit EBT at $2.6B, up $317M YoY; reflects favorable lease residual performance, driven by higher auction values, and volume and mix
• Other primarily reflects unfavorable derivatives market valuation
Supplemental Depreciation $193Residual Losses 127
DMV $(175)Operating Costs & Other (69)

45
Ford CreditU.S. Automotive Financing Trends
• 4Q lease share flat sequentially and below industry reflecting Ford sales mix
• Expect 2019 FY average auction values to be about 4% lower YoY at constant mix
• Strong loss metrics reflect healthy consumer credit conditions
* Source: J.D. Power PIN** At 4Q 2018 mix
70 61 68 71 71 71
3Q17 4Q17 1Q18 2Q18 3Q18 4Q18
$17,830 $17,505 $17,440$18,295 $18,785
$17,865
$9.8 $10.2 $10.3 $10.0$9.5
$10.3
1.12% 1.16% 1.22%1.00% 1.07% 1.07%
3Q17 4Q17 1Q18 2Q18 3Q18 4Q18
Lease Share of Retail Sales (Pct)
Retail and Lease Repossession Ratio (Pct)and Severity (000)
Lease Return Vol. (000) and Auction Values**
19% 17%23% 23% 21% 21%
28% 28%31% 30% 29% 29%
3Q17 4Q17 1Q18 2Q18 3Q18 4Q18
Retail and Lease Charge-Offs (Mils)and LTR Ratio (Pct)
$95 $109$93
$66$83
$106
0.53% 0.60% 0.51% 0.36% 0.44% 0.55%
3Q17 4Q17 1Q18 2Q18 3Q18 4Q18
36-Month Return VolumeFord Credit Industry*
LTR Charge-OffsRepo Ratio Severity

46
Company Adjusted EBIT* 2.0$ 1.5$ 9.6$ 7.0$ Excluding: Ford Credit EBT (0.6) (0.7) (2.3) (2.6)
Subtotal 1.4$ 0.8$ 7.3$ 4.4$
Capital spending (2.1)$ (2.1)$ (7.0)$ (7.7)$ Depreciation and tooling amortization 1.3 1.4 5.0 5.4
Net spending (0.8)$ (0.7)$ (2.0)$ (2.4)$
Changes in working capital 0.9 0.4 - (0.9)Ford Credit distributions - 0.7 0.4 2.7All other and timing differences 0.7 0.3 (1.5) (1.1)
Company adjusted operating cash flow* 2.2$ 1.5$ 4.2$ 2.8$
Separation payments (0.2) (0.1) (0.3) (0.2)Other transactions with Ford Credit - - (0.1) (0.2)Other, including acquisitions and divestitures (0.2) - (0.2) (0.5)
Cash flow before other actions 1.8$ 1.4$ 3.6$ 1.9$
Changes in debt (0.2) (1.2) (0.4) (1.8)Funded pension contributions (0.7) (0.2) (1.4) (0.4)Shareholder distributions (0.6) (0.6) (2.7) (3.1)
Change in cash 0.3$ (0.6)$ (1.0)$ (3.4)$
• 4Q and FY Company adj. operating cash flow positive driven by EBIT and Ford Credit distributions
• FY global funded pension contributions of $0.4B
• FY shareholder distributions of $3.1B
Company Cash Flow (Bils)
* See Appendix for reconciliation to GAAP and definitions
FOURTH QUARTER FULL YEAR
20182017 20182017

47
Cautionary Note On Forward-Looking StatementsStatements included or incorporated by reference herein may constitute “forward-looking statements” within the meaning of the Private Securities Litigation Reform Act of 1995. Forward-looking statements are based on expectations, forecasts, and assumptions by our management and involve a number of risks, uncertainties, and other factors that could cause actual results to differ materially from those stated, including, without limitation:• Ford’s long-term competitiveness depends on the successful execution of fitness actions;• Industry sales volume, particularly in the United States, Europe, or China, could decline if there is a financial crisis, recession, or significant geopolitical event;• Ford’s new and existing products and mobility services are subject to market acceptance;• Ford’s results are dependent on sales of larger, more profitable vehicles, particularly in the United States;• Ford may face increased price competition resulting from industry excess capacity, currency fluctuations, or other factors;• Fluctuations in commodity prices, foreign currency exchange rates, and interest rates can have a significant effect on results;• With a global footprint, Ford’s results could be adversely affected by economic, geopolitical, protectionist trade policies, or other events;• Ford’s production, as well as Ford’s suppliers’ production, could be disrupted by labor disputes, natural or man-made disasters, financial distress, production difficulties, or other factors;• Ford’s ability to maintain a competitive cost structure could be affected by labor or other constraints;• Pension and other postretirement liabilities could adversely affect Ford’s liquidity and financial condition;• Economic and demographic experience for pension and other postretirement benefit plans (e.g., discount rates or investment returns) could be worse than Ford has assumed;• Ford’s vehicles could be affected by defects that result in delays in new model launches, recall campaigns, or increased warranty costs;• Safety, emissions, fuel economy, and other regulations affecting Ford may become more stringent;• Ford could experience unusual or significant litigation, governmental investigations, or adverse publicity arising out of alleged defects in products, perceived environmental impacts, or otherwise;• Ford’s receipt of government incentives could be subject to reduction, termination, or clawback;• Operational systems, security systems, and vehicles could be affected by cyber incidents;• Ford Credit’s access to debt, securitization, or derivative markets around the world at competitive rates or in sufficient amounts could be affected by credit rating downgrades, market volatility, market disruption,
regulatory requirements, or other factors;• Ford Credit could experience higher-than-expected credit losses, lower-than-anticipated residual values, or higher-than-expected return volumes for leased vehicles;• Ford Credit could face increased competition from banks, financial institutions, or other third parties seeking to increase their share of financing Ford vehicles; and• Ford Credit could be subject to new or increased credit regulations, consumer or data protection regulations, or other regulations.We cannot be certain that any expectation, forecast, or assumption made in preparing forward-looking statements will prove accurate, or that any projection will be realized. It is to be expected that there may be differences between projected and actual results. Our forward-looking statements speak only as of the date of their initial issuance, and we do not undertake any obligation to update or revise publicly any forward-looking statement, whether as a result of new information, future events, or otherwise. For additional discussion, see “Item 1A. Risk Factors” in our Annual Report on Form 10-K for the year ended December 31, 2017, as updated by subsequent Quarterly Reports on Form 10-Q and Current Reports on Form 8-K.

APPENDIXADDITIONAL MATERIALSSpecial Items A12018 Results A22017 Results A3Revised Reporting – Adjusted ROIC A4Shareholder Distributions A5
RECONCILIATIONS TO GAAP Adjusted EBIT A6Adjusted Operating Cash Flow A7Adjusted Operating Cash Flow – Trailing 5 Quarters A8Adjusted Earnings Per Share A9Adjusted Effective Tax Rate A10Adjusted Debt / EBITDA A11Ford Credit Managed Receivables A12Ford Credit Managed Leverage A13
OTHEREmployment Data A14Pension Update A15Non-GAAP Financial Measures A16 - A18Definitions and Calculations A19

49
Company Special Items (Mils)
A1
2017 2018 2017 2018
Pension and OPEB gain / (loss)Year end net pension and OPEB remeasurement (162)$ (877)$ (162)$ (877)$ Other pension remeasurement - - - 26 Pension curtailment 354 - 354 15 Total Pension and OPEB gain / (loss) 192$ (877)$ 192$ (836)$
Separation-related actions (38)$ (262)$ (297)$ (537)$
Other ItemsSan Luis Potosi plant cancellation -$ -$ 41$ -$ Next-generation Focus footprint change (2) - (225) (9) Focus Active cancellation - - - (7) Chariot closure - (40) - (40) Total Other Items (2)$ (40)$ (184)$ (56)$
Total pre-tax special items 152$ (1,179)$ (289)$ (1,429)$
Tax special items 819$ (141)$ 897$ (88)$
4Q FY

50
20181Q 2Q 3Q 4Q Full Year
North America 1,935$ 1,753$ 1,960$ 1,959$ 7,607$ South America (149) (178) (152) (199) (678) Europe 119 (73) (245) (199) (398) Middle East & Africa (54) 49 47 (49) (7) Asia Pacific (119) (394) (208) (381) (1,102)
Automotive 1,732$ 1,157$ 1,402$ 1,131$ 5,422$ Mobility (102) (181) (196) (195) (674) Ford Credit 641 645 678 663 2,627 Corporate Other (86) 71 (216) (142) (373)
Adjusted EBIT 2,185$ 1,692$ 1,668$ 1,457$ 7,002$ Interest on Debt (289) (301) (343) (295) (1,228) Special Items Pre-Tax 23 (42) (231) (1,179) (1,429) Taxes (174) (280) (101) (95) (650) Less: Non-Controlling Interests 9 3 2 4 18
Net Income Attributable to Ford 1,736$ 1,066$ 991$ (116)$ 3,677$
Company Adjusted Operating Cash Flow (Bils) 3.0$ (1.8)$ 0.1$ 1.5$ 2.8$ Revenue (Bils) 42.0 38.9 37.6 41.8 160.3
Automotive Operating Margin (Pct) 4.4 % 3.2 % 4.0 % 2.9 % 3.7 %Company Adjusted EBIT Margin (Pct) 5.2 4.3 4.4 3.5 4.4 Net Income Margin (Pct) 4.1 2.7 2.6 (0.3) 2.3
Adjusted EPS – Diluted 0.43$ 0.27$ 0.29$ 0.30$ 1.30$ EPS (GAAP) – Diluted 0.43 0.27 0.25 (0.03) 0.92
China EBIT (150)$ (483)$ (378)$ (534)$ (1,545)$ Other AP EBIT 31 89 170 153 444
2018 Results (Mils)
A2

51
2017 Results (Mils)
A3
20171Q 2Q 3Q 4Q Full Year
North America 2,130$ 2,332$ 1,824$ 1,771$ 8,057$ South America (237) (177) (150) (189) (753) Europe 209 122 (53) 89 367 Middle East & Africa (75) (49) (56) (66) (246) Asia Pacific 148 167 314 30 659
Automotive 2,175$ 2,395$ 1,879$ 1,635$ 8,084$ Mobility (64) (63) (72) (100) (299) Ford Credit 481 619 600 610 2,310 Corporate Other (72) (146) (122) (117) (457)
Adjusted EBIT 2,520$ 2,805$ 2,285$ 2,028$ 9,638$ Interest on Debt (293) (291) (298) (308) (1,190) Special Items Pre-Tax 24 (248) (217) 152 (289) Taxes (652) (211) (191) 652 (402) Less: Non-Controlling Interests 7 8 7 4 26
Net Income Attributable to Ford 1,592$ 2,047$ 1,572$ 2,520$ 7,731$
Company Adjusted Operating Cash Flow (Bils) 2.0$ 1.3$ (1.3)$ 2.2$ 4.2$ Revenue (Bils) 39.1 39.9 36.5 41.3 156.8
Automotive EBIT Margin (Pct) 6.0 % 6.5 % 5.6 % 4.3 % 5.6 Company Adjusted EBIT Margin (Pct) 6.4 7.0 6.3 4.9 6.1 Net Income Margin (Pct) 4.1 5.1 4.3 6.1 4.9
Adjusted EPS – Diluted 0.40$ 0.56$ 0.44$ 0.39$ 1.78$ EPS (GAAP) – Diluted 0.40 0.51 0.39 0.63 1.93
China EBIT 47$ 23$ 102$ (20)$ 152$

52
Adjusted ROIC (Bils)
A4
* Calculated as the sum of adjusted net operating profit after cash tax from the last four quarters, divided by the average invested capital over the last four quarters
2014 2015 2016 2017 2018Adjusted Net Operating Profit After Cash Tax
Net income attributable to Ford 1.3$ 7.3$ 4.6$ 7.7$ 3.7$ Add: Non-controlling interest (0.0) (0.0) 0.0 0.0 0.0 Less: Income tax (0.0) (2.9) (2.2) (0.4) (0.7) Add: Cash tax (0.5) (0.6) (0.7) (0.6) (0.8) Less: Interest on debt (0.9) (0.8) (1.0) (1.2) (1.2) Less: Total pension / OPEB income / (cost) (4.4) (0.5) (2.7) 0.6 (0.4) Add: Pension / OPEB service costs (1.0) (1.2) (1.0) (1.1) (1.2)
Net operating profit after cash tax 5.1$ 9.8$ 8.6$ 7.0$ 4.0$ Less: Special items (excl. pension / OPEB) pre-tax (1.9) 0.2 (0.6) (0.5) (0.6)
Adj. net operating profit after cash tax 7.0$ 9.6$ 9.2$ 7.5$ 4.6$
Invested Capital
Equity 25.1$ 29.2$ 29.7$ 35.6$ 36.0$ Redeemable non-controlling interest 0.3 0.1 0.1 0.1 0.1 Debt (excl. Ford Credit) 14.5 13.4 16.5 16.5 14.1 Net pension and OPEB liability 16.2 13.9 14.7 12.8 11.9
Invested capital (end of period) 56.1$ 56.6$ 61.1$ 65.0$ 62.1$ Average invested capital 57.2$ 55.6$ 58.5$ 63.4$ 64.0$
Adjusted ROIC (Non-GAAP)* 12.3% 17.3% 15.7% 11.8% 7.1%
53
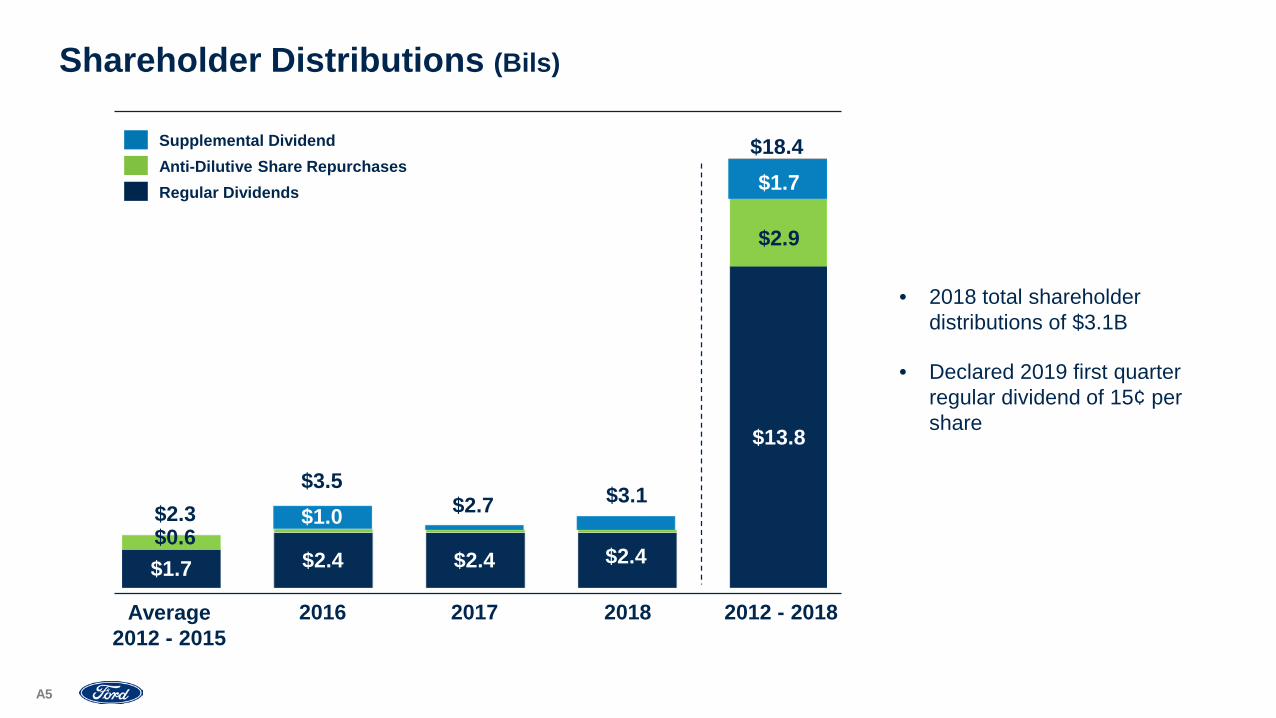
Shareholder Distributions (Bils)
• 2018 total shareholder distributions of $3.1B
• Declared 2019 first quarter regular dividend of 15¢ per share
$1.7 $2.4 $2.4 $2.4
Average2012 - 2015
2012 - 2018
$2.7$1.0
2016
$0.6$2.3
Supplemental Dividend Anti-Dilutive Share RepurchasesRegular Dividends
2017
$1.7
$2.9
$13.8
$18.4
$3.5 $3.1
2018
A5
54
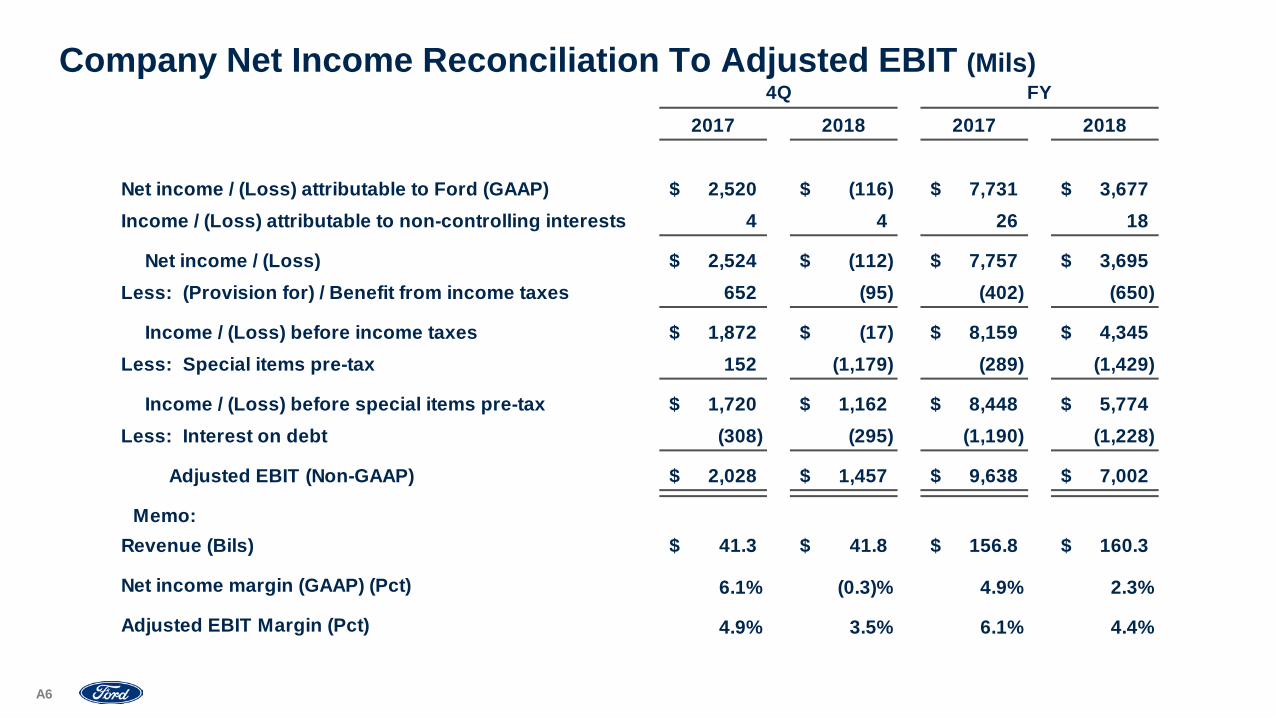
Company Net Income Reconciliation To Adjusted EBIT (Mils)
A6
2017 2018 2017 2018
Net income / (Loss) attributable to Ford (GAAP) 2,520$ (116)$ 7,731$ 3,677$ Income / (Loss) attributable to non-controlling interests 4 4 26 18
Net income / (Loss) 2,524$ (112)$ 7,757$ 3,695$ Less: (Provision for) / Benefit from income taxes 652 (95) (402) (650)
Income / (Loss) before income taxes 1,872$ (17)$ 8,159$ 4,345$ Less: Special items pre-tax 152 (1,179) (289) (1,429)
Income / (Loss) before special items pre-tax 1,720$ 1,162$ 8,448$ 5,774$ Less: Interest on debt (308) (295) (1,190) (1,228)
Adjusted EBIT (Non-GAAP) 2,028$ 1,457$ 9,638$ 7,002$
Memo:Revenue (Bils) 41.3$ 41.8$ 156.8$ 160.3$
Net income margin (GAAP) (Pct) 6.1% (0.3)% 4.9% 2.3%
Adjusted EBIT Margin (Pct) 4.9% 3.5% 6.1% 4.4%
4Q FY
55
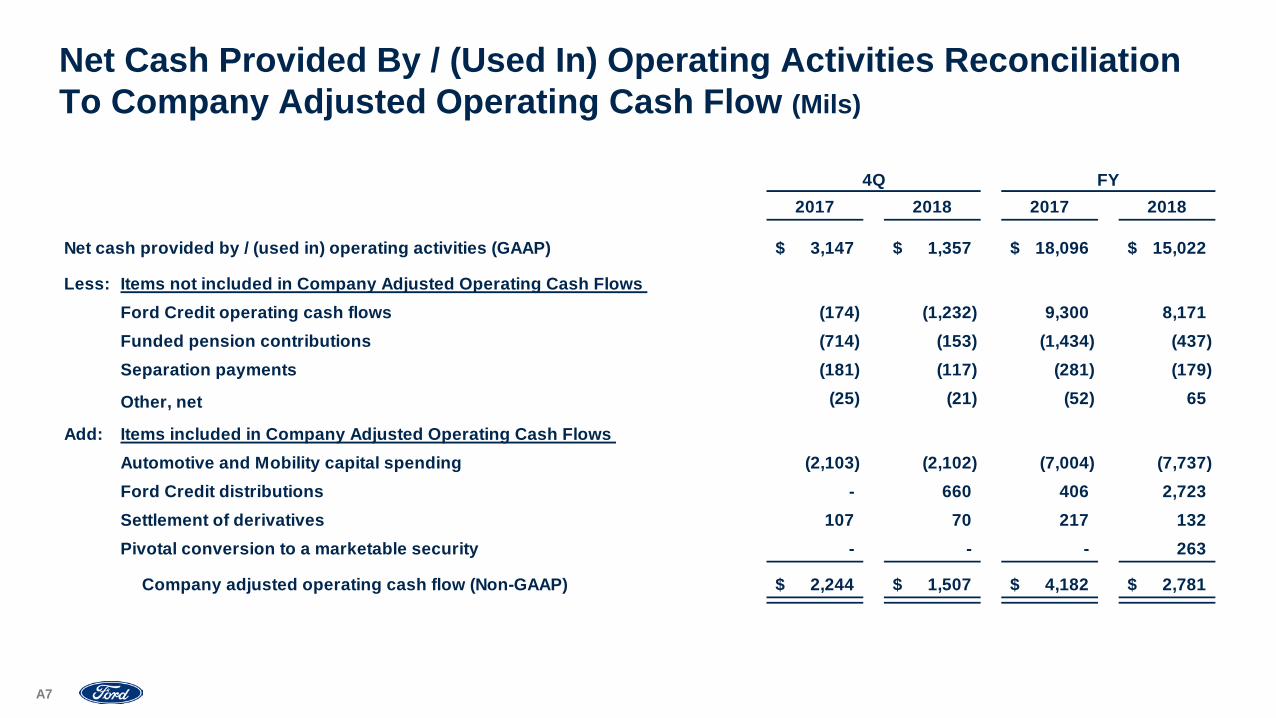
Net Cash Provided By / (Used In) Operating Activities Reconciliation To Company Adjusted Operating Cash Flow (Mils)
A10
2017 2018 2017 2018
Net cash provided by / (used in) operating activities (GAAP) 3,147$ 1,357$ 18,096$ 15,022$
Less: Items not included in Company Adjusted Operating Cash Flows Ford Credit operating cash flows (174) (1,232) 9,300 8,171 Funded pension contributions (714) (153) (1,434) (437) Separation payments (181) (117) (281) (179)
Other, net (25) (21) (52) 65
Add: Items included in Company Adjusted Operating Cash Flows Automotive and Mobility capital spending (2,103) (2,102) (7,004) (7,737) Ford Credit distributions - 660 406 2,723 Settlement of derivatives 107 70 217 132 Pivotal conversion to a marketable security - - - 263
Company adjusted operating cash flow (Non-GAAP) 2,244$ 1,507$ 4,182$ 2,781$
4Q FY
A7

56
Reconciliation To Company Adjusted Operating Cash FlowTrailing Five Quarters (Mils)
4Q 2017 1Q 2018 2Q 2018 3Q 2018 4Q 2018
Net cash provided by / (Used in) operating activities (GAAP) 3,147$ 3,514$ 4,972$ 5,179$ $1,357
Less: Items Not Included in Company Adjusted Operating Cash Flows Ford Credit operating cash flows (174) (315) 5,907 3,811 (1,232) Funded pension contributions (714) (88) (72) (123) (153) Separation payments (181) (16) (18) (28) (117) Other, net (25) 53 (112) 146 (21)
Add: Items Included in Company Adjusted Operating Cash Flows Automotive and Mobility capital spending (2,103) (1,769) (1,898) (1,968) (2,102) Ford Credit distributions - 1,013 450 600 660 Settlement of derivatives 107 (161) 114 109 70 Pivotal conversion to a marketable security - - 263 - -
Company adjusted operating cash flow (Non-GAAP) 2,244$ 2,963$ (1,804)$ 115$ 1,507$
Cash Conversion CalculationCompany Adj. operating cash flow (Non-GAAP) (sum of Trailing Four Qtrs) 4,182$ 2,781$ Adj. EBIT (Non-GAAP) (sum of Trailing Four Qtrs) 9,638$ 7,002$ Adj. cash conversion (Non-GAAP) (Trailing Four Qtrs)* 43% 40%
A8
* Most comparable GAAP Measure: Net Cash Provided By / (Used In) Operating Activities divided by Net Income Attributable to Ford is equivalent to 234% in 2017 and 409% in 2018

57
Company Earnings Per Share Reconciliation To Adjusted Earnings Per Share
2017 2018 2017 2018Diluted After-Tax Results (Mils)Diluted after-tax results (GAAP) 2,520$ (116)$ 7,731$ 3,677$ Less: Impact of pre-tax and tax special items 971 (1,320) 608 (1,517)
Adjusted net income – diluted (Non-GAAP) 1,549$ 1,204$ 7,123$ 5,194$
Basic and Diluted Shares (Mils)Basic shares (average shares outstanding) 3,973 3,970 3,975 3,974 Net dilutive options, unvested restricted stock units and restricted stock 27 27 23 24
Diluted shares 4,000 3,997 3,998 3,998
Earnings per share – diluted (GAAP)* 0.63$ (0.03)$ 1.93$ 0.92$ Less: Net impact of adjustments 0.24 (0.33) 0.15 (0.38)
Adjusted earnings per share – diluted (Non-GAAP) 0.39$ 0.30$ 1.78$ 1.30$ * The 2018 fourth quarter calculation of Earnings Per Share - Diluted (GAAP) excludes the 27 million shares of net dilutive options, unvested restricted stock units and restricted stock due to their antidilutive effect
4Q FY
A9

58
Company Effective Tax Rate Reconciliation To Adjusted Effective Tax Rate
A10
Memo:4Q FY FY 2017
Pre-Tax Results (Mils)Income / (Loss) before income taxes (GAAP) (17)$ 4,345$ 8,159$ Less: Impact of special items (1,179) (1,429) (289)
Adjusted earnings before taxes (Non-GAAP) 1,162$ 5,774$ 8,448$
Taxes (Mils)(Provision for) / Benefit from income taxes (GAAP) (95)$ (650)$ (402)$ Less: Impact of special items (141) (88) 897
Adjusted (provision for) / benefit from income taxes (Non-GAAP) 46$ (562)$ (1,299)$
Tax Rate (Pct)Effective tax rate (GAAP) (558.8)% 15.0% 4.9%Adjusted effective tax rate (Non-GAAP) (4.0)% 9.7% 15.4%
2018

59
Adjusted Debt / EBITDA Reconciliation
A11
2017 2018Adjusted Debt
Debt (excl. Ford Credit) 16,530$ 14,147$ Add: Unamortized discount & issuance costs 394 316 Add: Operating Lease Adjustment 1,406 1,447 Add: Net pension liability excl. prepaid assets 10,161 9,627
Adjusted Debt 28,491$ 25,537$
EBITDA
Company adjusted EBIT 9,638$ 7,002$ Less: Ford Credit EBT 2,310 2,627
Pension adjustmentInterest cost 2,196 2,150 Expected return on assets (4,109) (4,182) Amortization of prior year service costs 180 168 Separation programs/other 92 156 Settlements and curtailments (non-special) (3) (2)
Pension adjustment (1,644) (1,710)
Add: Depreciation and tooling amortization (excl. Ford Credit) 4,963 5,384 Add: Operating Lease Expense 526 552
Adjusted EBITDA 11,173$ 8,601$
Adjusted Debt to EBITDA (Non-GAAP) 2.5x 3.0x

60
* Includes finance receivables (retail and wholesale) sold for legal purposes and net investment in operating leases included in securitization transactions that do not satisfy the requirements for accounting sale treatment. These receivables and operating leases are reported on Ford Credit’s balance sheet and are available only for payment of the debt issued by, and other obligations of, the securitization entities that are parties to those securitization transactions; they are not available to pay the other obligations of Ford Credit or the claims of Ford Credit’s other creditors
** Primarily includes Automotive segment receivables purchased by Ford Credit which are classified to Trade and other receivables on our consolidated balance sheet. Also includes eliminations of intersegment transactions
Ford Credit Total Net Receivables Reconciliation To Managed Receivables (Bils)
2016 2017 2018Dec 31 Dec 31 Dec 31
Ford Credit finance receivables, net (GAAP)* 96.2$ 108.4$ 109.9$ Net investment in operating leases (GAAP)* 27.2 26.7 27.4 Consolidating adjustments** 6.8 7.6 8.9
Total net receivables 130.2$ 142.7$ 146.3$
Ford Credit unearned interest supplements and residual support 5.3 6.1 6.8 Allowance for credit losses 0.5 0.7 0.7 Other, primarily accumulated supplemental depreciation 0.9 1.0 1.1
Total managed receivables (Non-GAAP) 136.9$ 150.5$ 154.9$
A12

61
Ford Credit Financial Statement Leverage Reconciliation To Managed Leverage (Bils)
* Includes debt issued in securitization transactions and payable only out of collections on the underlying securitized assets and related enhancements. Ford Credit holds the right to receive the excess cash flows not needed to pay the debt issued by, and other obligations of, the securitization entities that are parties to those securitization transactions
** Cash and cash equivalents, and Marketable securities reported on Ford Credit’s balance sheet, excluding amounts related to insurance activities*** Related primarily to market valuation adjustments to derivatives due to movements in interest rates. Adjustments to debt are related to designated fair value hedges and adjustments to equity are
related to retained earnings**** Total shareholder’s interest reported on Ford Credit’s balance sheet
2016 2017 2018Dec 31 Dec 31 Dec 31
Leverage CalculationTotal debt* 126.5$ 137.8$ 140.1$ Adjustments for cash** (10.8) (11.8) (10.2) Adjustments for derivative accounting*** (0.3) - 0.2
Total adjusted debt 115.4$ 126.0$ 130.1$
Equity**** 12.8$ 15.9$ 15.0$ Adjustments for derivative accounting*** (0.3) (0.1) (0.2)
Total adjusted equity 12.5$ 15.8$ 14.8$
Financial statement leverage (to 1) (GAAP) 9.9 8.7 9.4 Managed leverage (to 1) (Non-GAAP) 9.2 8.0 8.8
A13

62
Employment Data* (000s)
* Employment data includes the approximate number of individuals employed by consolidated entities
2017Dec 31
2018Dec 31
North America 100 100
South America 14 12
Europe 54 53
Middle East & Africa 3 4
Asia Pacific 23 22
Total Automotive 194 191
Ford Credit 7 7
Mobility 1 1 Total Company 202 199
A14

63
Pension Update
• Underfunded status of pension plans at $6.3B; improved $0.3B versus a year ago
• Funded plans remain fully funded in aggregate
• Expect 2019 funded pension plan contributions to be about $650M
* Excludes all pension-related special items, primarily remeasurement** Excludes special separation-related actions
2017 2018
2018B / (W)2017
Pension Funded Status (Bils)U.S. Plans (2.2)$ (2.5)$ (0.3)$ Non-U.S. Plans (4.4) (3.8) 0.6
Total Global Pension (6.6)$ (6.3)$ 0.3$
Year-End Discount Rate (Weighted Average)U.S. plans 3.60 % 4.29 % 0.69 pptsNon-U.S. plans 2.33 2.48 0.15
Actual Asset ReturnsU.S. plans 13.40 % (3.72) % (17.12) pptsNon-U.S. plans 4.50 (0.1) (4.60)
Pension − Funded Plans Only (Bils)Funded Status (0.1)$ (0.3)$ (0.2)$ Contributions for Funded Plans 1.4$ 0.4$ 1.0$
Pension plan (expense) / income* (Bils) 0.6$ 0.7$ 0.1$
Total Pension & OPEB Special items** (Bils) 0.2$ (0.8)$ (1.0)$
A15

64
Non-GAAP Financial Measures That Supplement GAAP MeasuresWe use both GAAP and non-GAAP financial measures for operational and financial decision making, and to assess Company and segment business performance. The non-GAAP measures listed below are intended to be considered by users as supplemental information to their equivalent GAAP measures, to aid investors in better understanding our financial results. We believe that these non-GAAP measures provide useful perspective on underlying business results and trends, and a means to assess our period-over-period results. These non-GAAP measures should not be considered as a substitute for, or superior to, measures of financial performance prepared in accordance with GAAP. These non-GAAP measures may not be the same as similarly titled measures used by other companies due to possible differences in method and in items or events being adjusted.
• Company Adjusted EBIT (Most Comparable GAAP Measure: Net income attributable to Ford) – Earnings before interest and taxes (EBIT) includes non-controlling interests and excludes interest on debt (excl. Ford Credit Debt), taxes and pre-tax special items. This non-GAAP measure is useful to management and investors because it allows users to evaluate our operating results aligned with industry reporting. Pre-tax special items consist of (i) pension and OPEB remeasurement gains and losses, (ii) significant personnel and dealer-related costs stemming from our efforts to match production capacity and cost structure to market demand and changing model mix, and (iii) other items that we do not necessarily consider to be indicative of earnings from ongoing operating activities. When we provide guidance for adjusted EBIT, we do not provide guidance on a net income basis because the GAAP measure will include potentially significant special items that have not yet occurred and are difficult to predict with reasonable certainty prior to year-end, including pension and OPEB remeasurement gains and losses.
• Company Adjusted EBIT Margin (Most Comparable GAAP Measure: Company Net Income Margin) – Company Adjusted EBIT margin is Company adjusted EBIT divided by Company revenue. This non-GAAP measure is useful to management and investors because it allows users to evaluate our operating results aligned with industry reporting.
• Adjusted Earnings Per Share (Most Comparable GAAP Measure: Earnings Per Share) – Measure of Company’s diluted net earnings per share adjusted for impact of pre-tax special items (described above), and tax special items. The measure provides investors with useful information to evaluate performance of our business excluding items not indicative of underlying run rate of our business. When we provide guidance for adjusted earnings per share, we do not provide guidance on an earnings per share basis because the GAAP measure will include potentially significant special items that have not yet occurred and are difficult to predict with reasonable certainty prior to year-end, including pension and OPEB remeasurement gains and losses.
• Adjusted Effective Tax Rate (Most Comparable GAAP Measure: Effective Tax Rate) – Measure of Company’s tax rate excluding pre-tax special items (described above) and tax special items. The measure provides an ongoing effective rate which investors find useful for historical comparisons and for forecasting. When we provide guidance for adjusted effective tax rate, we do not provide guidance on an effective tax rate basis because the GAAP measure will include potentially significant special items that have not yet occurred and are difficult to predict with reasonable certainty prior to year-end, including pension and OPEB remeasurement gains and losses.
A16
65
• Company Adjusted Operating Cash Flow (Most Comparable GAAP Measure: Net Cash Provided By / (Used In) Operating Activities) – Measure of Company’s operating cash flow excluding Ford Credit’s operating cash flows. The measure contains elements management considers operating activities, including Automotive and Mobility capital spending, Ford Credit distributions to its parent, and settlement of derivatives. The measure excludes cash outflows for funded pension contributions, separation payments, and other items that are considered operating cash outflows under U.S. GAAP. This measure is useful to management and investors because it is consistent with management’s assessment of the Company’s operating cash flow performance. When we provide guidance for Company adjusted operating cash flow, we do not provide guidance for net cash provided by/(used in) operating activities because the GAAP measure will include items that are difficult to quantify or predict with reasonable certainty, including cash flows related to the Company's exposures to foreign currency exchange rates and certain commodity prices (separate from any related hedges), Ford Credit's operating cash flows, and cash flows related to special items, including separation payments, each of which individually or in the aggregate could have a significant impact to our net cash provided by/(used in) our operating activities.
• Adjusted Cash Conversion (Most Comparable GAAP Measure: Net Cash Provided By / (Used In) Operating Activities divided by Net Income Attributable to Ford) – Company Adjusted Cash Conversion is Company adjusted operating cash flow divided by Adjusted EBIT. This non-GAAP measure is useful to management and investors because it allows users to evaluate how much of Ford's Adjusted EBIT is converted into cash flow.
• Adjusted Debt to EBITDA (Most Comparable GAAP Measure: Total Company Debt to Net income attributable to Ford) – This financial leverage ratio is commonly used to assess a company’s ability to repay its debt. This measure is useful to management and investors because it helps to assess how long we would need to operate at our current level to repay our debt (excl. Ford Credit’s debt). For more information, see the definitions of Adjusted Debt and Adjusted EBITDA.
• Adjusted Debt (Most Comparable GAAP Measure: Total Company Debt) – Measure of total company debt (excl. Ford Credit), adjusted to include unamortized discount/premium and issuance costs (excl. Ford Credit), operating lease minimum commitments, and net pension liabilities excluding prepaid assets. This measure is useful to management and investors as it approximates the total liabilities of the company excluding Ford Credit.
• Adjusted EBITDA (Most Comparable GAAP Measure: Net income attributable to Ford) – Measure of Company Adjusted EBIT (see definition), excluding Ford Credit EBT, and further adjusted to include depreciation and tooling amortization (excl. Ford Credit), operating lease expense, and certain pension costs. This measure is useful to management and investors as it approximates the cash flow available to repay our debt (excl. Ford Credit’s debt).
• Adjusted ROIC – This calculation provides management and investors with useful information to evaluate the Company’s after-cash tax operating return on its invested capital for the period presented. Adjusted net operating profit after cash tax measures operating results less special items, interest on debt (excl. Ford Credit Debt), and certain pension/OPEB costs. Average invested capital is the sum of average balance sheet equity, debt (excl. Ford Credit Debt), and net pension/OPEB liability.
Non-GAAP Financial Measures That Supplement GAAP Measures
A17

66
• Ford Credit Managed Receivables – (Most Comparable GAAP Measure: Net Finance Receivables plus Net Investment in Operating Leases) – Measure of Ford Credit’s Total net receivables, excluding unearned interest supplements and residual support, allowance for credit losses, and other (primarily accumulated supplemental depreciation). The measure is useful to management and investors as it closely approximates the customer’s outstanding balance on the receivables, which is the basis for earning revenue.
• Ford Credit Managed Leverage (Most Comparable GAAP Measure: Financial Statement Leverage) – Ford Credit’s debt-to-equity ratio adjusted (i) to exclude cash, cash equivalents, and marketable securities (other than amounts related to insurance activities), and (ii) for derivative accounting. The measure is useful to investors because it reflects the way Ford Credit manages its business. Cash, cash equivalents, and marketable securities are deducted because they generally correspond to excess debt beyond the amount required to support operations and on-balance sheet securitization transactions. Derivative accounting adjustments are made to asset, debt, and equity positions to reflect the impact of interest rate instruments used with Ford Credit’s term-debt issuances and securitization transactions. Ford Credit generally repays its debt obligations as they mature, so the interim effects of changes in market interest rates are excluded in the calculation of managed leverage.
Non-GAAP Financial Measures That Supplement GAAP Measures
A18

67
Definitions And CalculationsAutomotive Records• References to Automotive records for EBIT margin and business units are since at least 2009Wholesales and Revenue• Wholesale unit volumes include all Ford and Lincoln badged units (whether produced by Ford or by an unconsolidated affiliate) that are sold to dealerships, units manufactured by
Ford that are sold to other manufacturers, units distributed by Ford for other manufacturers, and local brand units produced by our China joint venture, Jiangling Motors Corporation, Ltd. (“JMC”), that are sold to dealerships. Vehicles sold to daily rental car companies that are subject to a guaranteed repurchase option (i.e., rental repurchase), as well as other sales of finished vehicles for which the recognition of revenue is deferred (e.g., consignments), also are included in wholesale unit volumes. Revenue from certain vehicles in wholesale unit volumes (specifically, Ford badged vehicles produced and distributed by our unconsolidated affiliates, as well as JMC brand vehicles) are not included in our revenue
Industry Volume and Market Share• Industry volume and market share are based, in part, on estimated vehicle registrations; includes medium and heavy duty trucks SAAR• SAAR means seasonally adjusted annual rateCompany Cash• Company cash includes cash, cash equivalents, marketable securities and restricted cash; excludes Ford Credit’s cash, cash equivalents, marketable securities and restricted cashMarket Factors• Volume and Mix – primarily measures EBIT variance from changes in wholesale volumes (at prior-year average contribution margin per unit) driven by changes in industry volume,
market share, and dealer stocks, as well as the EBIT variance resulting from changes in product mix, including mix among vehicle lines and mix of trim levels and options within avehicle line
• Net Pricing – primarily measures EBIT variance driven by changes in wholesale prices to dealers and marketing incentive programs such as rebate programs, low-rate financing offers, special lease offers and stock accrual adjustments on dealer inventory
• Market Factors exclude the impact of unconsolidated affiliate wholesalesROE• Reflects an annualized return on equity. This metric is calculated by taking net income for the period divided by average equity for the period and annualizing the result by dividing
by the number of days in the quarter and multiplying by 365.Earnings Before Taxes (EBT)• Reflects Income before income taxes
Note: Calculated results may not sum due to rounding
A19