4d international journal of management and...
TRANSCRIPT

ISSN. NO 2250-0669
Indexed with
4D INTERNATIONAL
JOURNAL OF
MANAGEMENT AND
SCIENCE
Volume 2, Issue 1, January 2012
http://www.4dinternationaljournal.com
A Bi-annual peer reviewed Journal for
global Management Professionals,
researchers and practioners

4D INTERNATIONAL JOURNAL OF MANAGEMENT AND SCIENCE ISSN 2250-0669
JANUARY-JUNE 2012 http://www.4dinternationaljournal.com VOL 2 / ISSUE 1
Pag
e1
Journal Information
The 4D International Journal of Management
and Science (4DIJMS) is published by 4D Cross
Connect is a quality research journal that is
published from USA and India
(www.4dcrossconnect.com).The journal endeavors
to provide forums for academicians and
practioners who are interested in the discussion of
current and future issues and challenges
impacting the globe as well as promoting and
disseminating relevant, high quality research in
the field of Management. The journal aims to
publish quality research findings from researchers
across the global. It is a journal published by an
APEX group of academicians and professionals’
practioners. We welcome papers from both
academicians and practioners on theories, business
models, conceptual paradigms, academic research,
consultancy projects as well as organizational
practices.

4D INTERNATIONAL JOURNAL OF MANAGEMENT AND SCIENCE ISSN 2250-0669
JANUARY-JUNE 2012 http://www.4dinternationaljournal.com VOL 2 / ISSUE 1
Pag
e2
Call for Papers
Academicians, professionals, researchers and scholars are
invited to publish their research papers in the journal.
Articles submitted before 15th of the June/January are only
considered for publication in the current issue. For more
details, please visit www.4dinternationaljournal.com.
Submissions
The manuscript adhering to author guidelines should be
submitted for review to the editorial board. It should only
be in MS Word format and send to
Review Process
All manuscripts submitted for publication are initially
viewed by the editorial board. Its quality is examined by the
plagiarism detection software. After initial screening
process, the manuscripts are sent to two referees for double
blind review. The referees are chosen according to their
expertise in the field. They evaluate the manuscript based
on the reviewer’s guideline. After favorable opinion from
referees, the editorial board takes the final decision for
acceptance of the manuscript.
Copyright
The copyright for articles published in journal are retained
by the authors with first publications right granted to the
journal. The journal or editors are not responsible for any
successive use of the author(s) work. It is the author's
responsibility to bring an infringement action if so desired
by the author.
© All Copyrights Reserved, 2012

4D INTERNATIONAL JOURNAL OF MANAGEMENT AND SCIENCE ISSN 2250-0669
JANUARY-JUNE 2012 http://www.4dinternationaljournal.com VOL 2 / ISSUE 1
Pag
e3
Editorial Board
Prof Ashok Kumar Sinha (India)
Editor-In-Chief
Prof Nisha Singh (USA)
Editor
Dr. Saroj Kumar Dash (India)
Associate Editor and Creative Manager
Dr. Durga Madhab Mahapatra (India)
Associate Editor
Dr. Devendra Singh (India)
Associate Editor

4D INTERNATIONAL JOURNAL OF MANAGEMENT AND SCIENCE ISSN 2250-0669
JANUARY-JUNE 2012 http://www.4dinternationaljournal.com VOL 2 / ISSUE 1
Pag
e4
Advisory Board
Dr. Robert Pelligino
MBA Director, Florida Memorial
University, USA
Dr. D. Pathak
Vice Chancellor, Sri Vekateshwara
University, Gajraula (U.P.) India.
Dr. A Kumar
(Ex-Prof. Harvard, USA)
India.
Dr. Fredrick Robert
Professor, Sydney, Australia
Dr. Nam Sung Ho
Associate Professor—Singapore
Dr. D. K. Sinha
St. Francisco State University, USA
Dr. Jamal Mustafa Hussain
Dubai, UAE.
Dr. Saba Hilal
Director, Gurgaon, India.
Dr. Manoj Kumar Dash
Asst. Prof., IIITM, Gwalior, INDIA
Dr. (Prof.) Harvir Singh
Director, Phoenics Engg. College,
Uttrakhand, India.
Dr. Arun Kumar Panda
Reader-Dept. of Business, Berhampur
University, India.
Prof. Kishore Ch. Meher
I.T.S Management Institute, Gr. Noida,
India.
Dr. Gajendra Singh
HNB Gharwal University, INDIA.
Dr. S. Singh
University of East London
Mantin, Malaysia
Prof. Ralph Greenberg
Alter Hall Temple University
Philadelphia, USA
Dr Jagdish Rai
Professor-IIT,
Roorkee,India
Dr. A Satyanarayan Professor, Skyline Institute of
Management and Technology, Greater
Noida, India
Dr. Shakti Prakash
Director, Skyline Institute of Management and
Technology, Greater Noida, India

4D INTERNATIONAL JOURNAL OF MANAGEMENT AND SCIENCE ISSN 2250-0669
JANUARY-JUNE 2012 http://www.4dinternationaljournal.com VOL 2 / ISSUE 1
Pag
e1
From the Desk of Editor…
It is a matter of immense pleasure to congratulate the
editorial Board for bringing out the January 2012 issue
successfully. I am especially thankful to Dr. Saroj Kumar
Dash for designing the journal. It would be appropriate to
extend my congratulation to the contributors. Out of the
total number of 40 Research papers, we received; only 15
have been approved by the Reviewer committee for
publication. Those who could not find place, still have
our good wishes for their excellent future endeavor.
Please be assured all that our forthcoming issue will be
having double blind fold reviewed papers.
With best wishes.
Prof. Nisha Singh

4D INTERNATIONAL JOURNAL OF MANAGEMENT AND SCIENCE ISSN 2250-0669
JANUARY-JUNE 2012 http://www.4dinternationaljournal.com VOL 2 / ISSUE 1
Pag
e2
CONTENT
Sl. No
Content Page no
1
Role of Information Technology in Vendor Managed Inventory -Dr. V .S. Pandey 3-14
2
Consumer Perception of Business Magazines -Dr. Nisha Singh, Dr. Chandra Bhusan Singh and Dr. Prabha Kishore
15-39
3
Innovative practices in training and education sector -Smita Gupta
40-51
4
Do HR competencies differ across Industries and roles? -Ruby Gupta, Dr Harsh Purohit and Dr Anil Kumar Pandey 52-58
5
Information Technology Initiatives, a Revolution in Banking Sector -Abhilasha Singh, Jyoti Satsangi and Dr Aniruddh Raghav 59-66
6
Management of Lubricants -Prof. S. B. Srivastava 67-76
7
Management of Intellectual Property Rights In India - Dr B R Bishnoi and Parul Goyal 77-95
8
Commodity market as an investment option - Dr.Nisha Singh 96-115
9
CO2 emission by Power Sector in India: A Comparative study of Government sector and Private Sector with special reference to the climate change in Global Perspective
- Gyanesh Kumar Sinha, Dr. Chandan Bhar and Dr. J K Pattanayak 116-134
10
Quality of work life- a way to manage business in current economic scenario - Prof. Rajnish Ratna
135-149
11
Women Leader: Fulfilling Career Aspirations -Dr A Satyanarayan and P V Purna Kumari 150-158
12
Implementation of Enterprise Resource Planning: Success Issues
-Aashish Dixit 159-166
13
Privatization-A Study of Private Ownership -Dr. Kishore Ch. Meher 167-183
14
Can Financial Crisis affect CSR? -Mr. Ankur Agarwal and Mr. Mridul Dharwal 184-188
15
A study on fossil fuel consumption pattern in BRIC nations -Alok Kumar Singh and Dr. Avijit Dey 189-208

4D INTERNATIONAL JOURNAL OF MANAGEMENT AND SCIENCE ISSN 2250-0669
JANUARY-JUNE 2012 http://www.4dinternationaljournal.com VOL 2 / ISSUE 1
Pag
e3
Role of Information Technology in Vendor
Managed Inventory
Dr. V .S. Pandey
(Department of Management/T&P, BTKIT, Dwarahat, Govt. of Uttarakhand)
Email: [email protected]
Contact: 09415467171
Abstract
Technology plays a vital role in competitive market scenario of today’s world. Various
domains of supply chain management e.g.; Vendor Managed Inventory (VMI), Continuous
Replenishment Programs (CRP), Every Day Low Pricing (EDLP), Activity Based Costing
(ABC) etc. emerged in the recent competitive global market. As the information is the key of
success for any business activity, advances in information technology has a great impact on
the supply chain. Due to this technological advancement, optimization of chain wide
performance takes place .This paper describes the types of information shared and its
effectiveness in Vendor Managed Inventory. We discuss how this information technology plays
a significant and decisive role in application of Vendor Managed Inventory. We also discuss
how much this information flow makes the chain transparent and beneficial for the partners in
supply chain.
Introduction
In Supply chain Management, the focal point of analysis is changed from a business unit e.g.;
a plant or a warehouse, to a supply chain i.e.; part suppliers (vendors), manufacturers,
distributors, logistics service providers, wholesalers and retailers. The integration and
optimization of three links (material, information and retailers) flows in the supply chain form
the core concern of supply chain management. It suggests extensive coordination among
multiple functions and independent companies engaged in the delivery of a product or a
service to end consumers. Traditional transaction based intra organizational relationships give
way to partnerships in which information, processes, decisions and resources are shared
among partner companies.
There are several major underlying trends that have formed the key drivers for supply chain
management.
The first is the globalization of businesses. Modern businesses attempt to deploy global
resources to maximize the potential opportunities in the global community. This, however,
entails the challenges of dealing with long delivery lead times, high buffer stock, complex
logistics and high cost of coordination, as companies try to coordinate the three flows across
the globe.

4D INTERNATIONAL JOURNAL OF MANAGEMENT AND SCIENCE ISSN 2250-0669
JANUARY-JUNE 2012 http://www.4dinternationaljournal.com VOL 2 / ISSUE 1
Pag
e4
Another driver is the innovations in the retail sector. General merchandise store chains like
Wal-Mart, Price club, Category specialist item chains like TOYS-R-U‘s ,virtual electronic
stores like Next, Amazon have revolutionized the retail side of supply chains. Innovations like
Vendor-Managed Inventory (VMI), Everyday low pricing, Activity-based costing and cross-
docking have triggered industry –wide efforts in supply chain management like Efficient
Consumer Response (ECR) or Efficient Foodservice Response (EFR).
On the supply side, a key driver of supply chain management is the availability of cost-
effective information technologies (IT).In fact, although it is recognized that a supply chain
that makes decisions based on global information would clearly dominate one with disjoint
decisions by separate and independent entities in the supply chain, a well coordinated supply
chain has not been easy to achieve. Significant investments are required to allow information
to be shared across entities so that the activities and decisions throughout the supply chain can
be coordinated. Recent advances in cost effective IT have ,however made, the cost benefit
trade off favorable toward well coordinated supply chain management.
Specific examples of such technologies include Client server architecture, TCP/IP, relational
DBMS (Data Base Management Systems), ERP (Enterprise Resource Planning), EDI
(Electronic Data Interchange), Object-Oriented Programming environments, Wireless
communications and Internet. How to deploy these technologies and coordinate supply chain
wide activities constitutes the latest advances in supply chain management.
Objective of the present paper is to study the role of Information Technology in Vendor
Managed Inventory. A specified work in this particular arena is still needed. The present paper
elaborates the Vendor Managed Inventory, its importance in changed business scenario of
today‘s world, its usefulness while connected with the Information Technology.
The organization of present paper is as follows.
Section A describes Vendor Managed Inventory (VMI), the types of Information shared with
manufacturers, Vendors. Section B discusses new dimensions of information technology in
supply chain management as well as in procurement process. Section C addresses the impact
&/or importance of IT in VMI vis-à-vis challenges of information sharing in VMI.
Today, most of the firms are concentrating on the ―Core Competences.‖They want to
outsource minor tasks and activities, when it is cost effective to do so. Under a VMI
agreement; a supplier takes full responsibilities for maintaining stock of products at a
customer facility. VMI differs from the traditional inventory management, in that the customer
is billed for material when it is delivered, not when it is consumed or issued.
With VMI, the vendor specifies delivery quantities sent to customers through the distribution
channel using data obtained from EDI.VMI,JIT distribution and ECR(Efficient consumer
response ) all refers to similar concept ,but applied to different industries e.g.; Grocery &
Apparel industries tend to use ECR while the automobile industry tends to use VMI & JIT.
VMI reduces stock outs and reduces inventory in supply chain. Some features of VMI include:
Shortening the supply chain.

4D INTERNATIONAL JOURNAL OF MANAGEMENT AND SCIENCE ISSN 2250-0669
JANUARY-JUNE 2012 http://www.4dinternationaljournal.com VOL 2 / ISSUE 1
Pag
e5
Centralized forecasting.
Frequent communication of inventory, stock outs and planned promotions.EDI (Electronic
data interchange) linkages facilitate this communication.
No manufacturer promotions.
Trucks are filled in a prioritized order e.g.; items that are expected to stock out have top
priority ,then items that are furthest below targeted stock levels, then advance shipments of
promotional items(promotions allowed in transition phase only) and finally items that are least
targeted stock levels.
Relationship with downstream distribution channels.
Result-Inventory reduction and stock out reduction.
VMI can be applied at any point within a supply chain:
Manufacturer-wholesale distributor/retailer
Manufacturer-End customer/OEM
Manufacturer- Internal inventory sites.
For VMI partnership to be successful and fruitful, the supplier and customer when entering an
agreement must agree on the following:
*The specific products that will be covered under the VMI agreement.
*Acceptable availability ―of these products at the customer‘s site and the corresponding
investment required by the customer.
*Mutually acceptable ―service level‖ agreement.
*How often the stock of these products will be replenished.
*Automatic return of material not required by the customer.
The advantage for a customer participating in a VMI program covers the following:
1. Eliminating of transaction cost.
2. Reduced inventory capital costs.
3. Establishing an extremely reliable source of supply for products.
4. Customer does not pay for the inventory until it is sold or used.
5. Elimination in inventory stock outs.
6. Better financial planning.
7. Elimination in ordering errors.
4D INTERNATIONAL JOURNAL OF MANAGEMENT AND SCIENCE ISSN 2250-0669
JANUARY-JUNE 2012 http://www.4dinternationaljournal.com VOL 2 / ISSUE 1
Pag
e6
The advantages for a supplier in a VMI program me cover the following:
*Securing the customer‘s overall business for products it supplies.
*Better planning of its own inventory replenishment needs.
*Better capacity utilization of its plant.
*Better demand management.
*Customer focused approach leading to competitive advantage.
*Supply chain visibility.
*Better planning.
The risks involved for suppliers in participating in VMI programs are high administrative cost
as it is assuming responsibility for replenishment activity that was previously carried out by
the customer‘s buyers.
The real world implementations of VMI can be broken in to three main categories:
1. Collaboration
2. Automation
3. Cost Transfer.
In many instances, a VMI relationship is the first time in supply chain where both partners
have access to, and are measuring performance using the same matrices. When two companies
are focused on the same goals and have access to the same key performance metrics, a true
supply chain partnership emerges, resulting in a better performing supply chain.
VMI delivers tangible resulted throughout the supply chain. As the concepts and practices of
Lean extend beyond the manufacturing floor down through the supply chain.VMI is the
enabling process to drive out costs and time. For success of VMI implementation the
following are the keys:
- Set, review and maintain performance goals.
- Manage all SKUs through VMI to minimize transactions.
- Utilize automated replenishment system.
- Organize periodic performance reviews.
- Use metrics to find cost and inefficiencies.
VMI can be made to work, but the problem is not just one of logistics.VMI often encounters
resistance from the sales force and distributors. The issues are roles, skills, trust and power
shifts.
Effective implementation of VMI depends upon smoothly addressing the concerns of various
stake holders. Some of the concerns can be addressed as explained:

4D INTERNATIONAL JOURNAL OF MANAGEMENT AND SCIENCE ISSN 2250-0669
JANUARY-JUNE 2012 http://www.4dinternationaljournal.com VOL 2 / ISSUE 1
Pag
e7
1. Defining incentive programs based on partnership and not on sales volume.
2. Building partnership with management commitment.
3. Conduct simulations and pilots before actual implementation.
4. Organize training sessions before launching VMI program.
5. Getting into service level agreements (SLA).
One of the most common data shared between supply chain partners is inventory level.
Inventory and communication are economic substitutes. Access to supply chain inventory
status can contribute to lowering the total inventory level in the supply chain. Suppose two
companies in a supply chain in which a retail chain purchases products from the manufacturer.
If the retailer and the manufacturer independently manage their respective inventories without
sharing inventory status information, they may end up having duplicate safety inventories or
stock-outs at both locations. A solution to this inefficiency is to coordinate the management of
inventories at two sites. Indeed it was proven that ―Echelon based‖ inventory control is
optimal under certain assumptions. The Echelon inventory is the combined inventory at the
site and at its downstream partner. It is also evident that a variation of the order up to policy
based on the Echelon inventory level would achieve near optimum in more realistic
conditions. Such a policy is in the spirit of Synchronous Manufacturing System. The
production rule will adjust the production rate at a stage according to the inventory levels at
the downstream stages. Specifically, the production rate at a stage will decrease or increase,
when the inventory levels at those downstream stages is higher or lower than their target
levels. To implement echelon based inventory control, the upstream company should keep
track of the inventory level at the downstream of the supply chain and start production only
when the echelon inventory position is low enough. This way, the upstream company can
better determine when and what to produce and downstream companies can improve the
service level with less inventory.
In practice, sharing of inventory information is implemented in different forms.CRP
(Continuous Replenishment Program) or VMI (Vendor Managed Inventory) is a practice often
employed by two neighboring partners in a supply chain (Procter & Gamble and Wal-Mart).In
a typical CRP relationship, the buyer shares its inventory data with the vendor and asks the
vendor to manage his inventory within a guideline.
Recently even the possibility of sharing inventory information among competitors is under
discussion. For example, Japan‘s semiconductor makers proposed a system under which chip
makers from Japan, Korea, U.S. and Europe jointly survey their inventory levels. The benefit
of this horizontal information sharing is to mitigate the chronic problems associated with
volatile business cycle..DRAM businesses, being at the farthest stream in the computer supply
chain, experience an extreme form of volatility. It is caused by multiple factors including
business cycle, double forecasting, shortage gaming, and third party speculation. As a result,
industry sales data and market prices are so noisy that estimating the real market demand
becomes a major challenge. Information sharing among key manufacturers, if properly
implemented, can at least mitigate this information distortion, and each manufacturer can
better estimate the market demand and make better production, capacity and inventory
planning decisions.
Online Procurement:

4D INTERNATIONAL JOURNAL OF MANAGEMENT AND SCIENCE ISSN 2250-0669
JANUARY-JUNE 2012 http://www.4dinternationaljournal.com VOL 2 / ISSUE 1
Pag
e8
E-procurement system allows businesses to use the internet for acquiring the necessary goods
and services. There are three main categories of e-procurement system.
One type focuses on improving the transactions and the decision-making capabilities of the
company. Businesses may deal with hundreds of transactions on a weekly basis, but these
applications simplify the process and help to build stronger relationship between buyers and
suppliers.
The second category of e-procurement system involves managing assets. Systems in this
category provide inventory management, maintenance scheduling in house product
availability, as well as other similar services. These applications are useful for businesses that
need to keep a close watch on the quality of materials in stock.
The third category includes systems designed to optimize a company‘s production operations.
Many of these applications deal with the entire production cycle ,including the procurement of
materials when the inventory runs low, the management of supplier contracts and the
production scheduling .Because of the differences between the systems, it is important for
companies to choose the one that is most appropriate for their industry.
E-procurement system in businesses imparts benefits such as saving money on purchase,
improving the timeliness of the purchasing process and eliminating waste. In addition to these
benefits, companies can also improve the efficiency of their supply chain. Additionally using
e-procurement to enhance supply chain relationship can make it easier for accounting
departments to track and keep a record of payments and invoices.
E-procurement system does not automatically boost supply chain efficiency. However, the
company must select a system that has the capabilities necessary to achieve those benefits
first. For example, the system must include applications to assist with contract management,
including pricing information, maintaining sales terms and helping negotiations. By having all
of this information in one place, the purchasing process is expedited.
E-procurement is more than just a system for making purchases online. A properly
implemented system connects companies and their business processes directly with suppliers
while managing all interactions between them. E-procurement helps with the decision making
process by keeping relevant information neatly organized-procurement process is template-
driven, which makes all transactions standardized and traceable. Keeping track of all tender
bids means leveraging firm‘s knowledge to obtain better pricing. Well managed e procurement
helps reduce inventory levels. E-procurement system allows multiple access levels and
permissions and help managers to organize administrative users by roles, groups or tasks.
E-procurement types and models:
There are 6 main types of e-procurement:
1. Web-based ERP (Electronic resource planning): Creating and approving purchasing
requisitions, placing purchase orders and receiving goods and services by using a software
system based on the internet.

4D INTERNATIONAL JOURNAL OF MANAGEMENT AND SCIENCE ISSN 2250-0669
JANUARY-JUNE 2012 http://www.4dinternationaljournal.com VOL 2 / ISSUE 1
Pag
e9
2. E-M R O (maintenance, repair and operating): Similar to web based ERP except that the
goods and services ordered are non-product related to MRO supplies.
3. E-sourcing: Identifying new suppliers for a specific category of purchasing requirements
using the internet.
4. E-Tendering: Sending requests for information and prices to suppliers and receiving the
responses of suppliers using the internet.
5. E-Reverse auctioning: Using the internet to buy goods and services from a number of
known or unknown suppliers.
6. E-Informing: Gathering and distributing purchasing information both from and to internal
and external parties using the internet.
Reverse Auction (RA):
RA is a process of bidding by suppliers through the internet using reverse auction engine (a
software program). All the bidders can participate in the bidding process. The buyer fixes the
specifications and commercial terms, and fixes purchase price below which the bidders have
to quote. The bidding starts at pre-fixed start time. The bidders can see their prices quoted by
others so that they can reduce the prices step by step however, buyers can see all the bids.
E-procurement technique like bidding on reverse auctions are wherein companies will find
they have everything to gain .It‘s a win-win situation for both the buyers and sellers. The
following are the features of e-reverse auction process that cater to the needs of global
outsourcing:
1. Easy process
2. Global reach
3. Transparency
Case of Tata Motors benefiting through E-Procurement:
Tata Motors is India‘s largest and the fully integrated automobile company. It ranks top 6
among manufacturers of medium and heavy vehicles in the world. In late 1990‘s and early
2000‘s, Tata were facing financial losses due to cost pressures. They also lost market share to
the competition. Tata Motors identified the problem in their cost structure .Materials cost
amounted to 65 percent of the entire cost in FY 2000.They used e-sourcing and e-procurement
to attain precision and cost cutting. Tata Motors has employed SAP and Oracle based IT
system to support its database and transactions management. They went into outsourcing of e-
procurement process to free markets, Tata Technologies Ltd. And Dynamic logistics to
enhance the efficiency of the supply chain .Systematic implementation of e- sourcing with an
objective of cost reduction, smooth transactions with lower cost, transparent processes and
global reach for material sourcing.
In 2001, Tata Motors employed FreeMarkets.com, a global supply chain solutions company as
partner in running the e-sourcing program. The first reverse auction under this initiative was

4D INTERNATIONAL JOURNAL OF MANAGEMENT AND SCIENCE ISSN 2250-0669
JANUARY-JUNE 2012 http://www.4dinternationaljournal.com VOL 2 / ISSUE 1
Pag
e10
calculated in June 2001.E-procurement in the company revolved around reverse auctions for
on-line negotiations of prices for a variety of products and services procured by the company.
Tata Motors extended the technique to the procurement of maintenance, annual contracts, tool
engineering, administration, canteen purchases, medicines and hotel bookings. They extended
the new found success of e-sourcing to tier-II sourcing etc. Using e- procurement ,Tata motors
covered around Rs. 18,500 mn of spend form 2002 to 2004.They have covered 25% of direct
material purchasing and 55% of indirect material purchasing through e- procurement in that
period. E-procurement has reduced procurement overheads and rationalized supply conditions,
quality norms and made provision for multiple locations procurement possible.
Information Transfer Model:
In this model a partner transfers information to the other who maintains the database for
decision making. This is a natural evolution from EDI based transactional model. While EDI
was originally designed to be a means to process transactions, it has been extended to facilitate
sharing of some information like POS and on hand delivery. The model is exemplified by the
examples of UPS-Micro Age, SEJ, VMI and QF contracts. In VMI, the retailer sends sales and
inventory information to the vendor, who replenishes the buyer‘s inventory using the
information received. QF contracts typically require that the buyer sends his forecasts to the
vendor, so that she can prepare for the coming week‘s orders. In the UPS-MicroAge
relationship, MicroAge transfers its orders data to UPS, who plans and executes deliveries.
Supply chain partners may use EDI for information sharing after agreeing on an EDI standard.
They can use EDI through third party VAN services like GEIS, Sterling and Promenos.
While EDI is a well established process in the business world, it has several drawbacks. First
there are multiple industry-specific standards, the cross industry standard and the international
standard EDIFACT. A company with business interests in multiple industries has to face a
problem of dealing with multiple standards; second, since EDI is designed for all companies in
the one-fits-all spirit, it may not exactly meet the special needs of a supply chain. Third, EDI
is designed primarily for transaction processing, especially around purchase order and invoice,
and hence it has some severe limitations for information sharing. For example, EDI only
handles rigid text formats. This may be sufficient in standard transaction processing, but
would not be adequate to handle other kinds of information sharing. Such as data base tables,
bar codes, images and HTML pages. Fourth, EDI is batch-oriented, working only in
operational windows. Finally, small and medium size companies often are discouraged by the
high cost of installing EDI.
Recently, innovative companies are extending the boundary of EDI and developing
mechanisms that directly connect information system of multiple companies. In addition,
service companies now offer EDI on the internet, thereby lowering the cost of EDI usage.
Third party model involves a third party whose main function is to collect information and
maintain it in a database for the supply chain. The third party may also provide services for
transactional processes like accounting, sales analysis, order tracking, rebate tracking and alert
of special sales and promotional campaign. Distributors also receive various types of
aggregate data that can be analyzed and utilized for their inventory control and product
development.

4D INTERNATIONAL JOURNAL OF MANAGEMENT AND SCIENCE ISSN 2250-0669
JANUARY-JUNE 2012 http://www.4dinternationaljournal.com VOL 2 / ISSUE 1
Pag
e11
Constraints of E-Procurement:
As against the benefits, e-procurement has certain constraints, which are as follows.
1. Infrastructure: It includes lack of continuous internet facilities at the supplier‘s end. There is
difficulty in downloading large files due to bandwidth/speed limitation. Sometimes there are
problems in continuous access to e- procurement site. In few occasions, dates of auction are
rescheduled once or twice.
2. Reluctance for acceptance of new system:
Lack of knowledge and reluctance to use e-procurement at supplier‘s end will pose a major
problem in utility of the system. Reluctance on the part of buyers to get feedback from
suppliers and thereafter will be implemented with the help of the e-commerce team.
3. Different time zones: Vendors at various time zones in reverse auction.
Information sharing in a supply chain faces several hurdles. The first and foremost challenge
is that of aligning incentives of different partners. It would be naïve of a partner to think that
information sharing and cooperation will automatically increase his profit. In fact each partner
is wary of the possibility of other partners abusing information and reaping all the benefits
from information sharing. For example, supply chain partners seldom share information that
relates to sensitive cost data e.g.; production yield data or purchase price of parts. Trust and
cooperation become critical ingredients in a supply chain partnership. On the other hand, trust
needs to be rationalized by a relevant economic return.
One question rises every time, whether manufacturers will sincerely share their inventory
information? This is because each party has an incentive to overstate its inventory level to
discourage others from producing more chips or building additional capacity. If every
manufacturer acts selfishly and anticipates the same behavior of others, information sharing
will not be sustained as equilibrium. It will be interesting to see whether the proposed
horizontal information sharing will actually take place in spite of the incentive problem.
In the traditional supplier–buyer relationship, companies communicate demand information
exclusively in the form of orders. Indeed, orders from downstream serve as a critical source of
information about future businesses. But if the supplier depends solely on orders for future
production planning, a problem arises. Since orders are processed result of various
information and conjectures by the buyer, order data often distort the true dynamics of the
marketplace-A phenomenon called‖ The bull whip effect‖. Thus the information transferred in
the form of orders tends to be distorted and can misguide upstream partners in their inventory
and production decisions. In particular, the variance of orders is often larger than that of sales,
and the distortion tends to increase as one move upstream. The distortion injects additional
uncertainties into order fulfillment processes and makes demand forecasting even more
difficult. It ultimately hurts the efficiency of the supply chain in the form of excess raw
material inventory, unplanned purchases of supplies, additional manufacturing expenses
created by excess capacity, inefficient utilization and overtimes, excess warehousing expenses,
premium shipping costs and poor customer service level.

4D INTERNATIONAL JOURNAL OF MANAGEMENT AND SCIENCE ISSN 2250-0669
JANUARY-JUNE 2012 http://www.4dinternationaljournal.com VOL 2 / ISSUE 1
Pag
e12
The sources of Bull whip effect are identified as 1) Demand signal processing 2) Rationing
game 3) Order batching and 4) Price fluctuations.
A typical supply chain involves functions and independent companies in the delivery of goods
and services to the end consumer. As a result, it is difficult for a customer to find out the status
of an order, since the consumer does not always know who else besides the retailer is involved
or where in the supply chain the order is being processed. Recently, supply chain members
started sharing their order status information, so that a high rate of first-call problem resolution
could be achieved. For example, partners in the supply chain may hot-link their web sites or
allow access to each other‘s order databases. By calling the retailer or visiting its web site, the
customer confined the order status no matter where and in which supply chain partner‘s
possession the order is. The one-stop inquiry is a big a contrast to the traditional process in
which a customer is referred several times to other chain partners or is called back hours or
days later. The key benefit of this type of information sharing is the improvement of the
quality of customer service, reduction in payment cycle, and savings in labor cost of manual
operations. The quality of service improves as problems are resolved in a single call in a
matter of minutes rather than hours and days. Since delivery problems delay the payment of
product sales or service fees, fast resolution also shortens the payment cycle time.
Furthermore, automated answering service is more productive compared with manual
answering service, so it saves labor cost as well.
As mentioned earlier, members of a supply chain can eliminate the bullwhip effect and its
related inefficiencies by avoiding independent multiple forecasts.VMI indeed delegates a
site‘s replenishment decisions to upstream suppliers, but the degree of delegation is minimal.
In a typical VMI arrangement, the vendor is asked to ship a predetermined quantity of order
when the buyer‘s inventory level falls under a certain level. In some cases, the vendor has the
liberty of shipping any quantity, but must keep the downstream site‘s stock from exceeding
some predetermined maximum level. Such constraints often exist because the retailers are
concerned that an uncontrolled vendor may have the inventive to ship too many units to the
retailer. A manufacturer could make use of its supplier‘s production or delivery schedule to
improve its own production schedule. For example, US auto companies have access to the
production schedule for their orders at steel suppliers. A Taiwanese semiconductor
manufacturer allows her global customers access to her production schedule.
Other examples of information often shared in a supply chain include performance metrics and
capacity. Performance metrics include product quality data, lead times, queuing delays at
workstations and service performance. By sharing this type of information, the supply chain
can identify the bottlenecks of the chain and improve the overall performance. Capacity
information can contribute to mitigating potential shortage gaming behavior, thereby
countering a potential source of the bullwhip effect. By sharing planned capacity information
with the downstream partners well in advance, supply chain partners can coordinate and
prepare against possible shortages. Semiconductor foundries, for example routinely share their
capacity status with the buyers to weather through peaks and valleys of volatile demand.
The extent of information sharing in a supply chain is expanding.
Another concern associated with the information sharing is the confidentiality of information
shared. Suppose, for example, that a supplier supplies a critical part to two manufacturers who
4D INTERNATIONAL JOURNAL OF MANAGEMENT AND SCIENCE ISSN 2250-0669
JANUARY-JUNE 2012 http://www.4dinternationaljournal.com VOL 2 / ISSUE 1
Pag
e13
compete in the final product market .either manufacturer would not share information(like
sales data)with the supplier unless it is guaranteed that the information is not leaked to the
other manufacturer. But the situation becomes tricky if the supplier and one of the two
manufacturers are the same company.
Technology is another constraint in information sharing. Implementation of a cross
organizational information system is costly, time consuming and risky. Partners may not agree
on the specifications of t he technical system, e.g.; EDI standards, or how to split the cost of
investing in the system.
The timeliness and accuracy of the shard information could be another major hurdle. PC
manufacturers often complaint about not being able to get accurate sell through data from their
resellers. Some resellers share such data on a monthly basis, but then the definition of a month
varies by resellers.
Finally, we should note that information sharing is only an enabler for better coordination and
planning of the supply chain. Hence companies must develop capabilities to utilize the shared
information in an effective way.
References
1. Addicott, M. ―The Web as a Vehicle for value Creation in Logistics,‖ talk presented at
Graduate school of Business, Stanford University, 1997.
2. Barrett, S., and B. Konsynski, ―Inter-organizational Information Sharing Systems,‖ MIS
Quarterly, Special Issue, 1982
3. Cachon, G., and M. Fisher, Supply Chain Inventory Management and the Value of Shared
Information‖ Working Paper, Wharton School, University of Pennsylvania, 1997.
4. Gavirneri, S.R. Kapuscinski, and S. Tayur, ―Value of Information in Capacitated Supply
Chains‖, Working Paper, Carnegie-Mellon University, 1996.
5. Lee, H., V. Padmanabhan, and S. Whang, ―Information Distortion in a supply chain: The
Bullwhip Effect,‖ Management Science, 43(4)1997
6. Lee, H., V.Padmanabhan, and S.Whang, ―The Bullwhip Effect in supply chains‖ Sloan
Management Review, 38(3), 1997.
7. Lee, H., R.So and C.Tang, ―The Value of Information Sharing in a Two-Level Supply
Chain,‖Working Paper, Stanford University, 1998.
8. Lee H., S. Whang ―Information Sharing in a supply chain‖, Graduate School of Business,
Stanford University.1998
9. Milgrom, P and J. Roberts, ―Communication and inventory as substitutes in Organizing
Production,‖Scanddinavian Journal of Economis, 90, 1988.

4D INTERNATIONAL JOURNAL OF MANAGEMENT AND SCIENCE ISSN 2250-0669
JANUARY-JUNE 2012 http://www.4dinternationaljournal.com VOL 2 / ISSUE 1
Pag
e14
10. Sokol, P., From EDI to Electronic Commerce, McGraw-Hill Inc., 1995.
11. Sople V.V. ―Supply Chain Management, Text & Cases. Pearson Education in South
Asia.2011
12. Tasy, A,‖Forecast Revision and Supply Chain Performance,‖ Working Paper ,Santa Clara
University,1997.

4D INTERNATIONAL JOURNAL OF MANAGEMENT AND SCIENCE ISSN 2250-0669
JANUARY-JUNE 2012 http://www.4dinternationaljournal.com VOL 2 / ISSUE 1
Pag
e15
CONSUMER PERCEPTION OF BUSINESS MAGAZINES
Dr. Nisha Singh
Vorheese College,Denmark City.
SC,USA
Dr. Chandra Bhusan Singh
Vorheese College,Denmark City
SC,USA.
Dr. Prabha Kishore
Ganga Devi Mahila College,
Patna, India
Abstract
Business Magazines have an important role to play in the urban and semi-urban population of
India. There are certain qualities in Business magazines which keep the consumer tie up with
it. In order to bring out the consumer’s likes and dislikes, their preference standard, frequency
of uses and other apparent and hidden traits, this research work was conducted in the
National Capital Region of India. National Capital Region is the only region which truly
depicts and represents Indian consumers. It comprises of the State of Delhi, Haryana,
(Gurgaon and Faridabad, the two most important Business and Industrial township), U.P
(Noida, Greater Noida, and Ghaziabad, all important educational and industrial hubs of
India). The research survey was conducted from various demographic factors such as age,
profession, gender (male and female) and various Income groups. There are three main
factors, on which analysis was done,
1) Consumer Preferences
2) Features of Magazines (Quality, Authenticity and Subscription)
3) Promotional Offers
Further, a cross tabulation was done on different age groups and income groups. At the end
conclusions were drawn in such way which could be used by the present and future Business
Magazines in launching and upgrading their present status in order to sustain and expand
their business. The aim of this project is to understand the consumer perception of Business
Magazines, their preferences and like and dislikes in the Nation Capital Region, Delhi. Thus
to arrive at an authentic findings in order to make aware the Business Magazines all about
their present and prospective consumers. This will serve as valid points while taking strategic
decision towards, launching, upgrading, product specification and marketing.

4D INTERNATIONAL JOURNAL OF MANAGEMENT AND SCIENCE ISSN 2250-0669
JANUARY-JUNE 2012 http://www.4dinternationaljournal.com VOL 2 / ISSUE 1
Pag
e16
Research Methodology
Primary Data
This research survey was done for 500 respondents. These belonged to different age groups,
professions, gender and income group. We could draw a relation between demographics and
other factors that influence the consumers in buying business magazines. We could study the
sample on the following parameters:
Ratio of Male and Female.
Percentage of people in different Age group.
Percentage of people in different Profession..
Percentage of people belonging to different Income group.
Secondary data
Secondary data were used from the Magazines Websites, Research Journals and Articles.
Tool used:-
Check list - from the Interview of selected consumers
MS Word - for documentation and final report
MS Excel - To perform one-to-one analysis of consumers and magazines
SPSS - Capturing the data across 500 consumers
-To generate reports to assist in findings and conclusion.

4D INTERNATIONAL JOURNAL OF MANAGEMENT AND SCIENCE ISSN 2250-0669
JANUARY-JUNE 2012 http://www.4dinternationaljournal.com VOL 2 / ISSUE 1
Pag
e17
Ratio of Male and Female
Ratio of Sex
Table - 1
Frequenc
y Percent Valid Percent
Cumulative
Percent
Valid Male 352 70.4 70.4 70.4
Female 148 29.6 29.6 100.0
Total 500 100.0 100.0
Male
Female
Ratio of Male &
Female
(Figure 1)
(Table 1- Figure 1) Show the ratio of Male and Female total 500 surveyed. The graph shows
the percentage of both Sexes in our sample size of 500. The total number of males surveyed
were 352 i.e. 70% of the total sample and the females were 148 i.e. 30% of the total sample.
The ratio of male and female is 2.37:1.

4D INTERNATIONAL JOURNAL OF MANAGEMENT AND SCIENCE ISSN 2250-0669
JANUARY-JUNE 2012 http://www.4dinternationaljournal.com VOL 2 / ISSUE 1
Pag
e18
Age-wise Distribution of Respondents
Age Distribution
Table 2
Frequency Percent Valid Percent
Cumulative
Percent
Valid 15-25 240 48.0 48.0 48.0
25-35 126 25.2 25.2 73.2
35-45 83 16.6 16.6 89.8
45-55 10 2.0 2.0 91.8
55 and
above 41 8.2 8.2 100.0
Total 500 100.0 100.0
15-25
25-35
35-45
45-55
55 and above
Age Distribution
(Figure 2)

4D INTERNATIONAL JOURNAL OF MANAGEMENT AND SCIENCE ISSN 2250-0669
JANUARY-JUNE 2012 http://www.4dinternationaljournal.com VOL 2 / ISSUE 1
Pag
e19
We covered the people in five Age groups i.e. 15-25, 25-35, 35-45, 45-55 and 55& above.
The table shows the percentage of respondents in each of the age group in our sample size of
500 (Table – 2 Figure 2)
The total number of respondents in the age group of 15-25, surveyed were 240 i.e.
48% of the total sample.
The total number of respondents in the age group of 25-35, surveyed were 126 i.e.
26% of the total sample.
The total number of respondents in the age group of 35-45, surveyed were 83 i.e. 16%
of the total sample.
The total number of respondents in the age group of 45-55, surveyed were 10 i.e. 2%
of the total sample.
The total number of respondents in the age group of 55& above, surveyed were 41 i.e.
8% of the total sample.
Income wise Distribution of Respondents
Income Distribution
Table 3
Frequency Percent Valid Percent
Cumulative
Percent
Valid 1-2 Lakhs 96 19.2 19.2 19.2
2-3 Lakhs 144 28.8 28.8 48.0
3-4 lakhs 146 29.2 29.2 77.2
4-5 Lakhs 67 13.4 13.4 90.6
5 Lakhs&
above 47 9.4 9.4 100.0
Total 500 100.0 100.0

4D INTERNATIONAL JOURNAL OF MANAGEMENT AND SCIENCE ISSN 2250-0669
JANUARY-JUNE 2012 http://www.4dinternationaljournal.com VOL 2 / ISSUE 1
Pag
e20
1-2 lakhs 2-3 lakhs 3-4 lakhs 4-5 lakhs 5 lakhs and above
Income Distribution
Figure 3
We covered the people in five Income groups i.e. 1-2 Lakhs, 2-3 Lakhs, 3-4 Lakhs, 4-5 Lakhs
and 5 Lakhs & above. The table shows the percentage of respondents in each of the Income
group in our sample size of 500. (Table – 3 Figure 3)
The total number of respondents in the Income group of 1-2 Lakhs, surveyed were 96
i.e. 19% of the total sample.
The total number of respondents in the Income group of 2-3 Lakhs, surveyed were 144
i.e. 29% of the total sample.
The total number of respondents in the Income group of 3-4 Lakhs, surveyed were 146
i.e. 30% of the total sample.
The total number of respondents in the Income group of 4-5 Lakhs, surveyed were 67
i.e. 13% of the total sample.

4D INTERNATIONAL JOURNAL OF MANAGEMENT AND SCIENCE ISSN 2250-0669
JANUARY-JUNE 2012 http://www.4dinternationaljournal.com VOL 2 / ISSUE 1
Pag
e21
The total number of respondents in the Income group of 5 Lakhs& above, surveyed
were 47 i.e. 9% of the total sample.
Profession wise Distribution of Respondents
Professional Distribution
Table - 4
Frequency Percent Valid Percent
Cumulative
Percent
Valid Students 180 36.0 36.0 36.0
Service 199 39.8 39.8 75.8
Business 94 18.8 18.8 94.6
Others 27 5.4 5.4 100.0
Total 500 100.0 100.0
Students Servic
e Business
Other
s
Professional Distribution
Figure 4

4D INTERNATIONAL JOURNAL OF MANAGEMENT AND SCIENCE ISSN 2250-0669
JANUARY-JUNE 2012 http://www.4dinternationaljournal.com VOL 2 / ISSUE 1
Pag
e22
The above (Table – 3 Figure 3) show the Profession wise composition of respondents. We
covered the people in four Professional groups i.e. Students, Service, Business & others
(retired) total 500.
The total number of respondents student group, surveyed were 180 i.e. 36% of the total
sample.
The total number of respondents in the service group, surveyed were 199 i.e. 39% of
the total sample.
The total number of respondents in the business group, surveyed were 94 i.e. 19% of
the total sample.
The total number of respondents in the others group, surveyed were 27 i.e. 6% of the
total sample.
(1) Consumer Preference
Business Today.
Business Standard.
Business World.
Business India.
India today.
Business India.

4D INTERNATIONAL JOURNAL OF MANAGEMENT AND SCIENCE ISSN 2250-0669
JANUARY-JUNE 2012 http://www.4dinternationaljournal.com VOL 2 / ISSUE 1
Pag
e23
Figure 5
Consumer Preferences of Business Magazines
SNO NAME NUMBER OF
READERS
1 BUSINESS TODAY 198
2 BUSINESS WORLD 167
3 INDIA TODAY 205
4 BUSINESS INDIA 45
5 BUSINESS STANDARD 94

4D INTERNATIONAL JOURNAL OF MANAGEMENT AND SCIENCE ISSN 2250-0669
JANUARY-JUNE 2012 http://www.4dinternationaljournal.com VOL 2 / ISSUE 1
Pag
e24
Table 5
Analysis
From the table given above it is clearly visible that the most popular magazine among the
reader is India Today with 205 out of 500 respondents reading it. It is closely followed by
Business Today with 198 readers and Business World with 167 readers. The least read
magazine out of those mentioned in the questionnaire was Business India with only 45 readers
opting for it.
(2) FEATURES (Ranking 1 to 7
(1) Quality of articles.
(2) Value for money.
(3) Reference value.
(4) Credibility & authenticity.
(5) Cover page personality
(6) Subscription offers
(7) Ease of availability

4D INTERNATIONAL JOURNAL OF MANAGEMENT AND SCIENCE ISSN 2250-0669
JANUARY-JUNE 2012 http://www.4dinternationaljournal.com VOL 2 / ISSUE 1
Pag
e25
A) Quality of Article (Table 6-A)
Quality of Articles
Table 6-A
Frequency Percent Valid Percent Cumulative
Percent
Valid Highly Influential 289 57.8 57.8 57.8
Influential 77 15.4 15.4 73.2
Sum what
Influential 110 22.0 22.0 95.2
Neutral 5 1.0 1.0 96.2
Some what Less
Influential 17 3.4 3.4 99.6
Least Influential 2 .4 .4 100.0
Total 500 100.0 100.0

4D INTERNATIONAL JOURNAL OF MANAGEMENT AND SCIENCE ISSN 2250-0669
JANUARY-JUNE 2012 http://www.4dinternationaljournal.com VOL 2 / ISSUE 1
Pag
e26
4) Credibility and Authenticity (Table 6-B)
Table 6-B
Frequenc
y Percent
Valid
Percent Cumulative Percent
Valid Highly Influential 28 5.6 5.6 5.6
Influential 99 19.8 19.8 25.4
Somewhat
influential 64 12.8 12.8 38.2
Neutral 123 24.6 24.6 62.8
Somewhat less
Influential 144 28.8 28.8 91.6
Less Influential 21 4.2 4.2 95.8
Least Influential 21 4.2 4.2 100.0
Total 500 100.0 100.0
highly influential influential sum what influential neutral some what less influential less influential least influential
Credibility & Authenticity
Figure 6-B

4D INTERNATIONAL JOURNAL OF MANAGEMENT AND SCIENCE ISSN 2250-0669
JANUARY-JUNE 2012 http://www.4dinternationaljournal.com VOL 2 / ISSUE 1
Pag
e27
6) Subscription Offer (Table 6-C)
Subscription Offer
Table 6-C
Frequency Percent Valid
Percent
Cumulative
Percent
Valid Highly Influential 3 .6 .6 .6
Influential 19 3.8 3.8 4.4
Somewhat
Influential 46 9.2 9.2 13.6
Neutral 64 12.8 12.8 26.4
Somewhat Less
Influential 98 19.6 19.6 46.0
Less Influential 80 16.0 16.0 62.0
Least Influential 190 38.0 38.0 100.0
Total 500 100.0 100.0
highly influential influential sum what influential neutral some what less influential less influential least influential
Subscription offer
Figure 6-C

4D INTERNATIONAL JOURNAL OF MANAGEMENT AND SCIENCE ISSN 2250-0669
JANUARY-JUNE 2012 http://www.4dinternationaljournal.com VOL 2 / ISSUE 1
Pag
e28
Analysis
From the observations made above it can be inferred that Quality of article is the most
influencing factor with 289 respondents ranking it as the most important choice that would
influence their choice of business magazine. The second in the list is Ease of Availability with
210 people marking it as second most important feature (Table 6-D).
Credibility and Authenticity and cover page personality are also rated as influential by a lot of
individuals making it another important feature that influences their choice of business
magazine.
Very Influencing Feature Vis a Vis Each Other
Table 6-D

4D INTERNATIONAL JOURNAL OF MANAGEMENT AND SCIENCE ISSN 2250-0669
JANUARY-JUNE 2012 http://www.4dinternationaljournal.com VOL 2 / ISSUE 1
Pag
e29
1. Promotional Offer (Table Fig -7)
Influence of Promotional Offer on Subscription Decision
Table - 7
Frequency Percent Valid Percent Cumulative
Percent
Valid
Yes 221 44.2 44.2 44.2
No 279 55.8 55.8 100.0
Total 500 100.0 100.0
44.2
55.8
yes no
Influence of Promotional Offer on
Subscription Decision
Figure - 7

4D INTERNATIONAL JOURNAL OF MANAGEMENT AND SCIENCE ISSN 2250-0669
JANUARY-JUNE 2012 http://www.4dinternationaljournal.com VOL 2 / ISSUE 1
Pag
e30
Analysis: 55.8% of people feel that promotional offers influence their decision to subscribe or
not.
Promotional Offers
Discounts.
Free coupons.
Free gifts.
Free subscription for limited time period
Cash vouchers
Type of Promotional Offer
Table-8
Offer Type Frequency
Discount 119
Free Coupon 37
Free Gifts 13
Free Subscription 10
Cash Vouchers 18

4D INTERNATIONAL JOURNAL OF MANAGEMENT AND SCIENCE ISSN 2250-0669
JANUARY-JUNE 2012 http://www.4dinternationaljournal.com VOL 2 / ISSUE 1
Pag
e31
Graph-8
Analysis: Discounts are the most preferred scheme, followed by free coupons.
1. Relation between Income and choice of Business Magazine.
Preference of Consumer * Description of Income
Cross Tabulation
Income Group Business
India
Business
Today
Business
Standard
Business
World
India
Today
1-2 Lakhs 12 31 15 25 39
2-3 Lakhs 11 79 12 44 59
3-4 Lakhs 15 52 25 56 56
4-5 Lakhs 5 15 23 27 28
5 Lakhs & above 2 21 19 15 23

4D INTERNATIONAL JOURNAL OF MANAGEMENT AND SCIENCE ISSN 2250-0669
JANUARY-JUNE 2012 http://www.4dinternationaljournal.com VOL 2 / ISSUE 1
Pag
e32
Table - 9
Graph - 9
Analysis & Interpretation
Business magazines are more popular among people with higher income i.e. in the income
group of 3-4 Lakhs.
India Today is most popular among people in the income group of 5 Lakhs &
above.
Business today is most popular among people in the income group of 2-3 Lakhs.
Business world is most popular among people in the income group of 1-2 Lakhs.

4D INTERNATIONAL JOURNAL OF MANAGEMENT AND SCIENCE ISSN 2250-0669
JANUARY-JUNE 2012 http://www.4dinternationaljournal.com VOL 2 / ISSUE 1
Pag
e33
2. Relation between age group and different Business Magazines.
Discounts VS Age
Count
Table-10
Description of Age
Total 15-25 25-35 35-45 45-55
55 and
above
Discou
nts
Yes 39 44 25 0 11 119
No 201 81 59 10 30 381
Total 240 125 84 10 41 500
yes no
discounts
0
50
100
150
200
250
Co
un
t
39
201
44
81
25
59
1011
30
Description of Age
15-25
25-35
35-45
45-55
55 and above
Bar Chart
Fig -10

4D INTERNATIONAL JOURNAL OF MANAGEMENT AND SCIENCE ISSN 2250-0669
JANUARY-JUNE 2012 http://www.4dinternationaljournal.com VOL 2 / ISSUE 1
Pag
e34
Analysis:
Most of the people ranging between 25-35 and 35-45, their purchase decision is affected
by various discounts offered by various magazines. Hence most of the discount offers
should be directed towards them.
Cross tabulation
Quality of articles * Description of Age
Count
Description of Age Total
15-25 25-35 35-45 45-55 55 & above
Quality of
articles Highly Influential 122 83 38 10 36 289
Influential 48 18 11 0 0 77
Somewhat
Influential 57 16 32 0 5 110
Neutral 3 2 0 0 0 5
Somewhat Less
Influential 10 7 0 0 0 17
Least Influential 0 0 2 0 0 2
Total 240 126 83 10 41 500

4D INTERNATIONAL JOURNAL OF MANAGEMENT AND SCIENCE ISSN 2250-0669
JANUARY-JUNE 2012 http://www.4dinternationaljournal.com VOL 2 / ISSUE 1
Pag
e35
highly influential
influential sum what influential
neutral some what less influential
least influential
Quality of articles
0
25
50
75
100
125
C o u n t
Description of Age 15-25 25-35 35-45 45-55 55 and above
Bar Chart
Analysis: Quality of article is considered to be a highly influencing factor for purchase of a business magazine in
the age group of 1-25 and 25-35. Hence care should be taken by the magazines targeting this age group (specified
above)
9. The most susceptible age group among the Respondents.
Relation between Age and Subscription
Cross tabulation
Count
Subscription
Total
Yes No
Description of Age
15-25 128 112 240
25-35 60 65 125
35-45 59 25 84
45-55 3 7 10
55 and above 16 25 41
Total 266 234 500

4D INTERNATIONAL JOURNAL OF MANAGEMENT AND SCIENCE ISSN 2250-0669
JANUARY-JUNE 2012 http://www.4dinternationaljournal.com VOL 2 / ISSUE 1
Pag
e36
15-25 25-35 35-45 45-55 55 and above
Description of Age
0
20
40
60
80
100
120
140
Co
un
t
128
60 59
3
16
112
65
25
7
25
subscription
yes
no
Bar Chart
Figure
Analysis: Around 53% of the respondents in age group 15-25 want subscription and almost 50% of the
respondents ageing between 25-35 and 70% of the people in age group of 35-45 want subscription. We see a
down trend in age group 45-55 i.e. most of the people in this age group don‘t want subscription and a quiet
surprising people between age group of 55 and above want subscription (41% says yes and 59% says no)
Age group vs Discount Offer .
Discounts VS Age
Count
Description of Age
Total
15-25 25-35 35-45 45-55 55 and above
Discount
s
Yes 39 44 25 0 11 119
No 201 81 59 10 30 381
Total 240 125 84 10 41 500
Table

4D INTERNATIONAL JOURNAL OF MANAGEMENT AND SCIENCE ISSN 2250-0669
JANUARY-JUNE 2012 http://www.4dinternationaljournal.com VOL 2 / ISSUE 1
Pag
e37
yes no
discounts
0
50
100
150
200
250
Co
un
t
39
201
44
81
25
59
1011
30
Description of Age
15-25
25-35
35-45
45-55
55 and above
Bar Chart
Analysis:
Most of the people ranging between 25-35 and 35-45, their purchase decision is affected by various
discounts offered by various magazines. Hence most of the discount offers should be directed towards them.
Conclusion and Recommendation
COMMERCIAL /BUSINESS magazines are most popular among students and people
in service where as newspapers are more popular among people in business along with
those retired.
Fairer sex is more influenced by other with regard to its decision to buy or not.
Business magazines are more popular among people with higher income i.e. in the
income group of 3-4 Lakhs.

4D INTERNATIONAL JOURNAL OF MANAGEMENT AND SCIENCE ISSN 2250-0669
JANUARY-JUNE 2012 http://www.4dinternationaljournal.com VOL 2 / ISSUE 1
Pag
e38
India Today is most popular among people in the income group of 5 Lakhs & above.
Business today is most popular among people in the income group of 2-3 Lakhs.
Business world is most popular among people in the income group of 1-2 Lakhs.
Most of the people ranging between 25-35 and 35-45, their purchase decision is
affected by various discounts offered by various magazines. Hence most of the
discount offers should be directed towards them.
Around 53% of the respondents in age group 15-25 want subscription and almost 50%
of the respondents ageing between25-35 and 70% of the people in age group of 35-45
want subscription. We see a down trend in age group 45-55 i.e. most of the people in
this age group don‘t want subscription and a quiet surprising people between age group
of 55 and above want subscription (41% says yes and 59% says no)
Bibliography and References
1. Journals of Intellectual Capital, J. Mouritisen
ISSN : 1469-1930
2. Journals of Business Strategy
ISSN- 0275-6668
3. Journals of Corporate Finance, J.M Netter, A. Poulsen
ISSN- 0929-1199
4. International Journals of Business Performance Management
ISSN- 1368-4892, 1741-5039
5. Journals of Measuring Business Excellence
ISSN- 1368-3047
6. Journals of Boards & Director
ISSN-1467-8683.2010
7. Journals of Harvard Business Review
ISSN- 0017-8012

4D INTERNATIONAL JOURNAL OF MANAGEMENT AND SCIENCE ISSN 2250-0669
JANUARY-JUNE 2012 http://www.4dinternationaljournal.com VOL 2 / ISSUE 1
Pag
e39
8. Journals of Global Ethics
ISSN- 1744-9634
9. www.journalsexpert.com
10. www.globalethics.net/library
11. www.gogf.org
12. www.harvardbusiness.org
13. www.indiatoday.intoday.in/
14. www.businesstoday.in
15. www.businessworld.in
16. www.business-standard.com

4D INTERNATIONAL JOURNAL OF MANAGEMENT AND SCIENCE ISSN 2250-0669
JANUARY-JUNE 2012 http://www.4dinternationaljournal.com VOL 2 / ISSUE 1
Pag
e40
Innovative practices in training and
education sector
Smita Gupta
Assistant. Professor
Greater Noida Institute of Technology, Greater Noida,
Uttar Pradesh, India
Abstract
"There is no doubt that creativity is the most important tool of all. Without creativity,
there would be no progress, and we would be forever repeating the same patterns." Innovation
and creativity can be applied in training as well as in education too.
There are many reasons for people to up skill via qualifications; however, a lack of time and
budget can put people off. But it doesn't have to be this way. With a bit of innovating thinking
your goals can be achieved. Barriers can be removed for individuals for example, checking
out government subsidized funding options or establishing if prior learning and experience
will reduce the amount of study time required to achieve goals.
The traditional way to get qualifications was to do a course over several weeks,
months or even years, at an educational institution. Somewhat surprisingly, and despite huge
advances in technology and communications, very little has changed in the way we teach -
either in formal educational settings or in the world of work. Whereas the ways we learn and
access knowledge in our day-to-day lives are almost entirely informal, the vast majority of
teaching is still done in classrooms and lecture halls. We learn through examples, trial and
error and discussing ideas - with everyone acquiring knowledge at their own pace and in
formats that suit them. We teach through one-size-fits-all curriculum and 60 minute classes
where sharing is akin to cheating. Those who had the qualifications then didn't necessarily
have the practical experience once put out into the workforce. Those with the experience had
to start from scratch and sit through classes in topics where often they already they knew the
content. The good news is that this is starting to change - albeit slowly - as educators and
trainers are increasingly experimenting with new technologies.
Making Use of Social Media Tools
Online Video Creates a Global Classroom

4D INTERNATIONAL JOURNAL OF MANAGEMENT AND SCIENCE ISSN 2250-0669
JANUARY-JUNE 2012 http://www.4dinternationaljournal.com VOL 2 / ISSUE 1
Pag
e41
Gaming Gets Serious
Mobile Learning Comes Into Its Own
Key words: Creativity, Relationship between creativity and innovation, innovative practices
Introduction
Creativity is the bringing into being of something which did not exist before, either as a
product, a process or a thought.
You would be demonstrating creativity if you:
Invent something which has never existed before
Invent something which exists elsewhere but you are not aware of
Invent a new process for doing something
Reapply an existing process or product into a new or different market
Develop a new way of looking at something (bringing a new idea into existence)
Change the way someone else looks at something
Innovation has been understood as the ―implementation of a new or significantly improved
product (good or service), or process, a new marketing method, or a new organizational
method in business practices, workplace organization or external relations"
Creativity and innovation are obviously inter-related. Creativity, is seen as the "infinite source
of innovation", and innovation can in turn be perceived as the application and implementation
of creativity.
Innovation as a paradigm shift
There is a growing desire for a holistic transformation of educational systems (Selinger
etal 2008). Creativity allows for the possibility of making connections across different areas of
knowledge; there is thus a need for innovative spaces that allow for this cross-cultural and
multi-disciplinary approach, which can also include informal knowledge. This approach will
thus challenge the actual, traditional configuration of school space, time and structure (Burke,
2007).
Institutions are generally considered to be resistant to change. As Williamson and Payton
(2009) point out, any kind of educational change is challenging, messy and slow. Schools, in
particular, face an enormous challenge, as there is a pressure to achieve in different areas and
as new requirements do not shade or substitute old ones (Christensen et al., 2008; Punie,

4D INTERNATIONAL JOURNAL OF MANAGEMENT AND SCIENCE ISSN 2250-0669
JANUARY-JUNE 2012 http://www.4dinternationaljournal.com VOL 2 / ISSUE 1
Pag
e42
Cabrera, Bogdanowicz, Zinnbauer, & Navajas, 2005). Moreover, it is quite unlikely that an
institution can provide disruptive change. By disruptive innovation, Christensen et al. mean a
kind of innovation that is not only preoccupied with the improvement of an existing product
(which is called incremental innovation); but which radically changes the paradigms and
principles of the product. A good example of the concept is the case of the personal computer.
Up until the time of its creation, computers were big, expensive machines that only
expert could use. Sustainable innovation made newer, faster, bigger computers. The advent of
the personal computer changed the market, as the product was not as "good" or as
sophisticated as big computers were, but it targeted another type of client (a previous "non-
consumer"). So the introduction of personal computers is a disruptive innovation because it
changes the "idea", market and target of computers, even though its base level was not as
powerful as the big traditional computers (Christensen et al., 2008). Hargreaves (2003)
maintains that the idea that lies behind disruptive innovation is the opposite to that of
sustainable innovation.
Schools do not seem to possess the characteristics of innovative organizations, which
are generally flexible, welcome ideas, are empowering, tolerate risk, celebrate success, foster
synergy and encourage fun (Craft, 2005). Even the implementation of technology in education
has not made the foreseen change: ICT has not had the transformative impact it could have
had and which was expected (Ala-Mutka, Punie, & Redecker, 2008b). According to
Christensen etal. (2008), this is because teachers have used computers to sustain their existing
practices, as displacing them would require a kind of disruptive innovation that is not yet
feasible. If there is a desire to change education, all educational actors should be involved and
must work towards the same goals. Moreover, it is necessary to promote creativity at all
levels, as creativity can contribute to both sustainable and disruptive innovation. Innovation
cannot happen without creativity.
True innovation in education will require, first of all, a paradigm shift in format and
methodology (Simplicio, 2000). This will entail a constant and total renovation, regardless of
previous effectiveness. The main actors of change are teachers (Redecker, 2008), but without
institutional support they could not only ignite but also kill creativity and innovation. They are
the first and most effective source of creativity for learners (Esquivel, 1995), therefore they
need both the support and the resources to innovate. Teachers tend to settle in and become

4D INTERNATIONAL JOURNAL OF MANAGEMENT AND SCIENCE ISSN 2250-0669
JANUARY-JUNE 2012 http://www.4dinternationaljournal.com VOL 2 / ISSUE 1
Pag
e43
comfortable in their profession (Simplicio, 2000). However, teaching careers can last for forty
years, and it seems unthinkable to expect that several generations of students would benefit
from the same approach (Pedró, 2006). Teachers who wish to be creative have to be willing to
change their approach and method (Simplicio, 2000). Teaching creatively and for creativity is
not about adding a few pictures to a handout or a presentation, or making students listen to
music. Educators run the risk of falling into the originality pitfall, believing that creativity is a
synonym of originality (Beghetto, 2007a). Innovating education involves a complete change in
the content and method of teaching, and also in assessment (Simplicio, 2000). There are
already pockets of creativity and innovation in several schools, these "best practices" must
become standards for education.
Technology can help to bring about change (Christensen et al., 2008). The
development and implementation of student-centric technology will bring a need to shift to
student centered pedagogy and the ownership of learning by learners, a quality that is
indispensable for fostering creativity (Woods, 2002). Students could learn with software that
is developed for their kind of intelligence and learning style (Christensen et al., 2008). In this
way, teachers will not be instructors anymore but rather facilitators (Burke, 2007).
Another path to innovation in education would be the establishment of a network of
teachers to disseminate good practice (Hargreaves, 2003). Schools are a good repository of
expertise and variety; teachers have therefore to be encouraged to share their expertise through
the observation of other teachers within and outside their school (Simplicio, 2000). Another
option could be the establishment of an institutional virtual network of expertise, where
teachers could exchange resources and tips (Hargreaves, 2003). Again, technologies are
fundamental for this kind of transformation, as ICT can be an effective and affordable means
of peer-to-peer exchange and networking.
Curricula for creative learning and innovative teaching
Runco (1990) affirms that the thinking of children at all levels of ability is significantly
influenced by the type of opportunities they are given. Offering learners the right chances to
develop their cognitive and creative potential should be a priority in the design of school
curricular. A curriculum is the way in which domains of knowledge are made available to
students (Craft, 2005) and it establishes a vision of the kind of society which policy-makers
want and envisage for the future (Williamson & Payton, 2009). It may be said that a

4D INTERNATIONAL JOURNAL OF MANAGEMENT AND SCIENCE ISSN 2250-0669
JANUARY-JUNE 2012 http://www.4dinternationaljournal.com VOL 2 / ISSUE 1
Pag
e44
curriculum is a political act, which involves several stakeholders (Williamson & Payton,
2009), including the parents. Therefore, choices on what to include in the curriculum should
benefit not only the learners (Williamson & Payton, 2009), but also meet the demands of
different stakeholders.
In order to foster creative learning and innovative teaching, curricula need to undergo a skilful
and thorough development, where re-balancing is a key factor. The literature identified several
aspects for enhancing the curriculum: the balance between different areas of education; the
balance along the curriculum (from pre-school to higher education); the balance between
prescription and freedom; and finally the balance between students' interests and other
educational stakeholders' agendas.
What does creativity mean in education?
In education, the term creativity is often used but seldom defined. As Beghetto (2005)
points out, teachers might ask students to use their creativity in the design of a project, or
might refer to a student's response as creative, without explaining what they mean. A lack of
definition of this concept might result in erroneous assumptions (Beghetto, 2005), leading
teachers and students to identify creativity only with talent, the arts and personal
characteristics.
The Trans disciplinary theories on creativity do not help to frame the issue, as they often
focus on outstanding performances (Runco, 2003), thus reinforcing the link between natural
ability and creative achievements. Research has demonstrated that creative eminent people
have in common several personality traits (Simonton, 1990); however this does not mean that
creativity is limited to natural ability or talent. On the contrary, creative traits should be
identified and studied in order to be able to duplicate and teach them (Simplicio, 2000).
The first step towards creative learning and innovative teaching requires an
understanding of the meaning of creativity for education and its implication. This
entails a threefold procedure:
A de-construction of several current myths about creativity which are leading to a
shared
Misunderstanding of the issue (Sharp, 2004); a discussion and framing of the
implications of "newness and value" in the educational context (Craft, 2005);
An emphasis on the process instead of the product (Runco, 2003).

4D INTERNATIONAL JOURNAL OF MANAGEMENT AND SCIENCE ISSN 2250-0669
JANUARY-JUNE 2012 http://www.4dinternationaljournal.com VOL 2 / ISSUE 1
Pag
e45
Creativity and Innovation in Education
Psychometric approaches have highlighted that creativity is often seen as a talent, or as
a characteristic of eminent people, and distinctive personality traits have been identified to
exemplify a creative mind. At the same time, a number of studies recognize that creativity can
be enhanced and cultivated. Craft (in Craft, Jeffrey, & Leibling, 2001) distinguished two
different trends in research on creativity and developed the concepts of "big C" and "little c
Creativity". The first (big C creativity or BCC) refers to the creativity of the genius, seen in
people such as Mozart, Picasso, and Einstein. Their creative achievements are exemplary and
comprise novelty and excellence in their domain, as well as social recognition and valuation.
Little c creativity (LCC), on the other hand, is not for the gifted and talented and does not
apply to creative and innovative outbursts that have a strong impact on society. LCC could be
seen as behavior and mental attitude, or as the ability to find new and effective solutions to
everyday problems. LCC is not for an extraordinary few. A similar distinction can be found in
Shneiderman (2000), who differentiates between revolutionary creativity, imputable to Nobel
Laureates and geniuses, and evolutionary acts of creativity, which can include doctors making
a diagnosis or an editor drafting a magazine.
LCC seems particularly suitable for the educational sector, where a priority is to
encourage all students and pupils, who have not yet reached their intellectual peak, to achieve
their full potential. This paper will therefore endorse an inclusive or democratic perspective of
creativity, which sees all people as capable of creativity from early childhood onward (Craft,
2005). According to this idea, creative potential can be found in every child (Runco, 2003); it
can be encouraged or inhibited (Sharp, 2004); and its development depends on the kind of
training people receive (Esquivel, 1995).
Given the benefits of creativity to society and individuals, one would expect to see a
celebration of creativity in education (Beghetto, 2005). However, though, there has been a
growing interest in the relevance of creativity for teaching and learning since the 1990's (Craft,
2005), it seems that attempts to bring this issue to centre stage have been overshadowed by
other efforts, and demands on teachers' and students' schedules (Beghetto, 2005).
This study will argue that creativity and innovation in education are not just an
opportunity, but a necessity. First, several emerging trends entail an alteration in the way

4D INTERNATIONAL JOURNAL OF MANAGEMENT AND SCIENCE ISSN 2250-0669
JANUARY-JUNE 2012 http://www.4dinternationaljournal.com VOL 2 / ISSUE 1
Pag
e46
young people learn and understand (Redecker, 2008). Teachers have to attract students'
interest and attention in a new way and as a result the development of creative approaches is
called for (Simplicio, 2000). Secondly, the current and forthcoming cohorts of learners are
growing up surrounded by video-games, mobile phones, and other digital media. This
overwhelming spread of technologies brings a new understanding of communication,
information retrieval and meaning-making. The gap between the school and home digital
environment is thus affecting learners' expectations (Pedró, 2006), building up a perception of
the current educational framework and format's inadequacy (Selinger, Stewart-Weeks, Wynn,
& Cevenini, 2008). Third, creativity has been seen as a form of knowledge creation (Craft,
2005). For all these reasons, it seems clear that creativity and innovation are unavoidable
conditions for the present and future of education.
Nevertheless, it must be noted that, in the educational sector, creativity and innovation
lose some of their areas of overlapping. This is mainly due to the current role of the learner in
formal education. Learners are perceived as the end recipient of methods, pedagogies and
knowledge. Although they are the major stakeholders in education, their current power to
actively contribute to institutional change is limited. Innovation, as stated previously, is the
"implementation" (OECD, 2005) or the "intentional introduction and application" (West &
Richards, 1999) of a novelty which aims to ameliorate a particular situation. Teaching can be
seen as the implementation of methods and pedagogies, and of curricula and contents. Any
kind of teaching which addresses creativity and applies it to methods and contents can be seen
as innovative teaching. At the same time, the cognitive approach to creativity emphasizes its
connection to knowledge and thinking skills, bridging the creativity process with learning. For
these reasons, this work addresses "creative learning" and "innovative teaching". The first
term refers to the possibility for learners to develop their creative skills and to learn in a new,
creative way. The second term includes both the process of teaching for creativity and the
application of innovation to teaching practices.
Technologies for Learning, Creativity and Innovation
The debate on the role of ICT for creativity and innovation in education has become an
important one over the past decade. The rapid development of technology, mainly as a result
of the Internet, has brought about an upsurge of technological tools which young people are
appropriating for use in their everyday lives. As explored by the domestication theory, the

4D INTERNATIONAL JOURNAL OF MANAGEMENT AND SCIENCE ISSN 2250-0669
JANUARY-JUNE 2012 http://www.4dinternationaljournal.com VOL 2 / ISSUE 1
Pag
e47
arrival of ICTs in homes has brought the mobilization of material resources, skills, cultural
values and social competences and capabilities (Silverstone, 2006). The recent rise of social
media is also having an impact on education. These applications have shifted the way users
seek information and the way knowledge is created. The potential of relational communities,
as opposed to locational communities (Bess, Fisher, Sonn, & Bishop, 2002), allows expansion
of interests and expertise with people outside one's local community who are interested in the
same topics. These new forms of communities facilitate collaboration across space and time.
Evolution in communication practices suggests that developments for pedagogy need to
address what it means to be educated in our times (Loveless, 2007), so as to avoid 'yesterday's
education for tomorrow's kids' (Prensky, 2005).
In the past few years, the emergence of a new wave of technologies has been observed.
The rapid uptake of these technologies, which are generally referred to as social computing
applications, has also taken many by surprise. Social computing applications vary from social
networking sites (like Face book; MySpace); sharing of bookmarks (del.icio.us; Citeulike);
sharing of multimedia (Flickr; YouTube), online gaming (Second Life) and blogging, to
mention but a few. These applications offer new opportunities for people to express their
creativity, make it available to a large audience and get feedback and recognition (Cachia,
Compano, & Da Costa, 2007). Analysis of creative people and artistic innovation
demonstrates that scientific and artistic innovations also emerge from collective effort. This is
commonly referred to as social creativity (Fischer, Giaccardi, Eden, Sugimoto, & Ye, 2005).
As discussed by Fischer (Fischer, et al., 2005), an appropriate socio-technical setting
can amplify creativity amongst a group of people by augmenting individual creativity and also
social creativity.
Blogging is an example of how youngsters are using technologies to express their
creativity and to be innovative. Creativity can be at both the individual level and the collective
level.
These applications demonstrate the variety of ways in which users learn how to learn,
which according to Rogers (1983), is a major component of creativity. The example of
blogging shows that children learn how to write for a public, how to link their work to other
works, how to network with other bloggers, how to utilize the blog for their eventual career
paths amongst other skills. This facilitates creative learning, as it enables users to use

4D INTERNATIONAL JOURNAL OF MANAGEMENT AND SCIENCE ISSN 2250-0669
JANUARY-JUNE 2012 http://www.4dinternationaljournal.com VOL 2 / ISSUE 1
Pag
e48
technology to learn in new, creative ways. Such learning processes demonstrate that
technology has great potential for creative learning. Technological skills are important not
only for children at schools but also for lifelong learning (EC, 2008c). The different levels of
interaction and collaboration characteristic of new technologies facilitate personalization of
learning paths. Learners become active stakeholders, who are 'empowered to shape their own
learning spaces and resources' and collaborative learning processes (Ala-Mutka, Bacigalupo
et al., 2008).
Continuous technological change means that learners today need to develop positive
attitudes towards change and also, adaptability (Hinkley, 2001). As Hinkley argues, students
in the future will endorse 'portfolio careers', moving through several careers and different jobs,
including jobs that today still do not exist. Hence, it comes as no surprise that substantial
pressure is being put on schooling systems to acknowledge new ways of dealing with
continuous rapid technological development. Young people today, often referred to as the
NetGen or Google Generation (Herold, 2009), are growing up surrounded and immersed in
technology. Appropriation of technological platforms requires new approaches for education.
This section explores how ICT could act as a platform for fostering creative learning and
innovative teaching in education and how the education sector may leverage on the
opportunities brought about by the new wave of technologies.
Traditionally, creativity has been associated with the artistic world, however, as
Florida
(2002) argues, creativity is an important component of economic growth and social
transformation. Technology, he argues, is one of the major components for fostering future
creative communities, together with Talent and Tolerance.
In terms of innovation, social computing interfaces are particularly interesting in this
debate because in various ways they harness the emerging and increasing role of the user in
the innovation-development process, as well as the ongoing shift towards open innovation
(Lindmark, forthcoming 2009). Various online applications could be used to empower
teachers to become innovative in their teaching, as well as students to develop their creative
skills and learn creatively.

4D INTERNATIONAL JOURNAL OF MANAGEMENT AND SCIENCE ISSN 2250-0669
JANUARY-JUNE 2012 http://www.4dinternationaljournal.com VOL 2 / ISSUE 1
Pag
e49
Summary
This report has provided an overview of how creativity and innovation are
conceptualized in the context of education as well as in training and the emergence of a
knowledge society. The existing research on creativity and innovation is broad, complex and
addresses multi-faceted concepts. For this study, creativity and innovation are understood as
interrelated concepts; the first refers to a product or process which shows a balance of
originality and value, and the second to the implementation of such a process or product in a
given sphere.
The notion of creativity has been researched in various fields and approached in
several ways. This report shows that creativity can be linked to different factors, residing both
in the individual (cognitive abilities, thinking skills, personality traits, knowledge), and in the
surrounding sphere (culture, environment, field and domain). Creativity can be linked to
cognitive and thinking processes as much as to emotional states, such as intrinsic motivation
and affective learning processes. To sum up, all the theories studied indicate that creativity is
context dependent, and arises in the interplay of a number of factors and requisites which can
be supported and/or suppressed.
This report has argued that creativity and innovation are strongly interrelated but it has
also proposed a differentiated approach for the field of education in which creativity is more
strongly linked to learning, and innovation to teaching, hence the notions of creative learning
and innovative teaching. Research indicates that, for a multitude of reasons, creativity is
currently not at the centre of education practices. This suggests that there is a need for a
change in pedagogy towards a more permissive environment which cherishes students‘ ideas,
encourages risk-taking and mistakes, and allows learners to assume ownership of their
learning. The traditional configuration of school space, time and structure also needs a shift
and re-organization for creativity to blossom.
Creativity and innovation in education are not just an opportunity, but a necessity. This
work highlights an inclusive and democratic perspective of creativity, which sees all people as
capable of being creative from early childhood. However, whether people develop their
creativity depends on the kind of training they receive. Accordingly, creativity should be
understood as a skill which may be developed through creative learning and innovative

4D INTERNATIONAL JOURNAL OF MANAGEMENT AND SCIENCE ISSN 2250-0669
JANUARY-JUNE 2012 http://www.4dinternationaljournal.com VOL 2 / ISSUE 1
Pag
e50
teaching. The fostering of such skill depends substantially on the development of curricula,
where a balance among the different subject areas, between prescription and freedom and in
agendas should be a priority. Assessment in schools also needs to be addressed as current
methods often do not take into account creativity and may even stifle it. The rapid
development and take up of technology, especially by young people, has a significant impact
on education, challenging educators and institutions to address the changed learning patterns
and needs of their students. The emergence of social computing applications, in particular,
allows for personalization of learning paths, making learning opportunities tailored to the
individual‘s needs a reality. New digital formats employing a variety of media tools open up
new sources and resources for creative expression. Collaboration and networking services
offer further opportunities to develop creative ideas in cooperation with others. Both creativity
and ICT require the re-definition of the role of the teachers as enablers, motivators, mentors
and coaches of learning processes that are essentially owned and controlled by the learners
themselves.
The fostering of creativity and innovation cannot rely on the intention of educators and
pupils, as there are several conditions to be met to promote a creative and innovative learning
environment. Therefore, a set of 'enablers' is proposed as a framework for understanding the
conditions or the support mechanisms that allow creative learning and innovative teaching to
emerge, and thus facilitate creativity and innovation. These are: assessment; culture;
curriculum; individual skills; teaching and learning format; teachers; technology; and tools.
In conclusion, this report provides a theoretical grounding and a working definition
for creativity and innovation. It also explores the role and function of creativity and
innovation in the educational domain and the factors which are likely to enable or inhibit
creative learning and innovative teaching. Finally, it analyses the role and potential of ICT
and in particular, social computing, in fostering creativity and innovation in education.
REFERENCES
Aho, E. (2006). Creating an Innovative Europe, http://ec.europa.eu/invest-in
research/pdf/download_en/aho_report.pdf
Ala-Mutka, K. (2008). Social Computing: Study on the Use and Impacts of
Collaborative Content, http://ftp.jrc.es/EURdoc/JRC47511.pdf

4D INTERNATIONAL JOURNAL OF MANAGEMENT AND SCIENCE ISSN 2250-0669
JANUARY-JUNE 2012 http://www.4dinternationaljournal.com VOL 2 / ISSUE 1
Pag
e51
Ala-Mutka, K., Bacigalupo, M., Kluzer, S., Pascu, C., Punie, Y., & Redecker, C.
(2008).Learning2.0: The Impact of Web2.0 Innovation on Education and Training in
Europe:
Report on a validation and policy options workshop organized by IPTS. Seville, 29-30
October 2008, http://ftp.jrc.es/EURdoc/JRC50704.pdf
Ala-Mutka, K., Punie, Y., & Redecker, C. (2008a). Digital Competence for Lifelong
Learning
http://ftp.jrc.es/EURdoc/JRC48708.TN.pdf
Ala-Mutka, K., Punie, Y., & Redecker, C. (2008b). ICT for Learning, Innovation and
Creativity, http://ftp.jrc.es/EURdoc/JRC48707.TN.pdf
Albert, R. S., & Runco, M. A. (1990). Theories of creativity. Newbury Park ; London:
Sage Publications.
Albert, R. S., & Runco, M. A. (1999). A History of Research on Creativity. In R. J.
Sternberg (Ed.), Handbook of creativity (pp. 16-31). Cambridge: Cambridge
University press.
Almeida, L. S., Prieto Prieto, L., Ferrando, M., Oliveira, E., & Ferrándiz, C. (2008).
Torrance Test of Creative Thinking: The question of its construct validity. Thinking
Skills and Creativity, 3(1), 53–58.
Altshuller, G. S. (1984). Creativity as an exact science: the theory of the solution of
inventive problems. New York: Gordon and Breach Science Publishers.
Amabile, T. M. (1989). Growing Up Creative. New York: Crown Publishing Group,
Inc.
Amabile, T. M. (1990). Within you, without you: The social psychology of creativity,
and beyond. In M. A. Runco & R. S. Albert (Eds.), Theories of creativity (pp. 61-91).
NY, London: Sage.
Amabile, T. M. (1998). How to kill creativity. Harvard business review, 76(5), 76-87.
Aznar, G. (1973). Creativite dans l'entreprise: Ed. d'Organisations.
Aznar, G. (2005). Idées: 100 techniques de créativité pour les produire et les gérer.
Paris: Editions d'Organisation.
Baek, Y. K. (2008). What hinders teachers in using computer and video games in the
classroom? Exploring factors inhibiting the uptake of computer and video games.
Cyberpsychology & Behavior, 11(6), 665-671.
Beghetto, R. A. (2005). Does Assessment Kill Student Creativity? The Educational
Forum, 69, 254–263.
Beghetto, R. A. (2007a). Creativity Research and the Classroom: From Pitfalls to
Potential. In A.-G. Tan (Ed.), Creativity: A Handbook for Teachers (pp. 101-114).
Singapore: World Scientific. Beghetto, R. A. (2007b). Does creativity have a place in
classroom discussion? Prospective teachers' response preferences. Thinking Skills and
Creativity, 2, 1-9.
Bess, K. D., Fisher, A. T., Sonn, C. C., & Bishop, B. J. (2002). Psychological sense of
community : research, applications, and implications. In A. T. Fisher, C. C. Sonn & B.
J. Bishop (Eds.), Psychological sense of community: research, applications, and
implications (pp. xiii, 339 p.). New York, N.Y.; London: Kluwer Academic/Plenum
Publishers.

4D INTERNATIONAL JOURNAL OF MANAGEMENT AND SCIENCE ISSN 2250-0669
JANUARY-JUNE 2012 http://www.4dinternationaljournal.com VOL 2 / ISSUE 1
Pag
e52
Do HR competencies differ across Industries and roles?
Ruby Gupta
PhD student, Banasthali University, Rajasthan, India
Dr Harsh Purohit Associate Professor and Chair Coordinator- ICICI Bank CBFSI,
Banasthali University, Rajasthan, India
Dr Anil Kumar Pandey
Director, GNIT Girls Institute of Technology, Greater Noida, India
Abstract
The purpose of this research is to identify the competencies required in HR
professional working in different roles and in different sectors of industry. The sector-
wise and role specific competencies have been identified on the basis of the data
collected on random sampling bases from industries of NCR of Delhi. In order to have
data on different sectors industries of IT, Manufacturing, Insurance, FMCG, Govt. and
some other industries were selected. Two rounds of surveys have been conducted. In
the first round the respondents were asked to rate the Boyatzis list of competencies and
were also asked to list other competencies which they would like to have in fresh MBA-
HR graduate. List of 51 competencies were identified from the responses from different
domains of industry. In second round respondents were asked to prioritize the
competencies for four HR functional roles i.e. strategic partners (SP), change agents
(CA), employee champion (EC) and administrative experts (AE). The data was
analyzed using SPSS program. In order to test the significant difference between more
than two sectors of Industry Bonfferoni post-hoc test was applies. The analysis of data
on required HR competencies for different roles and in different sectors of industries
show that the competencies are role specific and do not change sector wise.
Key words: Competencies, MBA-HR, sectors of industry and Ulrich’s HR Roles Model
Introduction
The role and competencies of HR professionals are more critical today because of increasing
performance requirement in organizations and their changing roles. Corporations are facing
pressures from different stake holders of business environment. The changing need of
management expertise to face the contemporary challenges of management requires
development of competencies for various functions of HR in changing business scenario (M A
Mamun & A B Mohamad, 2009). This paper aims at identifying competencies which are
required by industries in an HR professional in changing business scenario in the context of
Four-Roles Model first presented by Conner and Ulrich (1996), and later by Ulrich (1997).

4D INTERNATIONAL JOURNAL OF MANAGEMENT AND SCIENCE ISSN 2250-0669
JANUARY-JUNE 2012 http://www.4dinternationaljournal.com VOL 2 / ISSUE 1
Pag
e53
The main contribution of the David Ulrich‘s HR Model was the start of the movement from
the functional HR orientation to the more partnership organization in HR management
function. Ulrich (1997) states that HR can help deliver organizational excellence by means of
four methods. First, HR should become a partner with the management of the firm in helping
with strategy execution. Second, HR should contribute expertise in efficient and effective
performance of work, so that costs are cut and quality is maintained. Third, HR should
represent the concerns of the employees to senior management as well as working with
employees to increase and ensure their ability to contribute to the organization through their
competence and commitment. Finally, HR professionals should continually contribute to the
process of change and help improve the organization‘s capacity to do so. Ulrich suggests that
given the business challenges that organizations face today – globalisation, profitability
through growth, technological change, intellectual capital and continuous change – success
depends upon building core capabilities such as speed, responsiveness, agility, learning
capacity and employee competence of the organisation. The HR function is crucial to
organisations achieving excellence (Dave Ulrich, 1998).
Methodology
Survey of industries based on an open ended questionnaire has been conducted, through
emails on random sampling bases for the identification of competencies desired among human
resource management master‘s degree graduates. The questionnaire was circulated among
industries of National Capital Region (NCR) of Delhi working in various sectors like IT,
Manufacturing, Insurance, FMCG, Government and others. The Part -I of the questionnaire
consisted of questions pertaining to the organization, company profile, and number of human
resource management master‘s degree graduates recruited by the organization of the
respondent. In Part- II of the questionnaire respondents were asked for their opinion regarding
competencies desired. List of 51 competencies have been identified from the responses from
different sectors of industry. In second round respondents were asked to prioritize the
competencies for the HR functional roles i.e. strategic partners, change agents, employee
champion and administrative experts as per Ulrich 1997 model. Based on the study the
competencies were ranked for all the four roles of HR. The data was analysed using SPSS
program. In order to test the significance difference between more than two sectors of Industry
Bonfferoni post-hoc test was applied.
Result and discussions
The perception of industry professionals on the importance of competencies desirable in a
human resource management master‘s degree graduate has been derived from the survey
based on an open ended questionnaire conducted among 148 companies of NCR of Delhi
working in different sectors as mentioned in the methodology section of this paper. Industries
operating in different sector were selected as sample so as to have broad sector-wise view
from industries.
The personal data collected from Part-1 of the questionnaire were analyzed and found that:-

4D INTERNATIONAL JOURNAL OF MANAGEMENT AND SCIENCE ISSN 2250-0669
JANUARY-JUNE 2012 http://www.4dinternationaljournal.com VOL 2 / ISSUE 1
Pag
e54
The perusal of the company profile of the respondents and the business operations of
their company brings out that many of them are global players and therefore their
challenges are multifaceted.
The respondents are mostly in the middle and top management levels.
The respondents had long experience in industry- 14 of them have 30 years of
experience, 28 have 24 years of experience, 28 have 17 years of experience, 23 have
13 years of experience, 22 have 10 years of experience and 33 of them have less than
10 year of experience.
The respondents were from different functional roles of HR- 32 of them were from
change agent, 26 had strategic partner role and rest were in employee champion and
administrative expert roles.
The competencies suggested by the respondents in response to the open ended questionnaire
were compiled to get a list of 35 competencies. This compiled list of competencies was again
sent to the same respondents and they were asked to prioritize them in the scale of 1 to 5. To
get a broader view this list of competencies was also sent to some more respondents of
industries. They were further asked to suggest other competency/ competencies desired in
MBA HR graduates. A list of 51competencies was thus compiled. This list of 51 competencies
was again sent to the respondent and they were asked to prioritize each competency on the
basis of four roles given by Ulrich 1997 (Strategic Partner, Change Agent, Employee
Champion and Administrative Expert) in the scale of 1 to 5. Mean of each competency was
calculated and plotted on the Likert Scale of 1 to 5 in Figure-1. The purple colour bar shows
the mean of the competencies corresponding to Administrative Expert. The green colour bar
shows the mean of the competencies corresponding to Employee Champion. The red colour
bar shows the mean of the competencies corresponding to Change Agent. The blue colour bar
shows the mean of the competencies corresponding to Strategic Partner. Based on the mean
values of the competencies top 5 competencies corresponding to four functional roles of HR
have been listed in Table 1. It can be seen from the table that the competencies required for
different functional roles of HR vary according to the functional requirement of HR
professionals. It can be seen that industry today attaches lot of importance to competencies
such as effective communications and ethics & value. It is also observed that that equal
emphasis is being given to soft skills and technical skills. Setting goals and objective (m=5) is
the most important competency for strategic partner roles whereas developing others (m=4.6)
is most important for Employee champion, for change agent the professional has to be change
oriented (m=4.8) and Integrity (m=5) has been considered very important for an administrative
expert.

4D INTERNATIONAL JOURNAL OF MANAGEMENT AND SCIENCE ISSN 2250-0669
JANUARY-JUNE 2012 http://www.4dinternationaljournal.com VOL 2 / ISSUE 1
Pag
e55
Figure 1 : COMPETENCIES CORRESPONDING TO THE FOUR FUNCTIONAL ROLES
OF HR
X-Axis: Likert Scale

4D INTERNATIONAL JOURNAL OF MANAGEMENT AND SCIENCE ISSN 2250-0669
JANUARY-JUNE 2012 http://www.4dinternationaljournal.com VOL 2 / ISSUE 1
Pag
e56
Y-Axis: Competencies
TABLE 1- TOP FIVE COMPETENCIES ON THE LIKERT SCALE
CORRESPONDING TO THE FOUR FUNCTIONAL ROLES OF HR
Strategic Partner
Change Agent
Employee
Champion
Administrative Expert
1. Setting goals and
objectives
1. Change oriented 1. Developing
others
1. Integrity
2. Leadership 2. Initiative 2. Effective
Communicati
on
2. Knowledge of
HR laws
3. Analytical
Approach
3. Effective
Communication
3. Resource
management
3. Effective
Communication
4. Decision making 4. Influencing 4. Building
networks
4. Ethics and value
5. Ethics and value 5. Interpersonal
skills
5. Flexibility 5. Sensitivity
towards meeting
the deadline
The identified 51 competencies were based on the data collected from IT, Manufacturing,
Insurance, FMCG and others like Government etc. A point of study is to find out the
significant difference in importance of each competency between different sectors of
industries. For this purpose Bonfferoni post-hoc test of SPSS program was applied and results
were tabulated for each competency and for different sectors of industry. Comparison of
results show that out of 51 competencies (as listed in Figure-1) 42 do not show significant
difference between the considered sectors of industries whereas 9 shows significant difference
(sig<0.05) between the considered sectors. For example adaptability, confidence, effective
communication, and analytical approach have been perceived equally important for all sectors
of industry where as awareness of social difference show significant difference (sig<0.05)
between IT and insurance sectors.
In order to analyze the role-wise significant difference (Ulrich HR roles model) the Bonfferoni
test was applied and the result shows that competencies such as confidence, self driven,
effective communication and knowledge of computer don‘t change for different roles of HR.
The remaining 47 competencies show significant difference among the roles.
Conclusion
This study identified competencies which are perceived as important by Industry, in MBA –
HR graduates. The results show that industry attaches lot of importance to competencies such
as effective communications and ethics and values. On analysis of the data it is found that
equal emphasis is being given to soft skills and technical skill related to Human Resource
Management. In the Likert scale of 1 to5 it has been found that setting goals and objective is
the most important competency for strategic partner roles whereas developing others is most

4D INTERNATIONAL JOURNAL OF MANAGEMENT AND SCIENCE ISSN 2250-0669
JANUARY-JUNE 2012 http://www.4dinternationaljournal.com VOL 2 / ISSUE 1
Pag
e57
important for employee champion. For change agent the professional has to be change
oriented and integrity has been considered very important for an administrative expert.
Emotional Balance, Confidence, Grievance Handling and Presence of Mind are a few of the
overlapping competencies for all four roles of HR.
The Bonfferoni post-hoc test results show that out of 51 competencies (as listed in Figure-1)
42 do not show significant difference between sectors of industries whereas 9 shows
significant difference (sig<0.05) between the considered sectors. It also shows there is no
significant difference for competencies such as confidence, self driven, effective
communication and knowledge of computer. The remaining 47 competencies show significant
difference among the roles.
Reference
6. Boyatzis, R. E. (1982), ‗The Competent Manager: A Model for Effective Performance‘
(New York: Wiley).
7. Boyatzis, R. E. (1999), ‗Self-directed Change and Learning as a Necessary Meta-
competency for Success and Effectiveness in the 21st Century‘, in R. Sims and J. G.
Veres (eds.), Keys to Employee Success in the Coming Decades (pp. 15–32, Westport:
Greenwood Publishing).
8. Boyatzis, R. E., Cowen, S. S., Kolb, D. A. and Associates (1995), ‗Innovation in
Professional Education‘ (San Francisco: Jossey-Bass).
9. Boyatzis, R. E. and Kolb, D. A. (1995), ‗From Learning Styles to Learning Skills: The
Executive Skills Profile‘, Journal of Managerial Psychology, 10, 5, 3–17.
10. Burke, M. J. and Day, R. R. (1986), ‗A Cumulative Study of the Effectiveness of
Managerial Training‘, Journal of Applied Psychology, 71, 2, 232–45. © Blackwell
Publishing Ltd. 2004. Integrated competency-based approach 257
11. Grugulis, I. (2003), ‗Putting skills to work: learning and employment at the start of the
century‖,
12. Human Resources Management Journal, Vol. 13 No. 2, pp. 3-12.
13. Heyes, J. (2000), ‗Workplace industrial relations and training‖, in Rainbird, H. (Ed.),
Training in the Workplace, Critical Perspectives on Learning at Work, Macmillan,
Basingstoke.
14. Hansson, B. (2001), ‗Competency Models: Are Self-perceptions Accurate Enough?‘
Journal ofEuropean Industrial Training, 25, 9, 428–41.
15. Hofrichter, D. A. and Spencer, L. M., Jr. (1996), ‗Competencies: The Right
Foundation for Effective Human Resources Management‘, Compensation & Benefits
Review, 28, 6, 21–2.
16. Kolb, D. A. (1984), Experiential Learning: Experience as the Source of Learning and
Development (Englewood Cliffs: Prentice-Hall).
17. Lado, A. A. and Wilson, M. C. (1994), ‗Human Resource Systems and Sustained
Competitive Advantage: A Competency-based Perspective‘, Academy of Management
Review, 19, 4, 699–727.

4D INTERNATIONAL JOURNAL OF MANAGEMENT AND SCIENCE ISSN 2250-0669
JANUARY-JUNE 2012 http://www.4dinternationaljournal.com VOL 2 / ISSUE 1
Pag
e58
18. M A Mamun & A B Mohamad, 2009,‖ challenges of management requires the
development of competencies for various functions of HR in changing business
scenario‖
19. McClelland, D. C. (1985), Human Motivation (Glenview: Scott Foresman &
Company).
20. McLagan, P. A. (1997), ‗Competencies: The Next Generation‘, Training &
Development, 51, 5, 40–7.
21. Mulcahy, D. and James, P. (2000), ‗Evaluating the Contribution of Competency-based
Training:
22. An Enterprise Perspective‘, International Journal of Training and Development, 4, 3,
160–75.
23. Pfeffer, J. and Fong, C. T. (2002), ‗The End of Business Schools? Less Success than
Meets the Eye‘, Academy of Management Learning and Education, 1, 1, 78–95.
24. Rahul Choudaha, 2008, Thesis ‗Competency-based curriculum for a master‘s program
in service science, management and engineering (SSME):an online Delphi study‖
25. Senyshyn, 2002, Thesis ‗Cross-cultural competencies in international management
curricula: A Delphi study of faculty perspectives‘
26. Spencer, L. M., Jr. and Spencer, S. M. (1993), Competence at Work: Models for
Superior Performance (New York: Wiley).
27. Ulrich, D. (1997), Human Resource Champions: The Next Agenda for Adding Value
and Delivering Results, Harvard Business School Press, Boston, MA.
28. Vince, R. (1996), ―Experiential management education as the practice of change‖, in
Grey, C. and French, R. (Eds), Rethinking Management Education, Sage, London.
29. Yoghank Lee,( 2006), Thesis ‗An investigation and critique of competencies needed
by human resource development (HRD) master's degree graduates in Korea

4D INTERNATIONAL JOURNAL OF MANAGEMENT AND SCIENCE ISSN 2250-0669
JANUARY-JUNE 2012 http://www.4dinternationaljournal.com VOL 2 / ISSUE 1
Pag
e59
Information Technology Initiatives –
a Revolution in Banking Sector
Abhilasha Singh
Assistant Professor
Jyoti Satsangi
Assistant Professor
Dr Aniruddh Raghav
Professor
Abstract
Integration of banking system using Information Technology to provide solution rather than
products is the most emerging trend in modern banking. Information technology has brought
about a fundamental shift in the functioning of banks. It has helped them in making them
improvements in their internal functioning and also enabled them in smooth integration, being
globally competitive and providing customer delight. This rapid transformation during last
decade in Indian banking industry has made it stronger, efficient, responsive to customer
needs and a lot more competitive. Customers no longer need to visit the branches for their day
to day transactions like cash deposits, withdrawals, collections, balance enquiry, etc. E-
banking and Internet age banking has opened new avenues in convenience banking. Internet
banking is a strategic necessity to increase customer convenience, reduction in transaction
cost and greater speed of response for banks. Entry of ATMs has changed the profile of the
front offices in bank branches. Such information technology advancements have had major
effects on banking relationships. This paper discusses about the information technology
initiatives in the banking industry as a revolutionary phase.
Introduction
Information technology has turned out to be so omniscient that any system lagging behind
technology adaptation is considered as outdated and conservative. The inherent strengths of
technology and the advantages of leveraging it, is quite important for banking sector because
of its scope and services. IT is changing the banking industry and is having the major effects
on banking relationships. Banking is now no longer confined to the branches where one has to
approach the branch in person, to withdraw cash or deposit cheques or request a statement of
4D INTERNATIONAL JOURNAL OF MANAGEMENT AND SCIENCE ISSN 2250-0669
JANUARY-JUNE 2012 http://www.4dinternationaljournal.com VOL 2 / ISSUE 1
Pag
e60
accounts. In true internet banking, any enquiry or transaction is processed on line without any
reference to the branch any time. Providing Internet banking is increasingly becoming a ―need
to have‖ then a ―nice to have‖ service.
Changing scenario of Indian Banking
Indian banking sector has played a commendable role in sustaining its growth keeping pace
with the changing technology. Banking industry across the globe has undergone a tremendous
change in the way the business is conducted. It is the first major non military sector of the
world to be economy to be computerized. The technology has influence every aspect of
banking system. With the development of technology and advent of the internet, customer‘s
expectations of services and products have risen to great heights.
The financial reforms as well as globalization and liberalization measures during 1990‘s have
brought completely a new operating environment to the banks. The arrivals of foreign and
financial institutions, setting up of a number of private players and measures of de-regulation
have introduced a tough competition in this sector.
Presently Indian Banks are combing traditional banking along with the new age technology to
enhance customer service and beat competition. Services and products like anywhere banking,
Tele-banking, internet banking, web banking, e-banking etc have become the buzz word of the
day. Banks are trying to cope with the competition by offering innovative and attractive
packaged technology based services to their customers.
Computerization in public Sector Banks ( as on March 31, 2006)
1) Branches already fully computerized # 48.5%
2) Branches under core banking solutions 28.9%
3) Fully computerized Branches 77.5%
4) Partially computerized branches 18.2%
5) Non computerized branches 4.3%
# Other than branches under Core Banking Solutions.
(Source – Reserve bank of India)

4D INTERNATIONAL JOURNAL OF MANAGEMENT AND SCIENCE ISSN 2250-0669
JANUARY-JUNE 2012 http://www.4dinternationaljournal.com VOL 2 / ISSUE 1
Pag
e61
IT Initiatives In Banks:
In the Indian market, various IT –based banking products, services and solutions are available.
The most common of them are: Phone banking, ATM Facility, Credit, Debit and Smart Cards,
Internet Banking and Mobile Banking, SWIFT networks and Infinite network, connectivity of
bank branches to facilitate anywhere banking. Besides this software‘s are also available to
support bank‘s various requirements ,such as ,MIS helping the bank to generate RBI reports
like SLR,CRR etc., NPA management, Asset & Profitability Assessment, Intelligent Balance
Sheet Analyzer, Relational Database Management Systems for management of data mining
from data ware house.
Bank of India has adopted a number of state of the art techno-products to provide tailor made
solutions to its customers. The technology products like star-e-pay- an internet based option to
make payments for electricity/phone/gas bills etc ,core banking solutions, multibranch
banking, star insta remit –instant transfer of money through RTGS enabled bank/branch, star-
e –remit for transferring money from branch abroad.
Floating ATMs ferry of SBI is an example of how technology is reaching out to customers.
Information Technology, a tool supporting banking system:
“To emerge as a prime national bank backed by modern technology, meeting customers’
aspirations with professional banking services and sustained growth contributing to national
development.”
As reads the mission of one of the leading banks of India. No wonder ,the objectives of the
technology initiatives of the bank in India are aligned to meet their business strategies through
better refined business processes, providing technology enabled products, services and
solutions, improving competitive edge, hastening decision making process and so on, with the
customer as the focus.
Few of the important IT solutions available for banking services are discussed below:
1. Core Banking Solutions (CBS)

4D INTERNATIONAL JOURNAL OF MANAGEMENT AND SCIENCE ISSN 2250-0669
JANUARY-JUNE 2012 http://www.4dinternationaljournal.com VOL 2 / ISSUE 1
Pag
e62
The traditional brick and mortar bank branches are getting networked and becoming an
integral part of an enterprise wide banking platform, called core banking solutions
(CBS). It is enabling the banks to introduce several innovative, multicity –at- par
cheques, internet banking etc. VIJAYA BANK, one of the leading public sector banks,
under the CBS project, has set up its own data centre, while the disaster recovery site
has been co-hosted at the vendor‘s place.
2. Data Mining
Data mining, also referred as analytical intelligence, is the process of selecting,
exploring and modeling large amount of data to uncover previously unknown patterns
for business advantage, reading banks are using DM tools for customer segmentation
and profitability, credit scoring and approval, predicting payment default, marketing,
detecting fraudulent transactions, cash management and fore casting operations,
optimizing stock portfolio‘s and banking investments etc. In addition, banks may use
data mining to identify their most profitable credit card customer or their highest risk
loan applicants.
Specific Uses of Data Mining
Market segmentation: Identify the common characteristics of the customers who
buy the same products from the company.
Customer churn: Predict which customers are likely to leave the company and go
to a competitor.
Fraud Detection: Identify which transactions are most likely to be fraudulent.
Direct Marketing: Identify which prospects should be included in the mailing list
to obtain the highest response rate.
Interactive Marketing: Predict what each individual accessing a website is most
interested in seeing.
Market Based Analysis: understand what products or services are commonly

4D INTERNATIONAL JOURNAL OF MANAGEMENT AND SCIENCE ISSN 2250-0669
JANUARY-JUNE 2012 http://www.4dinternationaljournal.com VOL 2 / ISSUE 1
Pag
e63
purchased together e. g. beer and diapers.
Trend Analysis: Reveal the difference between a typical customer this month and
last.
3. Real Time Gross Settlement
It is a method of payment systems in which all transfers made between participating
banks are cleared and settle irrevocably. As a result, a bank can be reasonably sure to
receive a payment once it has been cleared and credit and systematic risk in the
settlement process are minimized.
4. Mobile Banking
Mobile technology helps in bringing the masses into the financial systems and in
ensuring easy financial inclusion. Mobile phone once considered a luxury is now
a necessary instrument even into a richshawala/farmer. It provides all services like
ATM, it is time saving and cost effective technology. It is referred as wireless banking,
SMS banking, or m- banking. For this you do not require PC worth Rs. 50,000/-, you
can manage with your mobile.
5. Automated Teller Machine
Implementation of ATMs by banks makes certain services available 24 hours a day.
These services include cash withdrawal, cash advance, transfer from account to
account, cash/cheques deposits, balance inquiry, cheques book request, statement
request. In this the customer is issued an access card and a six digit secret number
known as PIN (personal identification number). Now banks are going for using
biometric ATMs using thumb impression for identifying the customers.
6. Internet Banking
Internet banking is the changing face of the banking in the new millennium. Internet
banking offers innovative services like customer can view his account, credit card and
home loan balances, accrued interest, fees and taxes, transactions detail of each
account, pay bills , transfer funds to third party accounts, right from the terminal he is
sitting at.

4D INTERNATIONAL JOURNAL OF MANAGEMENT AND SCIENCE ISSN 2250-0669
JANUARY-JUNE 2012 http://www.4dinternationaljournal.com VOL 2 / ISSUE 1
Pag
e64
7. Communication Networks
The second Rangarajan Committee constituted in 1988 drew up a detailed perspective
plan for computerization in banks and for extension of automation to areas like fund
transfer, electronic mail etc. Based on these recommendations RBI has set up different
levels of communications which has become backbone for interconnectivity among
banks branches. They are BANKNET, INFINET (Indian financial networks),
S.W.I.F.T, EDI (Electronic data interchange), EFT (Electronic funds transfer), MICR
CLEARING, ECS, and ATM NETWORK.
Challenges before a bank to become fully IT enabled
One of the challenges before a bank, which is trying to become IT enabled is that the data
is scattered across the countries. Integration of this data is necessary if the banks have to
succeed on the net.
Other challenges are related to the move towards expanding the basket of financial
products being offered by financial service providers. In developed countries, Financial
Service providers are using the internet as a media for expanding into new products. Banks
are getting into mutual funds and vice-versa. However, in India, archaic regulations do not
allow companies to have a close relationship with the banks owned by them or to offer
products, which are offered by another category of service providers. As a result,
companies like ICICI are forced to keep their banking arms separate from the main
company. They are also prevented from offering products which fall under the preview of
banks. It prevents Indian Financial Service providers from exploiting the power of the web
Besides that, the cost and investment required to implement information technology tools
in banking is in crores of rupees (R. P. Singh, 2007). It is not only the product software
structure but also the professional service fees which escalate the cost. Product software
structure comprises of one time license fee annual maintenance charge or the Annual
License Fee which can vary from 10 to 20 percent of the software cost. This usually
includes all the enhancements of the product that the vendor will release from time to time.
And the third will be the professional service charges. Service charges will be applicable

4D INTERNATIONAL JOURNAL OF MANAGEMENT AND SCIENCE ISSN 2250-0669
JANUARY-JUNE 2012 http://www.4dinternationaljournal.com VOL 2 / ISSUE 1
Pag
e65
to all activities in which the professional of the vendor will be working. The last
component is most prone to cost surprises.
On the other hand, Professional Service Charges are marked as per-day fee for vendor
professionals, allowance and hotel charges (if applicable). Normally banks are
overburdened with the fees they need to ay to these professionals.
The main culprit here is the professional fee for consultants. It is not always necessary that
the vendor engineers are the most proficient ones. In fact most of the vendors send only
the second or third line of consultants / engineers for implementation projects. This means
that while the vendor consultants are refining their skills on their product, you keep paying
more and more. Or you become their training ground. Besides, the professional service
effort is always an estimated effort; you cannot bind the vendor once the work agreement
is signed off.
In situations where the system integration has to be done between two different systems,
such as in the case of Internet banking or treasury systems, which have to be connected to
the core banking system using APIs (Application Programming Interface), the risk of cost
escalation on this account increases many folds.
The one way out seems to be to provide for a fixed charge for professional services. Most
probably you will have selected the product through a quotation process form a number of
vendors. And you can insist on a fixed charge for the professional services, else the
quotation has no meaning. Another alternative is to have a man-days budget with a
variation cap incorporated in the contract.
Advantages of IT in Banking:
The IT has labeled the playing field and afforded open access to customers in the global
market players. Internet banking is a cost effective delivery channel for financial
institutions. Consumers are enjoying benefits of Internet banking. Access to ones accounts
at any time and from any locations via the World Wide Web is a convenience unknown a
short time ago.

4D INTERNATIONAL JOURNAL OF MANAGEMENT AND SCIENCE ISSN 2250-0669
JANUARY-JUNE 2012 http://www.4dinternationaljournal.com VOL 2 / ISSUE 1
Pag
e66
The six major advantages of IT in banking are:
Improved customer access
Attract new customers
Facilitate the offering of more services
Reduce customer attrition
Provide services offered by competitors
Increase customer loyalties
Conclusion:
Emergence of IT as a power full tool for banking sector is now a universally accepted fact
and is increasingly becoming essential and important part of all banking procedures. In
today‘s rapidly changing ―jet and net‖ age nobody can even think about conventional, time
taking, irritating banking procedures of yesterday
IT has brought about a fundamental shift in the functioning of banks. It has helped in
making them improvements in their internal functioning. Customer no longer needs to visit
the branches for their day to day transactions. Internet age banking has opened new
avenues in convenience banking.
REFERENCES
1. Business Standard Banking Annual, November 2005.
2. http://www.banknetindia.com/banking/bitpresentlevel.htm
3. Professional Banker, January 2007, The Icfai University Press.
4. The Analyst, January 2007, The Icfai University Press.
5. The Indian Banker, January 2007, Vol II, No 1.
6. The Indian Banker, November 2006, Vol I, No. 11.
7. The Indian Banker, December 2006, Vol I, No. 12.
4D INTERNATIONAL JOURNAL OF MANAGEMENT AND SCIENCE ISSN 2250-0669
JANUARY-JUNE 2012 http://www.4dinternationaljournal.com VOL 2 / ISSUE 1
Pag
e67
MANAGEMENT OF LUBRICANTS
(Storage and Handling)
Prof. S. B. Srivastava,
Principal,
S.E.T. Sitapur, Sitapur Sikshan Sansthan,
Rasyora, Sitapur, U.P., INDIA
Abstract:
The principle of supporting a sliding load on a friction reducing film is called
lubrication. The substance which forms such a film is called lubricant. It is a fact that
fluid friction is much lower than solid friction. The example is that a boat can be more
easily towed across water than it can be dragged on land. Therefore if, it is necessary to
reduce the friction between two sliding surfaces, a fluid or fluid like film should be
interposed between the sliding surfaces. All the liquids are able to provide a fluid film but
however, some materials are better suited than others in providing proper lubrication.
The materials which do not stick on sliding surfaces or do not form suitable thin layers
between sliding surfaces are not suitable for lubrication e.g. mercury and alcohol.
Mercury is not sticking on the surfaces and alcohol is forming very thin layer on surfaces
which is not adequate to carry the loads. So mercury and alcohol are not suitable for
lubrication. Properly planned storage and handling system of lubricants gives many
benefits to industries. It gives the guarantee that quality of lubricant is same as it was
supplied i.e. there is no chances of quality degradation. It ensures that there is no
contamination in product. Losses due to leakage and handling are reduced. The chances
of using incorrect grade and mixing up of products are eliminated. There are
multimillion losses to Indian Industries in lubricants due to inadequate system of storage
and handling. If, perfect system of storage and handling of lubricants is adopted, this
amount can be saved.
Introduction:
The basic purpose of the lubrication is to reduce friction between the two sliding
surfaces, minimize the wear of sliding surfaces, dampen the shock if exerted on the
sliding surfaces, cool the relative moving surface in contact, prevent the corrosion effect
and seal out for contaminants. Generally the lubrication materials which may be used as
lubricants are water, lard or tallow, fish or vegetable oil, graphite or talk and petroleum
products like oil and greases. Water can provide a film between the moving or sliding
surfaces effectively but it is undesirable because it is squeezed out under load and it

4D INTERNATIONAL JOURNAL OF MANAGEMENT AND SCIENCE ISSN 2250-0669
JANUARY-JUNE 2012 http://www.4dinternationaljournal.com VOL 2 / ISSUE 1
Pag
e68
causes rusting to ferrous parts. Lard, tallow, fish and vegetable oils have the disadvantage
that they all are susceptible to decomposition when they come in contact with heat and
moisture.
It has been seen in many industries either in India or in Abroad, that the Oil Godown is
full of spilled and scattered oil at all around the site. Every day maintenance personnel in
plants across North America fill or top-up systems with new lubricants. Their intention
is to enhance the life and performance of the equipment. Yet, unknowingly they often add
or mix chemically-depleted lubricants containing particulate, chemical and moisture
contamination. Poor system of lubricants storage in plant often lies at the root of these
occurrences.
Lubricants should also be considered working components in mechanical systems just
like bearings, gears or valves. Dirty or damaged bearing should not be installed on a
piece of equipment using the wrong tools and "damaged" lubricants should not be added
to the machine. The first step toward achieving proactive maintenance of lubricants and
ultimately the equipment begins with proper in-plant storage and handling of lubricants.
Routine analysis of new oils should be employed to ensure effective contamination
control.
Lubricants in storage are also subject to particle agglomeration. Agglomeration occurs
when smaller particles combine to form larger and more harmful particles. These harmful
particles will generally gather at the bottom of the container. It should be remembered
that while drum agitation is done for re-suspending additives, it is also being done
automatically the re-suspending of settled contamination.
Literature Survey:
There is very little literature on lubrication. Most of the industries are adopting their own
practices whatever they learned from the past. Fitch, J.C. and Drew D. Troyer, with John
McKetta, et al Editors, (2005) have described the performance of lubricant. Fitch, J.C.,
(2006), gave the thrust on contamination control in lubricants. The contribution of Fitch,
J.C. et al (1991, 1995, 1996, 2003, 2004, 2001, and 2006) is remarkable document for
storage and handling of lubricants.
Interview with Prof. Peter Jost, (2006) ―Interview with Luminary Professor H. Peter
Jost,‖ Machinery Lubrication Magazine, January-February issue is one of the good
articles. Interviewed by Mr. Krokawa, (2005) Editor of Journal of Economic
Maintenance Tribology (Japan), ―Progress of Lubrication Education and Certification,‖
is giving a few point on lubricants managements. Interview with Mario Andretti, (2003)
"The Greatest Racecar Driver of All Times," Practicing Oil Analysis‖ is good article
giving the knowledge about the lubrication. Interviewed by Marian Hookham (2002),
"The Good Oil - Trends in Lubrication in the Mining Industry" Australia‘s Mining

4D INTERNATIONAL JOURNAL OF MANAGEMENT AND SCIENCE ISSN 2250-0669
JANUARY-JUNE 2012 http://www.4dinternationaljournal.com VOL 2 / ISSUE 1
Pag
e69
Monthly is highlighting nothing on storage and handling of lubricants. Interviewed by
Kathryn Carnes (2001), ―Measure by Measure,‖ Published in Lubricants World
Magazine, is one of the good articles but storage and handling of lubricants do not
discussed.
Fitch, J. C. and M. Barnes, et al, (2003) with George Totten as Editor, Chapter 24:
―Hydrocarbon Analysis,‖ ASTM Fuels and Lubricants Manual, Fitch, J.C. with Robert
Bolt, Editor, (2001) Chapter: ―Particle Counting,‖ Lubrication Guide, Published by the
Electric Power Research Institute (EPRI); Fitch, J.C. with George Totten as Editor,
(2001) Chapter: ―Advancements in Fluid Analysis Technologies and Strategies for
Hydraulic System Condition-Based Maintenance,‖ Hydraulic Failure Analysis: Fluids,
Components, and System Effects and Fitch, J.C. with Heinz P. Bloch, Editor/Author,
(2000), Chapter 19, ―Lubrication Analysis for Condition Monitoring,‖ Practical
Lubrication for Industrial Facilities are very good presentations but storage and handling
is lacking.
PACKAGING AND PRESERVATION OF LUBRICANTS:
Neat and Clean Delivery:
Delivery of lubricant to equipment should be neat and clean. It is important for
equipment life. Sometimes lubricant becomes the major reason of equipment failure.
Even when taking the best care to store lubricants, they are subjected to contamination
ingression when filling or topping up systems. Therefore it is absolutely necessary that
the lubricant should be filtered with an appropriate filter element prior to entering the
equipment. Some lubricant dispensing tips are as under-
Packaging of Lubricants:
Lubricants are packaged in many different forms to satisfy a wide variety of consumption
rates and storage facilities which differs from industy to industry. The four main
industrial lubricant packages are pails (20 liters), drums (200 liters), totes (1600 liters)
and bulk tanks. To select the packaging best suited for consumer needs, following factors
should be considered-
What is average consumption rate? Based on historical consumption rates, it is
easy to determine the average consumption over a period of time.
Maintain a safety stock that accounts for emergency refills and delivery delays.
What is the vendor's standard delivery time? Depending on the lubricant type,
manufacturer and plant location, average delivery can range from one day to two
weeks. Some specialty fluids require even greater lead times to procure. Make
sure that delevery time is well established when estimating ideal lubricant storage
volumes. Quicker the delivery, the less volume will need on-hand.

4D INTERNATIONAL JOURNAL OF MANAGEMENT AND SCIENCE ISSN 2250-0669
JANUARY-JUNE 2012 http://www.4dinternationaljournal.com VOL 2 / ISSUE 1
Pag
e70
How much storage facility space is there? The storage space will help to
determine which type of package and what volumes of lubricant can physically be
stored. Try to ensure the FIFO (first-in/first-out) inventory and usage system, so
that all variety of lubricants can easily be accommodated within space limitations.
What is the condition of storage facility? Storage environment and storage
methods can greatly affect lubricant‘s shelf life. As a thumb rule, a clean and dry
room with a steady moderate temperature combined with proper storage racking
will maximize lubricant shelf life. A dirty, moist environment with fluctuating
temperatures will greatly reduce expected shelf life of lubricants.
Storage Life of Lubricants:
Most lubricants have supplier recommended self life based largely upon the lubricant's
additive package. For example, lubricants containing rust inhibitors may lose
performance after six months in storage periods. Conversely, some turbine fluids with a
light additive dose are having shelf life up to three years. Shelf life information about
lubricants is available with the supplier of lubricants and/or manufacturer. As already
discussed, employ a FIFO rotation of stored lubricants to ensure that lubricant storage
life is not accidentally exceeding. It should also be learned how to read the coded date
on the container label. Shelf life is based on ideal storage conditions of lubricants. Some
manufacturers started to provide a recommended storage procedure to maximize
lubricant‘s shelf life. The following conditions have been proven to affect adversely on
lubricant's storage life.
Effect of Varying Temperatures:
Temperature fluctuations will cause movement of air between the atmosphere and the
head-space of the container (thermal siphoning). This air movement is increased for
partially full containers with greater head-space although the drum is sealed and does not
leak lubricant through the bung. A rigid container still inhales air when the temperature
drops and exhales as the temperature rises. While inhaling, it takes the air alongwith
moisture and small airborne particles which mix with oil of container possibly leading to
degradation of the base stock and additives. There is possibility that water might
condense within the drum, sediment at the bottom and get pumped to the machine during
a top-up.
Extreme Temperature:
Extreme hot or cold conditions can cause chemical degradation. It has already discussed
that rust inhibitors may suffer significant performance losses after only six months of
normal storage time. Depending upon the formulation, a rust inhibitor may have poor
solubility in base oils leading to precipitation during storage. This precipitation is greatly
accelerated during cold storage condition. It indicates that temperature fluctuations decay
the quality and life of lubricants.

4D INTERNATIONAL JOURNAL OF MANAGEMENT AND SCIENCE ISSN 2250-0669
JANUARY-JUNE 2012 http://www.4dinternationaljournal.com VOL 2 / ISSUE 1
Pag
e71
Effect of Humidity on Lubricants:
Petroleum-based lubricants are hygroscopic. When exposed to humid air, they naturally
absorb airborne moisture. Moisture is the enemy of lubricants. The moisture immediately
begins to degrade the additive package and accelerates oxidation of the lubricant's base
stock once it is put into-service. Thus the performance of lubricant degraded.
STORAGE OF LUBRICANTS:
Indoor Storage - Pails, drums and totes must be stored in a clean and dry location.
Storage temperatures should remain moderate at all times. Lubricants in storage should
be located away from all types of industrial contamination including dust and humidity.
Bungs must be kept tight at all times and drum covers should be used whenever drums
are stored in the upright position (bungs should be at 3 and 9, O'clock positions). Ideally,
lubricants are stored in the horizontal position on a proper storage racks allowing the
containers to be rotated and used on a first-in, first-out basis (see Figure 1).
Figure 1 – Storage Racks
Racks of this type can be shop built or obtained commercially in various heights and
width. Drums can be conveniently moved onto and out of this rack with the stacker as
shown in the figure.
Outdoor Storage:

4D INTERNATIONAL JOURNAL OF MANAGEMENT AND SCIENCE ISSN 2250-0669
JANUARY-JUNE 2012 http://www.4dinternationaljournal.com VOL 2 / ISSUE 1
Pag
e72
Only indoor storage of lubricants is recommended but this is not always possible due to
environmental, financial or space constraints. If lubricants are to be stored outdoors, track
lubricant consumption carefully and replenish inventories "just-in-time" to minimize
exposure to adverse conditions. If lubricants are stored outside, shelter them from rain,
snow and other elements. Lay down drums on their sides with the bungs in a horizontal
position, (3 and 9 o'clock), below the lubricant level.
This will greatly minimize the risk of the seals drying out and the ingestion of moisture
caused by breathing (see Figure 2). If the drums must be placed upright in outdoor
storage, employ drum covers or tilt drums to drain the moisture that gathers on the top
around the bungs. Avoid outdoor storage of water-based fluids where extreme
temperatures can have more damaging effect through freezing and evaporation.
Figure 2 – Out door storage
When drums are to be stored outside, a temporary shelter or lean-to, or water proof
tarpaulin should be used to protect them from rain or snow.
Opened containers:
Once the seal is broken and the container is put into use, care must be taken to ensure
control over contamination ingress. If equipped with a proper pressure relief, bulk tanks
should use filter breathers to control contamination ingestion. Drums and pails should be
capped when not in use. If , drums are frequently used, the use of bung breather filters
may be one of the best solution.
Identification of Lubricants:
Two common consequences of lubricant mismanagement are cross contamination and
lubricant confusion. All drums must be clearly labeled and stenciled to ensure proper
product identification. Avoid using labeling methods that are not legible or may wear out
over passage of time. Take extra care in the labeling of containers that have to be stored
outdoors because outdoor environment may damage the labels. Color coding labels
simplifies the process, reducing the risk of misapplication. If a color coding system is

4D INTERNATIONAL JOURNAL OF MANAGEMENT AND SCIENCE ISSN 2250-0669
JANUARY-JUNE 2012 http://www.4dinternationaljournal.com VOL 2 / ISSUE 1
Pag
e73
employed, be sure alpha or numeric information is also present to account for color
blindness.
Identification of Lubricant Dispensing Equipments:
Lubricant dispensing equipment often lies at the root of cross contamination problems.
By dispensing oil through equipment that was previously used with a different lubricant,
the two fluids mix, potentially causing lubrication impairment. Cross contamination is
also a trend-killer, reducing the effectiveness of oil analysis efforts.
Equipment such as transport containers, hand pumps, transfer carts and filter carts should
be labeled to match the lubricant to be used with. Where mixing is unavoidable, verify
compatibility in advance with the lubricant supplier. Extend the identification process to
the machine‘s lubricant fill ports. Using identification tags or color-codes helps to ensure
that the proper lubricant is added to the reservoir fitted with the proper dispensing tools.
If dispensing equipment must be used for a variety of lubricants, employ a proper
cleaning or flushing procedure that emphasizes the removal of the previous lubricant and
other contamination to minimize risk.
Re-Suspending Additives:
To ensure consistency in additive concentration, before dispensing stored lubricants in
cases of storage stability risk, agitate them on a drum tumbler to re-suspend additives that
may have fallen out during storage. Use oil analysis to confirm that oil is in proper
condition for service. This problem can be even more evident in large bulk oil systems
where oil remains static for long periods of time.
For these systems, a circulating system provides constant turnover to keep the additives
evenly distributed. Equip such a circulating rig with dirt and water removal filters for
ensuring proper protection of lubricants.
Cleanliness of New Oil:
In many cases, new oil is the dirtiest oil in the plant. The containers used to store
lubricants are often reused and may be subjected to many extreme conditions before they
reach your plant. Currently, lubricant manufacturers are not required to ensure cleanliness
of the lubricant they provide unless it is advertised as meeting a specified cleanliness
rating. Cleanliness should be written into the lubricant purchase specification.
Cleanliness of new oils typically ranges between ISO 4406 codes of 16/13 to 22/19. Most
of hydraulic and lubrication systems require ISO cleanliness of code of 17. Proper
transfer equipment should be used for the lubricant being dispensed. While topping-up
the system directly or filling a smaller portable container, be sure that the lubricant has
been filtered.

4D INTERNATIONAL JOURNAL OF MANAGEMENT AND SCIENCE ISSN 2250-0669
JANUARY-JUNE 2012 http://www.4dinternationaljournal.com VOL 2 / ISSUE 1
Pag
e74
Following recommendations should be followed for better results.
It is recommended that the oil should be cycled through a high efficiency filter
element with a beta rating matching the equipment requirements. If, storage
method exposes the lubricant to moist environments, two-stage filtering with a
water absorbing filter element is highly recommended.
When transferring lubricants to portable containers, be sure to avoid the use of
galvanized containers since the additive in the lubricant may react with the zinc
plating, forming metal soaps that clog small openings and orifices in industrial
machinery.
Avoid using open or dirty containers for transfer purposes.
Use properly identified, capped containers for low volume transfers.
Conclusion:
An effective proactive maintenance program mandates effective storage and delivery of
lubricants. Protecting the lubricants and ultimately the equipment from the harmful
effects of contamination, the lubricant‘s degradation should be protected which begins
with proper in-plant storage system.
To ensure suitable storage of lubricants, containers should be stored indoors in a dry
location where temperatures remain moderate in all seasons. Clearly identify lubricants
and machine application to avoid confusion and the misapplication of lubricants.
The lubricants should be labeled for its identification and accordingly the equipment‘s oil
box should also be labeled so that their confusion can be avoided. Permanent and weather
proof labels should be used for its long life.
It should be ensured that proper transfer equipment and procedures are framed and
employed for the specific lubricant. These simple steps can substantially enhance the life
of the lubricants and equipments.
Bibliography:
1. E.C. Fitch and J.C. Fitch, Fluid Contamination Control, 4 the Edition, Pending
Publication, 2006.
2. Fitch, J.C. and Drew D. Troyer, with John McKetta, et al Editors, Encyclopedia of
Chemical Processing, Chapter: ―Lubrication Performance Factors for Chemical
Process Plant Machinery,‖ Marcel Dekker Encyclopedias, 2005.
3. Fitch, J.C. and Sabrin Gebarin, Martin Williamson and George Arbocus, with
George Totten, Editor, Chapter 21: ―Food grade and the Food Processing Industry‖,
STLE/ CRC Handbook of Tribology, 2005.
4. Fitch, J.C. with George Totten, Editor, Chapter 32: ―Conservation of Lubricants,
Materials and Energy,‖ STLE/ CRC Handbook of Tribology, 2005.
5. Fitch, J.C., Seminar Coursebook, Effective Contamination Control, Noria Publishing,
2005-2006.

4D INTERNATIONAL JOURNAL OF MANAGEMENT AND SCIENCE ISSN 2250-0669
JANUARY-JUNE 2012 http://www.4dinternationaljournal.com VOL 2 / ISSUE 1
Pag
e75
6. Fitch, J.C. and Sabrin Gebarin, Best Practices in Bulk Lubricant Storage and
Handling, Noria Publishing, 2004.
7. Fitch, J. C., How to Select a Motor Oil and Filter for Your Car or Truck, Noria
Publishing, 2nd Edition, 2004.
8. Fitch, J. C. and M. Barnes, et al, with George Totten as Editor, Chapter 24:
―Hydrocarbon Analysis,‖ ASTM Fuels and Lubricants Manual, ASTM Press, June,
2003
9. Fitch, J.C. with Robert Bolt, Editor, Chapter: ―Particle Counting,‖ Lubrication Guide,
Published by the Electric Power Research Institute (EPRI), October 2001.
10. Fitch, J.C. with George Totten as Editor, Chapter: ―Advancements in Fluid Analysis
Technologies and Strategies for Hydraulic System Condition-Based Maintenance,‖
Hydraulic Failure Analysis: Fluids, Components, and System Effects, ASTM Press,
2001
11. Fitch, J.C. and G. Trujillo, D. D. Troyer, Machinery Lubrication Coursebook, Noria
Publishing, 2001-2006, Multiple Editions.
12. Fitch, J.C. with Heinz P. Bloch, Editor/Author, Chapter 19, ―Lubrication Analysis for
Condition Monitoring,‖ Practical Lubrication for Industrial Facilities, Marcel
Dekker, 2000
13. Troyer, D. D. & J. C Fitch, Oil Analysis Basics, Noria Publishing, 2000-2006,
Multiple Editions
14. . Fitch, J. C. with John Mitchell as Editor, Chapter 11: ―Strategies for Machinery Oil
Analysis,‖ Operating Equipment Asset Management Handbook, Penn State
Publishing, 2000 & 2006. First & Second Edition. .
15. Fitch, J. C. & D. Troyer, Editors, Practicing Oil Analysis Conference Proceedings,
Noria Publishing, 1999-2002 Annual Conferences
16. Fitch, J. C. & D. Troyer, Editors, Lubrication Excellence Conference Proceedings,
Noria Publishing, 2003-2006 Annual Conferences
17. Fitch, J.C., How to Develop a ―Win-Win‖ Relationship with Your Oil Analysis Lab,
Learning Resource Booklet, LRB.9801.1, Noria Publishing, 1998.
18. Fitch, J. C. with E. Richard Booser as Editor, Chapter 75: ―Elements of an Oil
Analysis Program,‖ STLE/ CRC Tribology Data Handbook, CRC Press, 1996.
19. Fitch, J. C., Oil Analysis and Proactive Maintenance, Seminar Course Book,
Diagnostics, 1996.
20. Fitch, J. C., with A.K. Mehta as Editor, Chapter 32: ―A New Approach to
Maintaining Industrial Equipment,‖ Current Trends in Industrial Tribology,
McGraw-Hill Publishing Company, 1995.
21. Fitch, J. C., The Ten Reasons Why Oil Analysis Programs Fail and the Strategies
That Effectively Overcome Them, Diagnetics, Inc., 1995 (Booklet).
22. Fitch, J. C. and H. Borden, ―Comparison of Particle Counts Between Eight
Commercial Oil Analysis Laboratories.‖ Technical Application Article No.8,
Diagnetics, Inc., August, 1992 (Technical Bulletin).
23. Fitch, J. C., Handbook of Case Studies on Fluid Contamination Control, Published by
Diagnetics, Inc., 1991, Booklet.
24. Interview with Prof. Peter Jost, ―Interview with Luminary Professor H. Peter Jost,‖
Machinery Lubrication magazine, January-February issue, 2006

4D INTERNATIONAL JOURNAL OF MANAGEMENT AND SCIENCE ISSN 2250-0669
JANUARY-JUNE 2012 http://www.4dinternationaljournal.com VOL 2 / ISSUE 1
Pag
e76
25. Interviewed by Mr. Krokawa, Editor of Journal of Economic Maintenance Tribology
(Japan), ―Progress of Lubrication Education and Certification,‖ Published in Vol. No.
475, September, 2005.
26. Interview with Mario Andretti, "The Greatest Racecar Driver of All Times,"
Practicing Oil Analysis magazine, March-April, 2003
27. Interviewed by Marian Hookham (Editor) "The Good Oil - Trends in Lubrication in
the Mining Industry" Australia‘s Mining Monthly, October, 2002.
28. Interviewed by Kathryn Carnes (Editor), ―Measure by Measure,‖ Published in
Lubricants World magazine, June, 2001.
29. Interviewed by Curt Bennink, (Staff Editor), ―Maximize Oil Analysis ROI,‖
Published in Equipment Today magazine, August 2000.
30. Mark Barnes, Noria, ―Lubrication: Maintenance Cost or Opportunity?‖. Machinery
Lubrication magazine. July 2005.
31. Ken Brown, Utility Service Associates, ―The Hidden Cost of Oil Changes‖.

4D INTERNATIONAL JOURNAL OF MANAGEMENT AND SCIENCE ISSN 2250-0669
JANUARY-JUNE 2012 http://www.4dinternationaljournal.com VOL 2 / ISSUE 1
Pag
e77
Management of Intellectual Property Rights in India
Dr B R Bishnoi
Professor, School of Law,
Govt. PG Law College, Bikaner, Rajasthan
Parul Goyal
Assistant Professor,
School of Law, Galgotias University, Greater Noida,
Uttar Pradesh.
Email – [email protected]
Abstact
Intellectual Property Rights are largely territorial rights except copyright, which is
global in nature in the sense that it is immediately available in all the members of the
Berne Convention. These rights are awarded by the State and are monopoly rights
implying that no one can use these rights without the consent of the right holder. It is
important to know that these rights have to be renewed from time to time for keeping
them in force except in case of copyright and trade secrets. IPR have fixed term except
trademark and geographical indications, which can have indefinite life provided
these are renewed after a stipulated time specified in the law by paying official fees.
Trade secrets also have an infinite life but they don’t have to be renewed. IPR can be
assigned, gifted, sold and licensed like any other property. Unlike other moveable and
immoveable properties, these rights can be simultaneously held in many countries at the
same time. IPR can be held only by legal entities i.e., who have the right to sell and
purchase property. These rights especially, patents, copyrights, industrial designs, IC
layout design and trade secrets are associated with something new or original and
therefore, what is known in public domain cannot be protected through the rights
mentioned above. Improvements and modifications made over known things can be
protected. It would however, be possible to utilize geographical indications for protecting
some agriculture and traditional products.

4D INTERNATIONAL JOURNAL OF MANAGEMENT AND SCIENCE ISSN 2250-0669
JANUARY-JUNE 2012 http://www.4dinternationaljournal.com VOL 2 / ISSUE 1
Pag
e78
Keyword: Intellectual Property Rights (IPR), Monopoly Rights, Moveable and
Immoveable Properties, Public Domain, Improvements and Modifications.
Introduction
With the advent of the new knowledge economy, the old and some of the existing
management constructs and approaches would have to change. The knowledge economy
places a tag of urgency on understanding and managing knowledge based assets such as
innovations and know-how. The time for grasping knowledge has become an
important parameter for determining the success of an institution, enterprise,
government and industry; the shorter the time better are the chances of success.
Intellectual property rights (IPR) have become important in the face of changing trade
environment which is characterized by the following features namely global
competition, high innovation risks, short product cycle, need for rapid changes in
technology, high investments in research and development (R&D), production and
marketing and need for highly skilled human resources. Geographical barriers to trade
among nations are collapsing due to globalization, a system of multilateral trade and
a new emerging economic order. It is therefore quite obvious that the complexities of
global trade would be on the increase as more and more variables are introduced leading
to uncertainties. Many products and technologies are simultaneously marketed and
utilized in many countries. With the opening up of trade in goods and services
intellectual property rights (IPR) have become more susceptible to infringement leading
to inadequate return to the creators of knowledge. Developers of such products and
technologies would like to ensure R&D costs and other costs associated with introduction
of new products in the market are recovered and enough profits are generated for
investing in R&D to keep up the R&D efforts. One expects that a large number of
IP rights would be generated and protected all over the world including India in all areas
of science and technology, software and business methods.
More than any other technological area, drugs and pharmaceuticals match the above
description most closely. Knowing that the cost of introducing a new drug into the
market may cost a company anywhere between $ 300 million to $600 million along with
all the associated risks at the developmental stage, no company will like to risk its

4D INTERNATIONAL JOURNAL OF MANAGEMENT AND SCIENCE ISSN 2250-0669
JANUARY-JUNE 2012 http://www.4dinternationaljournal.com VOL 2 / ISSUE 1
Pag
e79
intellectual property becoming a public property without adequate returns. Creating,
obtaining, protecting and managing intellectual property must become a corporate
activity in the same manner as the raising of resources and funds. The knowledge
revolution will demand a special pedestal for intellectual property and treatment in the
overall decision- making process. It is also important to realize that each product is
amalgamation of many different areas of science and technologies. In the face of the
competition being experienced by the global community, many industries are joining
hands for sharing their expertise in order to respond to market demands quickly and
keeping the prices competitive. In order to maintain a continuous stream of new ideas
and experimentations, public private partnership in R&D would need to be nurtured to
arrive at a win-win situation. Therefore all publicly funded institutions and agencies will
have to come to terms with the new ground realities and take positive steps to direct
research suitably to generate more intellectual property rights, protect and manage them
efficiently.
Literature Review
According to Rawls John,20001 ‗Justice is the first virtue of social institutions, as truth is
the system of thought. As theory however elegant and economical must be rejected and
revised if it is untrue; likewise laws and institutions no matter how efficient and well
arranged must be reformed and abolished if they are unjust.‘ Aoki, R. and Spiegel,19992
have concluded that ―Public disclosure leads to fewer patent applications and fewer
innovations, but for a given number of innovations, it raises the probability that new
technologies will reach the product market and thereby enhances consumers‘ surplus and
possibly total welfare as well.‖ ―Strong intellectual property protection may be necessary
to stimulate research in a particular field but greater social welfare may be gained at a
later time through open access to technical knowledge that may be effected by public
policy intervention. Impacts on public sector research also need to be considered on a
case-by-case basis. Nations that generate technology have always sought to protect it
while those that import it have pursued avenues that maximize access to the available
technology. The impact of intellectual property protection on health care in the
developing countries has received much attention recently. The impact of intellectual

4D INTERNATIONAL JOURNAL OF MANAGEMENT AND SCIENCE ISSN 2250-0669
JANUARY-JUNE 2012 http://www.4dinternationaljournal.com VOL 2 / ISSUE 1
Pag
e80
property rights on access to essential drugs (including parallel imports),drug pricing,
promotion of research and development (R&D) on tropical diseases, transparency in drug
regulation, and local drug manufacture.‖ C.M. and Yusuf,19983.The same has discussed
by Gupta, A. ,19994 ―Social and economic factors will play a greater role in shaping the
adoption of these technologies. So far, research efforts are shifting towards controlling
the expression of specific traits instead of suppressing the entire germination process.‖
The World Intellectual Property Organization (WIPO) is examining these options
but supporters of sui generis systems as well as some indigenous groups are opposed
to this process and argue that it is will undermine their efforts to secure unique rights at
the national and international level. Resolving these issues may require an exploration of
the extent to which existing intellectual regimes can protect certain aspects of indigenous
knowledge. Youssef , H.,19995
―The assessment points to the call for special and
differential treatment of the developing countries on a case-by-case basis. This principle
is already incorporated into the functioning of WTO and is expressed in many of its
clauses. This is partly a result of the negotiations that took place under other agreements
that provided special treatment to developing countries on public interest issues such as
education.
Intellectual Property Rights (IPR)
Intellectual property rights as a collective term includes the following independent IP
rights which can be collectively used for protecting different aspects of an inventive
work for multiple protection:- Patents, Copyrights, Trademarks, Registered ( industrial)
design, Protection of IC layout design, Geographical indications and Protection of
undisclosed information.
Patents
A patent is an exclusive right granted by a country to the owner of an invention to
make, use, manufacture and market the invention, provided the invention satisfies
certain conditions stipulated in the law. Exclusive right implies that no one else can
make, use, manufacture or market the invention without the consent of the patent
holder. This right is available for a limited period of time. In spite of the ownership of

4D INTERNATIONAL JOURNAL OF MANAGEMENT AND SCIENCE ISSN 2250-0669
JANUARY-JUNE 2012 http://www.4dinternationaljournal.com VOL 2 / ISSUE 1
Pag
e81
the rights, the use or exploitation of the rights by the owner of the patent may not be
possible due to other laws of the country which has awarded the patent. These laws
may relate to health, safety, food, security etc. Further, existing patents in similar area
may also come in the way. A patent in the law is a property right and hence, can be
gifted, inherited, assigned, sold or licensed. As the right is conferred by the State, it
can be revoked by the State under very special circumstances even if the patent has
been sold or licensed or manufactured or marketed in the meantime. The patent right is
territorial in nature and inventors/their assignees will have to file separate patent
applications in countries of their interest, along with necessary fees, for obtaining
patents in those countries. A new chemical process or a drug molecule or an electronic
circuit or a new surgical instrument or a vaccine is a patentable subject matter provided
all the stipulations of the law are satisfied.
Protecting new plant variety
New plant varieties can now be protected in India under the New Plant Variety and
Farmers Rights Protection Act in 2001. New plant varieties cannot be protected through
patents. However, the Act has not become operational as subsidiary legislation is yet to
be put in place. India has enacted the which, in addition to meeting the technical features
of UPOV, provides rights to farmers to use the seeds from their own crops for planting
the next crop. Further, there are provisions for benefit sharing with farmers, penalty for
marketing spurious propagation material and protecting extant varieties. There is a
provision for protecting extant variety and farmers‘ varieties as well. The total period for
protection is 10 years from the date of registration.
There are 5 main criteria to arrive at a decision whether a plant variety is really new or
not. These are distinctiveness, uniformity, stability, novelty and denomination. The
variety shall be deemed to be distinct if it is clearly distinct from any other variety whose
existence is a matter of common knowledge at the time of filing of the application. The
variety shall be deemed to be uniform if, subject to the variation that may be accepted
from the particular features of its propagation, it is sufficiently uniform in its relevant
characteristics. The variety shall be deemed to be stable if its relevant characteristics
remain unchanged after repeated propagation or, in the case of a particular cycle of

4D INTERNATIONAL JOURNAL OF MANAGEMENT AND SCIENCE ISSN 2250-0669
JANUARY-JUNE 2012 http://www.4dinternationaljournal.com VOL 2 / ISSUE 1
Pag
e82
propagation at the end of each such cycle. The variety shall be deemed to be new if, at
the date of filing of the application for breeders right, propagating or harvesting material
of the variety has not been sold or otherwise disposed of to others, by or with the consent
of the breeder for the purpose of exploitation of the variety.
Copyrights
Copyright is a right, which is available for creating an original literary or dramatic or
musical or artistic work. Cinematographic films including sound track and video films
and recordings on discs, tapes, perforated roll or other devices are covered by
copyrights. Computer programs and software are covered under literary works and are
protected in India under copyrights. The Copyright Act, 1957 as amended in 1983,
1984, 1992, 1994 and 1999 governs the copyright protection in India. The total term of
protection for literary work is the author‘s life plus sixty years. For cinematographic
films, records, photographs, posthumous publications, anonymous publication, works
of government and international agencies the term is 60 years from the beginning of
the calendar year following the year in which the work was published. For broadcasting,
the term is 25 years from the beginning of the calendar year following the year in which
the broadcast was made.
Copyright gives protection for the expression of an idea and not for the idea itself. For
example, many authors write textbooks on physics covering various aspects like
mechanics, heat, optics etc. Even though these topics are covered in several books
by different authors, each author will have a copyright on the book written by him /
her, provided the book is not a copy of some other book published earlier. India is a
member of the Berne Convention, an international treaty on copyright. Under this
Convention, registration of copyright is not an essential requirement for protecting the
right. It would, therefore, mean that the copyright on a work created in India
would be automatically and simultaneously protected through copyright in all the
member countries of the Berne Convention. The moment an original work is created,
the creator starts enjoying the copyright. However, an undisputable record of the date
on which a work was created must be kept. When a work is published with the
authority of the copyright owner, a notice of copyright may be placed on publicly

4D INTERNATIONAL JOURNAL OF MANAGEMENT AND SCIENCE ISSN 2250-0669
JANUARY-JUNE 2012 http://www.4dinternationaljournal.com VOL 2 / ISSUE 1
Pag
e83
distributed copies. The use of copyright notice is optional for the protection of literary
and artistic works. It is, however, a good idea to incorporate a copyright notice. As
violation of copyright is a cognizable offence, the matter can be reported to a police
station. It is advised that registration of copyright in India would help in establishing
the ownership of the work. The registration can be done at the Office of the
Registrar of Copyrights in New Delhi. It is also to be noted that the work is open for
public inspection once the copyright is registered.
Industrial Design
We see so many varieties and brands of the same product (e.g. car, television, personal
computer, a piece of furniture etc.) in the market, which look quite different from each
other. If the products have similar functional features or have comparable price tags, the
eye appeal or visual design of a product determines the choice. Even if the similarities
are not close, a person may decide to go for a more expensive item because that item has
a better look or colour scheme. What is being said is that the external design or colour
scheme or ornamentation of a product plays a key role in determining the market
acceptability of the product over other similar products. If you have a good design
that gives you an advantage, then you must have a system to protect its features
otherwise there would be wide scale imitation.
Design as per the Indian Act means the features of shape, configuration, pattern,
ornament or composition of lines or colors applied to any article - whether in two
dimensional or three dimensional or in both forms - by any industrial process or means,
whether manual, mechanical or chemical, separate or combined, which in the finished
article appeal to and are judged solely by the eye; but it does not include any mode
or principle of construction or anything which is in substance a mere mechanical
device. In this context an article means any article of manufacture and any substance,
artificial, or partly artificial and partly natural; and includes any part of an article
capable of being made and sold separately. Stamps, labels, tokens, cards, etc cannot be
considered an article for the purpose of registration of design because once the alleged
design i.e., ornamentation is removed only a piece of paper, metal or like material
remains and the article referred to ceases to exist. An article must have its existence

4D INTERNATIONAL JOURNAL OF MANAGEMENT AND SCIENCE ISSN 2250-0669
JANUARY-JUNE 2012 http://www.4dinternationaljournal.com VOL 2 / ISSUE 1
Pag
e84
independent of the designs applied to it. So, the design as applied to an article should be
integral with the article itself.
Trademarks
A trademark is a distinctive sign, which identifies certain goods or services as those
produced or provided by a specific person or enterprise. Trademarks may be one or
combination of words, letters, and numerals. They may also consist of drawings,
symbols, three dimensional signs such as shape and packaging of goods, or colors used
as distinguishing feature. Collective marks are owned by an association whose members
use them to identify themselves with a level of quality. Certification marks are given
for compliance with defined standards. (Example ISO 9000.). A trademark provides
to the owner of the mark by ensuring the exclusive right to use it to identify goods or
services, or to authorize others to use it in return for some consideration (payment).
Well-known trademark in relation to any goods or services, means a mark which has
become so to the substantial segment of the public which uses such goods or receives
such services that the use of such mark in relation to other goods or services would
be likely to be taken as indicating a connection in the course of trade or rendering of
services between those goods or services and a person using the mark in relation
to the first-mentioned goods or services.
Protection of Geographical Indications
Indications which identify a good as originating in the territory of a member or a
region or a locality in that territory, where a given quality reputation or other
characteristics of the good is attributable to its geographical origin. The concept of
identifying GI and protecting them is a new concept in India, perhaps in most
developing countries, and has come to knowledge in these countries after they signed
the TRIPS Agreement. It may be noted that properly protected GI will give protection in
domestic and international market. Stipulations of TRIPS would be applicable to all the
member countries. According to TRIPS, GI which is not or cease to be protected in its
country of origin or which has fallen into disuse in that country cannot be protected.

4D INTERNATIONAL JOURNAL OF MANAGEMENT AND SCIENCE ISSN 2250-0669
JANUARY-JUNE 2012 http://www.4dinternationaljournal.com VOL 2 / ISSUE 1
Pag
e85
Homonymous GI for wines will get independent protection. Each state shall
determine conditions under which homonymous indications will be differentiated
from each other. Principles of national treatment and fair competition are applicable.
TRIPS provide for seizure of goods bearing false indications of GI. TRIPS provide for
refusal or invalidation of registration of a trademark containing a GI with respect to
goods not originating in the territory indicated. The Geographical Indication of Goods
(Registration and Protection) Act came into being in 2000. (The Act is not
implemented at the time of writing the article as the rules have not been notified.)The
term GI has been defined as "Geographical Indications", in relation to goods, means an
indication which identifies such goods as agricultural goods, natural goods or
manufactured goods as originating, or manufactured in the territory of a country, or a
region or locality in that territory, where a given quality, reputation or other
characteristics of such goods is essentially attributable to its geographical origin and in
case where such goods are manufactured goods one of the activities of either the
production or of processing or preparation of the goods concerned takes place in such
territory, region or locality, as the case may be.
Protection of Integrated Circuit Layout Design (IC)
It provides protection for semiconductor IC layout designs. India has now in place
Semiconductor Integrated Circuits Layout Design Act, 2000 to give protection to IC
layout design. Layout design includes a layout of transistors and other circuitry
elements and includes lead wires connecting such elements and expressed in any
manner in a semiconductor IC. Semiconductor IC is a product having transistors and
other circuitry elements, which are inseparably formed on a semiconductor material or
an insulating material or inside the semiconductor material and designed to perform an
electronic circuitry function. The term of the registration is 10 years from the date of
filing.
Reproducing, importing, selling, distributing the IC layout design for commercial
purposes only constitutes infringement. A person when creates another layout design on
the basis of scientific evaluation of a registered layout design shall not be causing any
infringement.

4D INTERNATIONAL JOURNAL OF MANAGEMENT AND SCIENCE ISSN 2250-0669
JANUARY-JUNE 2012 http://www.4dinternationaljournal.com VOL 2 / ISSUE 1
Pag
e86
Protection of undisclosed information
The protected subject matter is information lawfully within the control of a natural person
or legal person that is secret that has commercial value because it is secret and that has
been subject to reasonable steps by the person lawfully in control of the information, to
keep it secret. Secret is defined as ― secret in the sense that it is not , as a body or in
the precise configuration and assembly of its components known among or readily
accessible to persons within the circles that normally deal with the kind of information in
question.‖ Undisclosed information, generally known as trade secret / confidential
information, includes formula, pattern, compilation, programme, device, method,
technique or process. Protection of undisclosed information is least known to players of
IPR and also least talked about, although it is perhaps the most important form of
protection for industries, R&D institutions and other agencies dealing with IPRs.
Protection of undisclosed information / trade secret is not really new to humanity; at
every stage of development people have evolved methods to keep important information
sec r e t , commonly by restricting the knowledge to their family members. Laws relating
to all forms of IPR are at different stages of implementation in India, but there is no
separate and exclusive law for protecting undisclosed information / trade secret or
confidential information. The Contract Act of 1872 would however cover many aspects
of trade secrets.
It is difficult to define the term in its entirety but, for an easy understanding, it may be
said that a piece of undisclosed information or a trade secret can be as simple an item as a
company's customer list or as complex as a formula for a product or a process. Broadly
speaking, the term would encompass information, including a formula, pattern,
compilation, program, device, method, technique or process that provides the owner
with an advantage over his business competitors who do not know or use it and is of
significance or importance to the business of the company holding the information.
Expanding it further, it may include new product plans, product costing, best material
to use, sources of materials, financial standing of the business, accounting information,
employee records, credit rating of customers, production information, manufacturing
methods and processes, business methods, blueprints, test data, research reports,

4D INTERNATIONAL JOURNAL OF MANAGEMENT AND SCIENCE ISSN 2250-0669
JANUARY-JUNE 2012 http://www.4dinternationaljournal.com VOL 2 / ISSUE 1
Pag
e87
professional pollsters, technical drawings and organisational structure, specifications,
process manuals, written instructions for operating the process and analytical means to
check and control the product and processes, details of workshop practice, technical
training and personal visitation and inspection. On the software side it would include
source code, the data file structure, the structure sequence and organisation of computer
program.
Other related legislation
India enacted the Biodiversity Act 2002 to ensure maintenance, sustenance and
development of its biodiversity. The Act has specific provisions about ownership of
intellectual property rights associated with exploitation of biodiversity. Industries have to
have the prior informed consent of the National Biodiversity Authority before exploring
the biodiversity in India. In the event of R&D based on exploitation of biodiversity and
associated local knowledge, there is a provision for sharing of benefits of such work
with the local community. No direct flow of funds is expected to the community.
Instead the Union Government will reach the benefits through State Governments to the
community.
The other Act having its influence over other Acts related to IPR is the Information
technology Act, 2000 which looks at the security aspect of material being transacted on
internet.
Management of IPR in publicly funded institutions in India
Aims of publicly funded institutions such as universities, colleges, autonomous bodies
and public sector undertakings are multifaceted and are not purely driven by economic
considerations but they are primarily driven by considerations of social obligations and
political objectives and will of a nation. India has stuck to these aims since the
independence. On one hand the above approach has helped us in creating a pool of
highly educated population and also building an inherent strength in research and
development and core competency in basic industries like steel, power, fertilizers
etc. However on the other hand, an insulated system breeds complacency, which
blunts the spirit of innovation and fire for being ahead of others. Globalization has taught

4D INTERNATIONAL JOURNAL OF MANAGEMENT AND SCIENCE ISSN 2250-0669
JANUARY-JUNE 2012 http://www.4dinternationaljournal.com VOL 2 / ISSUE 1
Pag
e88
us many new lessons by opening our eyes to the existing and forthcoming ground
realities, which cannot be shunned away just because we do not happen to like them.
These realities are going to stay. The likely impacts of globalization started becoming a
part of our age old thought process and life style when India decided to become a
member of the World Trade Organization. Since the beginning of 1990s new approaches
started taking roots in respect of such institutions, especially related to their
management and source of funding. It has been observed that educational and R&D
institutions are being asked to generate their own funds and depend less and less on
block grants by central or state governments. In respect of PSU the message has been
to generate more and more revenue from the available resources. The Central
Government was quick to understand the importance of innovations and new ideas for
adjusting to new streams of paradigm shifts. The Government also realized that the
journey is not going to be smooth, easy or straight forward in the absence of knowledge
about new paradigms among scientists, technologists and policy makers. January 1, 1995
came and brought with it the full impact of WTO along with the Agreement of Trade
Related Aspects of Intellectual Property Rights (TRIPS). The Indian system rose to
the new challenge and through its many efforts have taken successful steps towards
transition to a new culture by updating its existing laws, enacting new legislations,
instituting new mechanisms for enabling creation of new intellectual property and its
protection and even evolving novel methods and schemes to promote innovations at grass
roots levels. Managing creativity within the innovation process is not easy. From
providing initial impetus for new ideas and a means of collating and evaluating
them through to determining the most appropriate exploitation strategy and
selecting delivery partners, innovation is a process and can therefore be managed.
Capacity
building
Experts who have been involved in capacity building in different areas would agree that
the exercise of capacity building is never monolithic in nature but a multidimensional
and complex activity. No exercise at a national level can succeed if all or most players
are not engaged in the activity. Intellectual Property Rights are often considered

4D INTERNATIONAL JOURNAL OF MANAGEMENT AND SCIENCE ISSN 2250-0669
JANUARY-JUNE 2012 http://www.4dinternationaljournal.com VOL 2 / ISSUE 1
Pag
e89
synonym of patents or at best patents, trademark and copyrights. This type of
understanding or misunderstanding may be present elsewhere in the world. Sometimes
people even use the word ‗patent‘ as a substitute for ‗protect‘. Let‘s not forget that India
is a big country and the task of spreading literacy is gigantic Dissemination of new
knowledge is difficult and it cannot be disseminated in a day or two; hence one should
be prepared to work with low success rates. At the same time the need to make efforts
for spreading correct literacy in a short period of time cannot be overlooked. Awareness
still remains an unfulfilled goal in spite of efforts made by so many agencies. There is a
need to adopt different means such as contact programmes, print media, bulletins,
internet, videos etc. Awareness by itself is of little use if the State does not create and
provide suitable systems to enable scientists, technologists, industries and even the State
to protect their rights. These means would be in terms of technical guidance, financial
support, legal help and other facilitation steps. If you teach scientists that novelty is one
of the key factors for getting a patent and do not supply them with adequate tools to
determine if their inventions are novel or not, the awareness will have be of little value.
Universities in India are very poor and their management systems are very old.
Therefore, they need technical, financial and legal help to move ahead; someone has to
hold their hands.
Capacity building has to be multifaceted at the national level in order to move and
remain ahead in the knowledge race. Academic institutions, R&D institutions, industries
(goods and services), government departments and ministries (law making, regulating,
providing funds and incentives for research etc) and other agencies, attorney firms,
courts and NGOs need to be enabled and empowered for playing a constructive role in
the process of capacity building. Policy frameworks are essential in the national context
to give the right impetus to the activities
already started and also provide a broad platform for taking up future activities. Many
of these issues have been addressed and addressed quite successfully in the last ten
years by different agencies of the government. While departments like Atomic
Energy, Space and DRDO and agencies like CSIR have their in house system for
looking after their needs of IPR, There was no agency in the country in 1995, which

4D INTERNATIONAL JOURNAL OF MANAGEMENT AND SCIENCE ISSN 2250-0669
JANUARY-JUNE 2012 http://www.4dinternationaljournal.com VOL 2 / ISSUE 1
Pag
e90
could cut across departments and agencies and become a national nodal point for
information and advice on IPR.
Patent Facilitating Centre (PFC)
The Department of Science and Technology set up the Patent Facilitating Centre at the
Technology Information Forecasting and Assessment Council (TIFAC) in 1995 as a
small initiative to address the need of awareness creation among scientists, helping
them to protect their inventive and original work through IP laws and also act as a
watch dog. The PFC came to be known for its capability to raise issues and bringing
new information and knowledge about IPR in public domain. Starting with the
revelation of the turmeric patent to the whole country, it brought to notice many other
patents using some of our well known plants and traditional knowledge and, at times,
claiming what is already known in India. The days of Dunkel Draft on WTO became a
history with PFC putting IPR matters in public domain freely through its monthly
IPR Bulletin since November 1995. The readership of these bulletins is over 18000.
These bulletins cover technical analysis of granted patents, case laws, current global
issues, IPR laws of India and other countries, international treaties, analysis of patents
tends, domestic and international news and many other items of interest to a wide variety
of readers.
The PFC has organized 448 IPR awareness workshops all over the country
independently and also in association with Ministry of Small Scale Industries,
Department of Atomic Energy, Department of Space and ICMR. In the process almost
35000 scientists, technologists and policy makers have been sensitized from about 500
universities, colleges and R&D institutions and 800 industries. The PFC has been
organizing advanced level of training programmes with CII and attorney firms and also
workshops cum retreat on topics such as public private partnership in IPR management. It
would be pertinent to mention at this point that the Ministry of Human Resource
Development (MHRD) has also been supporting workshops on IPR. Further, the MHRD
has created 11 IPR chairs in various IITS and universities. The Ministry of Commerce
and Industry has also been conducting many seminars and workshops on this topic for
the last decade or so.

4D INTERNATIONAL JOURNAL OF MANAGEMENT AND SCIENCE ISSN 2250-0669
JANUARY-JUNE 2012 http://www.4dinternationaljournal.com VOL 2 / ISSUE 1
Pag
e91
Twenty Patent Information Centers (PIC) have been set up by the PFC in 20 States
namely; Assam, Andhra Pradesh, Chhattisgarh, Goa, Gujarat, Haryana, Himachal
Pradesh, Jammu and Kashmir, Karnataka, Kerala, Madhya Pradesh, Manipur, Punjab,
Rajasthan, Sikkim, Tamil Nadu, Tripura, Uttar Pradesh, Uttaranchal and West Bengal.
These PICs are helping scientists, technologists and policy makers in their respective
States by creating awareness and extending help for protecting their inventions. Some
States as a result of continuous discussions have filed applications for registration of
some products as geographical indications; some are also in the pipeline. Two PICs,
namely, Punjab and West Bengal, have also succeeded in introducing IPR courses in
technical institutions; other PICs are working hard towards this goal.
The PFC is the only window available in the country, which provides full technical, legal
and financial support for inventions emanating from educational institutions, including
schools and colleges, and government departments.
Other centers / cells
Many government departments, educational institutions and PSU have started their IPR
cells. Prominent among the government departments/agencies are Department of
Biotechnology, Ministry of Telecommunications and Information Technology, Indian
Council of Medical Research, Indian Council of Agricultural Research, ISRO,
Department of Atomic Energy, Defence Research and Development Organization
and Indian Council of Forest Research. IITs at Delhi, Mumbai, Kharagpur and
Roorkee have also set up their cells and evolved their IPR policies. Among the
PSUs, Indian Oil Corporation and Bharat Heavy Electricals Ltd. are worth
mentioning. Among private industries, there are many industries, which have started
their own IPR cells and it may not be possible to list all of them here. There is no doubt
that private industries have responded very well to the new IPR regime in terms of
filing patent applications.
Innovations related incentives
An innovative industry in India can gain competitive advantage in the market if
it develops the necessary expertise and skills in developing and manufacturing new
4D INTERNATIONAL JOURNAL OF MANAGEMENT AND SCIENCE ISSN 2250-0669
JANUARY-JUNE 2012 http://www.4dinternationaljournal.com VOL 2 / ISSUE 1
Pag
e92
products, which are patented. For example, the advantage of a three year excise
duty exemption or exemption from Drugs Price Control Order may translate into
reserves / income which may offset the cost towards R&D. In order to promote R&D
and innovation in Indian industries, Government of India provides a number of fiscal
incentives and support measures to industries. With increasing public private partnership
in technology development through schemes of Technology Development Board, Drug
and Pharmaceutical Board and NMILTI, the following incentives would be extremely
useful in promoting the culture of innovation and intellectual property protection in
industries and academic and R&D institutions.
1. Excise duty waiver on patented products
All goods falling under the Schedule to the Central Excise Tariff 1985 are exempt
from the excise duty for a period of 3 years from the date of commencement of
commercial production provided such goods are manufactured by a wholly owned
Indian company and such goods are designed and developed by such Indian company
and the goods so designed are patented in any two countries outside India namely,
USA, Japan and any country of the European Union. The manufacturer, before
commencing commercial production must obtain a certificate from the Department of
Scientific and Industrial Research for claiming the benefit.
2. Exemption from Drug Price Control Order
Bulk drugs produced based on indigenous R&D are exempt from drug price control for
a period of 5 years from the date of commencement of commercial production provided
that they are produced from the basic stage by a process of manufacture developed by
the unit through its own R&D efforts. In case of a drug, which has not been produced
elsewhere, if developed and produced indigenously, it would be placed outside the price
control order for a period of 10 years from the date of commencement of commercial
production. In order to establish that a process or a product has been developed
through indigenous R&D, novelty of the process or product would have to be ensured.
In other words a patent would have to be necessarily obtained for claiming the benefit.

4D INTERNATIONAL JOURNAL OF MANAGEMENT AND SCIENCE ISSN 2250-0669
JANUARY-JUNE 2012 http://www.4dinternationaljournal.com VOL 2 / ISSUE 1
Pag
e93
3. Weighted tax deduction on R&D expenditure
Weighted tax deduction @ 150% on R&D expenditure is available to companies
engaged in the business of biotechnology, or the business of manufacture or production
of drugs, pharmaceuticals, electronic equipment, computers, telecommunication
equipment, chemicals and manufacture of aircraft and helicopters. The expenditure
on scientific research in relation to drugs and pharmaceuticals, shall include
expenditure incurred on clinical trials of drugs, obtaining approval from the
regulatory authority under any Central, State or provincial Act and the filing of a patent
application in India.
4. Accelerated depreciation allowance
Depreciation allowance at a higher rate is available in respect of plant and machinery
installed for manufacturing goods based on indigenous technology developed in
recognized in- house R&D units, Government R&D institutions, national
laboratories and Scientific and Industrial Organizations (SIRO). The present rate of
depreciation for plant and machinery is 40% as against 25% for other plants and
machinery.
5. Tax holiday to R&D companies
Tax holiday is available to approved companies engaged in scientific and industrial
R&D activities on commercial lines for ten consecutive assessment years. This
incentive is applicable to any commercial company that has its main objective and
activities in the area of scientific and industrial R&D. This would be applicable to
companies approved after March 31, 2000 but before April 1, 2003.
6. Income tax relief on R&D expenditure
Under Section 35(1)(i) of the Income Tax Act 1961, the revenue expenditure on
scientific research, by recognized R&D units, on activities related to the business
of the company is allowed full deduction. Under Section 35(1)(iv) expenses of a
capital nature could be deducted totally from the income of the year in which the
expenses have been incurred.

4D INTERNATIONAL JOURNAL OF MANAGEMENT AND SCIENCE ISSN 2250-0669
JANUARY-JUNE 2012 http://www.4dinternationaljournal.com VOL 2 / ISSUE 1
Pag
e94
7. Tax deduction for sponsoring research
Section 35(2AA) of the IT Act 1961 provides for a weighted tax deduction of 125% for
expenses on sponsoring research programmes at National laboratories functioning under
ICAR, CSIR, ICMR, DRDO, Department of Biotechnology, Department of Atomic
Energy, Department of Electronics; IIT and universities.
Conclusion:
This paper develops a pool of well informed and trained human resource, deploy
sufficient facilities (hardware and software) and, create and promote an enabling
environment for generating, protecting and managing intellectual property for progress of
science, technology and arts leading to growth of trade and industry and well being of the
society. Any physical process, including development, has to absorb some finite time
before taking a shape. We have made a good start by rising to the occasion and putting in
place some very useful systems and policies. In addition to the legislative changes, the
Government of India has taken several measures to streamline and strengthen the
intellectual property administration system in the country. Projects relating to the
modernization of patent information services and trademarks registry have been
implemented with help from WIPO/UNDP. The Government of India is implementing a
project for modernization of patent offices at a cost of Rs.756 million incorporating
several components such as human resource development, recruiting additional
examiners, infrastructure support and strengthening by way of computerization and re-
engineering work practices, and elimination of backlog of patent applications.
References
1. Rawls John, A Theory of Justice 1 edn. (Universal Law Publishing Company Pvt
Ltd, New Delhi),2000 p. 3
2. Aoki, R. and Spiegel, Y. 1999. Public Disclosure of Patent Applications, R&D,
and Welfare. Working Paper No. 30-99.
3. Yusuf, A.A. 1998. ―TRIPs: Background, Principles and General Provisions,‖
in Correa, C.M. and Yusuf, A.A., Intellectual Property and International Trade:
The TRIPs Agreement. Kluwer Law International, London.
4. Gupta, A. 1999. Framing ―Biosafety‖ in an International Context.

4D INTERNATIONAL JOURNAL OF MANAGEMENT AND SCIENCE ISSN 2250-0669
JANUARY-JUNE 2012 http://www.4dinternationaljournal.com VOL 2 / ISSUE 1
Pag
e95
Discussion Paper, Belfer Center for Science and International Affairs,
Kennedy School of Government, Harvard University, Cambridge, USA.
5. Youssef, H. 1999. Special and Differentiated Treatment for Developing
Countries in the WTO. The South Centre, Geneva.
6. The Patents Act, 1970 as amended by Patents (Amendment) Act 2005,
Commercial Law Publisher (India) Private Ltd., 2005.
7. The Protection of Plant Varieties and Farmers‘ Rights Act, 2001 along with
Protection of Plant Varieties and Farmers‘ Rights Rules 2003; Akalank
Publications, New Delhi; 2003
8. The Copyright Act 1957 as amended up to 1999 along with Copyright Rules
1958 and International Copyright Order 1999; 2005
9. The Design Act 2000 along with Design Rules 2001; Universal Law Publishing
Co. Ltd., New Delhi; 2004
10. The Trademarks Act 1999 along with trade Marks Rules 2002; Commercial Law
Publisher (India) Private Ltd., 2004
11. The Geographical Indications of Goods (Registration and Protection) Act,
1999 along with Geographical Indications of Goods (Registration and
Protection) Rules 2002; Universal Law Publishing Co. Ltd., New Delhi;
2004
12. The Semiconductor Integrated Circuits Layout Design Act 2000 along with
Semiconductor Integrated Circuits Layout Design Rules 2001; Universal Law
Publishing Co. Ltd., New Delhi; 2005.
13. R&D Statistics Department of Science and Technology, Government of India,
May, 2002
14. Instructions for Technology Transfer and Intellectual Property Rights,
Department of Science and Technology, March 2000
15. Research and Development in Industry: An Overview; Department of
Scientific and Industrial Research, Government of India, 2010.
16. IPR Bulletin, Vol.5, No 8, August 1999; Technology Information,
Forecasting and Assessment Council
17. IPR Bulletin, Vol. 9, No. 10, October 2007; Technology Information,
Forecasting and Assessment Council

4D INTERNATIONAL JOURNAL OF MANAGEMENT AND SCIENCE ISSN 2250-0669
JANUARY-JUNE 2012 http://www.4dinternationaljournal.com VOL 2 / ISSUE 1
Pag
e96
COMMODITY MARKET AS AN INVESTMENT OPTION
Dr.Nisha Singh
South Carolina,USA
Abstract
There are three reasons for investing in commodities diversification, protect against a
spike in inflation, and guard against the possible financial system fall. The gold price has
tripled since the year 2000 and it has the fundamental potential to continue its long-term
bull market due to the current economic cycle. The current price reflects only a fraction
of the inflation that has been factored into the global monetary system. Inflation will be
playing a larger part in all our lives over the coming years, as governments around the
world are aiming at reducing the effects of the current economic crisis via monetary
policy. Silver reserves are being sold-off and as a result the inventories have been
steadily shrinking on a worldwide basis.
Objectives
To suggest an alternative investment option for investors based on analysis of market
To suggest benefits of investment in commodity (gold) for portfolio management.
To identify factors affecting commodities (gold) prices.
METHODOLOGY
METHOD OF DATA COLLECTION
Secondary data collected from web sides of NSC India, MCX India and NCDEX etc.
Statistical tools: Hypothesis test, ANOVA test and Regression analysis.
DATA ANALYSIS & INTERPRETATION
Factors affecting price of gold
1. US Dollar-There is a +ve relationship between gold prices and US Dollar.
Before 1950 US $ was also considered as the inflation hedge. But this is not true
now. So in the past we can observe the positive correlation between gold prices
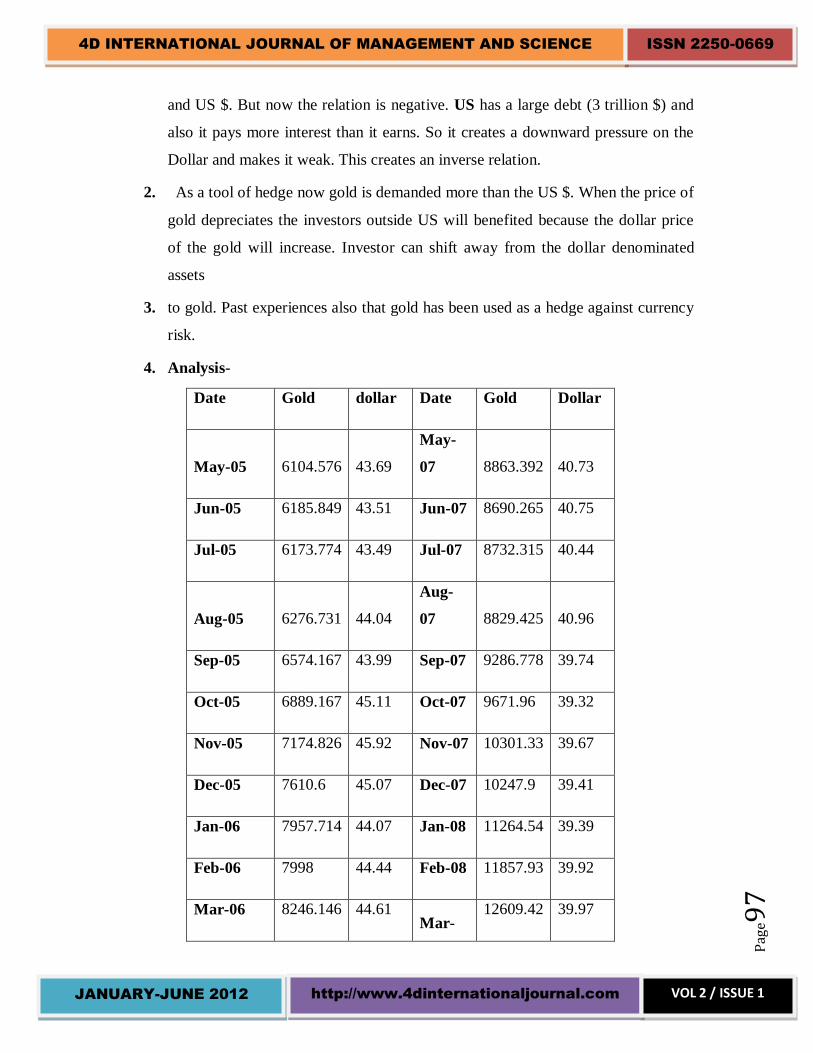
4D INTERNATIONAL JOURNAL OF MANAGEMENT AND SCIENCE ISSN 2250-0669
JANUARY-JUNE 2012 http://www.4dinternationaljournal.com VOL 2 / ISSUE 1
Pag
e97
and US $. But now the relation is negative. US has a large debt (3 trillion $) and
also it pays more interest than it earns. So it creates a downward pressure on the
Dollar and makes it weak. This creates an inverse relation.
2. As a tool of hedge now gold is demanded more than the US $. When the price of
gold depreciates the investors outside US will benefited because the dollar price
of the gold will increase. Investor can shift away from the dollar denominated
assets
3. to gold. Past experiences also that gold has been used as a hedge against currency
risk.
4. Analysis-
Date Gold dollar Date Gold Dollar
May-05 6104.576 43.69
May-
07 8863.392 40.73
Jun-05 6185.849 43.51 Jun-07 8690.265 40.75
Jul-05 6173.774 43.49 Jul-07 8732.315 40.44
Aug-05 6276.731 44.04
Aug-
07 8829.425 40.96
Sep-05 6574.167 43.99 Sep-07 9286.778 39.74
Oct-05 6889.167 45.11 Oct-07 9671.96 39.32
Nov-05 7174.826 45.92 Nov-07 10301.33 39.67
Dec-05 7610.6 45.07 Dec-07 10247.9 39.41
Jan-06 7957.714 44.07 Jan-08 11264.54 39.39
Feb-06 7998 44.44 Feb-08 11857.93 39.92
Mar-06 8246.146 44.61 Mar-
12609.42 39.97

4D INTERNATIONAL JOURNAL OF MANAGEMENT AND SCIENCE ISSN 2250-0669
JANUARY-JUNE 2012 http://www.4dinternationaljournal.com VOL 2 / ISSUE 1
Pag
e98
08
Apr-06 8958.106 44.97 Apr-08 11792.93 40.46
May-06 9988.8 46.43
May-
08 12142.66 42.59
Jun-06 8896.447 46.08 Jun-08 12327.35 42.95
Jul-06 9513.714 46.51 Jul-08 13005.86 42.49
Aug-06 9572.941 46.55
Aug-
08 11791 43.79
Sep-06 9029.255 45.96 Sep-08 12194.02 46.94
Oct-06 8703.302 45.02 Oct-08 12715 49.25
Nov-06 9167.857 44.76 Nov-08 12108.59 49.84
Dec-06 9152.87 44.23 Dec-08 12865.25 48.45
Jan-07 9072.782 44.17 Jan-09 13475.67 49.02
Feb-07 9494.511 44.31 Feb-09 14791.53 50.73
Mar-07 9345.75 43.59
Mar-
09 15254.53 50.95
Apr-07 9311.894 41.29 Apr-09 14491.34 50.22
May-
09 14559.66 47.29
Hypothesis Assumed (H0): Gold Prices do not depend upon Dollar exchange rate.
Alternative Hypothesis (H1): Gold prices depend upon Dollar exchange rate.

4D INTERNATIONAL JOURNAL OF MANAGEMENT AND SCIENCE ISSN 2250-0669
JANUARY-JUNE 2012 http://www.4dinternationaljournal.com VOL 2 / ISSUE 1
Pag
e99
Regression
Statistics
Multiple R 0.360509804
R Square 0.129967319
Adjusted R Square 0.111455985
Standard Error 2300.338479
Observations 49
Df SS MS F Significance F
Regression 1 37151806.78 37151806.78 7.020959231 0.010939488
Residual 47 248703184.5 5291557.116
Total 48 285854991.2
Coefficients Standard
Error
T stat p-value Lower
99%
Upper
99%
Intercept -2085.412012
4582.61595
9
-0.455070211
0.65115394
4
-14387.69939
10216.8753
7
X
variable1
273.8503496
103.351093
2.649709273
0.65115394
4
-3.601406983
551.302106
1
Tabulated value of z- 2.56
Analytical Overview:
Significant correlation with r -0.36051

4D INTERNATIONAL JOURNAL OF MANAGEMENT AND SCIENCE ISSN 2250-0669
JANUARY-JUNE 2012 http://www.4dinternationaljournal.com VOL 2 / ISSUE 1
Pag
e10
0
Change in US $ exchange rate accounts only 13% for the change in gold prices.
Significant linear regression with p value- 0.6512
Regression Equation- Y=273.85 X-2085.412
Interpretation: Here the value of multiple R value which is 0.36, shows that the
correlation between the US $ and Gold prices is insignificant. This shows that in the
current scenario the US $ exchange rate doesn‘t affect the gold prices significantly. This
is because R value is less than 0.5 and more closer to 0. Also the value of R square is
0.13 which shows the extent at which Fluctuation in US $ affects Gold prices.
But from t value which is more than the tabulated value (hypothesis is accepted) we can
predict that there is a relation between US $ and gold prices. The –ve intercept of t value
as well as –ve intercept of regression equation shows the inverse relation between the
US$ and gold prices.
Also for time period May 05 to Oct 06 there is high correlation (0.82) & t value is 5.8
which makes the hypothesis to be accepted. This tells that due to the change in the global
economic scenario the effect of US $ on gold prices is decreasing.
Now by doing the regression analysis for year 08 to 09 (value of multiple R=.71 , t
value=3.98) we can also predict that the there is improvement in the scenario and again
the correlation is being establishing. So there is great impact of the current economic
scenario.
2. REPO RATE:
Repo Rate is that rate at which the commercial banks borrow money from the RBI. It is
a good measure to control inflation. When the repo rate will be high, the borrowing from
the banks will be low which will actually reduce the purchasing power of the public. This
will reduce the investment in gold and it will ultimately reduce the price the gold.
Analysis:
Date Gold
Repo
rate Date Gold
Repo
rate
May-05 6104.576 6 Jun-07 8690.265 7.75

4D INTERNATIONAL JOURNAL OF MANAGEMENT AND SCIENCE ISSN 2250-0669
JANUARY-JUNE 2012 http://www.4dinternationaljournal.com VOL 2 / ISSUE 1
Pag
e10
1
Jun-05 6185.849 6 Jul-07 8732.315 7.75
Jul-05 6173.774 6
Aug-
07 8829.425 7.75
Aug-05 6276.731 6 Sep-07 9286.778 7.75
Sep-05 6574.167 6 Oct-07 9671.96 7.75
Oct-05 6889.167 6.25 Nov-07 10301.33 7.75
Nov-05 7174.826 6.25 Dec-07 10247.9 7.75
Dec-05 7610.6 6.25 Jan-08 11264.54 7.75
Jan-06 7957.714 6.5 Feb-08 11857.93 7.75
Feb-06 7998 6.5
Mar-
08 12609.42 7.75
Mar-06 8246.146 6.5 Apr-08 11792.93 7.75
Apr-06 8958.106 6.5
May-
08 12142.66 7.75
May-06 9988.8 6.5 Jun-08 12327.35 8.5
Jun-06 8896.447 6.75 Jul-08 13005.86 9
Jul-06 9513.714 7
Aug-
08 11791 9
Aug-06 9572.941 7 Sep-08 12194.02 9
Sep-06 9029.255 7 Oct-08 12715 6.5
Oct-06 8703.302 7 Nov-08 12108.59 6.5
Nov-06 9167.857 7.25 Dec-08 12865.25 6.5

4D INTERNATIONAL JOURNAL OF MANAGEMENT AND SCIENCE ISSN 2250-0669
JANUARY-JUNE 2012 http://www.4dinternationaljournal.com VOL 2 / ISSUE 1
Pag
e10
2
Dec-06 9152.87 7.25 Jan-09 13475.67 6.5
Jan-07 9072.782 7.25 Feb-09 14791.53 5.75
Feb-07 9494.511 7.5
Mar-
09 15254.53 5
Mar-07 9345.75 7.5 Apr-09 14491.34 4.75
Apr-07 9311.894 7.75
May-
09 14559.66 4.75
May-07 8863.392 7.75
Gold prices VS Repo rate
0
2000
4000
6000
8000
10000
12000
14000
16000
18000
May-0
5Jun-0
5Jul-05
Aug-0
5S
ep-0
5O
ct-
05
No
v-0
5D
ec-0
5Jan-0
6F
eb-0
6M
ar-
06
Apr-
06
May-0
6Jun-0
6Jul-06
Aug-0
6S
ep-0
6O
ct-
06
No
v-0
6D
ec-0
6Jan-0
7F
eb-0
7M
ar-
07
Apr-
07
May-0
7Jun-0
7Jul-07
Aug-0
7S
ep-0
7O
ct-
07
No
v-0
7D
ec-0
7Jan-0
8F
eb-0
8M
ar-
08
Apr-
08
May-0
8Jun-0
8Jul-08
Aug-0
8S
ep-0
8O
ct-
08
No
v-0
8D
ec-0
8Jan-0
9F
eb-0
9M
ar-
09
Apr-
09
May-0
9
month
Pri
ces
0
1
2
3
4
5
6
7
8
9
10month
rep
o r
ate
valu
e
Gold
Repo rate
Hypothesis Assumed :(H0)- The Repo rate doesn’t affect the gold prices.
Alternate Hypothesis (H1)- The Repo rate affect the gold prices.
*NOTE- By analyzing the graph and table we can observe that there are three time
periods.

4D INTERNATIONAL JOURNAL OF MANAGEMENT AND SCIENCE ISSN 2250-0669
JANUARY-JUNE 2012 http://www.4dinternationaljournal.com VOL 2 / ISSUE 1
Pag
e10
3
One that is there is continuous increase in the gold prices with the increase in time
period
2nd
is that period in which there is increase in gold prices but there is no change in
repo rate.
Last is that period in which there is decrease in repo rate but increase in gold
prices.
So it will be better that we will show the regression analysis separately in three
different parts.
Regression Analysis for the whole period:
Multiple R 0.044010528
R Square 0.001936927
Adjusted R
Square -0.019298458
Standard Error 2463.785839
Observations 49
ANOVA
Df SS MS F Significance F
Regression 1 553680.1381 553680.138 0.091212222 0.763974109
Residual 47 285301311.1 6070240.66
Total 48 285854991.2

4D INTERNATIONAL JOURNAL OF MANAGEMENT AND SCIENCE ISSN 2250-0669
JANUARY-JUNE 2012 http://www.4dinternationaljournal.com VOL 2 / ISSUE 1
Pag
e10
4
Coefficients
Standard
Error T Stat P-value
Lower
99.0%
Upper
99.0%
Intercept 9270.172641 2527.017003 3.668425115 0.000621127 2486.254969 16054.09031
X
Variable
1 107.96492 357.4836224 0.302013612 0.763974109
-
851.7197437 1067.649584
Regression Analysis for the period of May 05 to Sep 09:
Multiple R 0.85704807
R Square 0.734531395
Adjusted R
Square 0.727724508
Standard Error 982.2792188
Observations 41
ANOVA
df SS MS F Significance F
Regression 1 104119413.9 104119413.9 107.9100273 8.6124E-13
Residual 39 37630026.09 964872.4638
Total 40 141749440

4D INTERNATIONAL JOURNAL OF MANAGEMENT AND SCIENCE ISSN 2250-0669
JANUARY-JUNE 2012 http://www.4dinternationaljournal.com VOL 2 / ISSUE 1
Pag
e10
5
Coefficients
Standard
Error t Stat P-value
Lower
99.0%
Upper
99.0%
Intercept
-
4542.661702 1340.687899
-
3.388306633 0.001619293
-
8173.128133 -912.195
X Variable 1 1911.568612 184.0174421 10.38797513 8.6124E-13 1413.265356 2409.872
Regression Analysis for the period of Oct 08 to may 09 :
Multiple R 0.838340857
R Square 0.702815392
Adjusted R
Square 0.653284624
Standard
Error 673.8858348
Observations 8
ANOVA
Df SS MS F
Significance
F
Regression 1 6443752.59 6443752.587 14.18947091 0.009322706
Residual 6 2724732.71 454122.1183
Total 7 9168485.3

4D INTERNATIONAL JOURNAL OF MANAGEMENT AND SCIENCE ISSN 2250-0669
JANUARY-JUNE 2012 http://www.4dinternationaljournal.com VOL 2 / ISSUE 1
Pag
e10
6
Coefficients
Standard
Error t Stat P-value Lower 99.0%
Upper
99.0%
Intercept 20477.82008 1793.258299 11.41933658 2.70487E-05 13829.44402 27126.19615
X Variable 1
-
1158.075451 307.4353158
-
3.766891412 0.009322706 -2297.869755 -18.2811466
Interpretation:
Now here we have divided the regression analysis in three parts. The overview of the 1st
part, 2nd
part and the 3rd
part are as below:
1. Significant correlation with r -0.044010528
Change in repo rate accounts 2 % for the change in gold prices.
Significant linear regression with p value- 0.763974109
Regression Equation- Y= 107.96492X+9270.172641
2. Significant correlation with r –0.85704807
Change in Repo rate accounts for the change73% in gold prices.
Significant linear regression with p value- (Approx) 0.00
Regression Equation- Y= 1911.568612X-4542.661702
3. Significant correlation with r -0.838340857
Change in repo rate accounts 70 % for the change in gold prices.
Significant linear regression with p value- 0.009322706
Regression Equation- Y= -1158.075451X+20477.82008
Now the three cases are contradicting to each other. Case 1 shows the poor correlation
whereas case 2 & 3 shows the stronger correlation. Also the t-value and p-value shows
that the hypothesis should be accepted (case 2 & 3) but according to case 1 the hypothesis
should be rejected.

4D INTERNATIONAL JOURNAL OF MANAGEMENT AND SCIENCE ISSN 2250-0669
JANUARY-JUNE 2012 http://www.4dinternationaljournal.com VOL 2 / ISSUE 1
Pag
e10
7
Therefore, the question is why here such contradiction arises. The answer could be found
by observing the graphs of this section. We can easily observe that in the period (which
relates to the 2nd
case-sep-08 to oct-08) there is a sharp downfall in the repo rate which is
affect of crisis in the economy and inflation rate downfall in this period. So we can say
that there is a high correlation between repo rate and gold prices, being other economic
factors constant. By generalizing the case 2 and 3 where multiple R values are .86 and .84
we can say that the there is significant correlation between gold prices and repo rate. Also
the t-values are 10.38 and -3.76 which shows the acceptance of hypothesis. –ve sign only
shows the inverse correlation within that period.
3. Inflation Rate-
Gold has always been considered a good hedge against inflation. Rising inflation rates
typically appreciates gold prices. Traditional theory implies that the relative price of
consumer goods and of such real assets as land and gold should not be permanently
affected by the rate of inflation. A change in the general rate of inflation should, in
equilibrium, cause an equal change in the rate of inflation for each asset price The
experience of the past decade has been very different from the predictions of this theory:
the prices of land, gold, and other such stores of value have increased by substantially
more than the general price level. The present paper presents a simple theoretical model
that explains the positive relation between the rate of inflation and the relative price of
such real assets. More specifically, in an economy with an income tax, an increase in the
expected rate of inflation causes an immediate increase in the relative price of such 'store
of value' real assets. The behavior of real asset prices discussed in this paper is thus a
further example of the non-neutral response of capital markets to inflation in an economy
with income taxes.
Analysis:
Date Gold
inflation
rate Date Gold
Inflation
rate
May-05 6104.576 5.2 May-07 8863.392 5.27
Jun-05 6185.849 4.14 Jun-07 8690.265 4.03

4D INTERNATIONAL JOURNAL OF MANAGEMENT AND SCIENCE ISSN 2250-0669
JANUARY-JUNE 2012 http://www.4dinternationaljournal.com VOL 2 / ISSUE 1
Pag
e10
8
Jul-05 6173.774 3.84 Jul-07 8732.315 4.41
Aug-05 6276.731 3.01 Aug-07 8829.425 3.94
Sep-05 6574.167 3.75 Sep-07 9286.778 3.23
Oct-05 6889.167 4.75 Oct-07 9671.96 3.07
Nov-05 7174.826 4.54 Nov-07 10301.33 3.21
Dec-05 7610.6 4.4 Dec-07 10247.9 3.45
Jan-06 7957.714 4.3 Jan-08 11264.54 4.11
Feb-06 7998 4.34 Feb-08 11857.93 5.02
Mar-06 8246.146 3.96 Mar-08 12609.42 7.41
Apr-06 8958.106 3.59 Apr-08 11792.93 7.61
May-06 9988.8 4.68 May-08 12142.66 8.75
Jun-06 8896.447 4.84 Jun-08 12327.35 11.89
Jul-06 9513.714 4.67 Jul-08 13005.86 12.01
Aug-06 9572.941 5.01 Aug-08 11791 12.1
Sep-06 9029.255 5.16 Sep-08 12194.02 11.8
Oct-06 8703.302 5.09 Oct-08 12715 10.72
Nov-06 9167.857 5.3 Nov-08 12108.59 8
Dec-06 9152.87 5.58 Dec-08 12865.25 5.91
Jan-07 9072.782 6.58 Jan-09 13475.67 4.39
Feb-07 9494.511 6.1 Feb-09 14791.53 2.43
Mar-07 9345.75 5.74 Mar-09 15254.53 0.26

4D INTERNATIONAL JOURNAL OF MANAGEMENT AND SCIENCE ISSN 2250-0669
JANUARY-JUNE 2012 http://www.4dinternationaljournal.com VOL 2 / ISSUE 1
Pag
e10
9
Apr-07 9311.894 5.66 Apr-09 14491.34 0.7
May-09 14559.66 0.13
Hypothesis Assumed :(H0)- The Repo rate doesn’t affect the gold prices.
Alternate Hypothesis (H1)- The Repo rate affect the gold prices.
Regression Analysis:
Regression Statistics
Multiple R 0.893479
R Square 0.798305
Adjusted R Square 0.779969
Standard Error 554.9848
Observations 49
ANOVA
Df SS MS F
Significance
F
Regression 1 7168366.408 7168366.408 1.20893215 0.277143878
Residual 48 278686624.8 5929502.656
Total 49 285854991.2
Coefficients
Standard
Error t Stat P-value
Lower
99.0%
Upper
99.0%
Intercept 9286.054853 757.5061594 12.25871861 0.00 7252.487444 11319.6223
X Variable
1 139.9434076 127.2774544 1.099514508 0.277143878
-
201.7399966 481.626812
4D INTERNATIONAL JOURNAL OF MANAGEMENT AND SCIENCE ISSN 2250-0669
JANUARY-JUNE 2012 http://www.4dinternationaljournal.com VOL 2 / ISSUE 1
Pag
e11
0
Analytical Overview:
Significant correlation with r -0.893479
Change in INFLATION Rate accounts only 80% for the change in gold prices.
Significant linear regression with p value- 0.277143878
Regression Equation- Y=139.943 X+9286.05
Interpretation:
The value of multiple R shows that (0.89) shows that there is significant relation between
gold prices and inflation rate. It verifies whatever our studies are until now that is the
gold is an inflation hedge. This analysis also shows that change in inflation rate accounts
80% for the variation in gold prices but this movement is in reverse direction. In addition,
it should be noted that increase in inflation rate accounts for increase in investment in
gold, as it is an inflation hedge.
Also from the t-value we can see that the hypothesis can be rejected. This means that our
assumption was wrong. (T-value is 1.099 which is less than tabulated value 2.56). Also
from the graph we can observe that in the initial period the variation from the trend line is
less in later period (from May 08 to May 09).Also in the later period the gap between
gold prices and inflation rate becomes larger which shows the inverse movement between
them.
Now actually what happens is, when there is increase in inflation rate, generally the RBI
increases the CRR and Repo rate and the securities are demanded more. Gold is one of
them universally accepted within the accepted within the banking industry. Therefore the
demand increases as well as prices also.
4. Stock market-
The performance of gold bullion is often compared to stocks. They are fundamentally
different asset classes. Gold is regarded by some as a store of value (without growth)
whereas stocks are regarded as a return on value (i.e. growth due to anticipated real price
increase plus dividends). Stocks and bonds perform best in a stable political climate with
strong property rights and little turmoil.

4D INTERNATIONAL JOURNAL OF MANAGEMENT AND SCIENCE ISSN 2250-0669
JANUARY-JUNE 2012 http://www.4dinternationaljournal.com VOL 2 / ISSUE 1
Pag
e11
1
As the crude oil becomes cheap, the inflation rate goes down. (As on 6th June 2009). We
have discussed earlier that how inflation rate is on the base of the gold prices. Similarly
the lower inflation rate or the situation of deflation makes the stock market down. It tends
to lower return from the stock market. At this time investment pattern moves towards the
gold market. Now the return from both these sources is of long terms. Investment
decision partly on, or solely on, technically analysis.
Analysis:
Date Gold Sensex Date Gold Sensex
May-05 6104.576 6,715.11 Jun-07 8690.265 14650.51
Jun-05 6185.849 7193.85 Jul-07 8732.315 15550.99
Jul-05 6173.774 7635.42 Aug-07 8829.425 15318.6
Aug-05 6276.731 7805.43 Sep-07 9286.778 17291.1
Sep-05 6574.167 8634.48 Oct-07 9671.96 19837.99
Oct-05 6889.167 7892.32 Nov-07 10301.33 19363.19
Nov-05 7174.826 8788.81 Dec-07 10247.9 20286.99
Dec-05 7610.6 9397.93 Jan-08 11264.54 17648.71
Jan-06 7957.714 9919.89 Feb-08 11857.93 17578.72
Feb-06 7998 10370.24 Mar-08 12609.42 15644.44
Mar-06 8246.146 11279.96 Apr-08 11792.93 17287.31
Apr-06 8958.106 12042.56 May-08 12142.66 16415.57
May-06 9988.8 10398.61 Jun-08 12327.35 13461.6
Jun-06 8896.447 10609.25 Jul-08 13005.86 14355.75
Jul-06 9513.714 10743.88 Aug-08 11791 14564.53
Aug-06 9572.941 11699.05 Sep-08 12194.02 12860.43
Sep-06 9029.255 12454.42 Oct-08 12715 9788.06
Oct-06 8703.302 12961.9 Nov-08 12108.59 9092.72
Nov-06 9167.857 13696.31 Dec-08 12865.25 9647.31
Dec-06 9152.87 13786.91 Jan-09 13475.67 9424.24

4D INTERNATIONAL JOURNAL OF MANAGEMENT AND SCIENCE ISSN 2250-0669
JANUARY-JUNE 2012 http://www.4dinternationaljournal.com VOL 2 / ISSUE 1
Pag
e11
2
Jan-07 9072.782 14092.92 Feb-09 14791.53 8891.61
Feb-07 9494.511 12938.09 Mar-09 15254.53 9708.5
Mar-07 9345.75 13072.1 Apr-09 14491.34 11403.25
Apr-07 9311.894 13872.37 May-09 14559.66 14625.25
May-07 8863.392 14544.46
Hypothesis Assumed (H0): Sensex values and Gold prices are not sufficiently co-
related.
Alternative Hypothesis (H1): Sensex value and Gold Prices are sufficiently co-
related.
Regression Analysis:
Regression Statistics
Multiple R 0.671901
R Square 0.451451
Adjusted R
Square 0.396596
Standard
Error 421.0839
Observations 49
ANOVA
Df SS MS F Significance F
Regression 1 1459260.49 1459260.49 8.229918344 0.01670353
Residual 48 1773116.608 177311.6608
Total 49 3232377.099

4D INTERNATIONAL JOURNAL OF MANAGEMENT AND SCIENCE ISSN 2250-0669
JANUARY-JUNE 2012 http://www.4dinternationaljournal.com VOL 2 / ISSUE 1
Pag
e11
3
Coefficients
Standard
Error t Stat P-value
Lower
99.0% Upper 99.0%
Intercept 7127.154538 774.2248155 9.205536163 0.0000 4673.424988 9580.884087
X
Variable
1 0.137944363 0.048084621 2.868783426 0.01670353
-
0.014448911 0.290337637
Analytical Overview:
Significant correlation with r -0.671901
Change in INFLATION Rate accounts 46% for the change in gold prices.
Significant linear regression with p value- 0.0167
Regression Equation- Y=0.1379 X-7127.154538
Interpretation:
The relation between the gold and stock market can be clearly interpretated from the
analytical calculation from the data. The t-value, p-value, multiple R & R square values
clearly shows the picture. Here the t- value is 2.86 which is greater than tabulated value
2.56. This means that our hypothesis is wrong. There is significant correlation between
gold prices and Sensex value. Also the Multiple R is 67% which shows the significance
of relation between the two factors. The p-value is also very less.
B. Impact of commodity investment (gold) in portfolio
PORTFOLIO RISK = SQRT ((XX2*SDX
2) + (XY
2*SDY
2) + (2*XX*XY*
(rXY*SDX2*SDY
2)))]
RETURN = [(XX*RX) + (XY*RY)]
1. Standard Deviation (SD) for gold = 0.01866
2. Standard Deviation (SD) for Sensex = 0.019935
3. Correlation coefficient of x & y = -0.671901

4D INTERNATIONAL JOURNAL OF MANAGEMENT AND SCIENCE ISSN 2250-0669
JANUARY-JUNE 2012 http://www.4dinternationaljournal.com VOL 2 / ISSUE 1
Pag
e11
4
equity
pr.
gold
pr. RETURN Risk
100 0 1.9 190
90 10 1.913 156.396474
80 20 1.926 130.5492871
70 30 1.939 112.4584393
60 40 1.952 102.1239306
50 50 1.965 99.54576108
40 60 1.978 104.7239306
30 70 1.991 117.6584393
20 80 2.004 138.3492871
10 90 2.017 166.796474
0 100 2.03 203
Interpretation: as investment in gold increases return of portfolio also increases and risk
reduces up to 50% investment in gold after that risk also start increasing.
Conclusion
The value of multiple R value which is 0.36, shows that the correlation between the US $
and Gold prices is insignificant. This shows that in the current scenario the US $
exchange rate doesn‘t affect the gold prices significantly.
1. There is a high correlation between repo rate and gold prices, being other
economic factors constant
2. The value of multiple R shows that (0.89) shows that there is significant relation
between gold prices and inflation rate. It verifies what ever our studies are until
now that is the gold is an inflation hedge
3. Gold is a good hedging tool

4D INTERNATIONAL JOURNAL OF MANAGEMENT AND SCIENCE ISSN 2250-0669
JANUARY-JUNE 2012 http://www.4dinternationaljournal.com VOL 2 / ISSUE 1
Pag
e11
5
REFERENCES
Books:-
1. COMMODITY MARKET- AN INTRODUTION (Edited by N Janaradhan Rao)
2. COMMODITY MARKET- RECENT DEVELOPMENT (Edited by Dhanapani
Alagiri)
Websites:
www.nseindia.com
www.mcxindia.com
www.valueresearchonline.com
www.mutualfundsindia.com
www.indiainfoline.com
www.businessstandard.com
www.nseindia.com
www.bseindia.com
www.sebi.gov.in
www.ingvysyamf.com
www.camsonline.com
www.myiris.com
www.sbimutualfund.com

4D INTERNATIONAL JOURNAL OF MANAGEMENT AND SCIENCE ISSN 2250-0669
JANUARY-JUNE 2012 http://www.4dinternationaljournal.com VOL 2 / ISSUE 1
Pag
e11
6
CO2 emission by Power Sector in India: a comparative
Study of Government Sector and Private Sector with
Special Reference to the Climate Change in Global
Perspective
Gyanesh Kumar Sinha
Asst. Professor, Army Institute of Management & Technology,
Greater Noida-201308
Distt.-Gautam Budha Nagar (UP)
Dr. Chandan Bhar
Professor & HOD, Department of Management Studies,
Indian School of Mines, Dhanbad (Jharkhand)
Dr. J K Pattanayak
Professor, Department of Management Studies,
Indian School of Mines, Dhanbad (Jharkhand)
Abstract
Increasing the availability of, and access to, modern energy services, particularly
electricity, is an important element in the effort to increase the standard of living in
India, especially in rural areas. Given the continued pace of high economic growth, the
power sector is expected to grow rapidly in the coming decades, especially since
electricity lies at the heart of most industrial activity. Much of this growth is expected to
be based on coal, at least for the next 30 to 40 years. Use of India’s significant domestic
coal resources for power generation would enhance energy security- which is an
emerging priority in the country. Given that per capita energy consumption is low as

4D INTERNATIONAL JOURNAL OF MANAGEMENT AND SCIENCE ISSN 2250-0669
JANUARY-JUNE 2012 http://www.4dinternationaljournal.com VOL 2 / ISSUE 1
Pag
e11
7
compared to not only the industrial countries but also to many developing country (like
china) and to the global average, but the post Copenhagen summit 2009 necessitates
India to volunteer in reducing the energy and carbon intensity at nation level. Therefore,
this paper focuses on trend in CO2 emission by Indian power sector. A comparative
analysis of Government Sector (Central as well as State) and Private sector is done to
see the contribution of carbon emission in proportion to power generation by these
players. The purpose of this paper is to explore the sector which may need more urgent
attention in terms of reducing GHGs emission. The present study also highlights climate
change in global vis-à-vis Indian perspective, the changing outlook of power sector and
carbon Emission trends.
Keywords : Greenhouse Gas(GHG), Climate Change, Carbon Credit, Kyoto Protocol,
United Nations Framework Convention on Climate Change (UNFCCC), Super Critical,
Sub Critical, Carbon intensity, Power Sector
Introduction: CO2 emission and its impact:
Carbon dioxide, methane, nitrous oxide and other gases- as a group called ―greenhouse‖
gases (GHG)- are environment pollutants, and have the potential to bring severe
ramification to entire globe. Barring a few pollutants they act globally, thus their impact
on the environment is generally similar wherever in the globe they are released. As the
world Bank (2005) puts it : ‗ greenhouse gases mix uniformly in the atmosphere, which
makes it possible to reduce carbon emissions at ant point on Earth and have the same
effect‘. So the location of the originator of the emissions does not really matter from an
environmental standpoint. Carbon is a generic term used for entire GHGs and its

4D INTERNATIONAL JOURNAL OF MANAGEMENT AND SCIENCE ISSN 2250-0669
JANUARY-JUNE 2012 http://www.4dinternationaljournal.com VOL 2 / ISSUE 1
Pag
e11
8
reduction is one of the most important global issues confronting administrators,
environmentalists, and national governments for the last decade.
Recent global temperature measurements indicate that the world‘s average temperature
has increased at many greater than historical rates in recent decades. A warming planet
and changing climate will have significant but varied global impacts. While the
complexity of the global climate system makes it difficult to accurately predict the
impacts of these changes, the evidence from modeling studies, as interpreted by the
world‘s leading scientists assembled by the Intergovernmental Panel on Climate Change
(IPCC), indicates that global mean temperature will increase by 1.4 to 5.8°C with a
doubling of carbon dioxide concentration, relative to pre-industrial levels as per the Third
Assessment Report of IPCC, 2001. There will be a median increase of 3.3°C in annual
mean temperature by the end of the 21st century; the projected minimum and maximum
temperature rise is 2.0°C and 4.7°C, respectively (IPCC, 2007). Predicted climatic
changes with significant implications for India include changes in monsoon precipitation
patterns, as well as a rise in extreme rainfall events, coastal storms, and droughts. Such
changes in the climate could have enormous human, ecological and economic impacts on
the country. The vast number of poor in India, who are particularly vulnerable to these
kinds of climatic impacts, will be exposed to enormous risk (IPCC, 2001).
Looking at above demon impact on all species of the world and the climate, and at the
same time impact on various macro-economic factors, it has now being generally agreed
by most of the developing and developed nations to cut down the carbon emissions
growth. The reduction in carbon emission will not only reduce the business risk in

4D INTERNATIONAL JOURNAL OF MANAGEMENT AND SCIENCE ISSN 2250-0669
JANUARY-JUNE 2012 http://www.4dinternationaljournal.com VOL 2 / ISSUE 1
Pag
e11
9
future(the fear of regulations like carbon tax in future), but also bring the business
opportunities to earn revenue by executing green and eco-friendly projects(discussed
later)
Green House Gas Emission from the Power Sector: A Global Perspective
Climate change is a problem that faces the global community of nations with enormous
variation in the contribution of different countries to the problem in terms of current, per
capita and cumulative GHG emissions. GHGs average emission today is 4.8
tones/capita/year and it may rise to 8.7 tones/capita by 2060/year. Accepted safe level of
CO2 emissions is 14.7 billion tones/per year or 2.3 tones/capita/year.
Globally power generation accounts for more than a quarter of all emissions of CO2, the
main GHG causing climate change, and the proportion is rising quickly. Global emission
of CO2 from power generation have grown more than 34 percent in the past eight years
to 11.4 billion tons/year from 8.5 billion tons in 2000, despite some improvements in
efficiency and slowly growing reliance on renewable energy. Around 65% of the increase
since 2000 is attributable to a surge in emissions from China. The additional 2.9 billion
tons of power-related CO2 emissions per year since 2000 is equivalent to the total annual
carbon emissions of Australia, France, Germany, Italy, and Spain.
The world‘s top-ten power sector emitters in absolute terms are China, the US, India,
Russia, Germany, Japan, the UK, Australia, South Africa and South Korea. The 27
member states of the European Union collectively is the third biggest emitter of CO2,
after China and the US.

4D INTERNATIONAL JOURNAL OF MANAGEMENT AND SCIENCE ISSN 2250-0669
JANUARY-JUNE 2012 http://www.4dinternationaljournal.com VOL 2 / ISSUE 1
Pag
e12
0
Table 1: Comparison of Per Capita Emissions of CO2 by Power Sector –Developed
Vs Developing Nations
Countries CO2 Emission by Power
Sector(Tones of CO2/capita/year)
Australia 10.6
US 9.5
EU 3.3
China 2.4
India 0.6
Brazil 0.1
Source : www.carma.org
The table shows that Australian and American power sector is the top CO2 emitter on per
capita basis, and developing countries like China, India and Brazil are less as compared
to developed countries
Indian Power Sector and its performances : The Indian power sector is dominated by
government ministries and public sector corporations. Generally, the Central
government, through the Ministry of Power, sets overall electricity policies, whereas the
State governments focus on power plants located within their boundaries, and on regional
and local transmission and distribution (T&D) networks.
Although currently about 60 percent of installed capacity is vested in the State sector,
NTPC (a Central government-owned utility) is the leader in the power sector, accounting

4D INTERNATIONAL JOURNAL OF MANAGEMENT AND SCIENCE ISSN 2250-0669
JANUARY-JUNE 2012 http://www.4dinternationaljournal.com VOL 2 / ISSUE 1
Pag
e12
1
for about 20 percent of total capacity (27 GW) and about 28 percent of the total power
generated in the country. NTPC also is usually the first utility to experiment with,
deployment of supercritical pulverized coal technology is taking place in NTPC-owned
plants. It also is actively involved in developing gasification technologies for Indian coal.
The typical generation profile of the Indian power sector in 2010-11 (See Table 2)
dominated by thermal (65.38%) sector of which share of coal is 54.41% followed by
hydro (21.95%) and others. Contribution of fossil fuel in power has shown declining
trend in the last 5 years, but its dominance has led increased overall carbon intensity of
the sector. However, according to the 11th Five year Plan, clean capacity additions such
as nuclear power is projected to constitute 5% of the total electricity generation and hydro
power is expected to contribute around 13% of the electricity generation for the Indian
Power Sector.
Table 2 : Total Installed Capacity of Power Sector in India as on 31-01-2011
Fuel MW Percentage
Total Thermal 1,11294.48 65.38
Coal 92638.38 54.41
Gas 17456.35 10.25
Oil 1199.75 0.70
Hydro (Renewable) 37367.40 21.95
Nuclear 4780 2.80
RES* (MNRE) 16786.98 9.86
Total 170228.86 100
* Renewable Energy Source ;Source : NTPC Website
Power Generation & CO2 Emission data : The data of CO2 emission of central govt,
state govt and private sector were collected and analyzed. In the power sector, data of

4D INTERNATIONAL JOURNAL OF MANAGEMENT AND SCIENCE ISSN 2250-0669
JANUARY-JUNE 2012 http://www.4dinternationaljournal.com VOL 2 / ISSUE 1
Pag
e12
2
Tata Power and Reliance Energy were collected as these two players are the largest
private power producers in the country
All India (Aggregate):
Table 3 : Power generation and CO2 emission data (2000-01 TO 2008-09)
All India -Aggregate All India- Aggregate (Thermal)
Year Net
Generation
(GWh)
Absolute
Emission
(tCO2)
Specific
Emission
(tCO2/MWh)
Net
Generation
(GWh)
Absolute
Emission
(tCO2)
Specific
Emission
(tCO2/MWh)
%
Thermal
2000-01 465321 380959970 0.82 375923 380959971 1.01 80.79
2001-02 481417 399436516 0.83 390637 399436516 1.02 81.14
2002-03 502480 427116728 0.85 420718 427116728 1.02 83.73
2003-04 517174 439157728 0.85 428838 439157728 1.02 82.92
2004-05 548451 461225442 0.84 449681 461225442 1.03 81.99
2005-06 576206 469721237 0.82 460250 469721237 1.02 79.88
2006-07 617567 494713250 0.80 488583 494713250 1.01 79.11
2007-08 653434 520488025 0.80 516343 520488025 1.01 79.02
2008-09 668029 548383082 0.82 543274 548383082 1.01 81.32
%
Increase 43.56 43.94 0.26 44.51 43.94 -0.39
Source : CEA (Edited and compiled)

4D INTERNATIONAL JOURNAL OF MANAGEMENT AND SCIENCE ISSN 2250-0669
JANUARY-JUNE 2012 http://www.4dinternationaljournal.com VOL 2 / ISSUE 1
Pag
e12
3
Central Government’s Contribution :
Table 4 : Power generation and CO2 emission data (2000-01 TO 2008-09)
All India –Central Govt All India- Central Govt(Thermal)
Year Net
Generation
(GWh)
Absolute
Emission
(tCO2)
Specific
Emission
(tCO2/MWh)
Net
Generation
(GWh)
Absolute
Emission
(tCO2)
Specific
Emission
(tCO2/MWh)
%
Thermal
2000-01 181125 144934498 0.80 148278 144934498 0.98 81.87
2001-02 184946 148486829 0.80 150723 148486829 0.99 81.50
2002-03 196966 159423295 0.81 159787 159423295 1.00 81.12
2003-04 203730 168085004 0.83 165425 168085004 1.02 81.20
2004-05 221334 181686166 0.82 179831 181686166 1.01 81.25
2005-06 241788 187758954 0.78 192689 187758954 0.97 79.69
2006-07 258268 198795931 0.77 206964 198795931 0.96 80.14
2007-08 274762 210922563 0.77 219086 210922563 0.96 79.74
2008-09 279324 215384249 0.77 223624 215384249 0.96 80.06
%
Increase 54.21 48.60 -3.75 50.81 48.60 -2.04
Source : CEA (Edited and compiled)

4D INTERNATIONAL JOURNAL OF MANAGEMENT AND SCIENCE ISSN 2250-0669
JANUARY-JUNE 2012 http://www.4dinternationaljournal.com VOL 2 / ISSUE 1
Pag
e12
4
State Government’s Contribution :
Table 5 : Power generation and CO2 emission data (2000-01 TO 2008-09)
All India –State Govt All India- State Govt(Thermal)
Year Net
Generation
(GWh)
Absolute
Emission
(tCO2)
Specific
Emission
(tCO2/MWh)
Net
Generation
(GWh)
Absolute
Emission
(tCO2)
Specific
Emission
(tCO2/MWh)
%
Thermal
2000-01 247972 208887870 0.84 192716 208887870 1.08 77.72
2001-02 256515 220764931 0.86 201665 220764931 1.09 78.62
2002-03 254623 230644534 0.91 211873 230644534 1.09 83.21
2003-04 263224 235085180 0.89 216146 235085180 1.09 82.11
2004-05 276022 242761922 0.88 221862 242761922 1.09 80.38
2005-06 280656 243647099 0.87 217935 243928516 1.12 77.65
2006-07 301488 254638301 0.84 229306 255008431 1.11 76.06
2007-08 312295 263013913 0.84 236595 263409805 1.11 75.76
2008-09 316106 280378167 0.89 252711 280880566 1.11 79.95
%
Increase 27.47 34.22 5.29 31.13 34.46 2.77
Source : CEA (Edited and compiled)

4D INTERNATIONAL JOURNAL OF MANAGEMENT AND SCIENCE ISSN 2250-0669
JANUARY-JUNE 2012 http://www.4dinternationaljournal.com VOL 2 / ISSUE 1
Pag
e12
5
Government Sector (Center & States) Contribution:
Table 6: Power generation and CO2 emission data (2000-01 TO 2008-09)
All India –Public Sector All India- Public Sector (Thermal)
Year Net
Generation
(GWh)
Absolute
Emission
(tCO2)
Specific
Emission
(tCO2/MWh)
Net
Generation
(GWh)
Absolute
Emission
(tCO2)
Specific
Emission
(tCO2/MWh)
%
Thermal
2000-01 429097 353822368 0.82 340994 353822368 1.04 79.47
2001-02 441461 369251760 0.84 352388 369251760 1.05 79.82
2002-03 451589 390067829 0.86 371660 390067829 1.05 82.30
2003-04 466954 403170184 0.86 381571 403170184 1.06 81.71
2004-05 497356 424448088 0.85 401693 424448088 1.06 80.77
2005-06 522771 431687470 0.83 410624 431687470 1.05 78.55
2006-07 560199 453804361 0.81 436270 453804362 1.04 77.88
2007-08 587541 474332369 0.81 455681 474332368 1.04 77.56
2008-09 596073 496264814 0.83 476335 496264815 1.04 79.91
%
Increase 38.91 40.25 0.96 39.69 40.25 0.40
Source : CEA (Edited and compiled)

4D INTERNATIONAL JOURNAL OF MANAGEMENT AND SCIENCE ISSN 2250-0669
JANUARY-JUNE 2012 http://www.4dinternationaljournal.com VOL 2 / ISSUE 1
Pag
e12
6
Private Sector’s Contribution :
Table 7: Power generation and CO2 emission data (2000-01 TO 2008-09)
All India –Private Sector All India- Private Sector (Thermal)
Year Net
Generation
(GWh)
Absolute
Emission
(tCO2)
Specific
Emission
(tCO2/MWh)
Net
Generation
(GWh)
Absolute
Emission
(tCO2)
Specific
Emission
(tCO2/MWh)
%
Thermal
2000-01 36224 27137603 0.75 34929 27137603 0.78 96.43
2001-02 39957 30184756 0.76 38249 30184756 0.79 95.73
2002-03 50891 37048899 0.73 49058 37048899 0.76 96.40
2003-04 50220 35987544 0.72 47267 35987544 0.76 94.12
2004-05 51095 36777354 0.72 47988 36777354 0.77 93.92
2005-06 53434 38033767 0.71 49626 38033767 0.77 92.87
2006-07 57368 40908888 0.71 52313 40908888 0.78 91.19
2007-08 65893 46155657 0.70 60662 46155657 0.76 92.06
2008-09 71956 52118267 0.72 66939 52118267 0.78 93.03
%
Increase 98.64 92.05 -3.31 91.64 92.05 0.21
Source : CEA (Edited and compiled)

4D INTERNATIONAL JOURNAL OF MANAGEMENT AND SCIENCE ISSN 2250-0669
JANUARY-JUNE 2012 http://www.4dinternationaljournal.com VOL 2 / ISSUE 1
Pag
e12
7
Tata Power’s Contribution :
Table 8: Power generation and CO2 emission data (2000-01 TO 2008-09)
All India –Tata Power All India- Tata Power (Thermal)
Year Net
Generation
(GWh)
Absolute
Emission
(tCO2)
Specific
Emission
(tCO2/MWh)
Net
Generation
(GWh)
Absolute
Emission
(tCO2)
Specific
Emission
(tCO2/MWh)
%
Thermal
2000-01 9350 5473963 0.59 8204 5473963 0.67 87.74
2001-02 10562 7700213 0.73 9267 7700213 0.83 87.74
2002-03 11901 9216516 0.77 10570 9216516 0.87 88.82
2003-04 11814 8315219 0.70 10474 8315219 0.79 88.66
2004-05 12530 9093271 0.73 11098 9093271 0.82 88.57
2005-06 13066 9112312 0.70 11053 9112312 0.82 84.59
2006-07 13537 9788564 0.72 11411 9788564 0.86 84.29
2007-08 13877 10725000 0.77 12395 10725000 0.87 89.32
2008-09 13663 11046643 0.81 12532 11046643 0.88 91.72
%
Increase 46.12 101.80 38.10 52.75 101.80 32.109
Source : CEA (Edited and compiled)

4D INTERNATIONAL JOURNAL OF MANAGEMENT AND SCIENCE ISSN 2250-0669
JANUARY-JUNE 2012 http://www.4dinternationaljournal.com VOL 2 / ISSUE 1
Pag
e12
8
4.7 Reliance Energy’s Contribution :
Table 9: Power generation and CO2 emission data (2000-01 TO 2008-09)
All India –Reliance Energy/BSES
(Thermal)
All India- NTPC
Year Net
Generation
(GWh)
Absolute
Emission
(tCO2)
Specific
Emission
(tCO2/MWh)
Net
Generation
(GWh)
Absolute
Emission
(tCO2)
Specific
Emission
(tCO2/MWh)
2000-01 3510 3268410 0.93 126621 113903428 0.90
2001-02 3779 3548191 0.94 129364 117708556 0.91
2002-03 4875 4195198 0.86 136810 126559701 0.93
2003-04 6610 5269011 0.80 139943 132244239 0.94
2004-05 5684 4611235 0.81 153364 145263727 0.95
2005-06 5214 4324730 0.83 164699 150704566 0.92
2006-07 5588 4595668 0.82 178062 161502121 0.91
2007-08 5897 4797464 0.81 187979 171535007 0.91
2008-09 6177 4988276 0.81 193616 176829030 0.91
%
Increase 75.98 52.62 -13.27 52.90 55.24 1.52
Source : CEA (Edited and compiled)

4D INTERNATIONAL JOURNAL OF MANAGEMENT AND SCIENCE ISSN 2250-0669
JANUARY-JUNE 2012 http://www.4dinternationaljournal.com VOL 2 / ISSUE 1
Pag
e12
9
5. Comparative Analysis (between the year 2000-09)
Based on data, comparative analysis of performance of Central Govt, State Govt, Private
sector (with all major sources of fuel and thermal based exclusively) and leading power
producers NTPC, Tata Power and Reliance Energy on the parameters of (i) present value
of average specific emission, (ii) growth in average specific emission, and (iii) percentage
increase in CO2 emission) have been done as mentioned under.
(A)Centre –State –Private Sector (All sources of Fuel)
Overall, amount of CO2 emission has increased by 44 percent , average specific CO2
emission has increased marginally by 0.26 percent and present level of average specific
CO2 emission is 0.82 on all India basis. Performances of Central , State Governments
and private sector on above mentioned parameter are as following
(i)Present value of Average Specific CO2 Emission: Performance of private sector is
the best with value of 0.72, State Government is the worst with value of 0.89
(ii) Growth in Average Specific CO2 Emission: Performance of Central Government is
the best with negative growth of 3.75 percent and State Government is the worst with
positive growth of 5.29 percent.
(iii) Percentage increase in CO2 emission: Performance of State Government is the best
with just 34 percent increase in CO2 emission and private sector is the worst with 92
percent increase in CO2 emission

4D INTERNATIONAL JOURNAL OF MANAGEMENT AND SCIENCE ISSN 2250-0669
JANUARY-JUNE 2012 http://www.4dinternationaljournal.com VOL 2 / ISSUE 1
Pag
e13
0
(B)Centre –State –Private Sector (Thermal)
Overall, amount of CO2 emission has increased by 44 percent, average specific CO2
emission has decreased marginally by 0.39 percent and present level of average specific
CO2 emission is 1.01. Performances of Central, State Governments and private sector on
above mentioned parameter are as following
(i) Present value of Average Specific CO2 Emission: Performance of private sector is
the best with value of 0.78, State Government is the worst with value of 1.11
(ii) Growth in Average Specific CO2 Emission: Performance of private sector is the
best with negative growth of 3.31 percent and State Government is the worst with
positive growth of 2.70 percent.
(iii) Percentage increase in CO2 emission: Performance of State Government is the best
with just 34.50 percent increase in CO2 emission and private sector is the worst with 92
percent increase in CO2 emission
B) NTPC–Tata Power –Reliance Energy (Thermal)
(i) Present value of Average Specific CO2 Emission : Performance of Reliance Energy
is the best with value of 0.81, NTPC is the worst with value of 0.91
(ii) Growth in Average Specific CO2 Emission: Performance of Reliance Energy is the
best with negative growth of 13.27 percent and Tata Power is the worst with positive
growth of 32.11 percent.

4D INTERNATIONAL JOURNAL OF MANAGEMENT AND SCIENCE ISSN 2250-0669
JANUARY-JUNE 2012 http://www.4dinternationaljournal.com VOL 2 / ISSUE 1
Pag
e13
1
(iii) Percentage increase in CO2 emission: Performance of Reliance Energy is the best
with just 52.60 percent increase in CO2 emission and Tata Power is the worst with 110.8
percent increase in CO2 emission
Table 10 : Comparative Chart for Centre –State-Private Sector
Parameter of
Performance
Evaluation
All Major Sources of Fuel Thermal Based Only
Best Worst Best Worst
Present value
of Average
Specific CO2
Emission
Private Sector State Govt Private Sector State Govt
Growth in
Average
Specific CO2
Emission
Central Govt State Govt Private Sector State Govt
Percentage
increase in
CO2 emission:
State Govt Private Sector State Govt Private Sector
Table 11 : Comparative Chart for NTPC –Tata Power –Reliance Energy
Parameter of Performance
Evaluation
Thermal Based Only
Best Worst
Present value of Average Specific
CO2 Emission
Reliance Energy NTPC
Growth in Average Specific CO2
Emission
Reliance Energy Tata Power
Percentage increase in CO2 emission: Reliance Energy Tata Power

4D INTERNATIONAL JOURNAL OF MANAGEMENT AND SCIENCE ISSN 2250-0669
JANUARY-JUNE 2012 http://www.4dinternationaljournal.com VOL 2 / ISSUE 1
Pag
e13
2
The typical carbon intensive profile for the Indian power sector is due to dominance of
fossil fuel-based power generation during the past decades. Coal-based power generation
with relatively low efficiency sub-critical technology has been dominating the generation
mix for the Indian power sector for an extended period of time.
6. Conclusion
GHG control and reduction of emissions from the thermal-power sector necessarily will
be a critical element in the India‘s carbon-mitigation strategy. Based on data, comparative
analysis of performance of Central Govt, State Govt, Private sector (with all major
sources of fuel and thermal based exclusively) and leading power producers NTPC, Tata
Power and Reliance Energy on the parameters of (i) present value of average specific
emission, (ii) growth in average specific emission, and (iii) percentage increase in CO2
emission) reveal that overall, amount of CO2 emission has increased by 44 percent ,
average specific CO2 emission has increased marginally by 0.26 percent and present
level of average specific CO2 emission is 0.82 on all India basis. Among Central , State
Governments and private sector, average specific CO2 emission at present is the worst
for state government players. The private sector has controlled the growth in average
specific CO2 emission, but at the same time percentage increase in CO2 emission has
highest by this sector. Comparative study among NTPC, Tata Power and Reliance Energy
shows that Reliance Energy is the best among all in terms of all parameters discussed.
The basic reason behind is the use of gas based thermal power generation. Indian Coal
power sector has shown marginal improvement in reduction of CO2 emission in the last
10 years because of increasing use of efficient boilers, gas based power generation
(specially by private sector) and increasing emphasis use of renewable sources of energy

4D INTERNATIONAL JOURNAL OF MANAGEMENT AND SCIENCE ISSN 2250-0669
JANUARY-JUNE 2012 http://www.4dinternationaljournal.com VOL 2 / ISSUE 1
Pag
e13
3
like hydro, wind, solar etc. However, there also are other, more immediate challenges for
the power sector, of which the most pressing is the need to enhance the availability of
electric power to the country‘s citizen and industry. Further, the recent stand of
Government of India in Cancum summit at Maxico on climate change, making legal
binding emission cuts (reversing the earlier stand of only volunteer reduction of GHG as
per Kyoto Protocol) is going to make power sector most vulnerable to carbon tax.
Therefore, it is imperative to accelerate the process of switching to the greener
technologies and realize the potential to earn revenue by carbon credit practices.
References
―A facesaver in Copenhagen scripted by US and friends‖ Sunday Times, The
Times of India, date December 20, 2009, P.1 &13
Chandler, W., Schaeffer, R., Dadi, Z., Shukla, P.R., Tudela, F., Davidson, O.,
Alpan-Atmer, S., 2002. ― Climate change mitigation in developing countries:
Brazil. China, India, Mexico, South Africa, and Turkey.‖, Website:
http://www.pewclimate.org/global-warming-in
depth/all_reports/climate_change_mitigation
Chikkatur, A., 2008. ―A Resource and Technology Assessment of Coal
Utilization in India.‖,Website : http://www.pewclimate.org/docuploads/india-
coal-technology.pdf
―China passes US, leads world in power sector carbon emissions‖, Website :
www.cgdev.org, dated June 12, 2011
IPCC, 2001. ―Summary for Policymakers.‖ In: Climate Change 2001. Synthesis
report. Watson, R.T., Core Writing Team (eds.). Intergovernmental Panel on

4D INTERNATIONAL JOURNAL OF MANAGEMENT AND SCIENCE ISSN 2250-0669
JANUARY-JUNE 2012 http://www.4dinternationaljournal.com VOL 2 / ISSUE 1
Pag
e13
4
Climate Change. Website : www.ipcc.ch/pdf/climate-changes-2001/synthesis-
spm/synthesis-spm-en.pdf
IPCC, 2007. Climate Change 2007 : Physical Science Basis. Contribution of
Working Group I to the Fourth Assessment Report of the Intergovernmental
Panel on Climate Change. Cambridge University Press, New York
Ministry of Power, 2005. ―National Electricity Policy.‖ Government of India.
Website : www.cea.nic.in/planning/national_Electricity_policy.htm
―Power Sector reports‖, Central Authority Electricity Website:
www.cea.nic.in/power_sec_reports/reports.htm, dated June 23, 2010
World Bank 2005, Community Development Carbon Fund, Annual Report 2004
World Bank, Washington, P.5
World Bank. 2009, State and Trends of the CarbonMarket 2009, World Bank,
May
―World‘s 1st energy market in India‖, The Times of India, December 13, 2008,
P.20

4D INTERNATIONAL JOURNAL OF MANAGEMENT AND SCIENCE ISSN 2250-0669
JANUARY-JUNE 2012 http://www.4dinternationaljournal.com VOL 2 / ISSUE 1
Pag
e13
5
QUALITY OF WORKLIFE- A WAY TO MANAGE BUSINESS IN
CURRENT ECONOMIC SCENARIO
Prof. Rajnish Ratna
Amity University, U.P.
Abstract
While one of the most serious consequences of the current economic downturn has been
millions of people being fired from their job. But a strange counter-phenomenon to this is
more than just a handful of talented staff in the companies, chose exactly this time to quit
and find new employment.
The carefully engineered HR strategies made for recession are challenged by the exact
same phenomenon. On tight budget and pressed for keeping their market share,
companies downsize and keep only those who are absolutely necessary. However, in the
companies, a wave of people resigning starts right after the downsizing, upsetting the
precarious balance achieved through getting rid of the non-essential workforce.
The main intent of doing this project is to understand what good quality work life means
to employees and how it helps the companies to retain its best talent. The main objectives
are to examine the relevance of various QWL factors in terms of their contribution to the
satisfaction of employees to their job and to identify the areas having potential for
improving employee motivation. The project helps me to understand how a company’s
HR Department tries to improve their business by keeping good relations with employees.
The primary data was collected through the questionnaire. The sample size was 80
respondents comprising of managers and executives from 2 different manufacturing
companies. Percentage score analysis, mean score analysis and Pearson’s correlation
has been done to meet the objectives of the study.
Key words: Quality of Work Life, job satisfaction, employee motivation

4D INTERNATIONAL JOURNAL OF MANAGEMENT AND SCIENCE ISSN 2250-0669
JANUARY-JUNE 2012 http://www.4dinternationaljournal.com VOL 2 / ISSUE 1
Pag
e13
6
INTRODUCTION
Work is an integral part of daily life of people, as it is their livelihood or career or business. On an
average people spend around twelve hours daily in the work place that is one third of our entire;
life it does influence the overall quality of their life. It should yield job satisfaction, give piece of
mind, a fulfillment of having done a task, as it is expected, without any flaw and having spent the
time fruitfully, constructively and purposefully. Even if it is a small step towards the lifetime goal,
at the end of the day it gives satisfaction and eagerness to look forward to the next day. If
organizations are concerned about developing their human resources and gaining a competitive
advantage in the marketplace, it seems necessary that they attend to one of their most precious
assets, namely, their human resources. ―Employee presence does not mean Employee
productivity‖. The profit of successful organizations is not to be achieved at the expense of its
employees. The only thing that will maintain today‘s source of competitive advantage is high
quality personnel instead of merely capital, technology or long-lived products. In today‘s
commercial world, a productive workforce can increase productivity and efficiency, as well as
being a vehicle essential for gaining and maintaining sustainable competitive advantages for
business organizations on a global basis.
It is necessary that the employees feel motivated and committed to their job. And bringing in the
quality to their working life by paying attention on various measures is way to make the employee
feel motivated and satisfied with their job. Many factors determine the meaning of quality of work
life. Some of them are; Work Family Balance, Relationship with peers, Role Clarity,
Meaningfulness of Job, Access to Resources, Working Environment, Opportunity to Develop new
Skills, Health Care Benefits and Welfare, Fair and Equitable pay, Opportunity to grow in career.
All these factors play a significant role in adding quality to the working life of employees.

4D INTERNATIONAL JOURNAL OF MANAGEMENT AND SCIENCE ISSN 2250-0669
JANUARY-JUNE 2012 http://www.4dinternationaljournal.com VOL 2 / ISSUE 1
Pag
e13
7
QWL: The Human Resource Departments’ Strategy
The human resource department plays a key role in adding quality to working life of employees.
By substantiating employee satisfaction and bottom line benefits, which range from lower
absenteeism and turnover to higher productivity and fewer accidents, the HR plays the major role.
Perhaps the most crucial role of the department is winning the support of management particularly
top management which is almost universal prerequisite for successful QWL programs.
Only employees‘ satisfaction and motivation can add quality to their working life. The department
has both direct and indirect influence on employee motivation and satisfaction.
As the figure 1 illustrates, the department makes direct contact with employees and supervisors
through orientation, training and development, career planning and counseling activities. At the
same time, these activities may help a supervisor do a better job of motivating employees.
The policies and practices of the department also influence motivation and satisfaction
indirectly. Rigorous enforced safety and health programs, for example, can give employees and
supervisors a greater sense of safety from accidents and industrial health hazards. Likewise,
compensation policies may motivate and satisfy employees through incentive plans, or they
may harm motivation and satisfaction through insufficient rises or outright salary freezes. The
motivation and satisfaction of employees act as feedback on organization‘s QWL and on the
departments day to day activities.

4D INTERNATIONAL JOURNAL OF MANAGEMENT AND SCIENCE ISSN 2250-0669
JANUARY-JUNE 2012 http://www.4dinternationaljournal.com VOL 2 / ISSUE 1
Pag
e13
8
Figure 1: Role of HR Department in influencing QWL
Satisfaction
Direct
Orientation
Training and
Development
Career Planning
Counseling Supervisor Employee
Indirect
Safety and
Health policies
Compensation practices
Other policies and
practices
Motivation
OBJECTIVES OF THE STUDY
The research study aims at assessing the importance of various QWL factors to employees in
the two organizations; examining the relevance of various QWL factors in terms of their
contribution to the satisfaction of employees to their job ; and identifying the areas having
potential for improving employee motivation and job satisfaction.
Human
Resource
Department
Q
U
AL
I
TY
O
F
W
O
RK
L
I
F
E

4D INTERNATIONAL JOURNAL OF MANAGEMENT AND SCIENCE ISSN 2250-0669
JANUARY-JUNE 2012 http://www.4dinternationaljournal.com VOL 2 / ISSUE 1
Pag
e13
9
RESEARCH METHODOLOGY
1. Research Design: Descriptive Research
2. Sampling method: Simple Random Sampling has been used for the selection of
the sample.
3. Data Sources: The study uses both primary and secondary data. The primary data
was collected through a questionnaire which was prepared to find out the satisfaction
level of employees towards various QWL variables. The questionnaire was designed
using 5 point likert scale and dichotomous scale. The questionnaire was designed for
evaluating quality of working life of employee with 10 different parameters. The
parameters are identified after doing the review of literature. The 10 parameters are
Work Family Balance; Relationship with peers; Role Clarity; Meaningfulness of Job;
Access to Resources; Working Environment; Opportunity to Develop new Skills;
Health Care Benefits and Welfare; Fair and Equitable pay; Opportunity to grow in
Career.
4. Sample Size: The sample size was 80 respondents comprising of managers and
executives from 2 different manufacturing companies.
5. Analysis of the data: Percentage scores and mean scores has been used to
analyze the data. Pearson‘s correlation analysis is done to find out the degree of
correlation between various QWL variables and Job Satisfaction and its
comparison with the mean score rank order is done to find out the areas having
potential for improving employee motivation and job satisfaction.

4D INTERNATIONAL JOURNAL OF MANAGEMENT AND SCIENCE ISSN 2250-0669
JANUARY-JUNE 2012 http://www.4dinternationaljournal.com VOL 2 / ISSUE 1
Pag
e14
0
RESULTS AND DISCUSSIONS
The quantitative analysis was performed using SPSS. The data collected was converted into an
SPSS data sheet. Percentage scores and the mean scores were calculated and the interpretations
are derived.
Table 1 : Summary of percentage scores and mean scores
S.No QWL
Parameters
Percentage
Agreement
Mean
score
Rank
order
Remarks
1 Work Family
Balance
87.50 4.20 3 Organizations takes care of the non work
life activities of its employees.
2 Relationship
with peers
88.70 4.09 4 In the organizations there exists a friendly
environment ; a means of social integration
3 Role Clarity 86.25 4.41 1 Employees are clear about what is expected
out of them
4 Meaningfuln
ess of Job
76.20 4.31 2 Three fourth of the employees believe that
their work is meaningful and challenging
5
Access to
Resources
72.50 3.73 7 Dissatisfaction among employees is on
account of technology as most of the
respondents answered that technology is in
bad shape in their respective organizations.
6
Working
Environment
67.80 3.93 6 Less percentage agreement with the
suitability of working environment;
employees are not much satisfied with the
working conditions
7 Opportunity 80.00 4.08 5 The organizations provides its employees

4D INTERNATIONAL JOURNAL OF MANAGEMENT AND SCIENCE ISSN 2250-0669
JANUARY-JUNE 2012 http://www.4dinternationaljournal.com VOL 2 / ISSUE 1
Pag
e14
1
to Develop
new Skills
with the opportunity to increase in their
basket of knowledge and skill
8
Health Care,
Benefits and
Welfare
64.10 3.56 8 Poor agreement with welfare policy of the
organization : dissatisfaction on account of
canteen and food facilities; health and
safety needs are also not adequately met by
the organizations.
9
Fair and
Equitable pay
58.80 3.55 9 Employee are not satisfied with the
organizations‘ pay policy this implies that
their economic needs are not adequately
met by the organizations
10
Opportunity
to grow in
career
65.00 3.66 10 Quiet a good percentage of employees are
not satisfied with the career grow
opportunities provided by the organizations
Variables 1, 2, 3, 4 and 7 can be put under group 1 with more than seventy five percentage of
agreement and mean score greater than 4 and rest other variables under group 2 with
percentage agreement less than 75% and mean score less than 4. As out of 10 variables, 5 falls
under group 1 it can be interpreted that overall QWL in the organizations where the research is
conducted is not poor. However, it is imperative to point out here that this can in no way be
construed to mean ‗good‘, or ‗ideal‘, state of QWL exists in the organizations. None of the
factors have recorded ‗poor‘ existence of QWL. But the organizations have to come forward in
a big way to improve on its health and safety policies, welfare measures, and pay policy.
Surprisingly, QWL is below average percentage level in case of fair and equitable pay and with
least mean score among all variables. Fair and equitable pay is one of the major factors related
to job satisfaction and in turn to QWL. Also employees seem to be in less agreement with the

4D INTERNATIONAL JOURNAL OF MANAGEMENT AND SCIENCE ISSN 2250-0669
JANUARY-JUNE 2012 http://www.4dinternationaljournal.com VOL 2 / ISSUE 1
Pag
e14
2
existing working conditions. The dissatisfaction among employees with the working conditions
can be attributed to poor temperature control, inefficient information flow system and non
accessibility to proper technology at their desk.
In contradiction to high percentage agreement in case of opportunity provided by the
organizations to develop new skills and upgrade the existing ones it was founded that quite a
good number of people (32%) haven‘t attended any training program but out of those who have
attended training programs approximately 75% of them have found the training content either
very good or good (Exhibit – 1) and more than 90% of the respondent population feels that the
training programs helps an employee to develop new skills and upgrade the existing ones
(Exhibit – 2). A little more effort and management‘s interest in organizing the training
sessions, can make employees feel more satisfied and would make them more productive.
Results from Co-relation Tests
Correlation tests were conducted to examine the individual relationships between the QWL
dimensions and job satisfaction. The outputs of the tests were summarized in the table below

4D INTERNATIONAL JOURNAL OF MANAGEMENT AND SCIENCE ISSN 2250-0669
JANUARY-JUNE 2012 http://www.4dinternationaljournal.com VOL 2 / ISSUE 1
Pag
e14
3
Correlations between individual QWL variable and Job Satisfaction
Table 2 : Summary of Correlation analysis and mean score comparison
S.No QWL- Job Satisfaction
Relationship
R values Rank
order
Mean Score
Rank order
Difference
1 Work Family Balance .620 9 3 6
2 Relationship with peers .531 10 4 6
3 Role Clarity .810 4 1 3
4 Meaningfulness of Job .857 2 2 0
5 Access to Resources .890 1 7 -6
6 Working Environment .812 3 6 -3
7 Opportunity to Develop new
Skills
.701 8 5 3
8 Health Care, Benefits and
Welfare
.771 6 8 -2
9 Fair and Equitable pay .705 7 9 -2
10 Opportunity to grow in career .801 5 10 -5
* correlation at level of significance .05
The above correlation tests indicated that all the individual QWL variables have significant
impacts on job satisfaction. Quality of working life can only be brought in if the workers feel
satisfied in the organization. Therefore, all these factors needed to be looked after to maintain
the quality in the working life of employees. It is also clear that the 3 QWL variables (Access
to resources, working environment, and opportunity to grow in career) has to be given more

4D INTERNATIONAL JOURNAL OF MANAGEMENT AND SCIENCE ISSN 2250-0669
JANUARY-JUNE 2012 http://www.4dinternationaljournal.com VOL 2 / ISSUE 1
Pag
e14
4
importance as these variable has got higher R values. It is interesting to note that three QWL
variables (Access to Resources, working environment, and Opportunity to grow in career)
which contribute significantly towards Job satisfaction and thus in turn towards QWL got the
lowest mean scores or in other words lowest percentage agreement. Therefore meeting the
fourth objective of the study these three variables can be treated as the areas having potential
for improving employees‘ motivation and satisfaction related to job and thus in turn improving
the quality of working life of employees.
SUGGESTED GUIDELINES TO IMPROVE QWL
To get the best out of employees‘ a good amount of investment is required for up gradation of
technology and for improving the working conditions. Management‘s interest in organizing required
training programs for its employees is a prerequisite for ensuring quality in working life of
employees. An organization of a get to together of the families of employees help make the
employees treat the organization as their family and their colleagues as family members and in turn
making the organization a place where they want spent their maximum time, working hard to make
it number one in the market. Promotion and organization of more recreational activities such as
games, excursion trips, quizzes, workshops, seminars, training sessions etc will add to the quality of
working life of employees. Educating the employees about the organization‘s market share and
competitor‘s scenario will motivate the employees to work hard to achieve the goals of the
organization. An organization of talent hunt can lead to great improvement in quality of working of
the employees. As each person would like to get appreciations form others for the talent they have in
them. This will help them feel motivated and generate a sense of belongingness to the company.

4D INTERNATIONAL JOURNAL OF MANAGEMENT AND SCIENCE ISSN 2250-0669
JANUARY-JUNE 2012 http://www.4dinternationaljournal.com VOL 2 / ISSUE 1
Pag
e14
5
CONCLUSION
The study shows that the organizations are doing much to add quality to the working life of
employees in order to make them feel motivated and satisfied with their job. But there are
some major areas where management needs to devote a good amount of time and effort. .
However this study is not free from inherent limitations. Firstly the sample is small, more data
from the employees would have given a much accurate result. However in lieu of its limitation,
this study has an extended scope in the field of strategic HR.
REFRENCES
Research papers and Journals
1. Parris; Malisa(2008). ―Caught in the middle; Organizational impediments to middle
managers‘ Work life balance‖, Employee Responsibilities & Rights Journal, Vol. 20
Issue 2, p101-117, 17p
2. Lyness; Karen S(2008). ―Can a manager have a Life and Career? International and
outsource perspectives on Work life balance and Career Advancement Potential‖, Journal
of Applied Psychology, Vol. 93 Issue 4, p789-805, !7p
3. Saad H.S.; Jauhariah A; Samah A, Judhi N. ―Employees Perception on Quality Work life
and Job Satisfaction in a private higher learning institution‖, International Review of
Business Research Papers, Vol. 4 Issue 3, p23-34, 12p
4. Rose R.C.; Beh L; Uli J; Idris K(2006). ―An analysis of Quality of Work Life and Career-
Related Variables, American Journal of Applied Sciences‖, Vol 3 Issue 12, p51-p59, 9p
5. Chan K; Thomas A; Wayatt(2007). ―Quality of work life ; A Study of Employees in
Shanghai, China‖, Asia Pacific Business Review, Vol. 13 No. 4, p501-p517. 17p
6. Saklani D.R(2004). ―Quality of work Life in Indian context; An Empirical Investigation‖,
Vol. 31, No. 2

4D INTERNATIONAL JOURNAL OF MANAGEMENT AND SCIENCE ISSN 2250-0669
JANUARY-JUNE 2012 http://www.4dinternationaljournal.com VOL 2 / ISSUE 1
Pag
e14
6
7. Jeffrey H.; Greenhaus; Gary N. Powell(2006). ―When work and family are allies; A
theory of Work- Family Enrichment‖, Academy of Management Review, Vol. 31, No. 1,
p72-p92, 20p
8. McDonald P; Pini B;Bradley L (2007). ―How work–life culture impacts employees using
flexible work practices‖, Inernational Journal of Human Resource Management, Vol 18
No. 4, p602-p622, 20p, April
9. Ilies R, Wilson K.S.; David T. wanger(2009) ―The spillover of Job Satisfaction onto
employees‘ family lives: The facilitating role of work-family integration‖, Academy of
Management Journal, Vol 52 No. 1, p87-p102, 16p
10. Sutela H(2006). ―Finnish surveys measuring Quality of Work‖, Statistical Journal of the
United Nations Economic Commission of Europe, Vol. 23 No 1, p57-p67, 10p
11. Efraty D; Sigry M.J.(1988). ―effects of Quality of Working Life on employee behavioral
responses‖. Social Indicators Research, Kulwer Academic Publishers, Vol 22, p31-p47,
17p
Books
Human resource management by T.N. Chhabra
Personnel management by Philip Koltler
Websites
http://www.icmrindia.org
http://www.pdf-search-engine.com
http://www.mbajunction.com
http://www.pdf-search-engine.com
http://www.citehr.com
http://www.hronline.com

4D INTERNATIONAL JOURNAL OF MANAGEMENT AND SCIENCE ISSN 2250-0669
JANUARY-JUNE 2012 http://www.4dinternationaljournal.com VOL 2 / ISSUE 1
Pag
e14
7
ANNEXURE
Exhibt 1 : Have you ever attended any training program in the organization? If yes how do
you find the training content?
Frequency Percent
Valid
Percent
Cumulative
Percent
Valid Yes 51 63.8.00 63.8.00 63.8.00
No 27 36.2.00 36.2.00 100.0
Total 80 100.0 100.0
TRAINING * CONTENT Cross tabulation
CONTENT
Total Very Good Good Fair
TRAINING Yes Count 12 27 12 51
% within
TRAINING
23.5% 52.9% 23.5% 100.0%
Total
Count 12 27 12 51
% within
TRAINING
23.5% 52.9% 23.5% 100.0%

4D INTERNATIONAL JOURNAL OF MANAGEMENT AND SCIENCE ISSN 2250-0669
JANUARY-JUNE 2012 http://www.4dinternationaljournal.com VOL 2 / ISSUE 1
Pag
e14
8
Exhibit – 2: How far training programs help an employee to achieve the required skill for
performing the job ?
Frequency Percent
Valid
Percent
Cumulative
Percent
Valid To Great Extent 29 36.2 36.2 36.2
To some extent 44 55.0 55.0 91.2
Rarely 7 8.8 8.8 100.0
Total 80 100.0 100.0

4D INTERNATIONAL JOURNAL OF MANAGEMENT AND SCIENCE ISSN 2250-0669
JANUARY-JUNE 2012 http://www.4dinternationaljournal.com VOL 2 / ISSUE 1
Pag
e14
9

4D INTERNATIONAL JOURNAL OF MANAGEMENT AND SCIENCE ISSN 2250-0669
JANUARY-JUNE 2012 http://www.4dinternationaljournal.com VOL 2 / ISSUE 1
Pag
e15
0
WOMEN LEADER: FULFILLING CAREER ASPIRATIONS
Dr. A. Satyanarayan
Professor
Skyline Institute of Management and Technology,
Greater Noida, Uttar Pradesh
Ms. P.V. Purna Kumari
Assistant Professor
Skyline Institute of Management and Technology,
Greater Noida, Uttar Pradesh
Abstract
Life is all about letting go of the past, and grabbing the future. One great man once said, “The
rung of a ladder was never meant to rest upon, but only to hold your foot long enough to put the
other foot higher”. Graduation day is the day when we have to let go of the rung of the ladder
and stop higher towards our eternal destination. Our problems are rooted in the past mistakes,
not our capacity for future greatness. “Chase your dreams, face your fears, and dare to do the
impossible”. It is that should accept our limitations, but we shouldn’t let them limit us, it is also
said that, “we don’t always get what we want in life; some time the circumstance don’t allow us
to. At a time like that, we need to learn how to change ourselves. But it is sure we have our self
to conquer the looming challenges and chart our way to a successful future. The leadership
challenges that prevail today and the leadership style changes that are demanded of all
incumbent and aspiring leaders have prepared women to cope with new challenges better than
their male counterparts. In a country like India women as leaders have received far more
acceptability due to their style flexibility.
Women have development a way of life and work which have determined their attitude towards
work and home and home and enabled them to develop a deeper philosophical manifesto. This
sort of approach on the part of women will make them outstanding women leaders to develop
and sustain in all types of organizations. In every scenario that leads to economic value creation
women has been playing a value role. Over the last decade, there has been dramatic change in
the number of women who have entered into the Indian corporate world. Women entrepreneurs
are setting up business of their own at various stages of life because of a variety of reasons viz.,
independence, flexibility, and desire to make a difference and making money. As the women is
being increasing in the work force, the major challenge that presses a women is the gender

4D INTERNATIONAL JOURNAL OF MANAGEMENT AND SCIENCE ISSN 2250-0669
JANUARY-JUNE 2012 http://www.4dinternationaljournal.com VOL 2 / ISSUE 1
Pag
e15
1
diversity. This calls for new policies, new mindsets and new work ethics. Several organizations
now have developed women friendly policies with the objective of attracting and retaining
women in large numbers. There is a clear shift from the earlier paternalistic push strategy
(where by career development was the responsibility) to an employer driven pull strategy where
women is being persuaded to take responsibility for managing her career.
Introduction
In today‘s external environment, all organizations do not think it is possible and do not want to
offer a value proposition that includes lifetime career development in exchange for tenure/loyalty
for the society. Organizations believe that the employee value proposition in the ―new deal at
work‖ is to give transparent career development opportunities to those with potential and
performance in exchange for the optimum application of their skills and knowledge till such time
they are with the company.
So, while the focus is on creating a self-development culture, organizations seem to take the
responsibility for setting expectations, creating growth paths and communicating the framework
to the employees.
Career management and development is hence seen as a partnership between the organization
and the individuals, and it is in both parties‘ interests to collaborate. The organization‘s
responsibilities in this ―new deal at work‖ are:
To set the right expectations while hiring employees
To adopt a participative approach to career development
To develop a career development framework that caters to the high potential/high
performance employees
To articulate the competencies required for different roles for employee self development
To communicate and be transparent with career opportunities within the organization
The individuals’ Responsibilities are:
To take onus for managing their own careers
To take efforts to educate themselves on the competency framework and the career
development framework
To continuously assess themselves and make the efforts to consciously develop their
competencies
To use organizational initiatives for employee development to further develop themselves

4D INTERNATIONAL JOURNAL OF MANAGEMENT AND SCIENCE ISSN 2250-0669
JANUARY-JUNE 2012 http://www.4dinternationaljournal.com VOL 2 / ISSUE 1
Pag
e15
2
To plan their careers for the short term & long term keeping in mind possible
opportunities that the organization makes available
By doing this, organizations are conveying a clear message to their employees that they are
empowering and supporting them in their development, but they are not responsible for their
career development.
Career Progression Based on Competencies’ and not tenure.
There has been a significant shift to use competencies as the basis for career progress in thereby
moving away from tenure or time based promotions.
To do this, organizations have had to define the competencies required at various levels and
articulate them with clarity in terms of its behavioral indicators. The competency framework is
not just the foundation for career progression but also linked to the many other development
initiatives of the organization.
A Competency Assessment Process becoming essential either through assessment centers or the
Manager‘s Assessment.
All organizations in the study have implemented some kind of process to assess employees on
competencies which subsequently have been used for career progression decisions
The assessment is administered by the supervising manager of the employee or by an internal
panel or by an external agency through trained assessors.
Some organizations also use performance ratings, peer assessments or 360 degree feedback to
corroborate the Assessment Centre result.
In organizations where the people managers assess their employees, the competency assessment
forms part of the performance management system focusing on their aspect:
Goals and objectives
Job skill the functional and technical skill that one requires to carry out their role
Leadership competencies the behaviors that are required for the future
The organization uses the performance appraisal discussion for assessing the above three areas
and hiring the employee and the manager to understand what experiences the employee needs to
go through in order to grow and build a career.
The advantage of this integration is that assessment of performance and competency is
completed at the same time. However, there are two potential degrees of merging competency
assessment with the performance appraisal process.

4D INTERNATIONAL JOURNAL OF MANAGEMENT AND SCIENCE ISSN 2250-0669
JANUARY-JUNE 2012 http://www.4dinternationaljournal.com VOL 2 / ISSUE 1
Pag
e15
3
1. Firstly the linage of perceived linkage with rewards makes objective self-assessment by
the employee tougher.
2. Secondly, the parameters of assessment for the purpose of development and progression
could vary a development objective would require assessment of competencies applicable
to the current level, while a progression objective would require assessment of the
competencies applicable at the next level. Some companies resolve this issue by
assessing employees on additional competencies either through and assessment centre or
in a separate discussion with the manager.
Organizations attempting to push promotion time lines
In the early stages of BPO industry there was an urgent need for people at different levels,
especially the need for people managers. Employees in their early 20‘s with just 2+ years
experience were seen as ―veterans‖ in the industry and were quickly promoted and given people
management responsibilities. Similarly, even in the IT industry, many employees became project
managers quite early in their careers.
As the industry is maturing and a base level of talent is available, organizations are increasingly
pushing promotion time lines, reflecting the emergence of a more realistic opportunity scenario.
Mobility within the Organization through Open Job Posting Systems and not
through Traditional Job Rotations.
Many of the organizations we surveyed have discontinued their job rotation system of the past
and have moved to an open job posting system. They seem to have encountered two challenges
with the traditional job rotation system:
It was not benefitting the organization directly since it did not help in filling up existing
vacancies
It was placing onus on the organization in creating opportunities for employees.
Having said this about job rotation, there are mixed trend observed with the Open Job Posting
(OJP) since the transformation has not necessarily been smooth.
The successful organizations seem to have good support systems that have enabled the OJP
system to work as well oiled machinery. Some others have pursued the profession development
path where it becomes a planned movement of employees and is through a consensus of the
manager and the employee.
While of the OJP has the lofty goal of ―providing careers within rather than outside‖, its
execution has been plagued by some major obstacles:

4D INTERNATIONAL JOURNAL OF MANAGEMENT AND SCIENCE ISSN 2250-0669
JANUARY-JUNE 2012 http://www.4dinternationaljournal.com VOL 2 / ISSUE 1
Pag
e15
4
Finding timely replacement of talent in place of the employees opting out through the
OJP has become a challenge. It requires great planning and effort on the part of the
manager to ensure smooth transition.
Employees working on projects at customer sites especially in the IT industry, have a
problem of moving out primarily because of the familiarity with the customer and the
customer‘s insistence on continuity. Give the business sensitiveness, these moves get
stalled and the organization is seen as not living up to the commitment of the OJP
system.
The manager is not prepared to let go of his talent and risk his deliverables as finding
trained replacements have become a Herculean task given the external labour market
On the employee‘s part there entry if unsuccessful is not necessarily a very pleasant
experience. This ends up creating a fear of failure.
In organizations where OJP system has matured Managers pro actively counsel their employees
to apply for internal movements and it is further facilitated by Career Counselors and or skip-
level Managers.
A critical success factor in implementing an OJP is the positioning of lateral career movement as
a positive opportunity ever as the Broad banding system and the business require the flexibility
of moving employees across more frequently as and when the need arises. In all this, there is a
phenomenal- task for HR to communicate that job enrichment is also a means of building careers
for employees.
Creating cross-business opportunities for people across the larger
organization
The larger global organization seems to have the benefit of offering global opportunities and is
increasingly doing this through the global OJP system. This is win as India talent has now
become increasingly recognized as globally valuable. It also helps retention in a big way.
Best practices
We give below some the organization practices that are worth examining closely for adoption:
A well-articulated Employee Value proposition
An Employee Value Proposition simply stated, is the organization‘s compelling answer to the
question ―Why would a talented person choose to work for this organization?‖
There are well articulated EVP such as ―adding vitality to life‖. All the communication efforts at
every stage emphasize the message. All initiatives, including Career Development, are aligned to

4D INTERNATIONAL JOURNAL OF MANAGEMENT AND SCIENCE ISSN 2250-0669
JANUARY-JUNE 2012 http://www.4dinternationaljournal.com VOL 2 / ISSUE 1
Pag
e15
5
this proposition. Another example of an EVP would be offer abundant opportunities across the
organization and to make sure that EVP of mobility stands the test of time in the organization.
This becomes the core around which HR rallies many of its programme to ensure its success.
Organizations with a well aticulted EVP seem to have a distinct edge.
Multiple Career Ladders to Cater to Different Expectations of People
While the majority of employees perceive that the only way to progress is by taking on people
management responsibilities, there are some who value technical specialization. The approach of
creating multiple career ladders caters to the varied needs of people. Multiple career ladders are
alternative ladders to the people- management ladder. Depending on the business, these ladders
could be technical, functional domain-related or support to core operations.
Multiple career ladders send a clear message that the organization is committed to creating
different and distinct value-added roles for employees based on business needs and people
aspirations. The ability to create technical specialists and experts is seen by many organizations
as an important building block towards securing future competitive advantage.
The career counselor role to facilitate career Development
Some organizations have institutionalized career enabler roles, typically designated Career
Counselors, who interface with the manager, the employee and HR to ensure that career
development processes are administered effectively.
Employees who aspire to move to a particular role can first discuss with their Career Counselors
to get a holistic view of the role and understand the pro and the cons of the move into the role as
well as the competencies required to perform the role. This helps employees make a well
informed choice.
Career Counselors also network with mangers and other career counselors in different parts of
the business so that they can promote informal discussions about possible roles and
competencies. Individuals who perform the role of career counselor are often selected from
within the business and in some cases on a part time basis. The intention of the Career Counselor
role is to complement the career discussion process between managers & employees and is not
meant to replace it.
Tracking of Top Talent
Some organizations believe that while they are responsible for offering career development
opportunities to all, they also need o bring special focus on their key talent by developing career
strategies that will help develop and retain this group of employees.
The Top Talent Programme in organizations typically involves:

4D INTERNATIONAL JOURNAL OF MANAGEMENT AND SCIENCE ISSN 2250-0669
JANUARY-JUNE 2012 http://www.4dinternationaljournal.com VOL 2 / ISSUE 1
Pag
e15
6
1. A transparent system of identifying talent
2. Assessments to further identify the strength, leadership potential and so on
3. Focused development programs
4. Identifying opportunities and career progression
5. Retention strategies : Pay, rewards and recognition, ESOPs
6. Attrition risk analysis
The top talent program is constantly reviewed by the senior management team and HR plays a
major role in driving this initiative.
Educational Opportunities and competency Based Development Programme For employees. The
BPO industry has create a large number of jobs for people who enter the labour market
immediately after their graduation. Through exit interviews and attrition analysis, it has been
found that many of these people leave for higher education. This analysis suggests that young
graduates consider higher qualifications to be of great value.
Organizations have responded to this need by providing education opportunities to their
employees by providing with educational institutions and also by giving the necessary time offs
for this.
Organizations are also implementing learning initiatives to develop specific competencies. These
programmes have high learning effectiveness as they focus on developing the behaviors
associated with competency. This is in contrast to general programs which do not promote the
critical behavior that the organization expects.
While most of the organizations run these programs for all people moving to a particular level of
responsibility, a few organizations have chosen to make them more aspirational in nature. In the
latter cases, the participants are chosen based on a combination of assessment, performance
ratings and nominations by managers.
Qualifying Development Programe That Are Mandatory Promotion
Many organizations have found it necessary for their people to go through structured learning
programme and qualify/ certify themselves before they progress to the next level. This is a
requirement especially for those progressing to people manager responsibilities.
Work force planning Systems that Drive Career Development Keeping in Mind Business Needs
Organizations are developing robust systems of workforce planning (despite the vagaries of the
market) to ensure that career development happens in the context of business needs. Planning

4D INTERNATIONAL JOURNAL OF MANAGEMENT AND SCIENCE ISSN 2250-0669
JANUARY-JUNE 2012 http://www.4dinternationaljournal.com VOL 2 / ISSUE 1
Pag
e15
7
how many people are needed in the next year, by roles/ positions and competencies, enable the
organizations to work towards getting those people through the career development process.
Organizations have established functional resource committees for all key functions. These
committees lead discussions to identify the new requirements, vacancies and opportunities in
their respective functions. This then gets fed into the career development system and the top
talent management system. The OJP system is also integrated into the workforce planning helps
the organization estimate the likely number of vacancies keeping in mind business growth,
estimated attrition within the process and estimated career development through and out of the
process.
These organizations believe that workforce planning is a critical success factor for the OJP to
work successfully.
Our challenge as leaders is to ultimately ensure that people enjoy what they are doing and they
own the dream that we may have as leader for the company. We need to assume a facilitators
role by assisting the employees in their journey to achieve difficult targets.
To facilitate the process of turnaround, one also needs to put in enabling processes like
a) Award and Recognition Systems
b) Development of Talent and appropriate skill in employees
The Award and Recognition System should be fair, transparent and should necessarily ensure
that the awards are given where the Group values have been properly adhered to. We have been
stressing on the leadership core value which are as under
Customer Sovereignty
Passion for Superior Performance
People Orientation
Transparency, Speed and Flexibility
Innovation and Entrepreneurship

4D INTERNATIONAL JOURNAL OF MANAGEMENT AND SCIENCE ISSN 2250-0669
JANUARY-JUNE 2012 http://www.4dinternationaljournal.com VOL 2 / ISSUE 1
Pag
e15
8
Today has a new dream which is the screen saver on the computer of all the leaders in the
society.
World No. 1
Achieve Quality
&
Service Leadership
It will be done
I have to do it
The above enables focusing on the criticality of achieving strategic challenges of ―Quality and
Service Leadership‖ and maintaining the spirit of ―It will be done‖ and ― I have to do it‖.
Reference:
1. Asutosh Mukerjee, University News, Jan.22-28,2007
2. Susan Das, University News, May26-June1,2008
3. M.Veerappa, Molly University News, May18-24,2009
4. M.Ananda Krishnan, University News, Oct.27-Nov.2, 2008
5. Management Review, IIMB, 2008
6. Dr. A.Satyanarayan, INDIAN JOURNAL OF APPLIED ECONOMICS, Department of
Applied Economics, University of Lucknow, Vol.2, No.1, January 2005.
7. Entrepreneurship Development, Vasant Desai, Himalaya Publication House, New Delhi
8. NHRD Journal,Vol.2, August 2007

4D INTERNATIONAL JOURNAL OF MANAGEMENT AND SCIENCE ISSN 2250-0669
JANUARY-JUNE 2012 http://www.4dinternationaljournal.com VOL 2 / ISSUE 1
Pag
e15
9
Implementation of Enterprise Resource Planning:
Success Issues
Aashish Dixit
Assistant professor
GNIT (MBA) Institute,
Greater Noida, Uttar Pradesh
Abstract
ERP is the process of integrating all the business functions and processes in an organization to
achieve numerous benefits. It is especially important for companies who are “intimately
connected “ to their vendors and customers, and use electronic data interchange (EDI) to
process sales transactions electronically. Therefore, the implementation of ERP is exceptionally
beneficial to business such as manufacturing plants that mass-produce products with little
changes.
Keywords : ERP, Training , Business Organization, data integrity
Introduction to ERP
Information in large organizations is often spread across numerous homegrown computer
Systems, housed in different functions or organizational units. While each of these ―information
islands‖ can ably support a specific business activity, enterprise-wide performance is hampered
by the lack of integrated information. Further , the maintenance of these systems can result in
substantial costs.
While the Y2K bug has been fixed over time (at an estimated cost of $600 billion worldwide),
the lack of integration is a pervasive problem. Consider, for example, Boeing , which relies on
hundreds of internal and external suppliers for the millions of components needed to build an
airplane. The goal of putting the right parts in the right airplane in the right sequence at the right
time was managed at Boeing by four hundred systems that were designed in the sixties and were
all but integrated. Information inconsistencies were prevalent and the systems were not
synchronized. As a result, parts often arrived late, idling partially-built airplanes on Boeing‘s
assembly lines. In 1997, as Boeing faced unprecedented demand for its aircraft, these problems
became unbearable, and the company‘s manufacturing ground Enterprise Resource Planning

4D INTERNATIONAL JOURNAL OF MANAGEMENT AND SCIENCE ISSN 2250-0669
JANUARY-JUNE 2012 http://www.4dinternationaljournal.com VOL 2 / ISSUE 1
Pag
e16
0
(ERP) system based on commercial, off-the-shelf software. With the advent of E-Business and
the need to leverage multiple sources of information within the enterprise, ERP software has
emerged as a major area of interest for many businesses. Back-office enterprise software has its
roots in the 1960s and 1970s, as computing power became affordable enough for companies to
automate materials planning through MRP and financial processing through payroll and general
ledger software. MRP, short for Material Requirements Planning, was developed in the early
1960s at IBM and had become the principal production control paradigm in the U.S.MRP
consists of a set of procedures that convert forecasted demand for a manufactured product
into a requirements schedule for the components, subassemblies and raw materials comprising
that product.
What is ERP
ERP is a software architecture that facilitates the flow of information among the different
functions within an enterprise. Similarly, ERP facilitates information sharing across
organizational units and geographical locations. It enables decision-makers to have an enterprise-
wide view of the information they need in a timely, reliable and consistent fashion.
ERP provides the backbone for an enterprise-wide information system. At the core of this
enterprise software is a central database which draws data from and feeds data into modular
applications that operate on a common computing platform, thus standardizing business
processes and data definitions into a unified environment. With an ERP system, data needs to be
entered only once. The system provides consistency and visibility or transparency across the
entire enterprise. A primary benefit of ERP is easier access to reliable, integrated information. A
related benefit is the elimination of redundant data and the rationalization of processes, which
result in substantial cost savings.
The integration among business functions facilitates communication and information sharing,
leading to dramatic gains in productivity and speed. Cisco Systems, for example, harnessed ERP
to help it become the market leader in the global networking industry. Cisco‘s ERP system was
the backbone that enabled its new business model Global Networked Business based on the use
of electronic communications to build interactive, knowledge-based relationships with its
customers, business partners, suppliers and employees. In the process, Cisco doubled in size each
year and reaped hundreds of millions of dollars in both cost savings and revenue enhancements.

4D INTERNATIONAL JOURNAL OF MANAGEMENT AND SCIENCE ISSN 2250-0669
JANUARY-JUNE 2012 http://www.4dinternationaljournal.com VOL 2 / ISSUE 1
Pag
e16
1
Autodesk, a computer-aided design software company, reported a decrease in its order
fulfillment times from two weeks to 24 hours after installing an ERP system. Similar examples
abound in today‘s business environment.
An ERP Implementation Plan The flow chart in the given figure depicts several activities that
must be performed before implementing an ERP system.
Step 1: Managers must conduct a feasibility study of the current situation to assess the
organization‘s needs by analyzing the availability of hardware, software, databases, and in house
computer expertise, and make the decision to implement ERP where integration is essential.
They must also set goals for improvement and establish objectives for the implementation, and
calculate the break-even points and benefits to be received from this expensive IT investment.
Step 2: The second major activity involves educating and recruiting end users to be involved
throughout the implementation process.
Step 3: Managers form a project team or steering committee that consists of experts from all
functional areas to lead the project.
Step 4: After a decision is made to implement ERP, a team of system consultants will be hired to
evaluate the appropriateness of implementing an ERP system, and to help select the best
enterprise software provider and the best approach to implementing ERP. In most situations, the
consultant team also recommends the modules that are best suited to the company‘s operations
(manufacturing, financials, human resources, logistics, forecasting, etc.), system configurations,
and Business-to-Business applications such as supply-chain management, customer relationship
management, e-procurement, and e-marketplace.
Step 5: Adequate employee and manager training must be provided to all business, stakeholders,
including managers, end users, customers, and vendors, before the system is implemented. Such
training is usually customized and can be provided by either internal or outside trainers.
Step 6: The system installation process will address issues such as software configuration,
hardware acquisition, and software testing.
Step 7, 8 & 9: Data and information in the databases must be converted to the format used in the
new ERP system and servers and networks need to be upgraded. A post implementation review
is recommended to ensure that allbusiness ob jectives established during the planning phase are
achieved. Needed modifications are tackled during this phase too.

4D INTERNATIONAL JOURNAL OF MANAGEMENT AND SCIENCE ISSN 2250-0669
JANUARY-JUNE 2012 http://www.4dinternationaljournal.com VOL 2 / ISSUE 1
Pag
e16
2
Issues on ERP Implementation
Implementing an ERP causes massive change that needs to be carefully managed to reap the
benefits of an ERP solution. Critical issues that must be carefully considered to ensure successful
implementation include fundamental issues, organizational change process , people , and
implementation cost and time and employee morale. The pertinent issues are :
1. Fundamental Issues
Implementation of an ERP system can be long, costly, and labor-intensive and can affect an
organization‘s bottom line if done incorrectly. To ensure the success of any ERP implementation
project , a project team consisting of an ERP consultant, internal auditing, and IT staff familiar
with the company‘s business operations should be established and their role must be defined.
(a) Role of Manager
Manager must consider the fundamental issues of systems integration by analyzing the
organization‘s vision and corporate objectives.
■ Does management fully understand its current business processes, and can it make
implementation decisions in a timely manner?
■ Is management ready to undertake drastic business process reengineering efforts to yield
dramatic outcomes?
■ Is management ready to make any change in the structure, operations, and cultural
environment to accommodate the options configured in the ERP system?
■ Is the organization financially and economically prepared to invest heavily in an ERP
implementation?
(b) Role of an Auditor
Auditors play a proactive role in helping the organization laying the foundation for an initiative‘s
success with their knowledge of internal control practices, compliance requirements, and
business processes. In particular , internal auditors can :
■ Document abbreviations and their function.
■ Identify documents used in the organization‘s daily operations.
■ Compile a list of the organization‘s master data sets.
■ List the internal controls that are applied and adopted during each business process stage.
■ Create a list of currently used and recently generated management information reports.

4D INTERNATIONAL JOURNAL OF MANAGEMENT AND SCIENCE ISSN 2250-0669
JANUARY-JUNE 2012 http://www.4dinternationaljournal.com VOL 2 / ISSUE 1
Pag
e16
3
(b) Top Management Commitment
Management needs to exploit future communication and computing technology issues in order to
integrate the ERP systems with e-business applications in their organization to decide on the key
related implementation and business issues. Due to enormous impact on the competitive
advantage of the company, top management must consider the strategic implications of
implementing an ERP solutions keeping in mind the size of the company and the modules
installed. Management must ask several questions before embarking on project.
■ Does the ERP system strengthen the company‘s competitive position? How might it erode the
company‘s competitive position?
■ How Does ERP affect the organizational structure and the culture? What is the scope of the
ERP implementation
--- Only a few functional units or the entire organization?
■ Are there any alternatives that meet the company‘s needs better than an ERP system?
■If it is a multinational corporation , the management should be concerned about whether it
would be better to roll the system out globally or restrict it to certain regional units?
(2) Organizational Change Process
ERP implementation requires organizations to reengineer their key business processes
reengineering of the existing processes, integration of the ERP with other business information
systems, selection of right employees on the new systems.
(a) Reengineering of the existing process
Implementing an ERP system involves reengineering the existing business processes to the best
business process standard which at the end must conform to the ERP model . ERP systems are
built on best practices that are followed in the industry , though the cost and benefits of aligning
with an ERP model and customizing could be very high. The more the customization , the
greater the implementation costs.
(b)Integration of ERP with other BIS
The benefits of an ERP application are limited unless it is seamlessly integrated with other
information systems.
Some of the major concerned areas would be:
■ Integration of ERP Modules
■ Integration of E-Business Applications

4D INTERNATIONAL JOURNAL OF MANAGEMENT AND SCIENCE ISSN 2250-0669
JANUARY-JUNE 2012 http://www.4dinternationaljournal.com VOL 2 / ISSUE 1
Pag
e16
4
■Integration with Lagacy Systems
(c ) Selection of Right Employees
Companies intending to implement an ERP system must be willing to delicate some of their best
employees to the project for a successful implementation. Internal resources on the project
should exhibit the ability to understand the overall needs of the company and should play an
important role in guiding the project efforts in the right direction Companies should consider
comprehensive guidelines while selecting internal resources for the project . Lack of proper
understanding of the project needs and the inability to provide leadership and guidance to the
project by the company‘s internal resources is a major reason for the failure of ERP projects .
(d)Training Employees
Training and updating employees on ERP is a major challenge as it is extremely complex and
demanding. It is difficult for trainers or consultants to pass on the knowledge of ERP package to
the employees in a short period of time. This knowledge transfer gets hard if the employees lack
computer literacy or have computer phobia. In addition to being taught ERP technology,
employees have to be taught their new responsibilities.
3.Implementation cost and Time Implementation Cost : Even though the price of prewritten
software is cheap compared with in-house development , the total cost of implementation could
be three to five times the purchase price of the software . The implementation costs would
increase as the degree of customization increases. After training the selected employees,
strategies such as bonus programs, company perks , salary increases ,continual training and
education , and appeals to company loyalty work to retain them. Other intangible strategies such
as flexible work hours, telecommuting options, and opportunities to work with leading-edge
technologies are also being used.
Implementation Time: ERP systems come in modular fashion and do not have to be
implemented entirely at once . ERP packages are very general and need to be configured to a
specific type of business and may follow a phase-in approach with one module implemented at a
time. Some of the most commonly installed modules are sales and distribution(SD), materials
management (MM), production and planning (PP), and finance and controlling(FI) modules. The
length of implementation is affected by the number of modules being implemented , the scope of
the implementation , the extent of customization , and the number of interfaces with other
applications. The more the number of units , the longer the implementation time. Further as the

4D INTERNATIONAL JOURNAL OF MANAGEMENT AND SCIENCE ISSN 2250-0669
JANUARY-JUNE 2012 http://www.4dinternationaljournal.com VOL 2 / ISSUE 1
Pag
e16
5
scope of implementation grows from a single business unit to multiple units spread out globally ,
the duration of implementation increases .
4) Employee Morale Employees working on an ERP implementation project put in long hours
(as much as 20 hours per day) including seven-day weeks and even holidays. Even though the
experience is valuable for their career growth, the stress of implementation coupled with regular
job duties could decrease their morale rapidly.
Leadership from upper management and support and caring acts of project leaders would
certainly boost the morale of the team members . Other strategies , such as taking the employee
on field trips , could help reduce the stress improve the morale.
CONCLUSION
ERP solutions are revolutionizing the way companies produce goods and services . ERP systems
bring lot of benefits to organizations by tightly integrating various departments of the
organization.
ERP systems are very large and complex and require a careful planning and execution of their
implementation. They are not mere software ; they affect how a business conducts itself. The top
contributor for a successful ERP implementation Is strong commitment from upper management,
as an implementation involves significant alterations to existing business practice as well as an
outlay of huge capital investment.
Selecting and managing consultants pose continuous challenge due to the shortage of skilled
consultants in the market. Organizations could reduce the total cost of implementation if they
reduce customization by adapting to the ERP‗s built in best practices as much as possible
.selecting the right employees to participate in the implementation process and motivating them
is critical for the implementation success. Finally, it is important to train the employees
to use the system to ensure the proper working of the system. A well -designed and properly
integrated ERP systems allows the most updated information to be shared among various
business functions, thereby resulting in tremendous cost saving and increased efficiency.

4D INTERNATIONAL JOURNAL OF MANAGEMENT AND SCIENCE ISSN 2250-0669
JANUARY-JUNE 2012 http://www.4dinternationaljournal.com VOL 2 / ISSUE 1
Pag
e16
6
References:
[1] Scheer, A. W. and Habermann, F. ―Making ERP a success‖. Communication of ACM, 2000,
43(4), pp 57-61
[2] Finney, S. and Corbett, M. ―ERP implementation: a complication and analysis of critical
success factors‖, 2007, 13(3), pp. 329-347
[3] Soh, C., Kien, S.S, and Tay Yap, J. ―Culture fits and misfits: is ERP a universal solution?‖
Communications of the ACM, 2000,43(4) pp. 47-51
[4] Stevens, T. ―Kodak focuses on ERP‖, Industry Week, 1997, 246(15), pp. 130-133
[5] Summer M. ―Risk factors in enterprise-wide/ERP projects‖, Journal of information
Technology, 2000, 15(4) pp. 317-27
[6] Trunick, P.A. ―ERP: promise or pipe dream?‖ Transportation & Distribution, 1999, 40(1),
pp. 23-26
[7] Umble EJ, and Umble, MM. ―Avoiding (ERP) implementation failure‖, Industrial
Management, 2002, 44(1), pp. 25-33
[8] Weston, F.C. Jr. ―ERP implementation and project management‖, Production and Inventory
Management Journal, 2001, 43(3) pp.75-80
[9] Wright, S. and Wight, A.M. ―Information systems assurance for enterprises resources
planning systems: implementation and
unique risk consideration‖, Journal of Information Systems,2000, 16 Sep, pp. 99-113
[10] Fingar, P., Kumar, H. and Tarun, S. (2000). Enterprise E-Commerce: TheSoftware
Component Breakthrough for Business-to-Business Commerce. Meghan-Kiffer Press.
[11] GartnerGroup. (2000). New and Upcoming Research. Retrieved February, 2000.
(Masterfile) on world wide Web: http://www.erphub.com.
[12] Grzanka, L. (2000). ASPs and the renter‘s dilemma. Knowledge Management, May, 44-48.
[13] Hamm, S. (2000). Oracle: Why it‘s cool again? Business Week, May 8, 114-126. IBM.
(1999). Beyond ERP: Achieving Greater Return on ERP Investments. Retrieved February 2000.
(Masterfile) on World Wide Web: http:// www.ibm.com/erp/nl1.

4D INTERNATIONAL JOURNAL OF MANAGEMENT AND SCIENCE ISSN 2250-0669
JANUARY-JUNE 2012 http://www.4dinternationaljournal.com VOL 2 / ISSUE 1
Pag
e16
7
Privatization-A Study of Private Ownership
Dr. Kishor C. Meher
I.T.S of Management, Greater Noida
Daisysmita Sahoo
Senior Associate Consultant, Infosys
Abstract
Investment and disinvestment are two sides of the same coin. When we deal with the investment
management, it automatically encompasses disinvestment also, as what is investment for one is
disinvestment for another, particularly in the secondary market. If investment is an art and
science; the more so is the disinvestment process. It was in the year 1998-99, when Prime
Minister Shri Atal Bihari Vajpayee made a statement in parliament about disinvestment –
"Disinvestment / Privatization is the only panacea for ills of loss making public sector
undertakings." And soon the response from the opposition was "You can't sell the family silver
to meet your daily expenditure."
Investment refers to conversion of money or cash in to securities, debentures, bonds or any other
claims on money. Disinvestment involves the conversion of money claims or securities in to
money or cash. Privatization means selling the majority of share holding and giving management
control to a private party but divestment is selling some minority shares of the government
without transferring control. Thus, disinvestment is wider term extending from dilution of the
stake of the Govt. to a level where there is no change in the control to dilution that results in the
transfer of management. The transfer of ownership may occur when in an enterprise the dilution
of govt. ownership is beyond 51 percent. The disinvestment implies that the Govt. will sell to
public or private enterprises/ public institute‘s part of its holding in public sector enterprises.
Introduction
The Indian approach towards disinvestment seems to have gone totally wrong ever since the
reforms process was initiated in the early 90's. The country now has lost the opportunity and its
way as the pace of the entire process is very slow and lethargic in nature. While all the
politicians claim to share a common platform on this issue but find the escape route by stating –
"We agree in principle but differ in details", "Decide about strategic sale or public offer", "is it
videshi or swedeshi", so on and so forth.

4D INTERNATIONAL JOURNAL OF MANAGEMENT AND SCIENCE ISSN 2250-0669
JANUARY-JUNE 2012 http://www.4dinternationaljournal.com VOL 2 / ISSUE 1
Pag
e16
8
"While the case for economic reforms may take good note of the diagnosis that India has too
much government interference in some fields, it ignores the fact that India also has insufficient
and ineffective government activity in many other fields, including basic education, health care,
social security, land reforms and the promotion of social change. This inertia, too, contributes to
the persistence of widespread deprivation, economic stagnation and social inequity." - By Dr
Amartya Sen & Jean Dreze.
In India for almost four decades the country was pursuing a path of development in which public
sector was expected to be the engine of the growth. However, the public sector had overgrown
itself and their shortcomings started manifesting in the shape of low capacity utilization and low
efficiency due to over manning and low work ethics, over capitalization due to substantial time
and cost over runs, inability to innovate, take quick and timely decisions, large interference in
decision making process etc.
Relevance of the Study:-
Causes of Privatization:
a) Some 58 Central Government PSUs are scheduled for privatization, and each operates in a
sector where there are already successful private sector firms. The causes of privatisation has
brought several questions as follows-
Why should government spend its scarce money on goods and services already provided by the
private sector?
Why should your tax-money be taken away from you, and invested in NALCO when similar,
private companies such as Hindalco are active in the aluminum sector and pay taxes to the
Government?
Why should government-owned finance companies such as SBI Caps and UTI continue to
generate P/E ratios of 6 and 5 when their competitors in the private sector such as HDFC
generate a ratio of 30?
Why should a government-owned gas company like GAIL generate P/E ratios of 4.4 when
private sector operators such as Gujarat Gas consistently have P/E ratios of 15?
b) Our government should stop trying to compete with the private sector. Let our businessmen
and businesswomen excel at providing goods and services, and let government focus its
attentions on governing, regulating monopolies and increasing competition.

4D INTERNATIONAL JOURNAL OF MANAGEMENT AND SCIENCE ISSN 2250-0669
JANUARY-JUNE 2012 http://www.4dinternationaljournal.com VOL 2 / ISSUE 1
Pag
e16
9
Very few PSE objectives not be provided better and cheaper by the private sector. Finally there
are only a few cases of natural monopolies, such as the provision of piped water. There
government can still create elements of competition, such as parallel competition where the track
record of one regional private provider is compared to another in a neighboring region. But in
cases of natural monopolies there is always a need for a strong government regulatory body.
From the study of the privatization programme and the rationale behind it, the following points
are emerged from the study-
1. Private ownership leads to better use of resources and their more efficient allocation.
Throughout the world, the preference for market economy received a boost after it was realised
that the State could no longer meet the growing demands of the economy and the State
shareholding inevitably had to come down. The ‗State in business‘ argument thus lost out and so
did the presumption that direct and comprehensive control over the economic life of citizens
from the Central government can deliver results better than those of a more liberal system that
directly responds according to the market driven forces.
2. Another reason for adoption of privatization policy around the globe has been the inability of
the Governments to raise high taxes, pursue deficit / inflationary financing and the development
of money markets and private entrepreneurship.
3. Further, technology and WTO commitments have made the world a global village and unless
industries, including PSEs do not quickly restructure, they would not be able to survive. Public
enterprises, because of the nature of their ownership, can restructure slowly and hence the logic
of privatization gets stronger. Besides, techniques are now available to control public monopolies
like Power and Telecom, where consumer interests can be better protected by regulation /
competition, and investment of public money to ensure protection of consumer interests is no
longer a convincing argument
4. The objectives of the disinvestment programme vary from improving efficiency of the Public
Sector Enterprises to transformation of the society for making Indian economy more vibrant,
healthy and adequately equipped to contest in global arena.
5. The primary objectives for privatising the PSEs are as follows:
Necessity for the Government to move away from controlling, managing and running "non-
strategic enterprises"

4D INTERNATIONAL JOURNAL OF MANAGEMENT AND SCIENCE ISSN 2250-0669
JANUARY-JUNE 2012 http://www.4dinternationaljournal.com VOL 2 / ISSUE 1
Pag
e17
0
Releasing the large amount of public resources locked up in non-strategic PSEs, for
redeployment in areas that are much higher on social priority, such as, public health, family
welfare, primary education and social and essential infrastructure; Stemming further outflow of
these scarce public resources for sustaining the unviable non-strategic PSEs. reducing the public
debt that is threatening to assume unmanageable proportions, Transferring the commercial risk,
to which the tax-payer‘s money locked up in the public sector is exposed, to the private sector
wherever the private sector is willing and able to step in – the money that is deployed in the
PSEs is really the public money; and, is exposed to an entirely avoidable and needless risk, in
most cases.
6. The other benefits expected to be derived from privatization are: -Disinvestment would
expose the privatized companies to market discipline, thereby forcing them to become more
efficient and survive or cease on their own financial and economic strength. They would be able
to respond to the market forces much faster and cater to their business needs in a more
professional manner. It would also facilitate in freeing the PSEs from the Government control
and introduction of corporate governance in the privatized companies. Disinvestment would
result in wider distribution of wealth through offering of shares of privatized companies to small
investors and employees. Disinvestment would have a beneficial effect on the capital market;
the increase in floating stock would give the market more depth and liquidity, give investors
easier exit options, help in establishing more accurate benchmarks for valuation and pricing, and
facilitate raising of funds by the privatized companies for their projects of expansion, in future.
Opening up the erstwhile public sectors to appropriate private investors would increase economic
activity and have an overall beneficial effect on the economy, employment and tax revenues in
the medium to long term. In many areas, e.g., the telecom sector and petroleum sectors the end of
public sector monopoly would bring relief to consumers by way of more choices, and cheaper
and better quality of products and services as has already started happening.
Objectives of the Study:
To study the impact of privatization on financial performance of the privatized CPSU in case of
strategic sale before and after disinvestments.

4D INTERNATIONAL JOURNAL OF MANAGEMENT AND SCIENCE ISSN 2250-0669
JANUARY-JUNE 2012 http://www.4dinternationaljournal.com VOL 2 / ISSUE 1
Pag
e17
1
Null Hypothesis: There is no significant impact of financial performance between the period
before disinvestment and thereafter in case of strategic sale involving transfer of management
control in the hands of private entrepreneurs.
Data Sources & Methodologies
Area of Study: The study covers the offloading Govt‘s stake of public sector undertakings to the
private entrepreneurs by way of transferring control of management through strategic sale route.
Period of Study: The study covers a period of disinvestment from the initiation of privatization
programme from 1991-92 to 2005-06 .However, the financial data of specific companies have
been taken based upon availability of data from F.Y. 1996-07 to F.Y. 2007-08 specifically six
financial years before and six years after the disinvestment of the company.
Data Sources- The data for the purpose of research have been collected from the secondary
sources as follows-
Annual Report of companies of Paradeep Phosphates Ltd from F.Y. 1996-97 to 2007-08
Media Publication of Times of India and Economic Times
Journals of Economic & Political weekly
Books: Disinvestment in India, Pradeep baijal,Privatisation in India ,Mishra R K
Privatisation of Public sector undertaking,Jesiah Selvam,Disinvestment in India, Sudhir Naib
Internet: www.divest.nic.in
Government of India Publications
Sample Design: A sample is representing the population; the following samples have been taken
to test the objectives of research as follows-
Samples of financial data from Paradeep Phosphates Ltd from F.Y. 1996-97 to F.Y. 20007-08.
Methodology- (Case Study Analysis)
In case of strategic sale involving control of ownership the loss making public sector can be
taken as a Case Study. A case of Paradeep Phosphates Ltd has been taken to evaluate the impact
of financial performance of the disinvestment programme before and after the disinvestment.
Tools of Analysis - Accounting tools & Computer assisted statistical tools by SPSS10 have been
used for analysis and interpretation of data which have been mentioned as follows-
a) Accounting Tools: The financial analysis of Paradeep Phosphates Ltd covers the following
tools of analysis:- Ratio Analysis, ii)Trend Analysis v)Leverage Analysis.

4D INTERNATIONAL JOURNAL OF MANAGEMENT AND SCIENCE ISSN 2250-0669
JANUARY-JUNE 2012 http://www.4dinternationaljournal.com VOL 2 / ISSUE 1
Pag
e17
2
b) Statistical Tools: The following statistical tools have been used by using the SPSS 10.0
version, 1)t Test,
Literature Review:
The literature pertaining to this research is reviewed under different headings which contains the
related literature--analytical, theoretical and empirical--on the particular issue. The literature that
has been collected focuses more on various issues in privatizing the PSUs to private sector. The
issues are nothing but the processing, political, economic, socio-labour, managerial has widely
been tapped, through this chapter, for a comprehensive understanding of the research problem.
As this part normally seeks, the literature from different sources conducted at International level,
Regional (Continental) and National level which are either published or unpublished are
furnished in the following headings:
Literature related to Processing Issues
Literature related to Political and Economic Issues
Literature related to Social Labour Issues, and
Literature related to Managerial Issues.
From the review of literature, it is observed that there are a lot of studies conducted on different
issues of privatization. However these studies have contracted largely on; narrow and specific
issues; and finally, these studies have amply been done in the industrialized and higher income
developing countries which leave the world a dearth of study on privatization in case of strategic
sale particularly loss making PSU in a developing country like India. Moreover, it is from the
researcher‘s point of view, there is no study so far conducted empirically on the financial
performance of PSU marked for strategic sale in general and loss making PSU in particular. How
the private ownership does changes the financial performance of a loss making privatized PSU in
to a profitable one. Hence, this study is done to fill up this gap. Further, the valuation of divested
PSU has been criticized from many corners which need to be evaluated in the light of laid out
guideline on valuation. The procedure adopted for divesting the PSU involving more than 51
percent share to the private entrepreneurs beg attention to ascertain any remarkable deviation
from standard practice set by the disinvestment commission.

4D INTERNATIONAL JOURNAL OF MANAGEMENT AND SCIENCE ISSN 2250-0669
JANUARY-JUNE 2012 http://www.4dinternationaljournal.com VOL 2 / ISSUE 1
Pag
e17
3
Financial Analysis of Paradeep Phosphates Ltd:
The privatization programme has gained momentum right after adoption of strategic sale by
Govt. of India and out of which m/s Paradeep Phosphates Ltd is one case where there is 74 per
cent stake sold to m/s Juary morocco Pvt Ltd.
Financial background of PPL:
Right from its incorporation in 1981, the company had a very poor financial health, suffering
losses almost continuously. These had arisen mainly because of delays in Project
implementation, very low capacity utilization of plants and excess work force. It has not paid
interest or principle amount to the government on loan since inception.By1992-1993 PPL's net
worth was almost wiped out and it was on the verge of being declared sick. Even after an
Rs.318.78 crore financial restructuring in 1993-1994, PPLs performance continued to deteriorate
with accumulated losses reaching Rs314.43 crores by 31 march 1999.
Another restructuring in 1999-2000 enabled the company to record a book profit of Rs. 23.96
crore and reduce carry forward losses to Rs. 290.47 crore. A third financial restructuring took
place just before disinvestment to bring down the accumulated losses to Rs.431.50 crore, to
make the net worth positive to just Rs.1.15crore as on 31 March 2001. Thus, there have been
three financial restructuring till date amounting to Rs. 533.42 crore to revive the company.
However, the company‘s performance continued to deteriorate and prior to privatization the
company was incurring a monthly loss of Rs. 20 crore. The post-closure adjustment claim
suggests that this loss was nearly the double the initial estimate of Rs. 12 crore. Gradually,
problems got compounded resulting in its inability to procedure raw materials on timely basis,
which further reduced the capacity utilization of the plants. Despite all restructurings, PPL had
accumulated a loss of Rs. 649.93 crore as on 28 February 2002, the day of disinvestment, with a
negative net worth of Rs. 217.28 crore.
Privatization of PPL- A Case Study (from F.Y. 1996-97 to 2007-08):
The trend analysis as a tool of financial analysis is to the Paradeep Phosphates Ltd from 1996-97
to 2007-08 as follows:-
The above tool of financial analysis has been taken to analyze the company PPL as a case study
mode to find out the impact of disinvestment involving transfer and control of management
where six year financial data have taken before as well as after disinvestment and the following
analysis and interpretation have come out from the study.

4D INTERNATIONAL JOURNAL OF MANAGEMENT AND SCIENCE ISSN 2250-0669
JANUARY-JUNE 2012 http://www.4dinternationaljournal.com VOL 2 / ISSUE 1
Pag
e17
4
Profit and Loss Analysis:
It is made keeping the base year as 1996-97 before disinvestment and 2002-03 after
disinvestment. The two indexes pre and post are compared with the different parameters as
follows-
Table No-1
TREND
ANALYSIS
PROFIT &
LOSS A/C (Rs
000)
BEFORE DISINVESTMENT AFTER DISINVESTMENT
FINANCIAL
YEAR
199
6-
97
199
7-
98
199
8-
99
199
9-
00
200
0-
01
200
1-
02
200
2-
03
200
3-
04
200
4-
05
200
5-
06
200
6-
07
200
7-
08
SALES 100 146 113 100 83 100 100 231 327 376 375 378
Subsidy from goi 100 170 186 164 118 116 100 283 664 930 103
3
149
0
TOTAL
INCOME
100 215 175 187 111 113 100 242 319 439 445 545
Purchases of
traded goods
100 231 175 174 111 112 100 210 748 160
7
120
2
854
Manufacturing
and other
expenses
100 165 154 144 159 229 100 233 291 383 374 431
TOTAL EXP 100 210 165 163 119 136 100 231 301 411 394 440
PBIT -
100
-
135
5 238 -
253
-
525
-
100
23 122 258 817 204
5
PBDIT -
100
-
200
199 869 -
533
-
121
5
-
100
385 648 998 256
5
579
6
PBT -
100
-
174
-96 40 -
247
-
417
-
100
-97 -38 32 285 845
PAT -
100
-
298
-
164
68 -
398
-
732
-
100
-
118
-39 31 289 858
Source- Profit &loss A/C of Paradeep Posphates Ltd

4D INTERNATIONAL JOURNAL OF MANAGEMENT AND SCIENCE ISSN 2250-0669
JANUARY-JUNE 2012 http://www.4dinternationaljournal.com VOL 2 / ISSUE 1
Pag
e17
5
FIGURE NO-1
TREND ANALYSIS OF PPL
0
500
1000
1500
2000
2500
3000
1996
-97
1997
-98
1998
-99
1999
-00
2000
-01
2001
-02
2002
-03
2003
-04
2004
-05
2005
-06
2006
-07
2007
-08
BEFORE DISINVESTMENT AFTER DISINVESTMENT
FINANCIAL YEAR
IND
EX TOTAL INCOME(A)
Subsidy from goi
SALES
From the study of graph as above the total income, subsidy from GOI and sales line show a
decreasing trend before disinvestment. These show an increasing trend after disinvestment due to
more subsidy received from GOI and more sale volumes.
FIGURE NO-2
TREND OF EXPENDITURE ANALYSIS OF PPL
0
500
1000
1500
2000
2500
3000
1996
-97
1997
-98
1998
-99
1999
-00
2000
-01
2001
-02
2002
-03
2003
-04
2004
-05
2005
-06
2006
-07
2007
-08
BEFORE DISINVESTMENT AFTER DISINVESTMENT
FINANCIAL YEAR
IND
EX
TOTAL EXP
Manufacturing and other
expenses
Purchases of traded goods
The total expenditures, manufacturing and other expenses and purchases of traded goods
line show decreasing trend before disinvestment where as these show an increasing trend till
2005-06 and thereafter show decreasing trend compared to base year index.

4D INTERNATIONAL JOURNAL OF MANAGEMENT AND SCIENCE ISSN 2250-0669
JANUARY-JUNE 2012 http://www.4dinternationaljournal.com VOL 2 / ISSUE 1
Pag
e17
6
FIGURE NO-3
TREND ANALYSIS OF PPL
-1000
-500
0
500
1000
1500
2000
2500
1996
-97
1997
-98
1998
-99
1999
-00
2000
-01
2001
-02
2002
-03
2003
-04
2004
-05
2005
-06
2006
-07
2007
-08
BEFORE DISINVESTMENT AFTER DISINVESTMENT
FINANCIAL YEAR
TR
EN
D(%
)
TOTAL INCOME
TOTAL EXP
PBIT
The total income and total expenditures line show decreasing trend where as the PBIT (profit
before interest & tax) line is showing loss before disinvestment where as the PBIT line shows an
increasing trend after disinvestment indicating profit to the organization.
FIGURE NO-4
SOURCES OF FUND OF PPL
0
50
100
150
200
250
1996
-97
1997
-98
1998
-99
1999
-200
0
2000
-200
1
2001
-200
2
2002
-200
3
2003
-200
4
2004
-200
5
2005
-06
2006
-07
2007
-08
BEFORE DISINVESTMENT AFTER DISINVESTMENT
FINANCIAL YEAR
TR
EN
D (
%) Share capital
Secured Loan
Unsecured loans
Total Loan Funds
The share capital line shows increasing trend from 2001-02 to 2002-03 thereafter declines which
indicates fresh induction of equity capital to the business. The secured loan line shows an upward
trend till 2000-01 and thereafter declines up to 2004-05 .Then it shows an upward trend up to
2006-07 and thereafter declines drastically which indicates paying of off secured loan after
disinvestment. The unsecured loan line shows upward trend up to 2001-02 and then it becomes

4D INTERNATIONAL JOURNAL OF MANAGEMENT AND SCIENCE ISSN 2250-0669
JANUARY-JUNE 2012 http://www.4dinternationaljournal.com VOL 2 / ISSUE 1
Pag
e17
7
upward till 2008 .This indicates more unsecured loan was inducted in the business. Thus, the
debt equity combination has been reshuffled to maximize the return to the shareholders.
3.4 Balance Sheet Analysis:
TABLE NO-2
BALANCE
SHEET BEFORE DISINVESTMENT AFTER DISINVESTMENT
199
6-
97
199
7-
98
199
8-
99
199
9-
00
200
0-
01
200
1-
02
200
2-
03
200
3-
04
200
4-
05
200
5-
06
200
6-
07
200
7-
08
Share capital 100 100 102 103 130 141 100 123 123 123 123 123
Secured loans 100 110 120 120 135 92 100 99 72 233 140 29
Unsecured loans 100 121 137 108 91 221 100 91 96 100 117 116
Loan Funds 100 118 133 111 103 187 100 92 93 117 120 105
Gross block 100 101 101 103 103 105 100 101 106 115 115 118
Capital work-in-
progress 100 161 173 115 137 62 100 331 387 46 71 171
Inventories 100 104 121 138 109 84 100 126 87 105 91 68
Sundry debtors 100 130 124 120 99 138 100 58 169 271 288 238
Cash in bank
balances 100 233 127 161 348 279 100 68 80 88 258
130
3
Less: Current
liabilities &
Provisions 100 127 133 154 137 107 100 89 129 160 126 189
Net current Assets 100 83 95 75 38 99 100 110 102 189 267 257
P/L A/C Dr Bal
C/B 100 109 118 107 116 165 100 104 105 119 121 112
Source- Balance sheet of Paradeep Phosphates Ltd.

4D INTERNATIONAL JOURNAL OF MANAGEMENT AND SCIENCE ISSN 2250-0669
JANUARY-JUNE 2012 http://www.4dinternationaljournal.com VOL 2 / ISSUE 1
Pag
e17
8
FIGURE NO-5
TREND ANALYSIS OF PPL
050
100150200250300350400450
1996
-97
1997
-98
1998
-99
1999
-00
2000
-01
2001
-02
2002
-03
2003
-04
2004
-05
2005
-06
2006
-07
2007
-08
BEFORE DISINVESTMENT AFTER DISINVESTMENT
FINANCIAL YEAR
TR
EN
D(%
) Gross block
capital work-in-progress
Net current assets(b)
P/L A/C Dr Bal O/B
The gross block line shows a straight line till the year of disinvestment and slopes little upward
after disinvestment .This indicates that there is no addition of fixed assets to the gross block .The
capital work-in-progress line shows declining trend before disinvestment and thereafter from
1002-03 shows upward indicating more investment in capital assets under construction .This line
shows a declining trend after disinvestment immediately and further shows upward trend from
2005-06 onwards. Thus there is more investment in income generating capital assets after
disinvestment to increase the capacity. The net current assets (working capital) shows a
downward trend before disinvestment and from 2004-05 onwards shows an increasing trend.
This indicates the company has invested more in working capital after disinvestment to enhance
productivity. The debit balance of profit and loss account line shows an upward trend which
indicates that the company has incurred heavy loss before disinvestment .But the line shows an
downward trend indicating decrease of loss after disinvestment and from 2005-06 onwards, the
line shows further downward trend indicating decrease of loss .
STATISTICAL ANALYSIS
The financial analysis of Paradeep Phosphates Ltd has shown that there is improvement in
financial performance between the before and after the disinvestment by using the different tools
of financial analysis.

4D INTERNATIONAL JOURNAL OF MANAGEMENT AND SCIENCE ISSN 2250-0669
JANUARY-JUNE 2012 http://www.4dinternationaljournal.com VOL 2 / ISSUE 1
Pag
e17
9
However, in order to verify statistically whether there is really a significant improvement in
financial performance of the loss making privatised PSU PPL, T test has been applied by
comparing the difference between the mean before and after the disinvestment.
Further, strategic sale was adopted in16 companies as a method to divest the PSUs with more
than 51% transfer of share to the private entrepreneurs with transfer of management control. In
order to eliminate bias of taking one loss making PSU PPL for studying the significance of mean
difference between the pre and post divestment, 7 different companies were also taken for the
study.
Application of T test to test the hypothesis
The data for the T test has been taken from the audited financial statement of PPL six year prior
to the year of disinvestment ( FY. 1996-97 to FY. 2001-2002) and six years after the year of
disinvestment( FY. 2002-03 to FY. 2007-08).
Further, in order to make the data more meaningful, ratio analysis data has been taken keeping in
view the short term and long term financial position of the company during the above period.
The following ratios have been used for the analysis:
Current Ratio,ii) Quick Ratio, iii) PBDIT/Total Income,iv) PBIT/Total Income, v) PBT/Total
Income ,vi) PAT/Total Income, vii) Debt/Equity Ratio.
Computation of t-Test :
The mean of ratios mentioned as above for individual company from 1996-97 to 2001-2002 has
been calculated, as first sample (pre-divestment). The mean of ratios of the same company from
2002-03 to 2007-08 has been calculated, as our second sample(post-divestment) and the mean of
the above companies before and after disinvestment has been given as input to SPSS for analysis
by paired t-test and the following results in terms of level of significance have come out by SPSS
.

4D INTERNATIONAL JOURNAL OF MANAGEMENT AND SCIENCE ISSN 2250-0669
JANUARY-JUNE 2012 http://www.4dinternationaljournal.com VOL 2 / ISSUE 1
Pag
e18
0
TABLE NO-3
Level of Significance of PPL and Group of Companies
Sl
No
Ratios PPL
1 PBDIT/TOTAL
INCOME
0.130
2 PBIT/TOTAL INCOME 0.125
3 PAT/TOTAL INCOME 0.116
4 CURRENT RATIO 0.016*
5 QUICK RATIO 0.043*
6 DEBT/EQUITY RATIO 0.015*
* At 5% level of significance
Analysis & Interpretation:
The result of t test shows that the quick ratio, current ratio and the debt equity ratio are showing
significant difference (between the two means, of pre and post-divestment).i.e., at a level of 5
percent, which indicates that the short term and long term financial position have been
significantly improved after the disinvestment by proper debt equity mix of finances. Further, the
result from the ratios like PBDIT/Total income, PBIT/Total income and PAT/total income are
showing the level of significance beyond the 5 percent. Thus, there is no significant
improvement in the operational efficiency of the company after disinvestment.
Conclusion & way forward:
The strategic sale of PSU involving transfer of ownership and control has resulted in to gain in
financial performance of Paradeep Phosphates Ltd .But the gain in financial performance cannot
be solely attributed to the ownership and control. The deregulation of economy plays an
important role which also contributes to the profitability of the privatized companies. Further, the
statistical result of seven companies involving strategic sale shows that there is no significant
improvement in the financial performance of the divested companies after privatisation as
compared to the before.
Further, the sick and loss making privatized companies will take some time to recover from
sickness and only after that those will start earning profit.

4D INTERNATIONAL JOURNAL OF MANAGEMENT AND SCIENCE ISSN 2250-0669
JANUARY-JUNE 2012 http://www.4dinternationaljournal.com VOL 2 / ISSUE 1
Pag
e18
1
Further, from the experience of strategic sale the GOI has started issuing initial public offering of
PSU stock to the public which has taken momentum to the Indian public. The sale of initial
public offer (IPO) like NTPC, NHPC has given warm response. The follow on public offer
(FPO) of NTPC will be issued very soon. In this backdrop, the GOI has received lot of cash than
that from strategic sale and the divestment will be to the public of India which cannot be termed
as privatization. The tax payers will continue to be accountable for the shares they hold. Thus,
the price earnings ratios of the companies whose shares are already issued have already shown
high growth. This will lead a further scope for research in the field of public stock mobilization
in the capital market.
REFERENCES:
Ahmed, M.U. (2000), ―Privatisation in Bangladesh‖ in Gopal Joshi (ed.) Privatisation in South
Asia: Minimising Negative Social Effects through Restructing. New Delhi: ILO. pp.24-39.
Barnett S (2000), ―Evidence on the fiscal and Macroeconomic Impact of Privatisation.‖ IMF
working paper,july,Washing ton, DC:IMF.
Baumol, W.J. and Blinder, A.S. (1997) Macro Economics: Principals and Policy. Florida:
Dryden Press, p. 484.
Bennet, T. and Johnson, M.H. (1979), ―Public Vs private Provision of Collective Goods and
Services: Garbage Collection Revitalized‖, Public Choice, No. 34, pp. 55-64.
Boardman and Viking (1989), ―Ownership in Competitive Environments: A comparison of the
Performance of Mixed, Private and SOEs‖, Journal of Law and Economics, April, No. 32, pp. 1-
36
Bolnick, B.R. (1987), Economics of Development: Study Guide and Work Book. New York:
W.W. Norton & Co., pp. 122-8.
Bothelho, A. and Addis, C. (1998), ―Privatisation and Telecommunication in Mexico‖ in Rolph
Vander Hoeven and Gyorgy Sziraczki (eds) Lessons from Privatisation: Labour Issues in
Developing and Transitional Countries. Geneva: ILO, pp. 71-90.
Buckley, J. W. (1976) Research Methodology and Business Decisions. New York: National
Association of Accounts. p. 37.
Caves, D. W. and Christensen, L. (1980), ―The Relative Efficiency of Public and Private Films
in a Competitive Environment: The Case of Canadian Railroads‖, Journal of Public Economy,
No. 88, pp. 95-6.

4D INTERNATIONAL JOURNAL OF MANAGEMENT AND SCIENCE ISSN 2250-0669
JANUARY-JUNE 2012 http://www.4dinternationaljournal.com VOL 2 / ISSUE 1
Pag
e18
2
Chandrasekhar, C. P. (2003), ―Economic Perspectives: Privatisation on Hold‖, Frontline,
October, Vol.20, No 20, pp. 102-3.
Cook, P. and Uchida, Y. (2003), ―Privatisation and Economic Growth in Developing Countries‖,
The Journal of Development Studies, Vol. 39, No. 9, pp. 121-54.
Donaldson, D. and Wagle, D. M. (1995) Privatisations Principle and Practices: IFC Lessons of
Experience Series No. 15007‖, September, Washington: IFC, pp. 3-22.
Eardley, R. F. (1999) Privatizing Bus Transport in Sri Lanka‖ in Prokopenko, J. (ed)
Management for privatisation. Geneva: ILO =, pp. 233-51.
Earle, J. S. (1999), ―Privatisation in Russia Offers Lessons for Others‖, Economic Reform Today
- CIPE (Privatisation in a Digital Age),‘ NO. 2, pp. 12-9
Ekelund and Tollison (1997), Micro Economics: Private Markets and Public Choices. New York:
Addison – Wesley Publishing Company, Ins., p. 118.
Ernest ten Heuvelhof and Helen Stout (2000), ―Sustainable Utilities: New Opportunities for
Sustainability through Liberalization and Privatisation‖, UNEP Industry and Environment, Vol.
23, No. 1-2, p. 60.
Fundanga, C. M. and Mwaba, A. (1997), ―Privatisation of Public Enterprises in Zambia: An
Evaluation of the Policies, Procedures and Experiences‖, Economic Research Papers No. 35
African Development Bank, pp. 15-7.
Gibbon, H. (1996) ―A Guide for Disinvesting Government Owned Enterprises‖, How to Guide,
No. 15. July, p. 1.
Hill, C. W. L. (1998), Global Business Today. Washington: Irwin/McGraw – Hill, pp. 38 – 9.
Hinds, B. (1999), ―Opportunities and Constraints of Privatisation‖ in Gormley, W. T. (ed.)
Privatisation and its Alternatives. Oxford: Oxford University Press, pp. 281 – 306.
Hyman, D. N. (1997), Macro Economics. Boston: The Mc Graw – Hill Company, Inc. p. 281 –
306.
ILO (1999), ―Report of the Sub – Regional workshop on Privatisation South Asia‖, 24 -26
November, Kathmandu, ILO, pp. 211 – 18.
Kidane, T. (1996), ―Challenges and Prospects of the Privatisation Process of the Public
Enterprises in Eritrea‖, A Paper Submitted for the Partial Fulfillment of the Degree, March,
University of Asmara, Asmara, p. 58.

4D INTERNATIONAL JOURNAL OF MANAGEMENT AND SCIENCE ISSN 2250-0669
JANUARY-JUNE 2012 http://www.4dinternationaljournal.com VOL 2 / ISSUE 1
Pag
e18
3
Külh, Jűrgen (1998), ―Privatisation and its Labour Market effects in Eastern Germany‖ in Rolph
Vander Hoeven and Gyorgy Sziraczki (eds), pp. 119-42.
Leon Louw (1999), ―What Would Make Privatisation Work in South Africa‖, Economic Reform
Today-CIPE [Privatisation in the Digital Age], No. 2, pp. 145-55.
Megginson, W. L. and Neller, J. M. (2001), ―From state to Market: A survey of Empirical
Studies on Privatisation‖, Journal of Economic Literature, November, Vol. 39, pp. 321-389.
Miller, R. Le Roy (1997), Economic Today: A Micro View. Boston: Addison – Westerly
Educational publisher, pp. 122-3.
Miller, R. Le Roy (1998), Economic Today. New York: Addison – Westerly Educational
Publisher, pp. 124-5.
Mishra, R. K., Nandagopal and Lateef Syed, A. (1993), ―sale of Public Enterprise Shares:
Frittering Away Nation‘s Wealth‖, Economic and Political Weekly, Vol. 28, No. 48, pp. 163-8.
Mkandawire, T. and Soludo, C. C. (2003), ―Towards the Broadening of Development Policy
Dialogue of Africa‖ in Mkandawire and Soludo (eds) African Voices on Structural Adjustment.
New Jersey: African World Press, pp. 2-5
Muegerwa-Kayizzi (2002)
Novak, M. (1991), ―Transforming the Democratic Capitalistic Revolution‖, International Journal
of Value Based Management, Vol. 4, No. 2, p. 22.
Oumar Makalou (1999), ―Privatisation in Africa: A Critical Analysis‖, A paper presented on the
9th International Anti – Corruption Conference [IACC], 10-15 October 1999, Durban, South
Africa, p. 10.
Jesiah Selvam(2007), Privatisation of public sector enterprises, experimentation abroad, Serials
publications, New delhi.
Padmanapan, B. S. (2003), ―Towards Total Solutions‖ in Focus: MTNL – DELHI, Frontline,
July, Vol. 20, No. 14, pp. 19-94.
Parker, D. and Kirkpatrick, C. (2003), ―Privatisation in Developing Countries: A review of the
Evidence and the Policy Lessons‖ Working Paper Series 55, Manchester: Institute of
Development Policy and Management, pp. 20-32.

4D INTERNATIONAL JOURNAL OF MANAGEMENT AND SCIENCE ISSN 2250-0669
JANUARY-JUNE 2012 http://www.4dinternationaljournal.com VOL 2 / ISSUE 1
Pag
e18
4
Can Financial Crisis affect CSR?
Mr. Ankur Agrawal
(Asst .Professor, Sharda University, Greater Noida)
Mr. Mridul Dharwal
(Asst. Professor, Sharda University, Greater Noida)
Abstract
There is nothing trivial about this financial crisis. According to the recent Financial Stability
Report, governments worldwide have already pledged more than $10 trillion in loans,
guarantees, capital injections, and other assistance in their coordinated effort to prop up the
global financial system. And the ILO estimates the crisis will cost 20 million jobs by next year.
Introduction to current financial crisis
This is not the first financial crisis the world has seen over the past century. The worst, of course,
resulted in the Great Depression in the 1930s. But there have been numerous others, all of which
carried painful economic and human costs. For example, the crises in Argentina (1981-1990),
South Korea (1997-1999) and Thailand (1997-2000) all cost more than 30% of those countries‘
GDPs.
But even by historical standards, the current financial crisis is BIG. In what‘s been dubbed .The
ILO estimates that the crisis will bring the total unemployed to more than 210 million for the
first time in history.
The key difference is that, unlike the Asian and Latin American crises in the 1980s, this crisis is
truly global. Some countries, like Iceland and Pakistan, are threatened by bankruptcy. Others,
like Japan, have been hit by huge volatility in the markets. And even the cash-rich, high-flyers
like China are seeing their growth suffering as a result. But what does any of this have to do with
corporate social responsibility (CSR)?
The links to CSR
The following can be some of reasons which can link CSR with financial crisis
Irresponsible banking

4D INTERNATIONAL JOURNAL OF MANAGEMENT AND SCIENCE ISSN 2250-0669
JANUARY-JUNE 2012 http://www.4dinternationaljournal.com VOL 2 / ISSUE 1
Pag
e18
5
First and most obvious reason, we can say the financial crisis is a direct result of irresponsible
banking. According to the Mortgage Bankers Association, the number of sub-prime loans offered
to risky borrowers increased more than 15 times since 1998. Essentially, the banks got greedy
and compromised good banking practices of credit risk assessment. Due to these banking
practices S&P, and moodies had decreased the financial rating of banks all over Europe.
Irresponsible financial markets
Another reason of the crisis is consequence of irresponsible financial markets. Derivatives
market has grown to around $600 trillion dollars, almost 10 times the value of global GDP. This
speculative trading (which some call the "casino economy") is meant to hedge risk, but it also
increases the volatility and systemic risk of financial markets.
We would do well to recall economist John Maynard Keynes‘ warning: ―Speculators may do no
harm as bubbles on a steady stream of enterprise. But the position is serious when enterprise
becomes the bubble on a whirlpool of speculation. When the capital development of a country
becomes a by-product of the activities of a casino, the job is likely to be ill-done.‖ The stock
market of the entire globe is not performing well in the entire globe.
Irresponsible corporations
Another reason of the crisis is the inevitable consequence of irresponsible corporations. This is
linked to the short-termism of shareholder value driven public companies i.e , every company
and investor is interested only in short term profits no body is bothered about wealth
maximization. At the extreme, authors like Joel Bakan suggest that corporations have ―a legally
defined mandate to relentlessly pursue—without exception—its own self-interest regardless of
the often harmful consequences it might cause to others.‖ This behaviour in humans, he notes,
would be characterized as pathological.
Irresponsible executives
The financial crisis has been further inflamed, some claim, by irresponsible executives, as
evidenced by their outrageous pay packages. In 2007, the CEO of a Standard & Poor‘s 500
company received, on average, $14.2 million in total compensation, according to The Corporate
Library.
―Many critics of investment banks,‖ reports The Guardian, ―have questioned why firms continue
to siphon off billions of dollars of bank earnings into bonus pools rather than using the funds to
shore up the capital position of the crisis-stricken institutions.‖
Irresponsible capitalism

4D INTERNATIONAL JOURNAL OF MANAGEMENT AND SCIENCE ISSN 2250-0669
JANUARY-JUNE 2012 http://www.4dinternationaljournal.com VOL 2 / ISSUE 1
Pag
e18
6
Some would even go so far as to say that the current financial crisis represents a systemic failure
of shareholder-driven, free market capitalism.
It‘s absolutely clear that financial markets need discipline: macroeconomic discipline, monetary
discipline, market discipline.‖ British Prime Minister and French President agree, stating that the
turmoil has shown the world's post-Second World War financial architecture is not fit for the
task of controlling today‘s global financial system.
The impacts on CSR
Irrespective of its causes, it is likely that the financial crisis will have a substantial impact on
CSR. The question is, how will this impact play out? Who will win and who will lose?
According to a poll run on the CSR International blog during October, 44% of CSR professionals
believe that CSR will increase as a result of the crisis. A further 26% believe it will change,
while 22% think it will weaken. This is a slightly surprising result and perhaps masks a more
complex answer. In my opinion, the impact on CSR will vary depending on the type of CSR
being practiced.
Philanthropic CSR will be worst hit
I have little doubt that those who have adopted an immature version of CSR, in which CSR is
primarily about philanthropy (sponsorship, donations, charity and employee volunteering), will
suffer substantial cut backs during the coming recession. Irrespective of the fact that those most
in need of charity will be worst hit by the crisis, companies around the world will be forced into
cost-cutting and philanthropy budgets will be among the first to be trimmed.
Strategic CSR will be less affected
It is likely that concept of strategic CSR will pay dividends for its followers in the aftermath of
the financial crisis. It simply means‖ the more closely tied a social issue is to a company‘s
business, the greater the opportunity to leverage the firm‘s resources—and benefit society.‖
Hence, companies that have aligned their philanthropic and broader CSR efforts with their core
business are more likely to protect these initiatives, even during the recession.
For example, the commitment Coca-Cola has made to become a water neutral company is so
closely tied to its core business (which is, after all, mostly about selling huge volumes of sugar
water), that they cannot afford to abandon this as a superfluous CSR programme. They know that
if they are not perceived to be responsibly managing the scarce water resources of the
communities in which they operate, their business will ultimately fail (as they have already
found to their detriment in India).
Embedded CSR will be largely unaffected

4D INTERNATIONAL JOURNAL OF MANAGEMENT AND SCIENCE ISSN 2250-0669
JANUARY-JUNE 2012 http://www.4dinternationaljournal.com VOL 2 / ISSUE 1
Pag
e18
7
CSR can only be resilient if it is part of the DNA of an organisation. In other words, CSR will
only survive the vagaries of fickle markets, fluctuating profits, financial crises and leadership
whims if it is totally embedded in the corporate culture, strategy and governance systems. The
impending recession will be the ultimate DNA-test for companies. A year from now, we will
have a much better idea of who has driven CSR deep into the heart of their business and who has
simply been wearing it as a mask.
CSR 2.0 will continue to strengthen
For those companies that are alive to the opportunities of the CSR 2.0 revolution, even the
recession will present large opportunities for business growth and financial profits. This is
because CSR 2.0 is all about the creation of scalable solutions to the world‘s most urgent and
intractable problems, such as water stress and climate change. Unlike the defensive, incremental,
risk-based CSR of the past (CSR 1.0), CSR 2.0 rides the wave of emerging responsible and
sustainable markets.
For example, the demand for renewable energy and low-carbon technologies now far exceeds the
supply. And given the escalating costs of climate change, the high oil price and ambitious
political targets (of up to an 80% reduction in greenhouse gas emissions by 2050), companies
that have strategically positioned themselves as clean technology solutions providers will
continue to benefit from this $284 billion market, which is expected to grow to over $1.3 trillion
by 2017.
Conclusion
Hence, the answer to the question, ―What is the relationship between the financial crisis and
CSR?‖ is that it depends. It depends on your beliefs about how deep the irresponsibility behind
the economic meltdown runs – is it banks simply overextending themselves, or a far more
systemic failure in the corporate, financial and capitalist models?
Similarly, the answer to ―How will CSR be affected by the financial crisis?‖ depends on how
deep CSR runs within the organisation – is it superficial philanthropic CSR, something more
strategic or embedded, or even the more revolutionary CSR 2.0 version? Either way, the
recession ahead will not only be an acid test for companies‘ CSR commitment, but for CSR
itself. It may very well be that the time has come for CSR to adapt or die.
References
Bernstein, Asaf, Hughson, Eric, and Marc D. Weidenmier. (2008). ‗Can a Lender of Last Resort
Stabilize Financial Markets? Lessons from the Founding of the Fed.‘ NBER Working Paper.
Kemmerer, E.W. (1910). ‗Seasonal Variations in the New York Money Market.‘ American
Economic Review 1(1):33–49.

4D INTERNATIONAL JOURNAL OF MANAGEMENT AND SCIENCE ISSN 2250-0669
JANUARY-JUNE 2012 http://www.4dinternationaljournal.com VOL 2 / ISSUE 1
Pag
e18
8
Miron, Jeff (1986). ‗The Nominal Interest Rate, Seasonality, and the Founding of the Fed.‘
American Economic Review.
Moen, Jon and Ellis Tallman. (2000). ‗Clearinghouse Membership and Deposit Contraction
during the Panic of 1907.‘ Journal of Economic History 60(1):145–63.
Sprague, O.M. (1910). ‗A History of Financial Crises under the National Banking Period.‘
Washington: U.S. Government Printing Office.
Fishe, R. P. H. and M Wohar (1990). ‗The Adjustment of Expectations to a Change in Regime:
Comment.‘ American Economic Review 80(4): 531–555.

4D INTERNATIONAL JOURNAL OF MANAGEMENT AND SCIENCE ISSN 2250-0669
JANUARY-JUNE 2012 http://www.4dinternationaljournal.com VOL 2 / ISSUE 1
Pag
e18
9
A STUDY ON FOSSIL FUEL CONSUMPTION PATTERN IN BRIC
NATIONS
Alok Kumar Singh
Asst. Prof.
GNIT-Management School
Gr. Noida (U.P.)
Dr. Avijit Dey
Asst. Prof.
GNIT-Management School
Gr. Noida (U.P.)
Abstract:-
Security of energy supply is a top priority of policymakers around the globe, especially in
countries of the economically emerging world. This paper‘s aim is to investigate the link
between the production and consumption pattern of different fossil fuels in four developing
countries and the way policies to secure energy supply are established. The paper looks at the
―BRIC‖ countries (Brazil, Russia, India, and China). These countries are experiencing rapid
economic growth and energy requirements but differ in their modes of governance and the
resources of energy in particular. The four BRIC countries provide a window into the particular
Relationship between governance and energy security policy in developing countries. The paper
throws light on the fossil fuel reserves, their production and consumption in these countries and a
comparison of these factors with that of most developed countries in the world which are called
G6.
Introduction:-
The last decades the world has experienced significant transformations in geopolitical and
economic terms, and in the location, organization and distribution of production. For several
reasons, large developing countries/emerging economies such as Brazil, Russian Federation (and
former USSR), India, China have acquired a most important role in the world economy as
producers of goods and services, receivers of capital, or potential consumer markets given their
common characteristics of having a big part of their large population still not integrated in the
market economy. Although BRIC countries followed different trajectories in their integration
into the globalizing learning economy all of them have acquired a more important role in the

4D INTERNATIONAL JOURNAL OF MANAGEMENT AND SCIENCE ISSN 2250-0669
JANUARY-JUNE 2012 http://www.4dinternationaljournal.com VOL 2 / ISSUE 1
Pag
e19
0
world system The five countries went through major institutional transitions and changes in their
economic structure in the recent history. Around the middle of the twentieth century China
witnessed its communist revolution, India became independent, apartheid became
institutionalized in South Africa, Brazil went into a period of 21 years of military regime, while
the former Soviet Union came out of the second world war as a major rival to the United States.
Later on, in all these countries inward orientated and more or less centrally planned development
strategies from the 1950s to the 1970s were replaced by gradual integration in the global
economy in the 1980s and 1990s.
Financial globalization and the diffusion of the new technological paradigm based on the
Information and Communication Technologies (ICTs) led to significant transformation in the
world economy. The world economy became even more integrated and the technological
revolution spread rapidly but unevenly among different countries and world regions. One
consequence of these changes is that competitiveness increasingly has become related to
innovation, learning capacity and knowledge. Different countries have found different ways to
adapt to this new paradigm. The historical record of successful developed countries is not easily
replicable in LDC in the current era. The barriers to access to economically useful knowledge
have become more difficult to overcome. As verified in the case of the five countries referred to
here there are fundamental issues (like those related to social and ecological development),
which have to be addressed in order to transform into sustainable learning and knowledge
societies.
Review of Literature
There is no doubt about the increasing economic and geopolitical importance of these five Less
Developed Countries (LDC) on the international scene. At a first glance one can refer to their big
dimensions - territorial extension and/or the size of the population that represents an enormous
potential consumer market (see appendix A for the empirical evidence). Although South Africa
does not share all these characteristics, it plays an important strategic, economic and political
role in the African continent. In the same way, the other countries exert great influence in their
respective home region: Brazil in South America; China and India in East and South Asia; and
the Russian Federation in east Europe and Asia.

4D INTERNATIONAL JOURNAL OF MANAGEMENT AND SCIENCE ISSN 2250-0669
JANUARY-JUNE 2012 http://www.4dinternationaljournal.com VOL 2 / ISSUE 1
Pag
e19
1
A Goldman Sachs report, published in October of 2003, focused the attention on the current and
future global importance of Brazil, Russian Federation, India and China. It also pointed out the
importance of South Africa as the biggest economy on the African continent. The report
suggested that by 2050 the sum of the GDP of the four countries may surpass the sum of the G6
countries‘ GDP. Over the last few years the importance of these countries became even more
evident as China took a lead role in world economic growth. Already at the end of the 1990s
China ranked first in the world in the production of crude steel, coal, cement, fertilizer and TV-
sets and second in the production of electricity, chemical fiber and cotton.
It is also important to note have the growth patterns of the different BRICS-countries are
becoming increasingly interdependent. China is responsible both for the reduction of prices on
labour-intensive manufactured goods that create problems for clothing producers elsewhere and
for the increased commodity demand and for the rise of relative prices of many commodities that
stimulate the demand for raw materials and energy in other parts of the developing world. India‘s
growth, as well, has had a major influence on the price increase for specific commodities,
especially petroleum. For instance, the relative strength achieved in the last 2 years of the
Brazilian trade balance is almost totally explained by the effects of the Chinese demand for such
commodities.
STRENGTHS, WEAKNESSES, OPPORTUNITIES AND THREATS OF BRIC NATIONS
The big scale of the BRICS economies may be seen both as strength and weakness. There are
important scale economies in the production and use of new knowledge and this is especially
true for some science-based sectors where small countries have a handicap. In order to reap these
advantages it is necessary build a strong knowledge infrastructure and to invest in scientific
training.
On the other hand the big size is in all the five BRICs-countries is combined with extremely
uneven regional development The income gap between the most and the least developed regions
in BRICs countries are enormous and still growing. To develop modes of innovation that tackle
this issue and to strengthen the mechanisms of regional redistribution with focus on investment
in human resources is a common challenge for the BRICs countries. It is also necessary to

4D INTERNATIONAL JOURNAL OF MANAGEMENT AND SCIENCE ISSN 2250-0669
JANUARY-JUNE 2012 http://www.4dinternationaljournal.com VOL 2 / ISSUE 1
Pag
e19
2
promote innovation in traditional parts of the economy and to stimulate learning based
innovation in low technology sectors.
Another common characteristic is the affluence of unskilled labour and the corresponding
shortage of capital and knowledge. In all the BRICs countries the total of open and hidden
unemployment among unskilled workers is extremely high while there may be shortages of
skilled labor. Education and training is crucial in enhancing the skills of workers and the efforts
made in these respects are crucial for the future development. The scale and type of foreign
direct investment is very different in the five countries. China has become the most attractive
object of such investment while the inflow to the other four countries is much more limited. The
case of China, and to some degree of India, illustrates the importance of the Diaspora as source
of both capital and skilled labour.
The recent development in China illustrates that it is difficult to combine rapid economic growth
with balanced exploitation of natural resources and with environmental balance. In the long run
this might set limits to growth as the environmental costs become increasingly high. Therefore,
to focus innovative activities on solving environmental problems and shortages of energy and
other natural resources is a common challenge for these countries. Solutions that make use of the
rich pool of unskilled labor might be of special importance.
The big size may give certain strength in negotiations shaping global rules of the game but it also
implies that what is going on in a BRICS-country is under constant scrutiny from the rich
countries and international organizations. Joining forces in such negotiations might help BRIC
countries to create more balanced solutions world-wide. In this context BRIC-countries could act
as representatives of their respective region and take into account also the problems of smaller
developing economies.
Different development paths in BRICS-countries
While many of the problems and challenges are common it is important to stress that innovation
systems in BRICS-countries have followed different paths towards integration in the globalizing
learning economy and that they have responded differently on the opening up of their economies.
Some countries such as Brazil and Russia have liberalized and deregulated their economy

4D INTERNATIONAL JOURNAL OF MANAGEMENT AND SCIENCE ISSN 2250-0669
JANUARY-JUNE 2012 http://www.4dinternationaljournal.com VOL 2 / ISSUE 1
Pag
e19
3
rapidly. As a result indigenous competences have been destroyed and they are currently going
through difficulties with establishing sustained economic growth.
Others, such as China and India, have retained control of important parts of their economic
policies while gradually integrating into the world economy and have been more successful in
retaining and building competences as the economy has been made more open to foreign trade.
Differences in the policy regimes are important when it comes to explain differences in
economic and innovation performance. But it is also important to understand the structural and
institutional characteristics of innovation systems that result in different performance in terms of
creation and destruction when they are exposed to similar forms of transformation pressure.
Energy Economic State of Supply Security
Primary energy supply security is what is commonly referred to as the ability of the domestic
supply side to meet current and short to medium-run expected energy demand. In case the
domestic energy production does not equal the required amount of energy demanded by
domestic consumers such as the industry and private households, international trade balances the
difference. In the reverse case, in countries where energy supply is greater than energy demand,
energy resources can be exported to foreign customers or left in reserves for future consumption.
Importing energy resources increases the risk of domestic energy supply security because the
availability of international trade partners inherently uncertainty. To illustrate this point, the
power politics played on the back of oil price shocks by the Organization of the Petroleum
Exporting Countries (OPEC) can negatively impact energy-intensive industries.
Electricity delivery and energy reliability is another piece of the energy security puzzle. In order
to guarantee the delivery of primary energy such as oil and gas to power stations, pipelines need
to be built and maintained. Additionally, electricity requires investment in network infrastructure
since electric grids transmit power from power plants to end-users. Rural development relies on
investment in energy and electricity infrastructure. Private operators, quasi-private operators and
state-owned operators secure the transmission and distribution of energy and power to both
urban and rural areas. However, with all physical resource infrastructure systems, it is pivotal to
avoid bottle-necks, leakage in transit, or drops in quality (e.g. voltage) in order to maintain
network security.

4D INTERNATIONAL JOURNAL OF MANAGEMENT AND SCIENCE ISSN 2250-0669
JANUARY-JUNE 2012 http://www.4dinternationaljournal.com VOL 2 / ISSUE 1
Pag
e19
4
Domestically Available Resources
In this section, we examine the current energy mixes of the BRIC countries, the role of
international energy trade, and the resource bases of both fossil fuels and renewable energy. The
BRIC countries face a wide range of challenges with respect to managing and securing their
access to energy resources. And in the evolution of their energy systems, each BRIC country‘s
effort to secure its supply of energy has been greatly shaped by its natural resource endowments.
By primary energy consumption, the BRIC countries are among the largest nine in the world and
are the four largest among non-OECD members. In 2009, the BRIC countries were among the 6
largest consumers of oil, the 23 largest consumers of coal, and the 20 largest consumers of
natural gas. In terms of total fossil energy reserves, on an energy content basis, the BRIC
countries are among the top 20.
The BRIC countries‘ coal reserves are among the largest 11, their oil reserves are among the 21
largest, and their natural gas reserves are among the 35 largest. Figure 1 shows the reserves by
type of fossil resource for the countries with the largest fossil resources in the world. Recent
annual consumption is also shown for comparison.
Fig.1 The reserves by type of fossil resource for the countries with the largest fossil resources in the world

4D INTERNATIONAL JOURNAL OF MANAGEMENT AND SCIENCE ISSN 2250-0669
JANUARY-JUNE 2012 http://www.4dinternationaljournal.com VOL 2 / ISSUE 1
Pag
e19
5
China
Energy from coal dominates China‘s energy consumption mix. In 2008, 70% of Chinese energy
consumption came from coal while oil supplied an additional 20%. Hydroelectric generation
supplied 6% of Chinese energy consumption and natural gas, nuclear and renewable contributed
less than 3% each to total energy consumption.
Chinese coal reserves were the third-largest in the world at 126 billion short tons in 2005, behind
the United States (264 billion short tons) and Russia (173 billion short tons). At 3.2 billion tons,
China produced 44% of the world‘s coal in 2009, making it the world‘s largest producer of coal,
3 times larger than the second-largest producer, the United States. At its 2009 coal production
rate, China‘s coal reserves will deplete in 39 years. Of the 10 largest coal producers in 2009, only
Indonesia would deplete its reserves faster than China if production rates stayed constant. In all
likelihood substantial new resources will be added to Chinese coal reserves, while coal imports
from Indonesia, Australia, Vietnam, Mongolia and Russia continue to grow. Since 2002, China
has significantly increased its coal imports: from 2002 to 2008, Chinese coal imports grew over
400%. Nevertheless, coal imports still made up only 3.8% of total coal consumption in China in
2009.
Since 1993, China has been a net importer of oil as oil consumption has grown faster than
domestic oil production. China‘s net oil import rate was 3.5 million barrels/day in 2008 – 50% of
its total consumption – making it the world‘s 3rd largest net importer of oil behind the United
States (9.8 million barrels/day) and Japan (4.0 million barrels/day). The largest oil exporters to
China are Saudi Arabia (725 thousand barrels/day), Angola (596 thousand barrels/day), and Iran
(425 thousand barrels/day). The depletion of older onshore wells in China is leading to growing
attention to offshore oil resources, some of which are in disputed ocean territories, as well as
onshore resources deeper in western China. Natural gas does not currently play a significant role
in the Chinese economy, but the lower emission profile of natural gas power plants relative to
coal-fired plants, may lead to an expansion of natural gas in China in the near future. Gas
pipelines from Eastern Siberia into China are likely to move forward as China seeks to
simultaneously increase development of domestic, including offshore, natural gas resources.
China doubled its wind capacity in 2009 to nearly 26 GW, giving it the second largest installed
capacity in the world behind the United States. While wind currently only supplies less than half
of one percent of China‘s electricity, the wind on-shore resources available in China are enough

4D INTERNATIONAL JOURNAL OF MANAGEMENT AND SCIENCE ISSN 2250-0669
JANUARY-JUNE 2012 http://www.4dinternationaljournal.com VOL 2 / ISSUE 1
Pag
e19
6
to generate 24.7 PWh, greater than seven times current Chinese electricity consumption. Relative
to prevailing contract prices, the on-shore wind resource in China could still provide more than
twice current electricity consumption. China also has a substantial offshore wind resource base,
particularly in South China in the Straight of Taiwan. China‘s best solar resources are
concentrated in the west, near China‘s borders with India and Nepal.
India
Like China, India uses coal to provide a majority of its energy. 53% of Indian energy demand
was met with coal in 2006 while oil provided an additional 31%. Natural gas, hydroelectric and a
small share of nuclear made up the balance. In 2007, 8.7% (net of exports) of Indian coal
consumption was imported. India‘s domestic oil production has been nearly constant since 1990
while oil consumption has grown nearly three-fold in the same time period. By 2008, India was
the 5th largest consumer of oil at 2.8 million barrels/day and the 4th largest net importer of oil
with over 2.5 million barrels/day in net imports. The largest oil importers to India are Saudi
Arabia (644 thousand barrels/day), Iran (476 thousand barrels/day), Nigeria (308 thousand
barrels/day), and Iraq (280 thousand barrels/ day) As in China, natural gas demand is expected to
grow in India as the detrimental effects of pollution from coal power plants increase and as major
domestic gas plays go into production. When it is complete, the 3,500 MWpower plant at Dadri,
Uttar- Pradesh will be the largest natural gas-fired plant in the world. Since 2004, India has been
a net importer of natural gas, utilizing significant quantities of liquefied natural gas (254 Bcf in
2006) while also seeking to expand its pipeline connections to other countries, such as Iran
Brazil
Unlike China and India, Brazil does not rely heavily on coal for electricity generation. Instead,
85% of Brazil‘s electricity comes from hydroelectric dams. Natural gas, coal, nuclear, and
renewable make up the balance. For liquid fuels, Brazil consumed 2.5 million barrels/day of
petroleum in 2008; however, all gasoline sold in Brazil is blended with ethanol. In 2008, Brazil
produced 454 thousand boe/day of ethanol and 20 thousand boe/day of biodiesel. Currently,
Brazil consumes more oil than it produces. However, because of significant bio fuel production,
combined with large offshore petroleum resource discoveries in the past three years, Brazilian oil
production is expected to continue growing faster than its oil consumption. Brazil has the
smallest proved reserves of fossil energy among the BRIC countries. However, the pre-salt fields
off near the coast of Rio de Janeiro, discovered in 2007, could dramatically shift Brazil‘s oil

4D INTERNATIONAL JOURNAL OF MANAGEMENT AND SCIENCE ISSN 2250-0669
JANUARY-JUNE 2012 http://www.4dinternationaljournal.com VOL 2 / ISSUE 1
Pag
e19
7
reserve status. While the Brazilian pre-salt fields are still being explored, by some estimates, the
size of this resource could put Brazilian reserves on par with the countries with the five largest
oil reserves in the World.
Russia
Russia has the largest fossil energy reserves of the BRIC countries on an energy content basis
and the second largest fossil energy reserves in the world behind the United States. Russia‘s
economy is strongly dependent on energy exports. Over one-fifth of the country‘s GDP is
derived from its oil and gas industry. At 183 billion cubic meters, Russia is the largest natural
gas exporter in the world, 85% larger than the world‘s second largest gas exporter, Norway. 96%
of Russian gas exports are transported via pipeline to Europe. Almost all of the remaining 4% of
Russian gas exports are exported as liquefied natural gas (LNG) to Asia (BP Stat Review).
Russia‘s natural gas reserves are the world‘s largest: nearly 70% larger than Iran‘s, the second
largest. 27% of all proven gas reserves in the world and 53% of all non- OPEC gas reserves are
in Russia. At 2009 production rates, assuming no reserve increases, Russian gas reserves would
deplete in 84 years, longer than the global average of 63 years and the North American average
of just 11 years. Domestically, natural gas provided 55% of Russia‘s energy consumption in
2005. Russia‘s coal reserves are the world‘s second largest, yet only 16% of Russia‘s domestic
energy consumption was derived from coal in 2005. Russia‘s oil reserves are the world‘s
eighth largest.
Energy efficiency in BRIC countries
BRIC countries, now long being touted as the most promising of the emerging economies,
obviously have many challenges before turning these hopes into reality. The priorities for
overcoming the various hurdles may vary across these economies. But one of the most
formidable challenges, that has to be tackled, is the improvement in energy efficiency.

4D INTERNATIONAL JOURNAL OF MANAGEMENT AND SCIENCE ISSN 2250-0669
JANUARY-JUNE 2012 http://www.4dinternationaljournal.com VOL 2 / ISSUE 1
Pag
e19
8
Source:Financial Express, June 4 2011
The BRIC countries‘ record on energy efficiency shows that there is a large gap that has to be
bridged if these countries have to improve competencies and catch up with the developed
countries. But what is more striking is the considerable disparity in the energy intensity among
the different BRIC countries.
Figures shows that Brazil, which consumed 12,561 Btu of energy for every dollar of GDP output
at market exchange rates, was the most efficient energy user. In fact the energy intensity levels
obtained is only marginally higher than the global energy intensity of 12,385 Btu for every unit
of dollar GDP. Brazil‘s record on the energy front, however, is still lagging on some counts.
Even some of the other South American countries like Argentina have a better record in energy
consumption. But it is still credible that the energy intensity in Brazil is almost a third lower than
that of Venezuela, the largest source of oil in South America.
The only disconcerting note in Brazil‘s record of energy use is that the annual average of 0.6%
increase in energy intensity since the nineties has been almost six times that of the Latin and
Central American region as a whole. But it can also be argued that Brazil has been fairly
successful in reducing energy intensity of output in the current decade.
Second on the list of the most energy efficient countries among the BRIC nations is India. The
24,616 Btu of energy used to produce each dollar unit of GDP in India was more than a third

4D INTERNATIONAL JOURNAL OF MANAGEMENT AND SCIENCE ISSN 2250-0669
JANUARY-JUNE 2012 http://www.4dinternationaljournal.com VOL 2 / ISSUE 1
Pag
e19
9
higher than in the Asia Pacific region as a whole. The only consolation is that neighboring
Pakistan has an equally unimpressive record, though it is still a few units lower. The potential for
gains are significantly large given that an economic power like Japan produces one dollar GDP
using just 4,467 Btu of energy, which is just about a fifth that of India.
Malaysia and Indonesia, which have equally big or even larger manufacturing sectors, also
manage to use significantly lower amounts of energy. Among smaller countries only Vietnam
has a worse record than India in this region. And the energy intensity in South Korea, which
caters to global markets is a third lower than that of India.
However, what makes India‘s case somewhat outstanding to an extent is its relatively greater
success in boosting energy efficiency both among BRIC countries and also those of that in the
Asia Pacific region. This is significant though the numbers show that the gains posted are of a
more recent vintage. In the nineties, when the energy intensity went up by an annual average rate
of 0.5% in the Asia Pacific region, India restrained its use by holding down the increase in
energy intensity to just 0.1% per annum. Though this record pales before other countries in the
region like Malaysia and Singapore, which reduced the energy intensity of production, it was
significantly much better than that of most other Asian countries.
What is more laudable is India‘s record in the first five years of the current decade. Numbers till
the year 2009 show that India was able to reduce the energy intensity of output by an annual
average rate of 2.4%, which was indeed significant given that energy intensity in the Asia Pacific
region as a whole was stagnant during the period. But it should be pointed out that India was not
notable on this front. In fact, the record shows that other countries like Indonesia and Philippines
did a notch better by reducing energy intensity by as much as around 4% annually during the
period.
China has a surprisingly mixed record on the energy front. The energy intensity of output in
China has been the worst historically, both in the nineties and also in the current decade. Though
one can attribute the high energy intensity to the exceptionally large share of the manufacturing
sector in the Chinese economy, it is also likely that the bloated estimates of the GDP make the

4D INTERNATIONAL JOURNAL OF MANAGEMENT AND SCIENCE ISSN 2250-0669
JANUARY-JUNE 2012 http://www.4dinternationaljournal.com VOL 2 / ISSUE 1
Pag
e20
0
energy intensity figures equally larger. But what is more surprising is its mixed record in making
efficiency gains.
Numbers show that China made vast gains in reducing energy intensity of output in the nineties.
The 6.5% annual average reduction in energy intensity of the Chinese economy during the period
was the most exemplary achievements made in recent times. But what is more surprising was the
2.6% annual growth of energy intensity in the Chinese economy during the current decade. One
should note that the bloated use of energy happened even as other competing nations like Japan,
India, South Korea and Philippines were cutting down on energy intensity. It is a big question of
how Chinese products could gain in the international markets even as its energy intensity rose
much faster when global energy prices were on a roll.
The most lacklustre record among BRIC countries on the energy front is that of Russia, which
guzzles energy much faster than its reputed consumption of much stronger spirits. The most
inefficient among the major economies across the globe, Russia used up as much as 1,09,929 Btu
of energy for each dollar output of GDP at market exchange rates in the early nineties, which
was almost 10 times the global average. Although Russia has cut down on the relative
consumption of energy by reducing the energy intensity at an annual rate of 2.1% since the
nineties, and by an accelerated pace of 4.4% in the current decade, it still tops the list of the most
energy inefficient economies.
COMPARISON OF BRIC COUNTRIES WITH G6 NATIONS ON NATURAL ENERGY
RESOURCES:-
OIL:-
Reserves: - The structure of the global oil industry has been undergoing drastic change for the
last several decades. The prime driver of this change has been more production moving to
countries dominated by national oil companies that continue to hold the majority share of proved
reserves. When comparison are made between BRICs and G6, it was found that Russia and the
US lead their respective groups in proved, conventional oil reserves but the one country showing
the most promise is Brazil.

4D INTERNATIONAL JOURNAL OF MANAGEMENT AND SCIENCE ISSN 2250-0669
JANUARY-JUNE 2012 http://www.4dinternationaljournal.com VOL 2 / ISSUE 1
Pag
e20
1
Of the four BRIC nations, Russia holds the most proved conventional oil reserves at slight ly over
74 billion barrels which although the largest in the group, pales in comparison to Saudi Arabia,
Venezuela, Iran, Iraq and Kuwait. India and China have measurable reserves but their reserve-to-
production ratio stands at 21 years and 11 years respectively at current usage rates.
Source: HIS Global Insight Nov 1, 2010
Fig.2 Proved Oil Reserves in BRIC Nations & G6 Countries
Production:- While estimates vary from 75 to 90 percent of the world‘s oil reseves owned by
national oil companies, it comes as no surprise that oil production has continued to move to
where the reserves are located. Based on their respective categories, Russia leads both G6 and
BRIC nations with 10 million barrels a day(mb/d) of oil production, while the US comes in a
close third at almost 7.2 mb/d (just behind Saudi Arabia).

4D INTERNATIONAL JOURNAL OF MANAGEMENT AND SCIENCE ISSN 2250-0669
JANUARY-JUNE 2012 http://www.4dinternationaljournal.com VOL 2 / ISSUE 1
Pag
e20
2
Source: HIS Global Insight Nov 1,2010
Fig. 3 Oil Production in BRIC Nations & G6 Countries
Consumption:- Oil consumption has traditionally been strongest in the west, led by the US at
18.7 mb/d, but the BRIC nations are slowly closing the gap, led by China (8.7mb.d) and India
(3.1 mb/d). Declining consumption in the west is due to lower GDP economic growth and
policies to curb the use of transportation fuels. Alternatively, oil consumption growth in China &
India is due to robust economic growth in both the countries, leading to increase in middle class
with disposable income. Although Chinese GDP is forecasted to slow down somewhat in next 5
years. The key distinction is that BRIC nations are currently experiencing their own industrial
era requiring more energy consumption.

4D INTERNATIONAL JOURNAL OF MANAGEMENT AND SCIENCE ISSN 2250-0669
JANUARY-JUNE 2012 http://www.4dinternationaljournal.com VOL 2 / ISSUE 1
Pag
e20
3
Source: HIS Global Insight Nov 1,2010
Fig. 4 Oil Consumption in BRIC Nations & G6 Countries
Natural Gas:- Although unconventional sources of natural gas gained widespread media
attention during 2010, traditional sources of natural gas continued to be an important part of the
energy mix for electric utilities. Increased use of gas for power plants is seen by many
government policy makers and utilizes alike as a cleaner fuel than coal for power generation and
a way to reduce carbon emissions.
Reserves:- The reserves category is dominated by one nation. Russia. Rusia‘s traditionally large
natural gas reserves easily dominate both the G6 and other BRIC nations over the last several
years, intense political and media attention has been devoted to the balance of market power
between Russia- mainly through Gazprom as a major supplier and the European Union as the
major buyer.
With the profusion of unconventional supplies, US now has 2,247 trillion cubic feel(tcf) of
proved gas reserves, enough to last roughly 18 years at 2007 demand levels according to a US
study from the American Clean Skies Foundation. These new found sources place the US
slightly ahead of Russia in terms of Gas production.
Source: HIS Global Insight Nov 1,2010

4D INTERNATIONAL JOURNAL OF MANAGEMENT AND SCIENCE ISSN 2250-0669
JANUARY-JUNE 2012 http://www.4dinternationaljournal.com VOL 2 / ISSUE 1
Pag
e20
4
Fig.5 Natural Gas Proved Reserves in BRIC Nations & G6 Countries
Production:- Production of natural gas continues to be driven by two countries , US and Russia.
Both countries are mature producers in that both have extensive gas pipeline network and large
consuming population. Within the next 5 years, the US will increase its gas production based ln
unconventional resources and could become a net gas exporter.
Source: HIS Global Insight Nov 1, 2010
Fig. 6 Natural Gas Production in BRIC Nations & G6 Countries
Consumption:- Based on recent additions in supply from unconventional sources, natural gas
consumption is being driven by the US and to lesser extent by the other G6 nations. However as
BRIC economies shake off the effects of economic crisis, gas consumption is likely to increase
led by China as its gas demand grows the fastest at an average rate of 6% a year according to
International Energy Agency. Russian gas demand however is still expected to dominate the
BRIC cluster of countries, especially as gas consumption in Russia will remain largely
subsidized.

4D INTERNATIONAL JOURNAL OF MANAGEMENT AND SCIENCE ISSN 2250-0669
JANUARY-JUNE 2012 http://www.4dinternationaljournal.com VOL 2 / ISSUE 1
Pag
e20
5
Source: HIS Global Insight Nov 1, 2010
Fig.7 Natural Gas Consumption in BRIC Nations & G6 Countries
Coal:-
Reserves:- Coal represents a major part of many countries‘ energy mix mainly to electric
utilities. Coal reserves are led by the US which is sometimes referred to as the ―Saudi Arabia of
Coal‖. Russia and China both have larger coal reserve while the remained of G6 and BRIC
nations possess small reserves. The continued use of coal in G6 countries is likely to be
constrained by nothing more than carbon emissions.
The US holds the largest coal reserves in the world. But the introduction of carbon pricing
mechanism in US, whether through a carbon tax or a European style cap-and-trade system, may
restrict the economic benefit of using coal as a fuel for power generation, at least in the existing,
coal fired power plants in US.

4D INTERNATIONAL JOURNAL OF MANAGEMENT AND SCIENCE ISSN 2250-0669
JANUARY-JUNE 2012 http://www.4dinternationaljournal.com VOL 2 / ISSUE 1
Pag
e20
6
Source: HIS Global Insight Nov 1,2010
Fig. 8 Coal Proved Reserves in BRIC Nations & G6 Countries
Source: HIS Global Insight Nov 1, 2010
Fig 9 Coal Production in BRIC Nations & G6 Countries
Conclusion:-
BRIC countries are increasingly becoming the major hubs of hydrocarbon reserves, production
and consumption. They will further attract large amount of capital for the development and
financing of new supply infrastructure.

4D INTERNATIONAL JOURNAL OF MANAGEMENT AND SCIENCE ISSN 2250-0669
JANUARY-JUNE 2012 http://www.4dinternationaljournal.com VOL 2 / ISSUE 1
Pag
e20
7
Over the next decade, it is likely that Brazil will become a major oil producer and exporter based
on its new found reserves. Russia in addition to being the largest gas reserve and production
globally, will continue to be the dominant oil producer as its oil companies locate and exploit
new reserves in order to thwart the decline of currently producing fields. As Chinese NOCs
remains on the hunt for new reserves, they will add to an already increasing amount of oil
production. Oil consumption and refining capacity will continue to head to Asia as emerging
economies add to a growing middle class consumer base. New natural gas finds in the form of
shale gas will transform the US economy energy industry firsas a gas exporter and then as a new
transportation fuel. Coal use will likely remain as the dominant fuel of choice for many emerging
economies but renewable energy and natural gas will increasingly gain on coal use.
As major importers of fossil fuels both China & India will be wary about their energy bills. As
major producer and exporters, Russia and potentially Brazil will want to ensure that international
energy commodities prices support the development of their resources.
The notion of BRIC countries as a homogenous group of leading energy countries appears to fail
the test – for now.
References:-
Oil & Gas Financial Journal, May 2010. Global Expansion Plans Drive Chinese NOCs.
Oil & Gas Financial Journal. PFC Energy, 2010. PFC Energy 50.
URL http://www.pfcenergy.com/pfc50.aspx
Radler, M., Koottungal, L., 2009. OGJ 100 firms log increases in 2008 earnings, capex.
Oil and Gas Journal 107, 34.
Reuters, Sept., 14th 2009. China says Three Gorges Dam costs USD 37 billion. Reuters.
The World Bank, 2010b. The World Bank Data. Indicators. Tech. rep., The World
Bank Group, Washington, D.C. URL http://data.worldbank.org/indicator
Toman, M. T., Jemelkova, B., 2003. Energy and economic development: An assessment
of the state of knowledge. The Energy Journal 24 (4), 93–112.
Tullock, G., 1987. Autocracy. Kluwer Academic, Dordrecht.
UN Population Division, 2010. World Urbanization Prospects. The 2009 Revision
Population Database. Tech. rep., The United Nations Oganization, New York.

4D INTERNATIONAL JOURNAL OF MANAGEMENT AND SCIENCE ISSN 2250-0669
JANUARY-JUNE 2012 http://www.4dinternationaljournal.com VOL 2 / ISSUE 1
Pag
e20
8
U.S. Energy Information Administration, 2010a. Country Analysis Briefs. Tech. rep.,
U.S. Energy Information Agency, Washington, D.C.
U.S. Energy Information Administration, 2010b. International Energy Outlook 2010.
U.S. Energy Information Administration, Washington, DC.
U.S. Energy Information Administration, 2010c. International Energy Statistics. database,
U.S. Energy Information Agency, Washington, DC.
U.S. Energy Information Administration, 2010d. The Electricity Access Database. Tech.
rep., U.S. Energy Information Agency, Washington, D.C.
Wheatley, J., 2010. Brazil unlikely to be deterred from deepwater riches. The Financial
Times.
Wilson, D., Purushothaman, R., October 2003. DreamingWith BRICs. The Path to 2050.
Global Report 99, Goldman Sachs, New York.
. Wolf, C., 2009. Does Ownership Matter? The Performance and Efficiency of State Oil
vs. Private Oil (1987-2006). Energy Policy 37, 2642–2652.
World Energy Council, 2007. 2007 Survey of Energy Resources. WEC, London.
World Energy Council, 2009. Survey of Energy Resources. Interim Update 2009. WEC,
London.
World Resource Institute, 2009. Earthtrends. Economics and Trade. Tech. rep.,
World Resource Institute, Washington, D.C.